Webpage: www.AbolhasaniLab.com b Department of Chemical Engineering, Massachusetts Institute of Technology, 77 Massachusetts Avenue, Cambridge, MA 02139 c Eastman Chemical Company, USA, 200 S. Wilcox Dr. Kingsport, TN 37660.
Table of Contents
S1. Automated Microfluidic Platform Design S1.1 Details of Experimental System S1.2 Automated Flow Chemistry Setup S1.3 Video of the Single‐Droplet Microreactor
S2. Experimental Methods S2.1 Sample Preparations and Analysis
S2.1.1 Preparation of Substrate and Catalysts S2.1.2 Analytical Methods
S2.2 Reagents and Products Identification/Quantification S2.2.1 Characterization of Reaction Mixture S2.2.2 Alkenes and Aldehydes Calibration
S3. Hydroformylation Results S3.1 Rhodium Catalyzed Hydroformylation of 1‐Octene S3.2 Effect of Various Reaction Conditions on Hydroformylation of 1‐Octene
S4. NMR Characterization of Ligands S4.1 Ligand Preparation for NMR Characterization S4.2 NMR Spectrum of Ligands
S1.1 Details of Experimental System User Interface: The operation of the developed flow chemistry platform is monitored and controlled by LabVIEW 2016 and MATLAB
R2017a. All system parameters (e.g., reaction pressure) are defined on the LabVIEW front panel. Each droplet is defined in a
spreadsheet containing information regarding its composition (e.g., target concentration of each reagent), reaction conditions (e.g.,
intended reaction time) along with various other attributes and flags (e.g., current location of liquid slug).
Droplet Preparation: A Gilson GX‐241 liquid handler prepares the liquid droplet according to its composition defined in an Excel
spreadsheet containing the details of stock solutions (Figure S1). The liquid handler needle first aspirates 20 L N2 gas buffer (via a
Gilson VERITY® 4020 Syringe Pump) to prevent the reagents from contacting the carrier fluid in the liquid handler line (acetonitrile).
Then each reagent is withdrawn from the corresponding vial placed in the liquid handler vial rack in turn with needle rinsing in
between. The withdraw volume is calculated based on its target concentrations and the stock solution concentrations adjusted by
the make‐up solvent (toluene). A total volume of 40 L is oscillated inside the liquid handler needle (5‐10 times) to thoroughly pre‐
mix the catalyst and ligands. After mixing, the droplet is injected into a 11 L sample loop in a six‐port switching valve (Gilson GX
Direct Injection Module). The droplet is then transferred into the main flow system consisting of clear fluorinated ethylene
propylene (FEP) tubing (1/16” O.D., 0.04” I.D., IDEX Health & Sciences) by switching the valve position to inject.
Figure S1. Illustration of a single liquid droplet mixing process by the robotic catalyst/ligand preparation module.
Droplet Motion: After preparation and delivery into the main flow path, the droplet is propelled out of the sample loop and sent
downstream towards the first T‐junction by infusing a nitrogen‐filled stainless‐steel syringe (8 mL syringe) equipped on a PHD Ultra
syringe pump (Harvard Apparatus). The carrier gas syringe is automatically refilled once its volume becomes less than the total
volume required to complete one hydroformylation reaction.
Substrate Injection: A liquid‐level phase sensor (OPB350 Series, TT Electronics) is attached to the FEP tubing before the first T‐
junction (PEEK, IDEX Health & Science). The voltage signal of the optical sensor is read by LabVIEW through a USB‐6001 data
acquisition device (National Instruments). When the liquid droplet within the transparent FEP tubing passes in front of the sensor,
the detected voltage threshold triggers the online injection of the substrate (1‐octene) into the flowing droplet by a computer‐
controlled PHD Ultra syringe pump loaded with a 1 mL glass syringe (SGE Analytical Science).
Reactor Control: After an online substrate injection, the droplet containing the reaction mixture is moved into an oscillatory tube‐
in‐tube reactor. The custom‐designed tube‐in‐tube microreactor (Figure S2) consists of a Teflon AF 2400 tubing (0.04” O.D. and
0.032” I.D., Biogeneral) placed inside a FEP tubing (1/8” O.D. and 1/16” I.D., Altaflo) embedded within a horseshoe‐shaped
aluminum holder. The unique horseshoe design integrates both the inlet and outlet detection points within one single optical path
Supplementary Information
S3
through two parallel FEP tubing connected to the gas and liquid flow lines using Swagelok tube fittings and adapters. An LED light
source (450 nm, Thorlabs) and a Si photodetector (Thorlabs) coupled with single‐mode optical fibers (1000 m fiber core diameter,
Ocean Optics) are attached to the two sides of the optical path at the entrance and exit of the reactor. When the droplet passes
the inlet or outlet, the change in photodetector voltage triggers the flow reversal of the N2 carrier gas by altering the carrier syringe
pump infuse/withdraw direction. In this way, the droplet is kept oscillating inside the reactor for a target residence time. The
temperature of the reactor is monitored and controlled by a thermocouple (K type, Omega), a temperature controller (CN9311,
Omega), and two cartridge heaters (40 W each, Omega) embedded within the aluminum holder. After reaching the desired reaction
time, the droplet is sent outside the reactor for the quench injection (similar to the substrate injection) before continuing
downstream to the in‐line analysis module.
Figure S2. (A) Schematic of the horseshoe‐shaped oscillatory microreactor. (B) The oscillatory motion of the reaction mixture within the tube‐in‐tube microreactor for in‐flow studies of Rh‐catalyzed hydroformylation reactions. (C) Assembled tube‐in‐tube reactor and the Swagelok parts.
Syngas Flow: The composition and flowrate of the reactive gases, CO and H2 (H2: Ultra High Purity 5.0 Grade Hydrogen; CO: 25%
Hydrogen Balance Carbon Monoxide Certified Standard Gas Mixture, Airgas), are controlled by two individually controlled mass
flow controllers (EL‐FLOW®, Bronkhorst) connected to a mixing chamber before flowing into the tube‐in‐tube microreactor (Figure
S3). The total syngas pressure for the hydroformylation reaction within the microreactor is controlled via a computer‐controlled
adjustable back pressure regulator (EL‐PRESS, Bronkhorst). Mass flow controllers and the back pressure regulator are remotely
controlled by LabVIEW.
Supplementary Information
S4
Figure S3. Schematic of the reagent gas flow design.
In‐Line Analysis: After quenching at the second T‐junction, the quenched droplet flows downstream and fills a 5 L stainless steel sample loop in a Rheodyne 6‐port 2‐way switching valve (MXP9900, IDEX). Upon detection of liquid droplet passed through another
phase sensor (OPB350 Series, TT Electronics) before the Rheodyne valve, the position is switched immediately to transfer an aliquot
of the droplet containing the reaction mixture and product to the flow path of an Agilent 1220 Infinity HPLC coupled with 6120
single Quadrupole MS and 1260 Infinity ELSD. A remote trigger is sent to Agilent ChemStation to begin the sequence and method
using a USB‐6525 digital I/O device (National Instruments). The sample is separated by a reverse phase column (Poroshell 120 EC‐
C18, 4.6 x 150 mm, 2.7 µm, Agilent) and quantified by a Diode Array Detector (DAD).
Waste Collection: The remainder of the droplet (reaction mixture) after injection into the HPLC line moves into a pressurized vessel
loaded with a 20‐mL disposable glass vial for waste collection. The custom‐designed stainless steel pressurized reservoir is used to
maintain the pressure of the microreactor (up to 30 bar) and operate under oxygen‐free environment (Figure S4). Four connections
are required for the reservoir: an inlet from the downstream of the Rheodyne valve, an inlet for constant‐pressure N2 supplied from
a gas cylinder (N2: Ultlra High Purity 5.0 Grade Nitrogen, Airgas), an outlet to ventilation and an outlet to drain waste. A Viton O‐
Ring (USA Sealing) is placed between the vessel body and cover to prevent leaking at high pressure. Using this configuration, the
system flow rate and the system pressure are largely decoupled. The relatively large volume of high pressure gas in the reservoir
can pose a safety risk, thus a digital pressure transducer (M3363, Omega) is installed at the outlet to ventilation to monitor the
vessel pressure in real‐time.
Figure S4. Custom‐designed pressurized waste vessel. (A) Perspective view of the SolidWorks design for the pressurized reservoir. (B) Photo of the custom‐machined pressure vessel.
Rinse and Cleaning: An extensive cleaning procedure is performed between each reaction to wash the liquid handler needle and
fully flush the system with a series of wash solution droplets (acetonitrile, Figure 1, syringe 2) to minimize the carryover between
consecutive runs. The rinse slugs are also propelled through the system by N2 carrier gas (Figure 1, syringe 3). The overall cycle time
consists of the rinsing time, sample preparation time, droplet motion time outside of the reactor, reaction time and the HPLC
method run time.
Supplementary Information
S5
S1.2 Automated Flow Chemistry Setup Bench setup: The oscillatory tube‐in‐tube microreactor is integrated into a fully‐automated platform, shown in Figures S5 and S6.
The liquid handler handling catalysts and ligands is placed inside a nitrogen isolation glovebox (Figure S5, 2100 Series, CleaTech)
with a dual N2 purge system and O2 analyzer monitoring the oxygen level within the mini‐glovebox. The CO and H2 cylinders are
integrated with two gas panels (MicroLine™ UHP Manual Gas Panels, SDC) for high pressure gas delivery, stored in a gas cabinet.
The droplet prepared by liquid handler moves to the reactor through tube feedthroughs on the back of both the glovebox and
enclosure. The whole reaction setup is installed within the enclosure as shown in Figure S6. The Rheodyne switching valve sample
loop is connected with the HPLC autosampler injection system. The high‐performance liquid chromatography (HPLC) unit coupled
to an evaporative light scattering detector (ELSD) and mass spectrometry (MS) modules are placed outside the enclosure for in‐line
analysis.
Figure S5. The mini‐glovebox equipped with the computer‐controlled liquid‐handler unit as part of the hydroformylation setup.
Figure S6. Picture of the autonomous flow chemistry platform inside the enclosure with the analysis unit.
Supplementary Information
S6
Setup Enclosure: As the hydroformylation reaction setup involves using toxic and combustible gases of CO and H2, the entire system
is placed in a custom‐designed enclosure for safety operation. The enclosure was designed to have two levels: one middle level
with two small shelves to hold the rinse and substrate injection syringe pumps, one bottom level where to put the tube‐in‐tube
microreactor and all other apparatus. One‐inch gap is left below the bottom doors to allow make‐up air to enter the enclosure
when all the doors were closed. The enclosure is vented through an exhaust port at the top of the enclosure. The enclosure is
constructed out of aluminum framing with Lexan windows (MiniTec Framing Systems). Lexan (clear polycarbonate) is shatter
resistant to ensure safety. Similarly, door hinges and locks can be attached to fasteners in the slots. All the power and
communication cables, and the gas and liquid feedthroughs are integrated with the enclosure through the side and back panels
with liquid‐tight cord grips (McMaster‐Carr).
S1.3 Video of the Single‐Droplet Microreactor A video of the oscillatory motion of an organic liquid droplet (toluene) labeled with sudan red for visualization. Nitrogen pressure:300 psig.
S2. Experimental Methods
S2.1 Sample Preparations and Analysis
S2.1.1 Preparation of Substrate and Catalysts General Procedure for sample preparation: Chemicals were obtained from commercial sources, and were used without further
purification. Rh(acac)(CO)2 was purchased from Strem Chemicals®. Rh(PPh)3(CO)H, anhydrous toluene, 1‐octene, 1,3,5‐
trimethoxybenzene, APhos, RockPhos, and XPhos were purchased from Sigma Aldrich. 1H, 13C, 19F, 31P‐NMR‐spectra were recorded
at 600 (1H), 251 {13C, APT (Attached Proton Test)} and 283 MHz (19F), respectively, on Bruker‐600, and AMX 300 instruments in
CDCl3 solutions. If not specified, chemical shifts (δ) are given in ppm.
Stock Solution A (Catalyst): To an oven‐dried 2.0 mL glass vial equipped with a magnetic stir bar, 1.03 mg of Rh(acac)(CO)2 was
added in a glove box. Anhydrous toluene (1.98 mL) was subsequently added to form a clear solution. The vial was then transferred
to the mini‐glovebox (Figure S5) and loaded into the liquid‐handler vial rack for test.
Stock Solution B (Substrate): 1.6 mL of freshly distilled 1‐octene was charged to an oven‐dried 20 mL glass vial equipped with a
magnetic stir bar inside a glovebox. Anhydrous toluene (8.40 mL) was subsequently added to form a clear solution. The vial was
then transferred inside the setup enclosure (Figure S6) and connected to the substrate injection syringe pump.
Stock Solution C (Ligand): To an oven‐dried 2.0 mL glass vial equipped with a magnetic stir bar, specific amount of the target ligand
(e.g., 10.76 mg of triphenylphosphine) was added in a glove box. Anhydrous toluene (1.98 mL) was subsequently added to form a
clear solution. The vial was then transferred to the mini‐glovebox (Figure S5) and loaded into the liquid‐handler vial rack for test.
Stock Solution D (Quench): To an oven‐dried 20 mL glass vial equipped with a magnetic stir bar, 16.90 mg of 1,3,5‐
trimethoxybenzene and 10 mL of acetonitrile were added in a glove box. The vial was then transferred inside the setup enclosure
(Figure S6) and connected to the quench injection syringe pump.
Supplementary Information
S7
S2.1.2 Analytical Methods
Analysis of reaction mixture: An aliquot (5 L) of the reaction mixture after hydroformylation was injected into an Agilent 1220
Infinity II LC coupled with an 6120 Quadrupole LC/MS and an 1260 Infinity II ELSD module. The HPLC unit was equipped with a diode
array detector (DAD). The alkene and aldehyde isomers were separated using an Agilent InfinityLab Poroshell 120 EC‐C18 column
(4.6 x 150 mm, 2.7 m) with 0.1% formic acid added tetrahydrofuran (THF) and water (50% THF + 50% H2O) as the mobile phase.
Products were identified by comparing retention times of analytes to those of pure standards using LC/MS. All hydroformylation
experiments were repeated 5 times. Substrate conversion and product yields were reported as averages with standard deviation
to illustrate experimental error. These compounds contributed to 94% to 103% of the mass balance (based upon the moles of 1‐
octene concentration in the initial sample).
S2.2 Reagents and Products Identification/Quantification
S2.2.1 Characterization of Reaction Mixtures
Figure S7. HPLC chromatograms of the alkene and aldehyde mixture compared with the corresponding standards at wavelength of 210 nm (blue) and 290 nm (red).
Figure S7 shows the HPLC chromatograms of the reaction mixture at UV wavelengths of 210 nm (blue) and 290 nm (red). The HPLC
chromatogram of the corresponding pure standards (1‐octene and 2‐octene at 210 nm, nonanal and 2‐methyloctanal at 290 nm)
are compared with the mixture peaks. Figure S6 illustrates the separation of both alkene isomers and aldehyde isomers.
Supplementary Information
S8
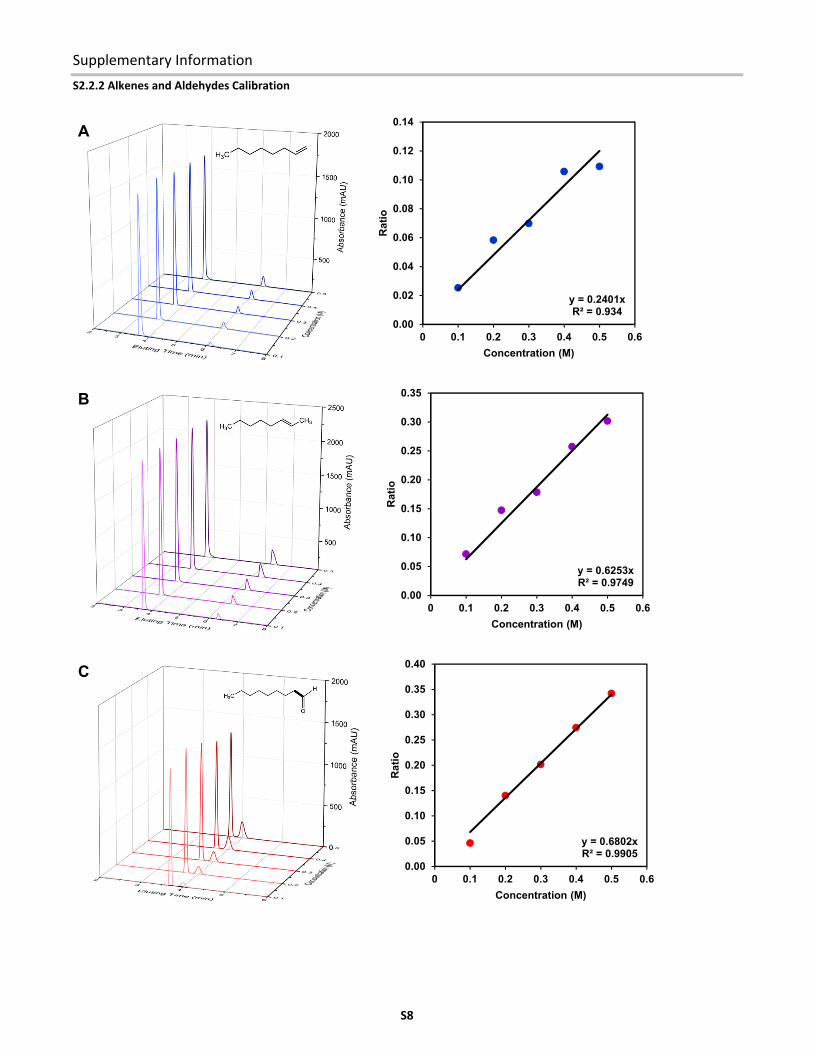
S2.2.2 Alkenes and Aldehydes Calibration
y = 0.2401xR² = 0.934
0.00
0.02
0.04
0.06
0.08
0.10
0.12
0.14
0 0.1 0.2 0.3 0.4 0.5 0.6
Rat
io
Concentration (M)
y = 0.6253xR² = 0.9749
0.00
0.05
0.10
0.15
0.20
0.25
0.30
0.35
0 0.1 0.2 0.3 0.4 0.5 0.6
Rat
io
Concentration (M)
y = 0.6802xR² = 0.9905
0.00
0.05
0.10
0.15
0.20
0.25
0.30
0.35
0.40
0 0.1 0.2 0.3 0.4 0.5 0.6
Rat
io
Concentration (M)
A
C
B
Supplementary Information
S9
Figure S8. HPLC chromatogram evolution and calibration curves for (A) 1‐octene, (B) 2‐octene, (C) nonanal, and (D) 2‐methyloctanal.
Figure S8 shows the HPLC chromatograms of the alkene and aldehyde isomers at different concentrations. The corresponding
calibration curves with 1,3,5‐trimethoxybenzene as the internal standard are shown on the right.
S3. Hydroformylation Results
S3.1 Rhodium Catalyzed Hydroformylation of 1‐Octene
Table S1. Control experiments for hydroformylation of 1‐octene with only Rh catalysts.[a]
[a] General reaction conditions: 1‐octene concentration: 0.5 M, Rh concentration: 5x10‐4 M, syngas pressure (1:1): 20 bar, syngas flow rate: 0.3 ml/min, carrier nitrogen pressure: 20.5 bar, oscillation flow rate: 100 l/min, temperature: 100 °C, and reaction time: 20 mins. [b] Determined by HPLC analysis with 1,3,5‐trimethoxybenzene as an internal standard. [c] 2‐octene yield was calculated as the alkene isomerization. [d] Total aldehyde yield of both linear and branched products. [e] Branched aldehyde to linear aldehyde ratio.
Table S1 summarizes the control experiments for hydroformylation of 1‐octene with no ligands in the reaction system. As shown in
Table 1, hydroformylation reactions with no ligands resulted in very low substrate conversion and aldehyde product formation. The
control experiments verified that hydroformylation was not viable in the absence of ligand.
y = 0.2184xR² = 0.9957
0.00
0.02
0.04
0.06
0.08
0.10
0.12
0 0.1 0.2 0.3 0.4 0.5 0.6
Rat
io
Concentration (M)
D
Supplementary Information
S10
S3.2 Effect of Various Reaction Conditions on Hydroformylation of 1‐Octene
Figure S9. Effect of (A) temperature, (B) ligand to catalyst ratio, (C) syngas ratio (H2/CO), and (D) syngas pressure on the 1‐octene conversion and 2‐octene yield obtained using the autonomous flow chemistry setup.
Figure S9 shows the effects of continuous reaction parameters including the reaction temperature, the ligand to catalyst ratio, the
syngas composition (H2:CO) and pressure on the isomerization of 1‐octene. Systematic studies under the otherwise identical
reaction conditions showed an increase in isomerization with increase in temperature (Figure S9.A), decrease in ligand/catalyst
ratio (Figure S9.B), decrease in the H2:CO ratio (Figure S9.C), and decrease in the syngas pressure (Figure S9.D).
0
10
20
30
40
50
0
20
40
60
80
100
50 70 90 110Y
ield
(%
)
Co
nve
rsio
n (
%)
Temperature (°C)
1-octene2-octene
0
10
20
30
40
50
0
20
40
60
80
100
0 5 10 15
Yie
ld (
%)
Co
nve
rsio
n (
%)
Ligand/Catalyst Ratio
1-octene2-octene
0
10
20
30
40
50
0
20
40
60
80
100
0 2 4
Yie
ld (
%)
Co
nve
rsio
n (
%)
H2/CO Ratio
1-octene2-octene
0
10
20
30
40
50
0
20
40
60
80
100
5 15 25
Yie
ld (
%)
Co
nve
rsio
n (
%)
Pressure (bar)
1-octene2-octene
A
D C
B
Supplementary Information
S11
S4. Characterization of Ligands
P
P
PP
triphenylphosphine
OMe OMe
MeO
tris(2-methoxyphenyl)phosphine
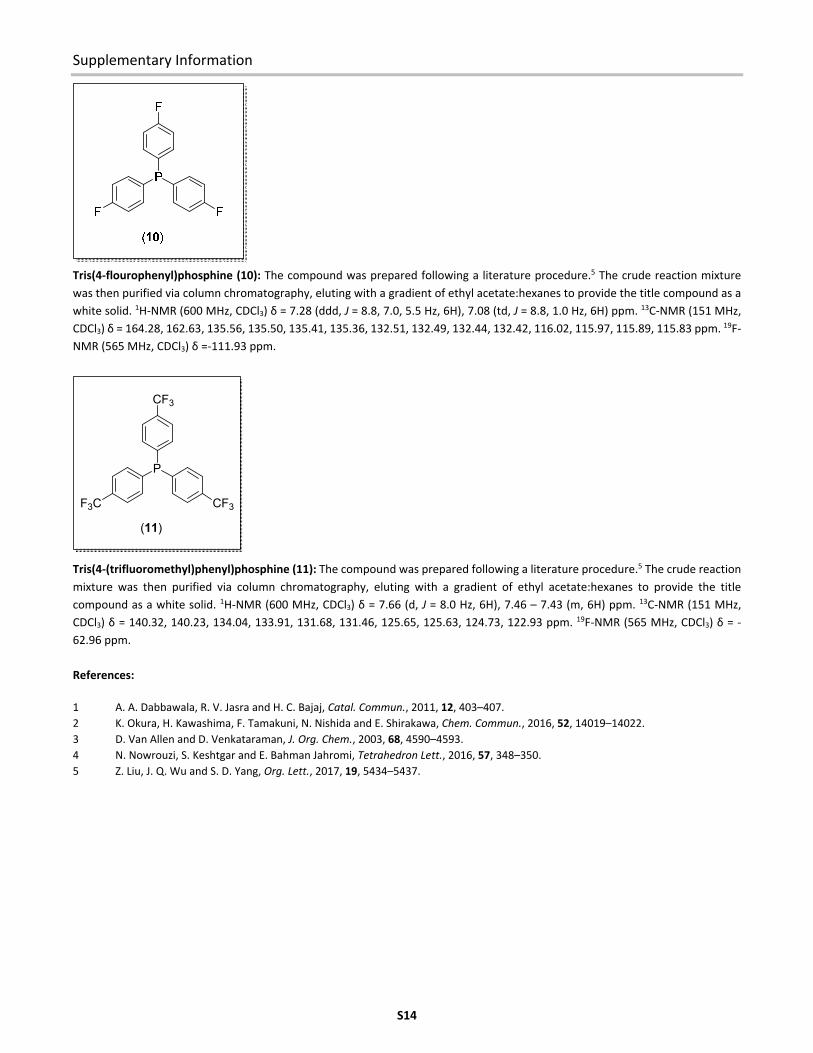
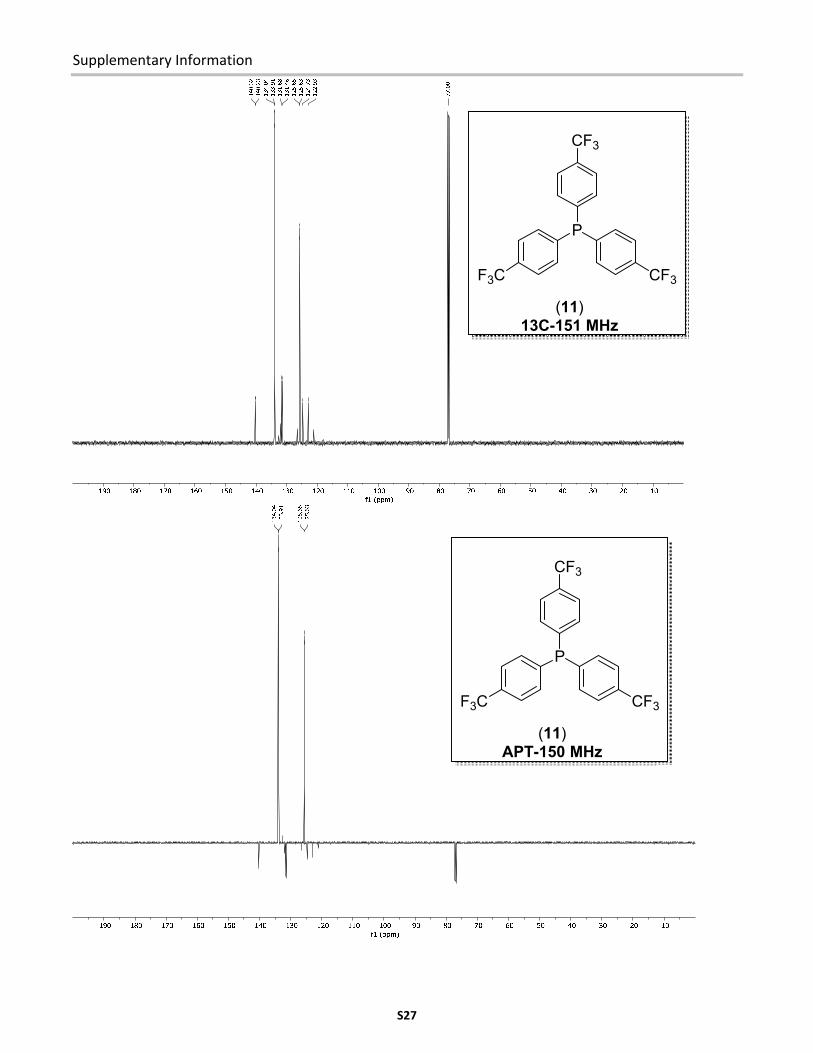
F3C CF3
CF3
tris(4-(trifluoromethyl)phenyl)phosphine
F F
F
tris(4-fluorophenyl)phosphine
P
MeO OMe
OMe
tris(4-methoxyphenyl)phosphine
P
tricyclohexylphosphine
P
Me Me
Me
tri-o-tolylphosphine
P
tribenzylphosphine
P
Me Me
Me
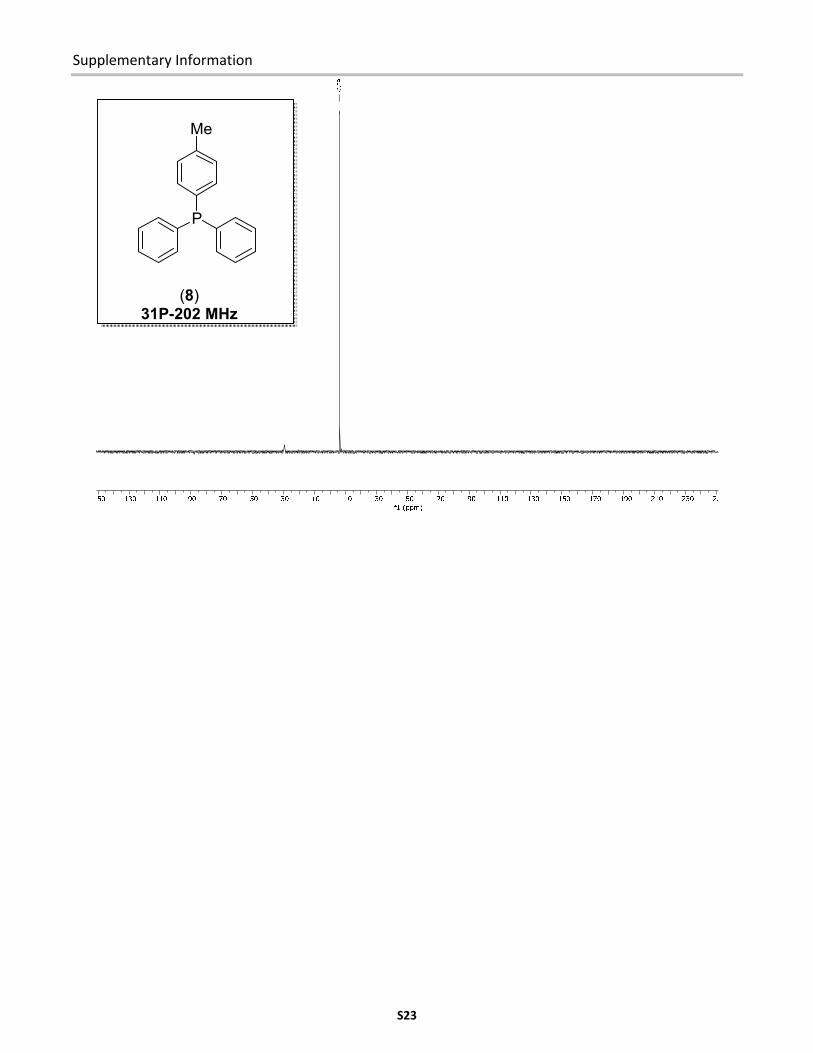
tris-(4-methylphenyl)phosphine
P
Me
diphenyl(4-methylphenyl)phosphine
(1)
(8)
(4) (6)
(11)(10)
(9)(7)
(3)(2)
P
OMe
diphenyl(2-methoxyphenyl)phosphine
(5)
Figure S10. Chemical structures for ligands in Table 1.
Supplementary Information
S12
S4.1 Ligands Preparation for NMR Characterization
Tri‐o‐tolylphosphine (4): The compound was prepared following a literature procedure.1 The crude reaction mixture was then
purified via column chromatography, eluting with a gradient of ethyl acetate:hexanes to provide the title compound as a white