American Journal of Science and Technology 2017; 4(6): 97-104 http://www.aascit.org/journal/ajst ISSN: 2375-3846 Keywords Flow Visualization, Bluff Bodies, Towing Tank, Fluid Mechanics Visualization, von Kármán Vortex Street Received: October 30, 2017 Accepted: November 25, 2017 Published: January 8, 2018 Flow Study over Bluff Bodies Based on Visualization Technique Ángel Antonio Rodríguez-Sevillano 1, * , Miguel Ángel Barcala-Montejano 1 , Rafael Bardera-Mora 2 , Jonás Batuecas-Fuejo 1 1 Universidad Politécnica de Madrid, Department of Aircraft and Space Vehicles, School of Aeronautics and Space Engineering, Madrid, Spain 2 National Institute for Aerospace Technology (INTA), Torrejón de Ardoz, Spain Email address [email protected] (Á. A. Rodríguez-Sevillano), [email protected] (M. Á. Barcala-Montejano), [email protected] (R. Bardera-Mora), [email protected] (J. Batuecas-Fuejo) * Corresponding author Citation Ángel Antonio Rodríguez-Sevillano, Miguel Ángel Barcala-Montejano, Rafael Bardera-Mora, Jonás Batuecas-Fuejo. Flow Study over Bluff Bodies Based on Visualization Technique. American Journal of Science and Technology. Vol. 4, No. 6, 2017, pp. 97-104. Abstract Flow visualization is a very important part of the study of fluid dynamics processes analyzed in many fields of physics and engineering. The present study explores flow visualization experiment technique applied to blunt shaped bluff bodies placed inside towing tank. Vortex shedding in circular cylinders has been studied in depth, being able to visualize the classical von Kármán vortex street. Moreover, the vortex shedding in cylinders of square section has been studied so that the differences between bodies with different section can be compared. A comparison between theoretical and experimental values of vortex shedding frequencies has been obtained; a high correlation with them shows the appropriate experimental procedure. Finally, this paper tries to advocate the use of the towing tank technique as a method to support the theoretical lectures related with some fluid mechanics concepts quite difficult to understand. 1. Introduction Flow visualization can lead, on some occasions, to analyze some global fluid mechanics phenomena that would not have been possible to study with other techniques, in a quite simple understood way. This technique plays a very important role in the development and understanding of fluid dynamics, allowing the observation of phenomena that are not fully understood. A phenomenon that has been object of study since the mid-twentieth century and is still present day is vortex shedding in bluff bodies wake. Knowledge of this process has allowed great advances in many fields of physics and engineering, avoiding catastrophes produced in the past, such as the destruction of the Tacoma Narrows Bridge (Washington State, USA, 1940) or the collapse of the hanging board of a pier at Brighton Beach (Brighton Chain Pier, England, 1837). The most used bluff bodies are those of circular and rectangular cross-section. For this reason, most of the visualization experiments included in of this study have been performed with circular sections and results with square sections have been compared. When visualizing flow around a slender and bluff obstacle, if the Reynolds number is close to the appropriate flow range, it can be observed the formation of a regular pattern
Keywords Flow Visualization, Bluff Bodies, Towing Tank, Fluid Mechanics Visualization, von Kármán Vortex Street Received: October 30, 2017 Accepted: November 25, 2017 Published: January 8, 2018
Flow Study over Bluff Bodies Based on Visualization Technique
Ángel Antonio Rodríguez-Sevillano1, *, Miguel Ángel Barcala-Montejano1, Rafael Bardera-Mora2, Jonás Batuecas-Fuejo1 1Universidad Politécnica de Madrid, Department of Aircraft and Space Vehicles, School of
Aeronautics and Space Engineering, Madrid, Spain 2National Institute for Aerospace Technology (INTA), Torrejón de Ardoz, Spain
Citation Ángel Antonio Rodríguez-Sevillano, Miguel Ángel Barcala-Montejano, Rafael Bardera-Mora, Jonás Batuecas-Fuejo. Flow Study over Bluff Bodies Based on Visualization Technique. American
Journal of Science and Technology. Vol. 4, No. 6, 2017, pp. 97-104.
Abstract Flow visualization is a very important part of the study of fluid dynamics processes analyzed in many fields of physics and engineering. The present study explores flow visualization experiment technique applied to blunt shaped bluff bodies placed inside towing tank. Vortex shedding in circular cylinders has been studied in depth, being able to visualize the classical von Kármán vortex street. Moreover, the vortex shedding in cylinders of square section has been studied so that the differences between bodies with different section can be compared. A comparison between theoretical and experimental values of vortex shedding frequencies has been obtained; a high correlation with them shows the appropriate experimental procedure. Finally, this paper tries to advocate the use of the towing tank technique as a method to support the theoretical lectures related with some fluid mechanics concepts quite difficult to understand.
1. Introduction
Flow visualization can lead, on some occasions, to analyze some global fluid mechanics phenomena that would not have been possible to study with other techniques, in a quite simple understood way. This technique plays a very important role in the development and understanding of fluid dynamics, allowing the observation of phenomena that are not fully understood. A phenomenon that has been object of study since the mid-twentieth century and is still present day is vortex shedding in bluff bodies wake. Knowledge of this process has allowed great advances in many fields of physics and engineering, avoiding catastrophes produced in the past, such as the destruction of the Tacoma Narrows Bridge (Washington State, USA, 1940) or the collapse of the hanging board of a pier at Brighton Beach (Brighton Chain Pier, England, 1837).
The most used bluff bodies are those of circular and rectangular cross-section. For this reason, most of the visualization experiments included in of this study have been
performed with circular sections and results with square sections have been compared. When visualizing flow around a slender and bluff obstacle, if the Reynolds number is
close to the appropriate flow range, it can be observed the formation of a regular pattern
98 Ángel Antonio Rodríguez-Sevillano et al.: Flow Study over Bluff Bodies Based on Visualization Technique
of alternating vortex shedding that extends downstream of the body. If the frequency at which the vortex approach comes close enough to the natural frequency of the structure in the flow, a resonance effect can occur and oscillations can occur in the structure producing its collapse. This phenomenon has a great practical interest, as it can appear in a wide spectrum of terrestrial structures (slender bridges, chimneys, tall buildings, cooling towers), marine structures (oil drilling pipes, submarine periscopes, submerged transmission lines Data), and characteristic elements of the energy industry (towers of wind turbines, cables of electric lines, heat exchangers). [1]
For the particular study of circular cylinders, as for the other blunt bodies, the formation of vortex depends on the Reynolds number (Re) [2]:
�� � �·� ·�
(1)
For Reynolds number values less than 5 (Re <5) the fluid
passes around the cylinder without vortex formation. By increasing the velocity of the stream by obtaining Re between 5 and 40, the fluid separates forming two stationary vortices at the rear of the cylinder in an unstable configuration. For Re values between 40 and 150, there is an alternating evolution of vortex. This vortex shedding is called von Kármán vortex street. It owes its name to the mathematician, aerospace engineer, and physicist, Theodore von Kármán. Above Re = 150 the vortex wake is laminar until Re = 300 where the wake becomes turbulent. For the 300 to 3×10⁵ range of Re, the wake is completely turbulent. In this region the vortex shedding occurs with a well-defined frequency. When the Reynolds number is between 3×10⁵ and 3×10⁶ the wake becomes narrower and disorganized and the vortex shedding occurs non-harmonic. Finally for Re> 3 × 10⁶ the vortex evolution is reestablished in a harmonic but turbulent way. This is shown in Figure 1 from [2], [3].
Figure 1. Regimes of fluid flow across smooth circular cylinder. Adapted from Lienhard 1966) [10].
The frequency (fV) with which occurs the vortex shedding is completely determined by three variables, the free stream velocity (U), a characteristic length L (in our analysis is cylinder’s diameter D) and kinematic viscosity (υ) of the fluid. There is a constant of proportionality between the vortex shedding frequency and the velocity of the incident stream, called the Strouhal number (St) [4]:
� � � ·�
� (2)
The Strouhal number depends on the transverse shape of the body, surface roughness, flow turbulence, structure
movement and Reynolds number. The following illustration shows the relationship between the Strouhal number and the Reynolds number for cylinders of circular cross-section.
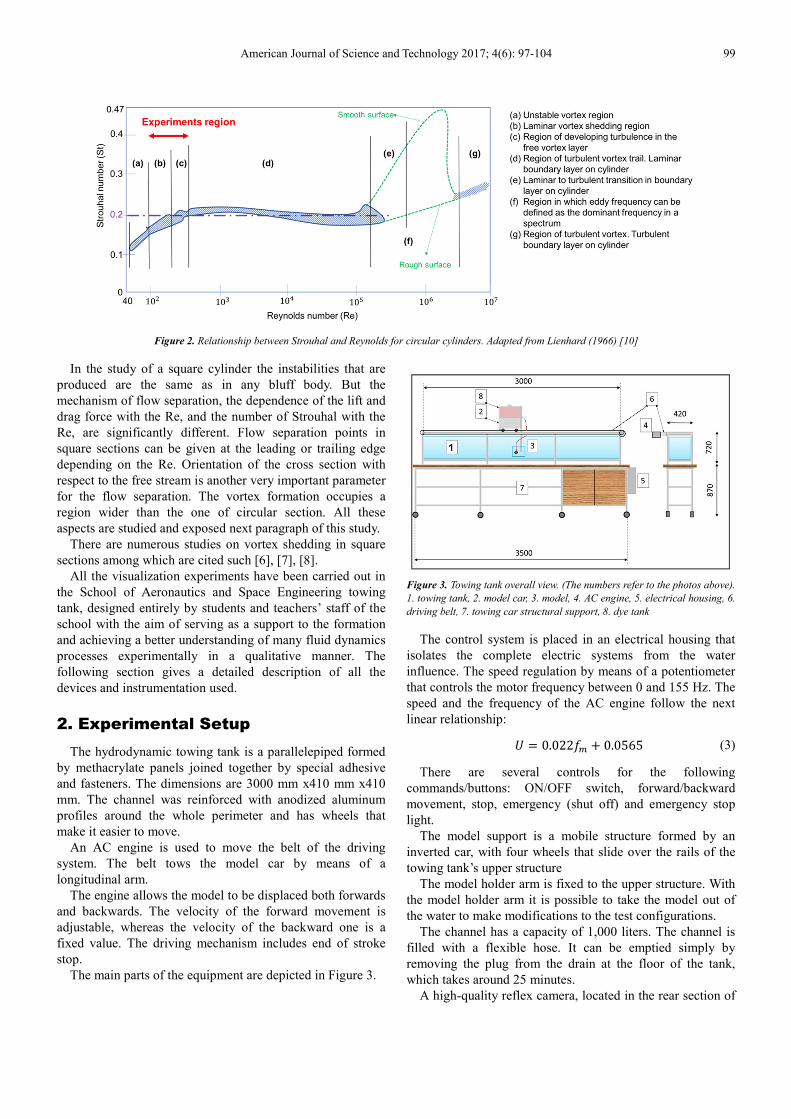
In this study, all the visualization tests were carried out at Reynolds numbers ranging from 100 to 500 in order to visualize the harmonic vortex shedding. As can be seen in Figure 2, in the case of cylinders of circular section, for Reynolds from 50 to 105 the Strouhal number remains practically unchanged and of 0.2, so this value of St has been used for the realization of the calculations in circular sections.
American Journal of Science and Technology 2017; 4(6): 97-104 99
Figure 2. Relationship between Strouhal and Reynolds for circular cylinders. Adapted from Lienhard (1966) [10]
In the study of a square cylinder the instabilities that are produced are the same as in any bluff body. But the mechanism of flow separation, the dependence of the lift and drag force with the Re, and the number of Strouhal with the Re, are significantly different. Flow separation points in square sections can be given at the leading or trailing edge depending on the Re. Orientation of the cross section with respect to the free stream is another very important parameter for the flow separation. The vortex formation occupies a region wider than the one of circular section. All these aspects are studied and exposed next paragraph of this study.
There are numerous studies on vortex shedding in square sections among which are cited such [6], [7], [8].
All the visualization experiments have been carried out in the School of Aeronautics and Space Engineering towing tank, designed entirely by students and teachers’ staff of the school with the aim of serving as a support to the formation and achieving a better understanding of many fluid dynamics processes experimentally in a qualitative manner. The following section gives a detailed description of all the devices and instrumentation used.
2. Experimental Setup
The hydrodynamic towing tank is a parallelepiped formed by methacrylate panels joined together by special adhesive and fasteners. The dimensions are 3000 mm x410 mm x410 mm. The channel was reinforced with anodized aluminum profiles around the whole perimeter and has wheels that make it easier to move.
An AC engine is used to move the belt of the driving system. The belt tows the model car by means of a longitudinal arm.
The engine allows the model to be displaced both forwards and backwards. The velocity of the forward movement is adjustable, whereas the velocity of the backward one is a fixed value. The driving mechanism includes end of stroke stop.
The main parts of the equipment are depicted in Figure 3.
Figure 3. Towing tank overall view. (The numbers refer to the photos above).
1. towing tank, 2. model car, 3. model, 4. AC engine, 5. electrical housing, 6.
driving belt, 7. towing car structural support, 8. dye tank
The control system is placed in an electrical housing that isolates the complete electric systems from the water influence. The speed regulation by means of a potentiometer that controls the motor frequency between 0 and 155 Hz. The speed and the frequency of the AC engine follow the next linear relationship:
� � 0.022�� � 0.0565 (3)
There are several controls for the following commands/buttons: ON/OFF switch, forward/backward movement, stop, emergency (shut off) and emergency stop light.
The model support is a mobile structure formed by an inverted car, with four wheels that slide over the rails of the towing tank’s upper structure
The model holder arm is fixed to the upper structure. With the model holder arm it is possible to take the model out of the water to make modifications to the test configurations.
The channel has a capacity of 1,000 liters. The channel is filled with a flexible hose. It can be emptied simply by removing the plug from the drain at the floor of the tank, which takes around 25 minutes.
A high-quality reflex camera, located in the rear section of
100 Ángel Antonio Rodríguez-Sevillano et al.: Flow Study over Bluff Bodies Based on Visualization Technique
the towing tank, has been used in a fixed position for the photographs to be taken at the same point.
The facility described above is appropriate for the study of rectilinear motion of models with low velocities. It is best used to research stationary one-dimensional motion at a low Reynolds number. The channel has been used in the visualization of certain fluids and their quantitative analysis.
3. Testing Procedure
3.1. Types of Dye Tracers
The experimental procedure is independent of the models; the testing method has a common basis between all the prototypes. It consists of injecting the dye liquid either through little tubes that are located in the required position in the flow or internal injection through one or more holes on the surface of the model.
An important point to be emphasized is the fact that the dye tracer must become a constitutive part of the flow, without discontinuity. The purpose of this is that the tracer liquid follows the flow. Therefore, the optimum dye tracer is the one that fulfils the following conditions [9]: low miscibility with the fluid; equal density as the fluid; a high contrast with the channel’s flow; a kinematic viscosity
similar to the water and easy to clean and to eliminate. Finally, a dye based on a chemical compound of a water
solution of 1% potassium permanganate, methanol for special application in ink mixtures, and the addition of 0.1g of sodium chloride to reduce the dye dispersion was chosen.
If the dye injection is not carried out in the appropriate conditions, no tracer will follow the correct flow pattern. To prevent this from happening, the following aspects need to be kept in mind:
1) The dye injection velocity must not have any perpendicular component to the model’s surface.
2) The injection has to be made in a laminar regime.
3.2. Dye Tracers Supply
For a correct flow pattern is necessary to have a precise flow control. The hydraulic system used is composed by a dye supply tank that has a capacity of 3 liters and provide the required dye for the visualization tests, the next device is an AC electric pump powered by a power supply regulated in 4 V, the AC pump provides the model with a dye constant flow. To regulate the flow, it has been used a precision valve like the used in medical applications, with this valve it is possible to adapt the flow to speed of the model. Figure 4 shows the description above:
Figure 3. Diagram of dye tracers supply system.
3.3. Type of Tested Models
The models are entirely built in methacrylate (acrylic). It has been used two types of models: the circular cylinder and the square cylinder ones. These cylinders are joined to the base using special adhesive with an orientation of 90 degrees from the base. All the models have a 4-mm diameter longitudinal hole that allows the dye flow through the center of the model, where there is another 4-mm hole parallel to the upstream water flow direction. The base of the models is
joined to the arm using 4-mm screws, and the “u” of the base holes allows guide the model in different angles.
The two models have the same characteristic length of 10 mm calculated taking into account the theory set out in [3].
Using this characteristic length and the model speed, the Reynolds number of the tests is between 100 and 500; it will depend on the speed range selected.
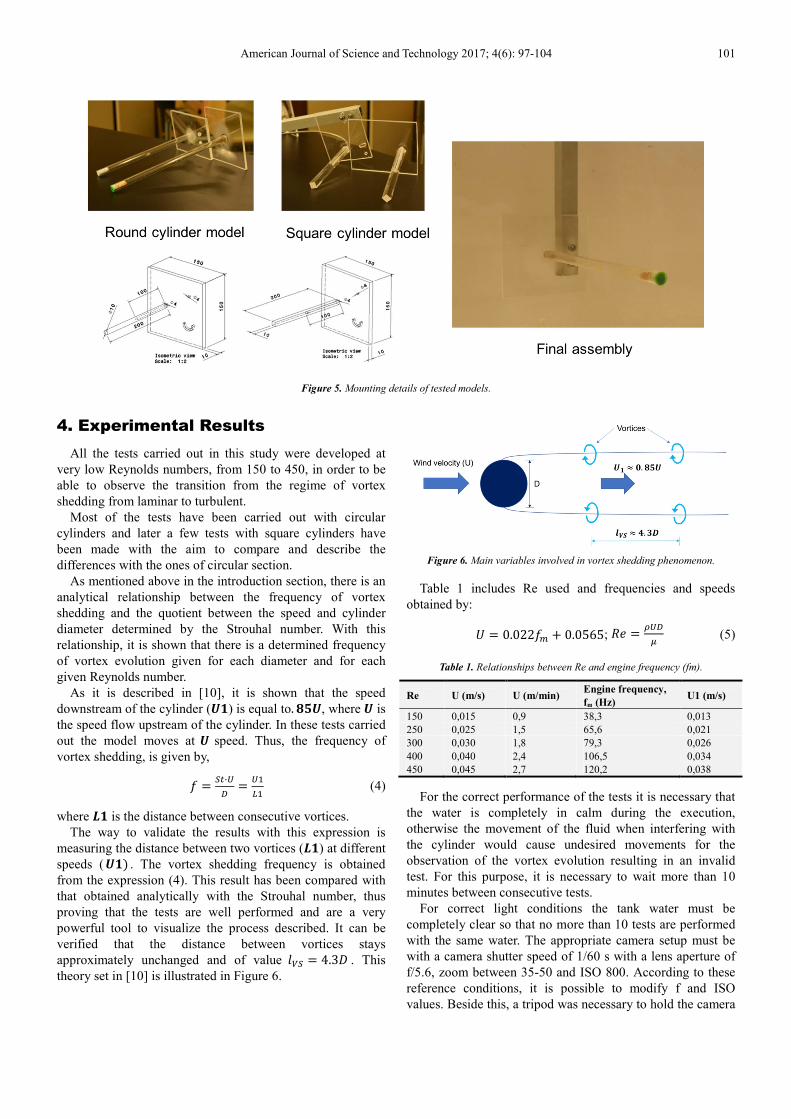
The Figure 5 shows the mounting details of the tested models (pictures and drawings).
American Journal of Science and Technology 2017; 4(6): 97-104 101
Figure 5. Mounting details of tested models.
4. Experimental Results
All the tests carried out in this study were developed at very low Reynolds numbers, from 150 to 450, in order to be able to observe the transition from the regime of vortex shedding from laminar to turbulent.
Most of the tests have been carried out with circular cylinders and later a few tests with square cylinders have been made with the aim to compare and describe the differences with the ones of circular section.
As mentioned above in the introduction section, there is an analytical relationship between the frequency of vortex shedding and the quotient between the speed and cylinder diameter determined by the Strouhal number. With this relationship, it is shown that there is a determined frequency of vortex evolution given for each diameter and for each given Reynolds number.
As it is described in [10], it is shown that the speed downstream of the cylinder (��) is equal to. ���, where � is the speed flow upstream of the cylinder. In these tests carried out the model moves at � speed. Thus, the frequency of vortex shedding, is given by,
� ���·�
��
��
�� (4)
where �� is the distance between consecutive vortices. The way to validate the results with this expression is
measuring the distance between two vortices (��) at different speeds ( �� . The vortex shedding frequency is obtained from the expression (4). This result has been compared with that obtained analytically with the Strouhal number, thus proving that the tests are well performed and are a very powerful tool to visualize the process described. It can be verified that the distance between vortices stays approximately unchanged and of value !"� � 4.3% . This theory set in [10] is illustrated in Figure 6.
Figure 6. Main variables involved in vortex shedding phenomenon.
Table 1 includes Re used and frequencies and speeds obtained by:
� � 0.022�� � 0.0565; �� ����
(5)
Table 1. Relationships between Re and engine frequency (fm).
For the correct performance of the tests it is necessary that the water is completely in calm during the execution, otherwise the movement of the fluid when interfering with the cylinder would cause undesired movements for the observation of the vortex evolution resulting in an invalid test. For this purpose, it is necessary to wait more than 10 minutes between consecutive tests.
For correct light conditions the tank water must be completely clear so that no more than 10 tests are performed with the same water. The appropriate camera setup must be with a camera shutter speed of 1/60 s with a lens aperture of f/5.6, zoom between 35-50 and ISO 800. According to these reference conditions, it is possible to modify f and ISO values. Beside this, a tripod was necessary to hold the camera
102 Ángel Antonio Rodríguez-Sevillano et al.: Flow Study over Bluff Bodies Based on Visualization Technique
steady avoiding vibrations, as described in section Experimental Setup; so that pictures are taken with optimum quality.
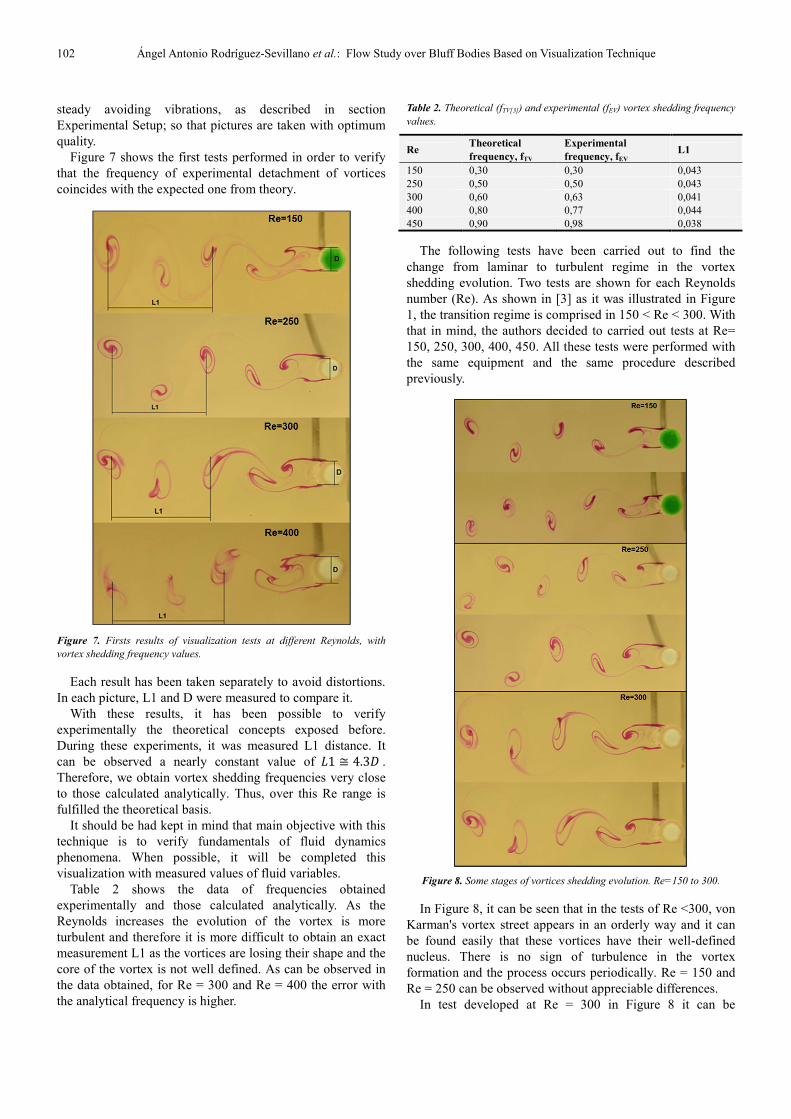
Figure 7 shows the first tests performed in order to verify that the frequency of experimental detachment of vortices coincides with the expected one from theory.
Figure 7. Firsts results of visualization tests at different Reynolds, with
vortex shedding frequency values.
Each result has been taken separately to avoid distortions. In each picture, L1 and D were measured to compare it.
With these results, it has been possible to verify experimentally the theoretical concepts exposed before. During these experiments, it was measured L1 distance. It can be observed a nearly constant value of &1 ( 4.3% . Therefore, we obtain vortex shedding frequencies very close to those calculated analytically. Thus, over this Re range is fulfilled the theoretical basis.
It should be had kept in mind that main objective with this technique is to verify fundamentals of fluid dynamics phenomena. When possible, it will be completed this visualization with measured values of fluid variables.
Table 2 shows the data of frequencies obtained experimentally and those calculated analytically. As the Reynolds increases the evolution of the vortex is more turbulent and therefore it is more difficult to obtain an exact measurement L1 as the vortices are losing their shape and the core of the vortex is not well defined. As can be observed in the data obtained, for Re = 300 and Re = 400 the error with the analytical frequency is higher.
Table 2. Theoretical (fTV[3]) and experimental (fEV) vortex shedding frequency
The following tests have been carried out to find the change from laminar to turbulent regime in the vortex shedding evolution. Two tests are shown for each Reynolds number (Re). As shown in [3] as it was illustrated in Figure 1, the transition regime is comprised in 150 < Re < 300. With that in mind, the authors decided to carried out tests at Re= 150, 250, 300, 400, 450. All these tests were performed with the same equipment and the same procedure described previously.
Figure 8. Some stages of vortices shedding evolution. Re=150 to 300.
In Figure 8, it can be seen that in the tests of Re <300, von Karman's vortex street appears in an orderly way and it can be found easily that these vortices have their well-defined nucleus. There is no sign of turbulence in the vortex formation and the process occurs periodically. Re = 150 and Re = 250 can be observed without appreciable differences.
In test developed at Re = 300 in Figure 8 it can be
American Journal of Science and Technology 2017; 4(6): 97-104 103
observed that the shape of the vortex is no longer well-defined as in the previous cases, in which the vortices were almost a circular profile. A first signal of change into turbulent regime can be seen downstream over surface cylinder. Is this zone, the streamline (also streak line) marked with dye tracers starts to show non-smooth curvature as in the previous cases. We have remarked that in laminar flow, the detachment point of the streamlines around the cylinder is near θ = 120° (angle from velocity direction).
In the last two tests Figure 9 the turbulence can be clearly analyzed. In Re = 400 test it is still possible to differentiate the shape of the vortices, although the flow is already disordered. In test at Re = 450, the vortices downstream are totally disordered, and the vortex street ceases to form; it is quite difficult to distinguish any of them. If any, it could be possible to see the first pair of them near the cylinder surface. In the previous case, it is still possible to see the birth vortices in an alternating (or cyclic) form.
Figure 9. Some stages of vortices shedding evolution. Re=400 to 450.
The last tests carried out in the study are those corresponding to the cylinders of square section.
Figure 10 shows several pictures of flow over a square cylinder corresponding to Re = 150. This Re conditions produces the same mechanism of alternating vortices evolution shown below over circular cylinder, but with some appreciable differences. A wider amplitude of the vortex street can be shown in comparison with the vortex street over circular cylinder. It can also be seen that the streamlines tend to separate at the front corners (upper and lower corners) of the section, but still remain without detached flow onto the square cylinder surface.
Figure 10. Vortices shedding genesis over square cylinder corresponding to
Re=150.
Figure 11 shows four pictures that have been performed at Re = 250, 300, 400, 450 respectively, taking into account the same Re tested with circular cylinders.
It can be observed, in first picture tested at Re = 250, the vortex shedding is still maintained with an alternating pattern. Like other blunt bodies with sharp corners, the separation points are close to front corners of the model.
As the Re increases, there is no alternating pattern, but rather a progression of small parallel vortices from the front corner.
Figure 11. Vortices shedding genesis over square cylinder corresponding to
Re=250, 300, 400, 450.
104 Ángel Antonio Rodríguez-Sevillano et al.: Flow Study over Bluff Bodies Based on Visualization Technique
5. Conclusions
This paper presents the main results obtained in a towing tank. This flow visualization facility has a wide capability of testing bodies and geometries related with several of the main problems in fluid mechanics. It can provide a complementary material giving support to the understanding of complex theoretical phenomena.
Besides this, the paper has described the visualization of von Kármán vortex street and the differences between blunt bodies (rounded and sharpened corners).
Studying the vortex shedding in bluff bodies, especially in cylinders, has shown the function of this visualization technique, proving to be an efficient technique, by means of which many fluid dynamic processes can be understood. But, it has been possible to obtain not only quantitative results by means of high quality pictures, but experimental results about frequency vortex shedding values. These values are quite agreed with theoretical expected values.
The results obtained in circular cylinders have shown an alternating vortex shedding street, the well-known von Kármán vortex street. Besides this, in tests carried out at Re = 450 it has been possible to observe the first appearance of turbulence; this turbulence generates vortices with a distorted pattern, and it is quite difficult to distinguish any vortex.
However, the tests have involved to square cylinders. In comparison with the previous circular ones, the streamlines detached the body near the corners. It will generate a higher CD (drag coefficient), when bodies of the same dimensions at the same Re. At very low Reynolds (Re = 150) it has been appeared alternating vortices, but up to Re = 300 this alternating pattern disappeared.
References
[1] Ruiz, J. M., Gil, A. B., & Alonso, G. (2010). Ensayos aeroelásticos de puentes en túneles aerodinámicos. Hormigón y acero, 71. (Spanish)
[2] Marris, A. W. (1964). A review on vortex streets, periodic wakes, and induced vibration phenomena. Journal of Basic Engineering, 86 (2), 185-193.
[3] Lienhard, J. H. (1966). Synopsis of lift, drag, and vortex frequency data for rigid circular cylinders (Vol. 300). Technical Extension Service, Washington State University.
[4] Strouhal, V. (1878). Über eine besondere Art der Tonerregung. Annalen der Physik, 241 (10), 216-251.
[5] Dutta, S., Panigrahi, P. K., & Muralidhar, K. (2008). Experimental investigation of flow past a square cylinder at an angle of incidence. Journal of engineering mechanics, 134 (9), 788-803.
[6] Obasaju, E. D. (1983). An investigation of the effects of incidence on the flow around a square section cylinder. The Aeronautical Quarterly, 34 (4), 243-259.
[7] Lee, T., & Budwig, R. (1991). A study of the effect of aspect ratio on vortex shedding behind circular cylinders. Physics of Fluids A: Fluid Dynamics, 3 (2), 309-315.
[8] Szepessy, S., & Bearman, P. W. (1992). Aspect ratio and end plate effects on vortex shedding from a circular cylinder. Journal of Fluid Mechanics, 234, 191-217.
[9] Yang D, Zhao H. Discussion on Quality of New Built Towing Tank [J]. Science Technology and Engineering 2009; 3: 057.
[10] Dyrbye, C., & Hansen, S. O. (1996). Wind loads on structures.
[11] Lienhard, J. H. (1966). Synopsis of lift, drag, and vortex frequency data for rigid circular cylinders (Vol. 300). Technical Extension Service, Washington State University.