NASA Technical Memorandum 108860 Flow Visualization Studies of VTOL Aircraft Models During Hover In Ground Effect Nikos J. Mourtos, Stephane Couillaud, and Dale Carter, San Jose State University, San Jose, California Craig Hange, Doug Wardwell, and Richard J. Margason, Ames Research Center, Moffett Field, California Janua_ 1995 National Aeronautics and Space Administration Ames Research Center Moffett Field, California 94035-1000
Transcript
NASA Technical Memorandum 108860
Flow Visualization Studies ofVTOL Aircraft Models DuringHover In Ground EffectNikos J. Mourtos, Stephane Couillaud, and Dale Carter, San Jose State University,San Jose, California
Craig Hange, Doug Wardwell, and Richard J. Margason, Ames Research Center,Moffett Field, California
Janua_ 1995
National Aeronautics andSpace Administration
Ames Research CenterMoffett Field, California 94035-1000
Flow Visualization Studies of VTOL Aircraft Models
During Hover In Ground Effect
NIKOS J. MOURTOS,* STEPHANE COUILLAUD,* DALE CARTER,* CRAIG HANGE,
DOUG WARDWELL, AND RICHARD J. MARGASON
Ames Research Center
Summary
A flow visualization study of several configurations of a
jet-powered vertical takeoff and landing (VTOL) model
during hover in ground effect was conducted. A surface
oil flow technique was used to observe the flow patterns
on the lower surfaces of the model. Wing height with
respect to fuselage and nozzle pressure ratio are seen to
have a strong effect on the wing trailing edge flow angles.
This test was part of a program to improve the methods
for predicting the hot gas ingestion (HGI) for jet-powered
vertical/short takeoff and landing (V/STOL) aircraft. The
tests were performed at the Jet Calibration and Hover
Test (JCAHT) Facility at Ames Research Center.
Introduction
Jet-powered vertical/short takeoff and landing (V/STOL)
airplanes can experience significant performance losses
during hover and during transition between hover and
wing-borne flight. These losses are caused by the
propulsion efflux. Two propulsion-induced effects are
especially critical during operation near the ground for
takeoff or landing: (1)jet-induced effects on aero-
dynamics and (2) hot gas ingestion (HGI) effects onengine performance.
HGI is a term used to describe any flow mechanism
where hot exhaust gas from a propulsion jet returns to the
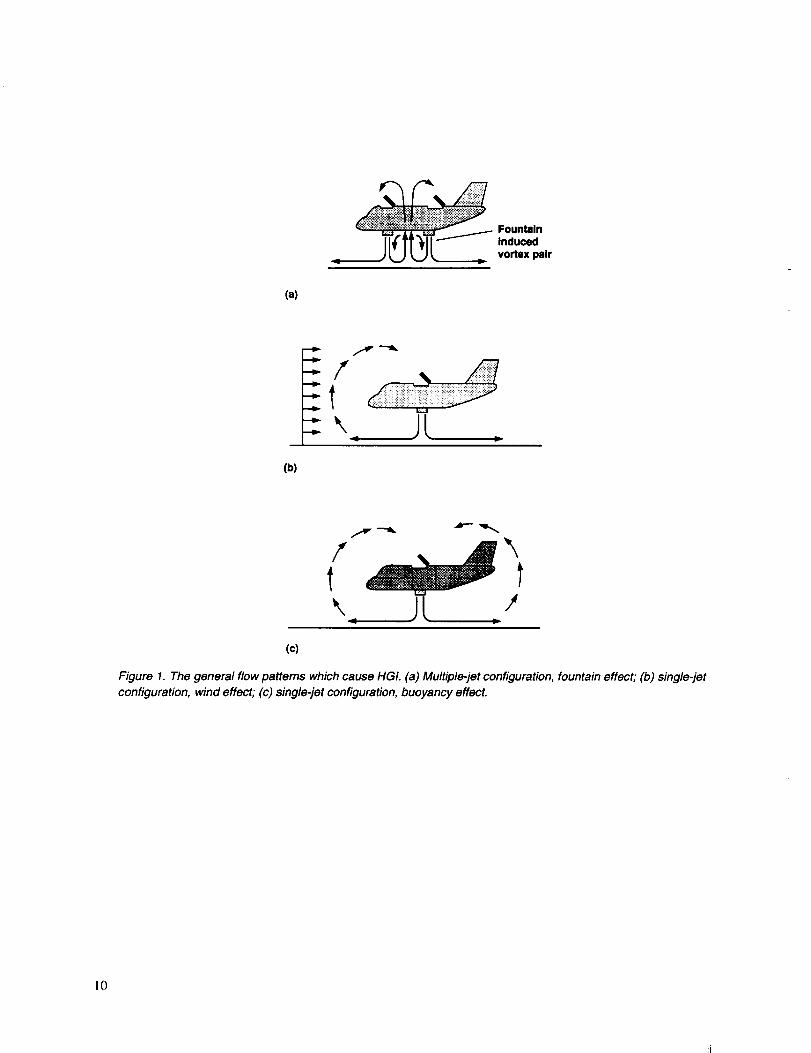
inlet of the same propulsion system. Three flow patterns
that cause HGI in jet-powered V/STOL aircraft are shown
in figure 1. Figure l(a) shows the flow field for a
multiple-jet configuration in ground effect. The hot jets
impinge on the ground and form wall jets which may run
into each other underneath the airplane and form a
fountain. This fountain brings the hot exhaust gases very
rapidly to the airplane's undersurface where they impinge
forming a lateral stagnation line in the spanwise direction.
At the side of the fuselage or at the edge of the wing
planform some of the flow continues upward where it
may find its way into the engine inlets. Between thisstagnation line and both the front and rear jets, the
*San Jose State University, San Jose, California.
fountain fluid flows along the fuselage lower surface
toward the jets where it is entrained by the jet and forms a
vortex pair as sketched in figure 1(a). The jet efflux and
the fountain flow entrain ambient temperature air which
produces a nonuniform temperature profile. Thisrecirculation is called near-field HGI and can cause a
rapid increase in the inlet temperature which in turn
decreases the thrust. In addition, uneven temperaturedistribution can result in inlet flow distortion and cause
compressor stall. In addition, the fountain-induced vortex
pair can cause a lift loss and a pitching-momentincrement.
Figures l(b) and l(c) show the flow field for a single-jet
configuration. The effects of wind (fig. l(b)) and
buoyancy (fig. l(c)) bring the hot gases back into the
engine inlets. This recirculation is called far-field HGI.
Multiple-jet configurations may also experience far-field
HGI. As illustrated in figure l(b), far-field HGI can occur
rapidly when there is a crosswind blowing the hot exhaust
back to the inlet or when the aircraft speed causes a
similar relative motion between the hot gases and the
engine inlet. Depending on the wind speed, aircraft speed,
and aircraft geometry, there is a wind speed which
produces a maximum temperature rise. At either greater
or lesser speeds the temperature rise is reduced becausethe hot gases from the far field are convected away from
the engine inlets. However, buoyancy effects (fig. 1(c))take time to become established. For the AV-8 Harrier, it
takes about 30 seconds in hover for the air around it to
heat up by 5°C. This 5°C increase in air temperature
entering the inlet reduces the thrust by about 4 percent.
Near-field HGI tends to bring hot exhaust gases quickly
into the engine inlets. For the AV-8 Harrier, in about one
second during hover the fountain effect can increase the
inlet temperature by as much as 10°C. This temperatureincrease results in approximately 10 percent loss of thrust,
which is significant considering the fact that the thrust-to-
weight ratio for most V/STOL airplanes is only 10 to
30 percent greater than one. The Harrier, however, does
not represent the worse case scenario for HGI. In some jet
VTOL airplane models an inlet temperature rise (ITR) of
55°C has been measured (refs. 1 and 2) after only a very
shorttimeinhoverwithingroundeffect.Suchvaluesof
ITR can cause a major loss of thrust and consequently acrash.
The HGI problem was recognized (ref. 3) and considered
during the research and development of the Harrier in thelate 1950s. In the mid 1960s, NASA initiated several
experimental projects (refs. 1, 2, 4-7) to obtain HGI data.
Additional research was done in Europe (refs. 8-10),
especially for the VAK-191B VTOL aircraft. The recent
U.S./U.K. advanced short takeoff and vertical landing
(ASTOVL) aircraft studies have generated a renewed
interest in the topic as shown by current experimental
investigations (ref. 11) of some of the basic mechanisms
and configuration effects.
In the late 1960s and early 1970s, the first attempts were
made to develop analytical methods for HGI. An early
empirical approach by Behnert (ref. 9) was developed in
support of the VAK-191B VTOL aircraft program. Thismethod was based on a correlation of the small-scale
model data and the full-scale aircraft data. In 1971, Gray
and Kisielowski (ref. 12) developed an engineering
method for predicting the temperatures and velocities in
the vicinity of vertical lift engines of jet V/STOL aircraft
operating near the ground. This method described the
propulsion efflux flow field starting at the lift jet exit,
continuing to ground impingement through the wall jet to
either a far-field flow or to a fountain flow back up to the
aircraft and the engine inlets. The effects of both near-
field and wind-generated far-field recirculation were
included. Barron and Frauenberger (ref. 13) applied this
analysis in an early code that evaluated jet-induced
ground footprint and hot gas upwash characteristics ofV/STOL aircraft.
In the early 1980s, Green and Zanine (refs. 14-16)
extended and implemented the methods of reference 12
in a computer program, REINGST, to attempt a rapid,
preliminary design estimation of inlet temperature rise
due to near- and far-field HGI for a jet VTOL aircraft.
The method was compared by its authors with the limited
experimental data which were available at the time andfound to achieve reasonable success for several aircraft.
Currently, this is the only nonproprietary code that is
available for estimating HGI. The REINGST code wasreevaluated in 1990 (ref. 17) to establish its effectiveness
for several V/STOL aircraft configurations. Unfortu-
nately, the method greatly underpredicted the ITR due tonear-field recirculation because of inaccurate empirical
correlations for the temperature decay in the various
regions of the flow field. In addition, the method failed toaccount properly for the geometry of the airplane. This
HGI prediction method (refs. 14--16) assumes that theaircraft has a flat undersurface; as shown in reference 17,
the agreement with experimental data which involved
three-dimensional (3-D) models was not very good. This
result demonstrated the need to study flow fields around
3-D models to obtain a better understanding of themechanisms which cause HGI.
The purpose of the present flow visualization
investigation was to use a simple two-jet geometry to
evaluate the effect of model configuration (fiat-plate or
3-D model), NPR, and model height on the general flow
patterns which cause HGI. The fiat-plate model was
designed to be tested either as a body alone or as a wing-body configuration. The 3-D model was designed so that
three different airplane configurations could be tested
with minimum hardware changes (body alone, body with
high wing, and body with low wing). The flow patterns
on the lower model surface were observed using a
fluorescent oil flow technique. This report presents the
results of that flow visualization study.
Symbols and Acronyms
ASME American Society of Mechanical
Engineers
De equivalent nozzle diameter based on thetotal area of all exhaust nozzles, in.
H distance from nozzle exit to ground
impingement point, in.
HGI hot gas ingestion
HTR hover test rig
ITR inlet temperature rise
JCAHT Jet Calibration and Hover Test Facility
NPR nozzle pressure ratio
PSCL Propulsion Simulator Calibration
Laboratory
SAE Society of Automotive Engineers
V/STOL vertical/short takeoff and landing
VTOL vertical takeoff and landing
Description of the Test Setup
The description of the Jet Calibration and Hover Test
Facility (JCAHT) test setup includes relatively complete
discussions of the hover test rig (HTR), model nozzle and
plenum details, model hardware, flow visualizationtechnique, and data acquisition system. A few features of
the JCAHT which were not used in this phase of this
investigation are identified in the following discussion.
However, information on the entire JCAHT is included to
provide an understanding of the complete experimental
facility.
Hover Test Rig
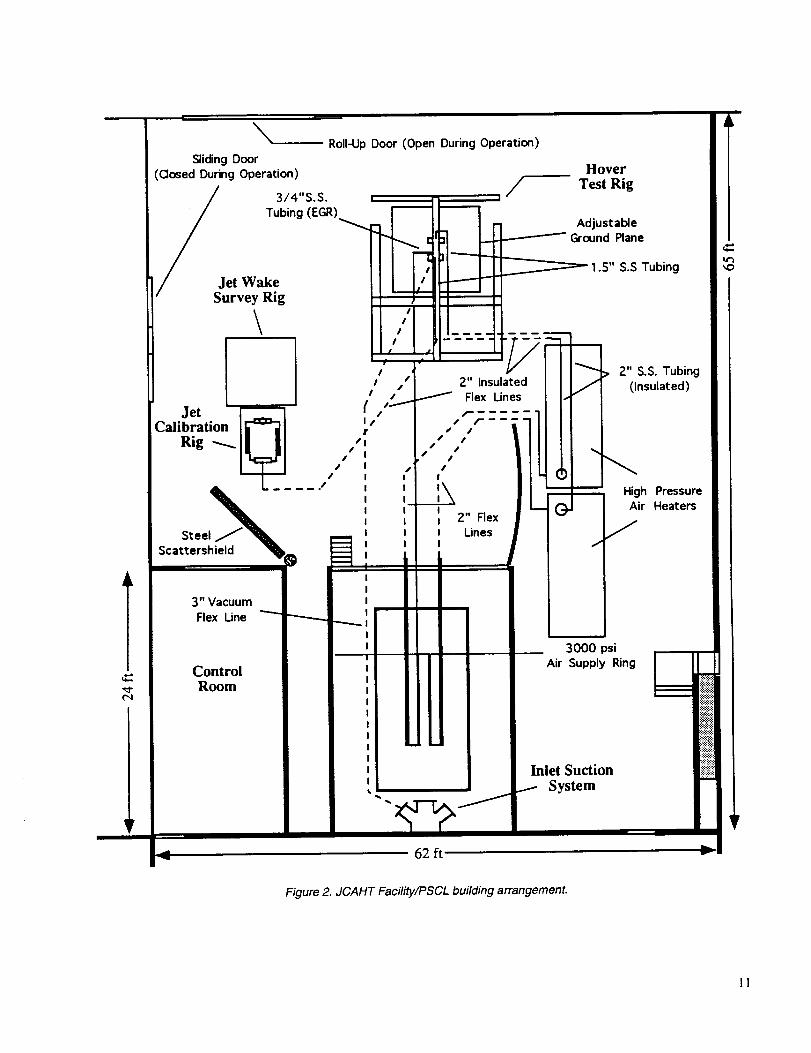
The Ames JCAHT facility (shown in fig. 2) was an
extension of the Propulsion Simulator Calibration
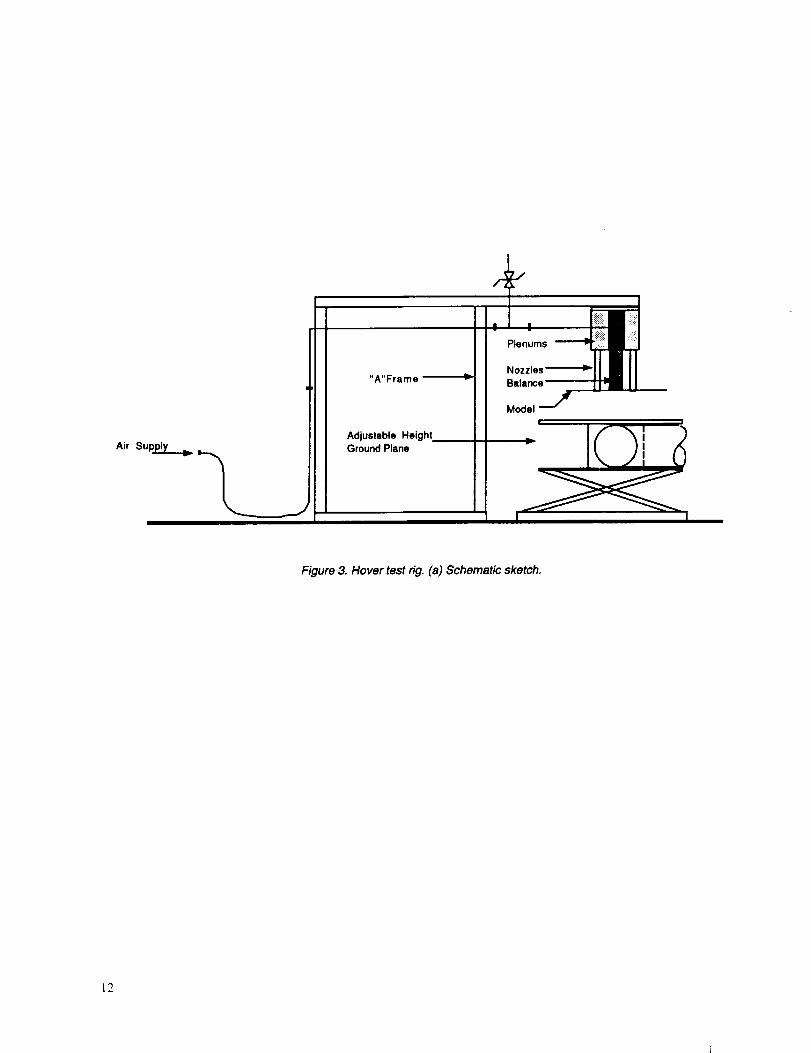
Laboratory (PSCL). JCHAT added the HTR (fig. 3),
high-pressure air heaters, and jet calibration rig to the
laboratory. Whereas the HTR was used in the present
investigation only for flow visualization, it did use the
same plenum nozzle assembly and balance mounting
hardware used for metric models. In other investigations
the HTR was used to measure jet-induced forces and ITR
due to HGI on V/STOL models hovering in or out of
ground effect.
Mounted at the top of the HTR is a six-component
internal strain gage balance. As shown in figure 3(a),
the model is attached perpendicular to the axial force
direction of the balance. Also at the top of the rig is the
plenum assembly for piping high pressure air to the jet
nozzles. The entire plenum and nozzle assembly ismounted so that it does not make contact with the model
suspended from the balance. This is done so that the jet-induced forces on the model are the only forces measured
by the balance. Nozzle thrust is generally obtained as afunction of NPR from the calibrations on the jet cali-
bration rig. For HGI tests the model may also be
instrumented with thermocouples for temperaturemeasurements.
Underneath the model is an 8 ft × 8 ft aluminum ground
board. This is lifted by a hydraulic system capable of
varying height with a 1/32 in. accuracy. Instead of having
the airplane model move, the ground is moved to vary
model height. A string potentiometer provides the table
height to the data system. A trap door is also incorporated
into the ground board. Normally, for HGI testing, this
door is left open while the test parameters are set to
scavenge the hot simulated exhaust gases out of theroom. At a data time zero, the door is quickly closed; the
airplane is suddenly exposed to ground effect and near-field flow starts to form. However, for the flow visuali-
zation tests only cold air was used and the trap door was
replaced by a transparent plastic sheet (fig. 3(b)). Acamera mounted under the plastic was used to photograph
the lower surface of the models. For a given data point,
the ground plane height was adjusted to the desired value,then the nozzles were turned on to the desired NPR. After
the flow stabilized, a photograph was taken.
Details of Nozzle and Plenum
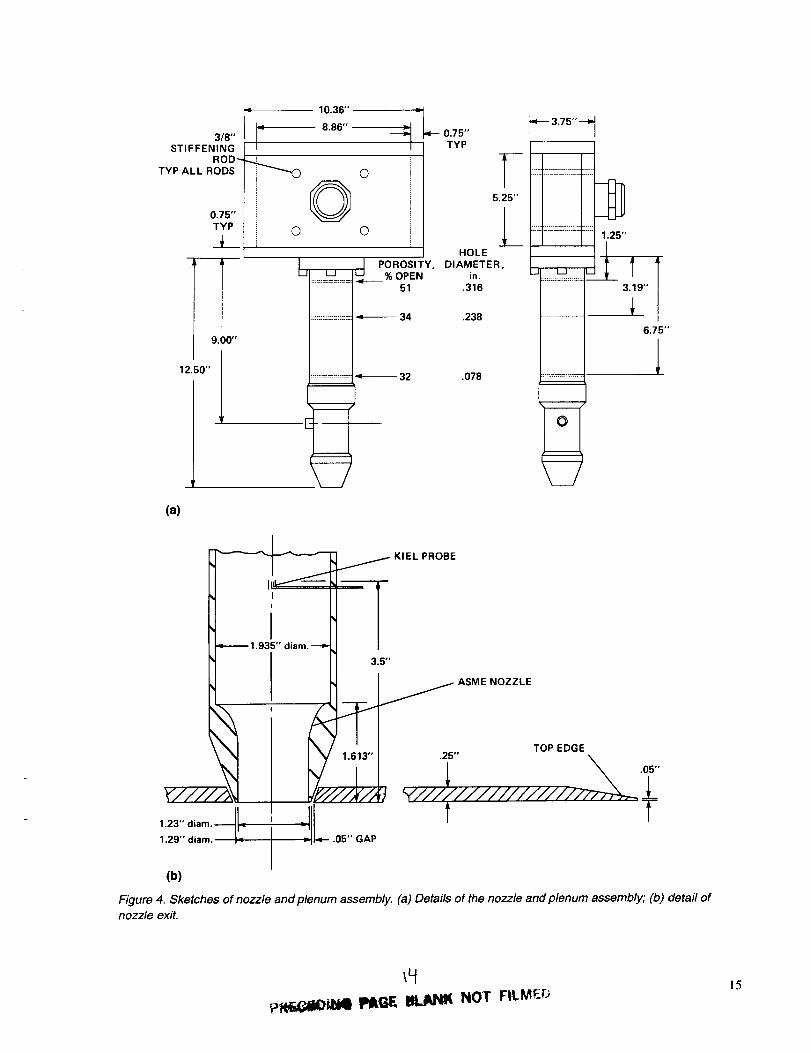
The two ASME nozzles were bolted to the rectangular
plenums as shown in figure 4(a). The nozzles had three
internal porous plates to improve flow quality. The
porous plate locations, porosities, and hole diameters areshown in figure 4(a). Details of the nozzle exit are shown
in figure 4(b). The nozzle exit diameter was 1.23 in. A
gap of 0.05 in. was maintained between the model and the
nozzle. A fouling circuit warned of fouling between the
nozzle and the model due either to physical contact or to
the buildup of ice on the nozzle due to cold flow tests. For
the present investigation this was not an issue becauseforce data were not recorded.
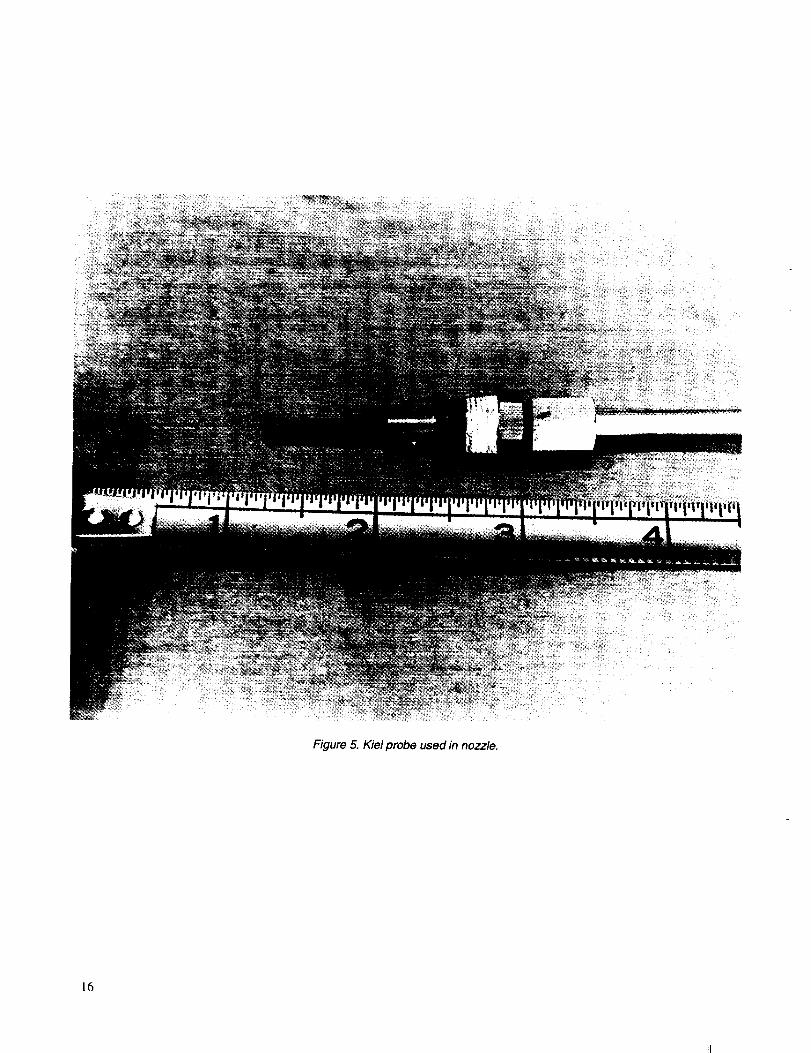
A Kiel probe assembly (fig. 5) was used to sense the total
pressure and total temperature. The Kiel probe had ashield diameter of 0.095 in. At the location of the Kiel
probe (fig. 4), the inner diameter of the duct leading to the
nozzle was 1.935 in. The Kiel probe was mounted in eachnozzle 3.5 in. from the exit of the nozzle and 2.0 in.
downstream of the last porous plate which has 0.078 in.diameter holes. As a result the 2.0 in. distance was
26 hole diameters from the downstream porous plate.This was considered to be sufficient distance to avoid any
adverse influence of the porous plates on measurement
accuracy.
Model Hardware
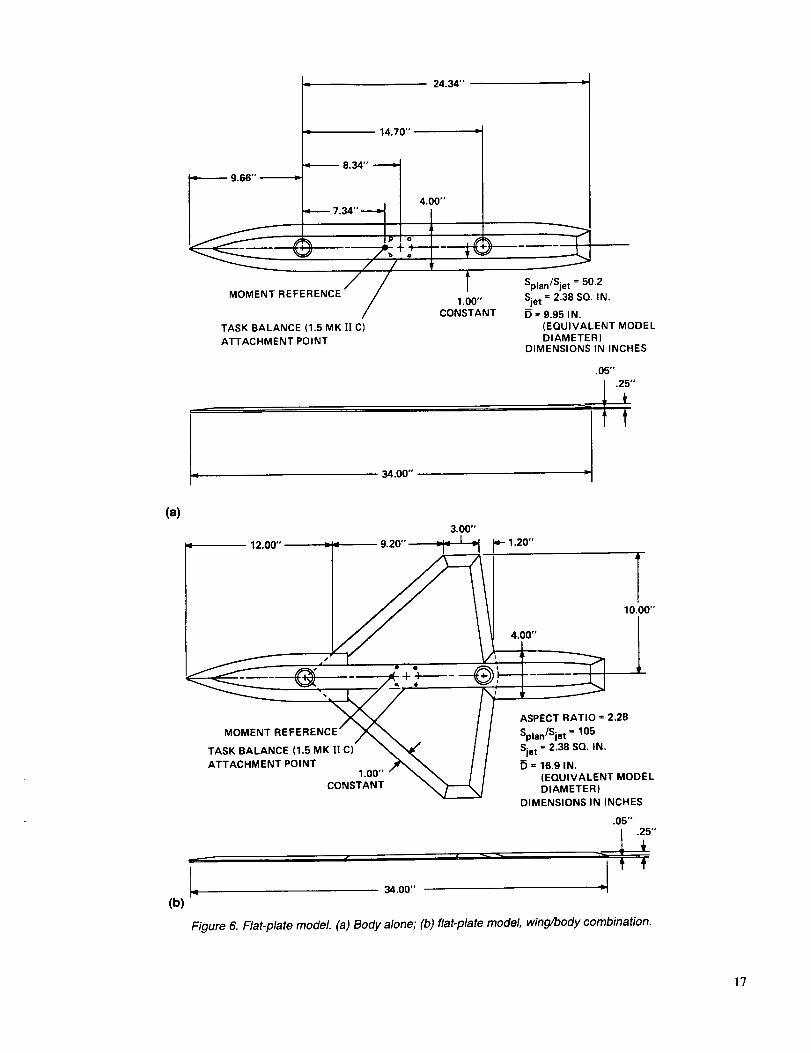
Five model configurations were tested: two were fiat-
plate models and three were 3-D models. Figure 6(a)shows the fiat-plate body alone and figure 6(b) shows the
fiat-plate wing/body combination. These configurationswere selected because they were similar to some which
had been tested for HGI and suckdown in a previous
investigation (ref. 18).
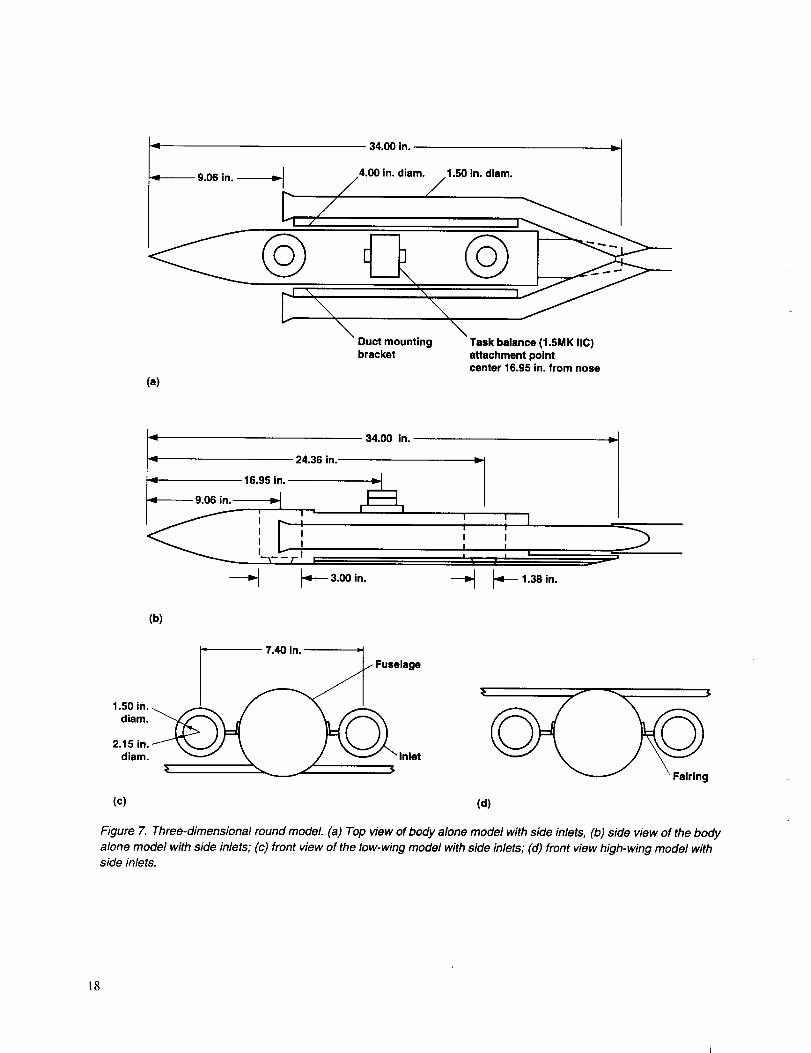
Figure 7 shows the 3-D models which were designed for
this investigation. The fuselage had a simple circularcross section with an ogive nose and a blunt aft end. The
model was designed to permit the wing to be mounted in
either a low or high position relative to the fuselage. The
wing for all model configurations was made from a flat
plate and had a sharp edge as shown in figure 4(b). There
were two simple circular flared inlets which could be
mounted in one of the three longitudinal positions. A
fairing mounted on the fuselage represented a pylonmount for the inlet ducts. Aft of the model, the ducts from
each inlet were joined into a single duct on the line of
symmetry. Although not used in the present investigation,
this single duct could be connected to a suction source to
induce flow into the simulated engine inlets.
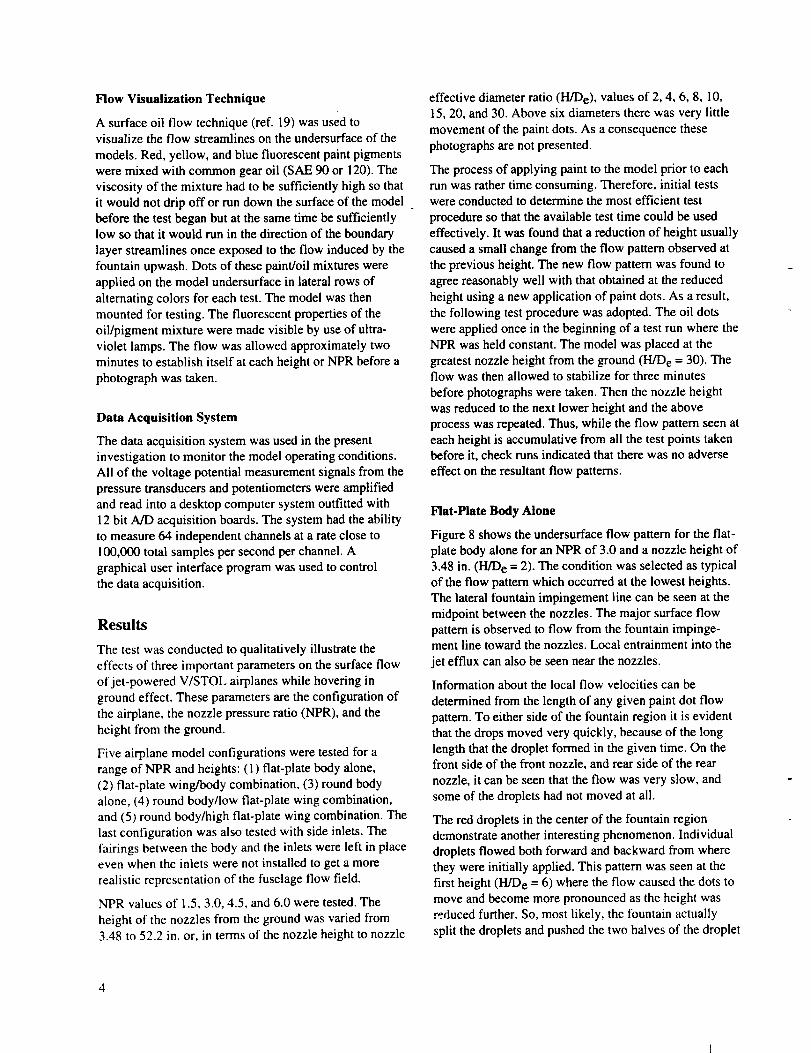
Flow Visualization Technique
A surface oil flow technique (ref. 19) was used tovisualize the flow streamlines on the undersurface of the
models. Red, yellow, and blue fluorescent paint pigments
were mixed with common gear oil (SAE 90 or 120). The
viscosity of the mixture had to be sufficiently high so that
it would not drip off or run down the surface of the model
before the test began but at the same time be sufficientlylow so that it would run in the direction of the boundary
layer streamlines once exposed to the flow induced by the
fountain upwash. Dots of these paint/oil mixtures were
applied on the model undersurface in lateral rows of
alternating colors for each test. The model was then
mounted for testing. The fluorescent properties of the
oil/pigment mixture were made visible by use of ultra-
violet lamps. The flow was allowed approximately two
minutes to establish itself at each height or NPR before a
photograph was taken.
Data Acquisition System
The data acquisition system was used in the present
investigation to monitor the model operating conditions.
All of the voltage potential measurement signals from the
pressure transducers and potentiometers were amplified
and read into a desktop computer system outfitted with
12 bit A/D acquisition boards. The system had the ability
to measure 64 independent channels at a rate close to
100,000 total samples per second per channel. A
graphical user interface program was used to control
the data acquisition.
Results
The test was conducted to qualitatively illustrate the
effects of three important parameters on the surface flow
of jet-powered V/STOL airplanes while hovering in
ground effect. These parameters are the configuration of
the airplane, the nozzle pressure ratio (NPR), and the
height from the ground.
Five airplane model configurations were tested for a
range of NPR and heights: (1) flat-plate body alone,
(2) flat-plate wing/body combination, (3) round body
and (5) round body/high flat-plate wing combination. The
last configuration was also tested with side inlets. The
fairings between the body and the inlets were left in placeeven when the inlets were not installed to get a more
realistic representation of the fuselage flow field.
NPR values of 1.5, 3.0, 4.5, and 6.0 were tested. The
height of the nozzles from the ground was varied from3.48 to 52.2 in. or, in terms of the nozzle height to nozzle
effective diameter ratio (H/De), values of 2, 4, 6, 8, 10,
15, 20, and 30. Above six diameters there was very little
movement of the paint dots. As a consequence these
photographs are not presented.
The process of applying paint to the model prior to each
run was rather time consuming. Therefore, initial testswere conducted to determine the most efficient test
procedure so that the available test time could be used
effectively. It was found that a reduction of height usually
caused a small change from the flow pattern observed at
the previous height. The new flow pattern was found to
agree reasonably well with that obtained at the reduced
height using a new application of paint dots. As a result,
the following test procedure was adopted. The oil dots
were applied once in the beginning of a test run where the
NPR was held constant. The model was placed at the
greatest nozzle height from the ground (H/D e = 30). Theflow was then allowed to stabilize for three minutes
before photographs were taken. Then the nozzle heightwas reduced to the next lower height and the above
process was repeated. Thus, while the flow pattern seen ateach height is accumulative from all the test points takenbefore it, check runs indicated that there was no adverse
effect on the resultant flow patterns.
Flat-Plate Body Alone
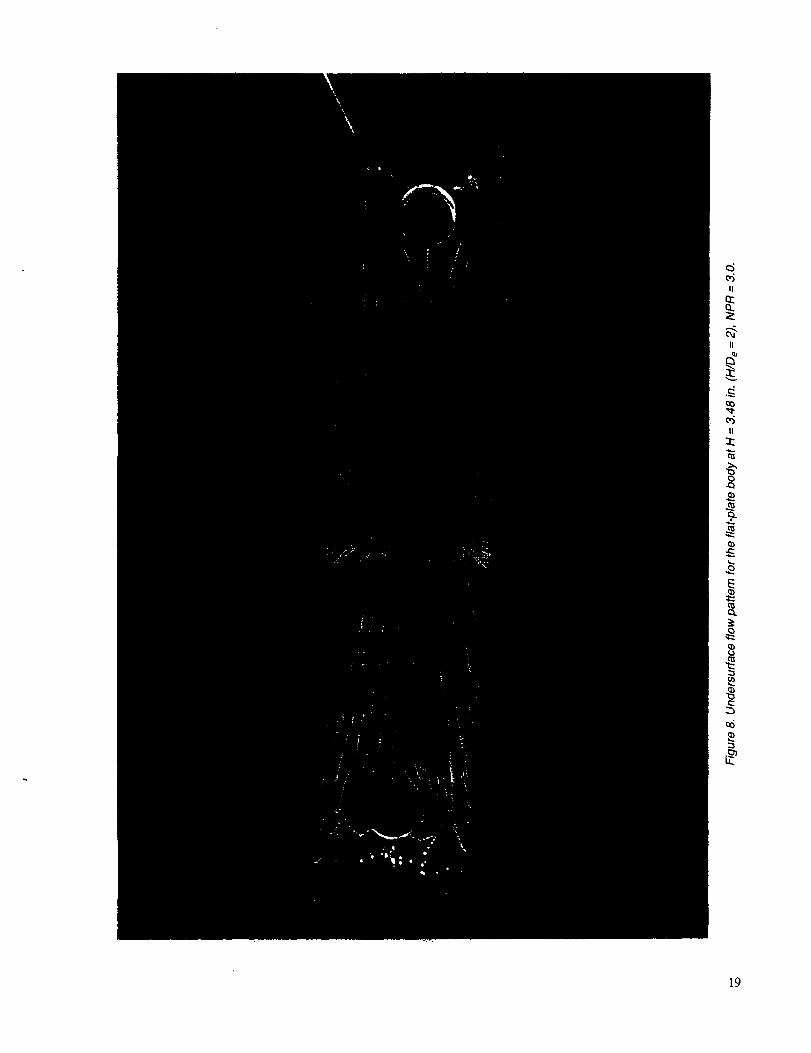
Figure 8 shows the undersurface flow pattern for the flat-
plate body alone for an NPR of 3.0 and a nozzle height of3.48 in. (H/D e = 2). The condition was selected as typical
of the flow pattern which occurred at the lowest heights.
The lateral fountain impingement line can be seen at the
midpoint between the nozzles. The major surface flow
pattern is observed to flow from the fountain impinge-ment line toward the nozzles. Local entrainment into the
jet efflux can also be seen near the nozzles.
Information about the local flow velocities can be
determined from the length of any given paint dot flow
pattern. To either side of the fountain region it is evident
that the drops moved very quickly, because of the long
length that the droplet formed in the given time. On thefront side of the front nozzle, and rear side of the rear
nozzle, it can be seen that the flow was very slow, and
some of the droplets had not moved at all.
The red droplets in the center of the fountain regiondemonstrate another interesting phenomenon. Individual
droplets flowed both forward and backward from where
they were initially applied. This pattern was seen at thefirst height (H/D e = 6) where the flow caused the dots to
move and become more pronounced as the height was
reduced further. So, most likely, the fountain actually
split the droplets and pushed the two halves of the droplet
4
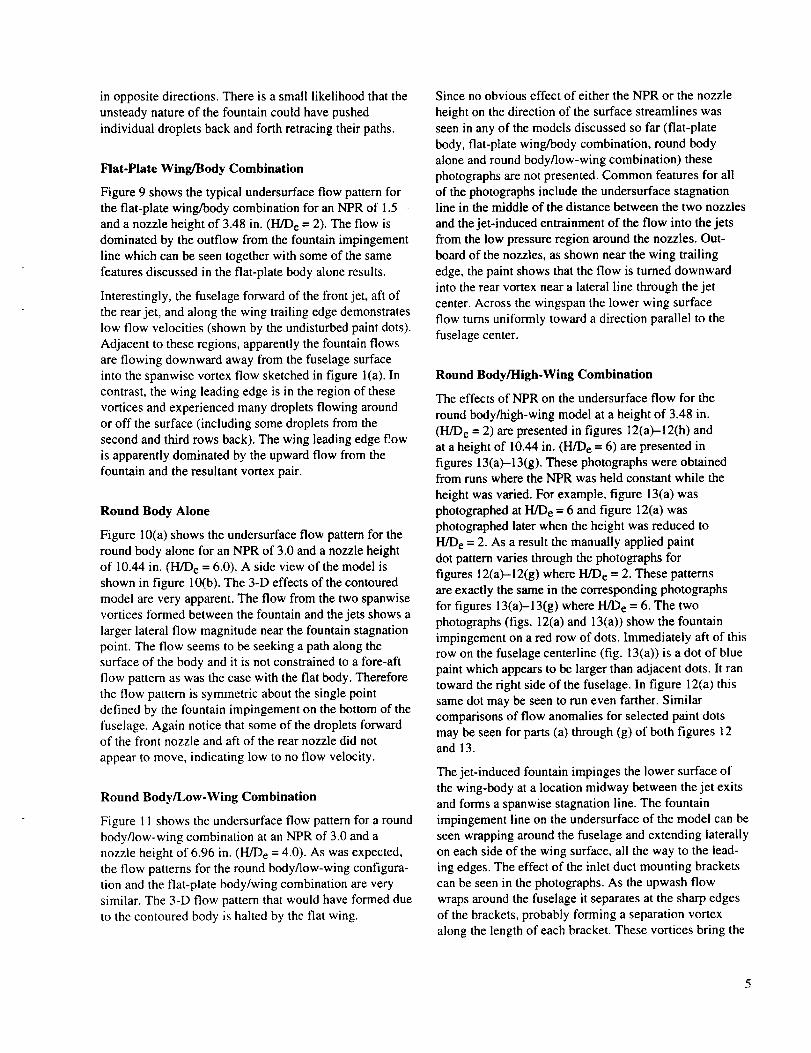
in opposite directions. There is a small likelihood that the
unsteady nature of the fountain could have pushed
individual droplets back and forth retracing their paths.
Flat-Plate Wing/Body Combination
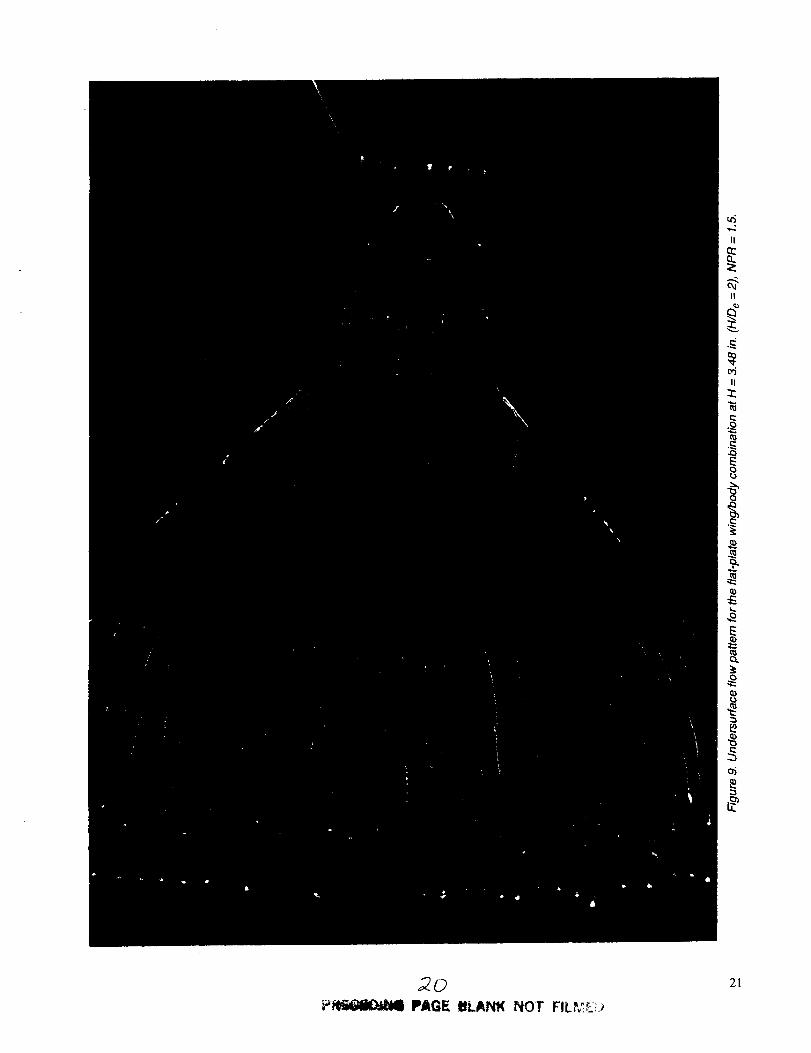
Figure 9 shows the typical undersurface flow pattern for
the flat-plate wing/body combination for an NPR of 1.5
and a nozzle height of 3.48 in. (H/D e = 2). The flow is
dominated by the outflow from the fountain impingement
line which can be seen together with some of the same
features discussed in the flat-plate body alone results.
Interestingly, the fuselage forward of the front jet, aft of
the rear jet, and along the wing trailing edge demonstrates
low flow velocities (shown by the undisturbed paint dots).
Adjacent to these regions, apparently the fountain flows
are flowing downward away from the fuselage surface
into the spanwise vortex flow sketched in figure 1(a). In
contrast, the wing leading edge is in the region of these
vortices and experienced many droplets flowing around
or off the surface (including some droplets from the
second and third rows back). The wing leading edge P.ow
is apparently dominated by the upward flow from the
fountain and the resultant vortex pair.
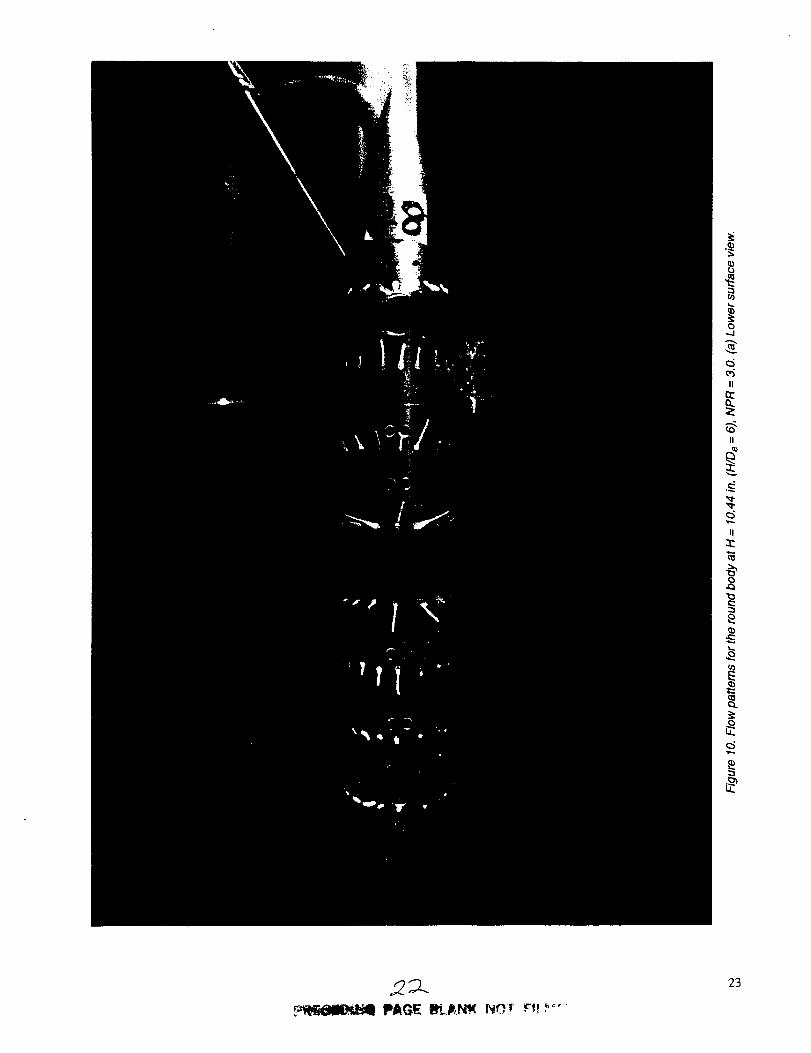
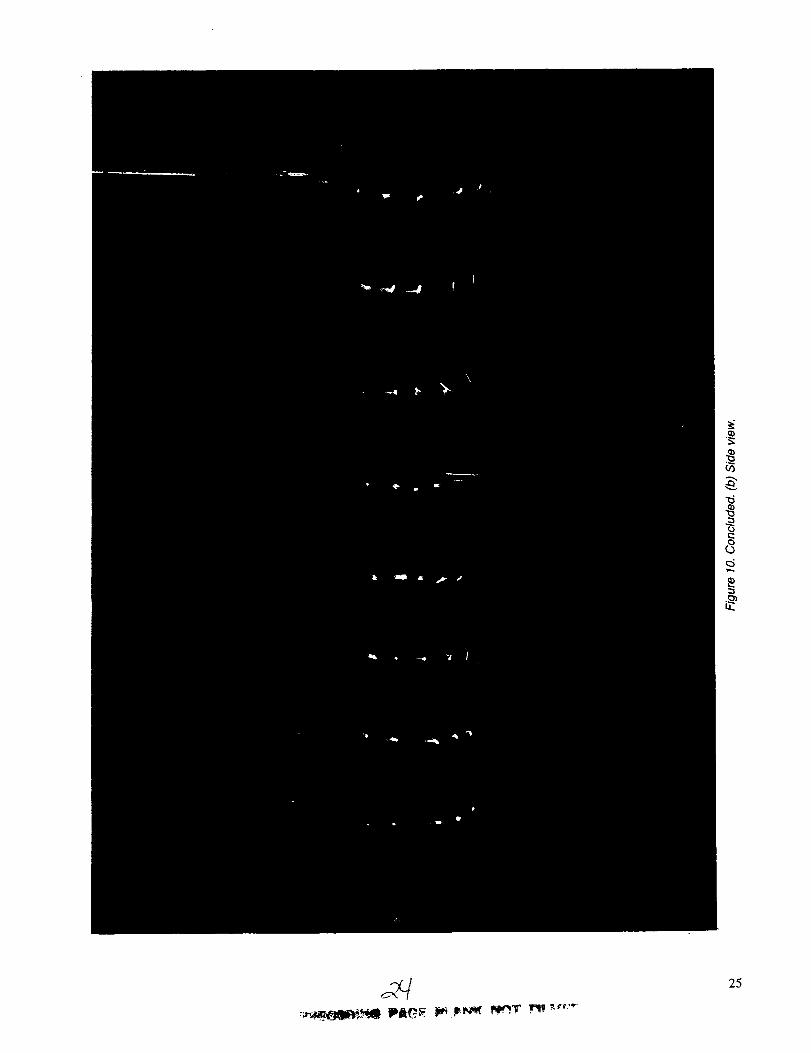
Round Body Alone
Figure 10(a) shows the undersurface flow pattern for the
round body alone for an NPR of 3.0 and a nozzle height
of 10.44 in. (H/D e = 6.0). A side view of the model is
shown in figure 10(b). The 3-D effects of the contoured
model are very apparent. The flow from the two spanwise
vortices formed between the fountain and the jets shows a
larger lateral flow magnitude near the fountain stagnation
point. The flow seems to be seeking a path along thesurface of the body and it is not constrained to a fore-aft
flow pattern as was the case with the fiat body. Therefore
the flow pattern is symmetric about the single point
defined by the fountain impingement on the bottom of the
fuselage. Again notice that some of the droplets forwardof the front nozzle and aft of the rear nozzle did not
appear to move, indicating low to no flow velocity.
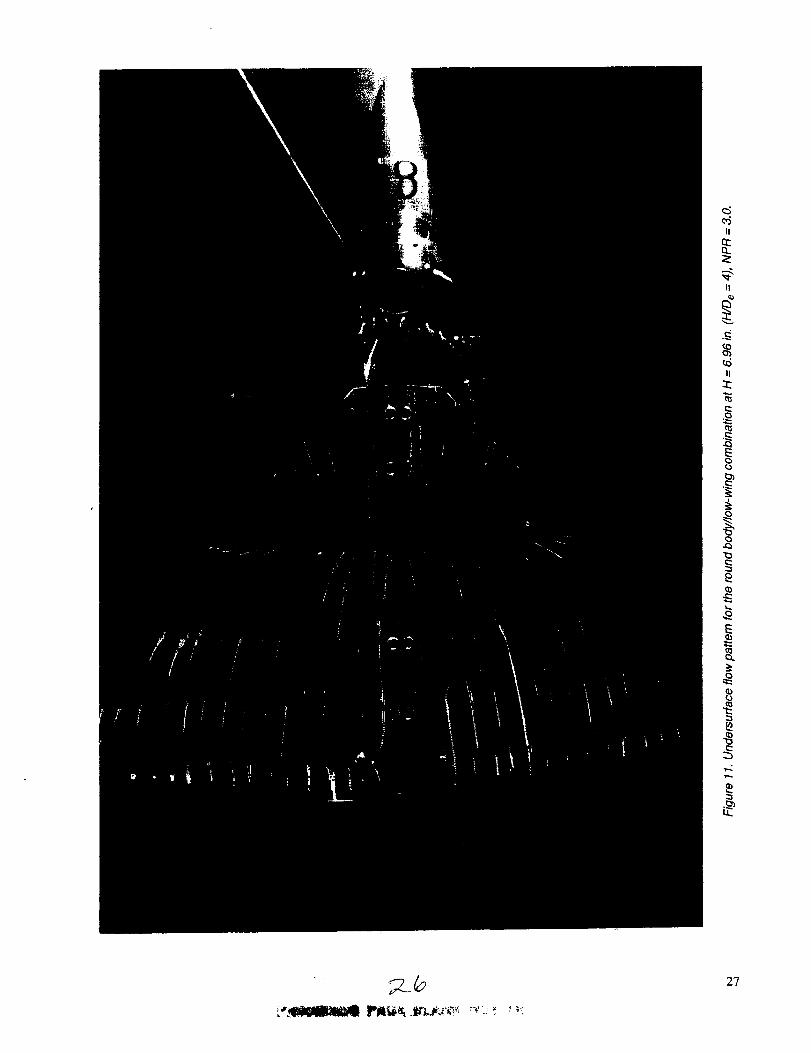
Round Body/Low-Wing Combination
Figure 1 l shows the undersurface flow pattern for a round
body/low-wing combination at an NPR of 3.0 and a
nozzle height of 6.96 in. (H/D e = 4.0). As was expected,
the flow patterns for the round body/low-wing configura-
tion and the flat-plate body/wing combination are verysimilar. The 3-D flow pattern that would have formed due
to the contoured body is halted by the flat wing.
Since no obvious effect of either the NPR or the nozzle
height on the direction of the surface streamlines was
seen in any of the models discussed so far (flat-plate
body, fiat-plate wing/body combination, round body
alone and round body/low-wing combination) these
photographs are not presented. Common features for all
of the photographs include the undersurface stagnationline in the middle of the distance between the two nozzles
and the jet-induced entrainment of the flow into the jetsfrom the low pressure region around the nozzles. Out-
board of the nozzles, as shown near the wing trailing
edge, the paint shows that the flow is turned downwardinto the rear vortex near a lateral line through the jet
center. Across the wingspan the lower wing surface
flow turns uniformly toward a direction parallel to the
fuselage center.
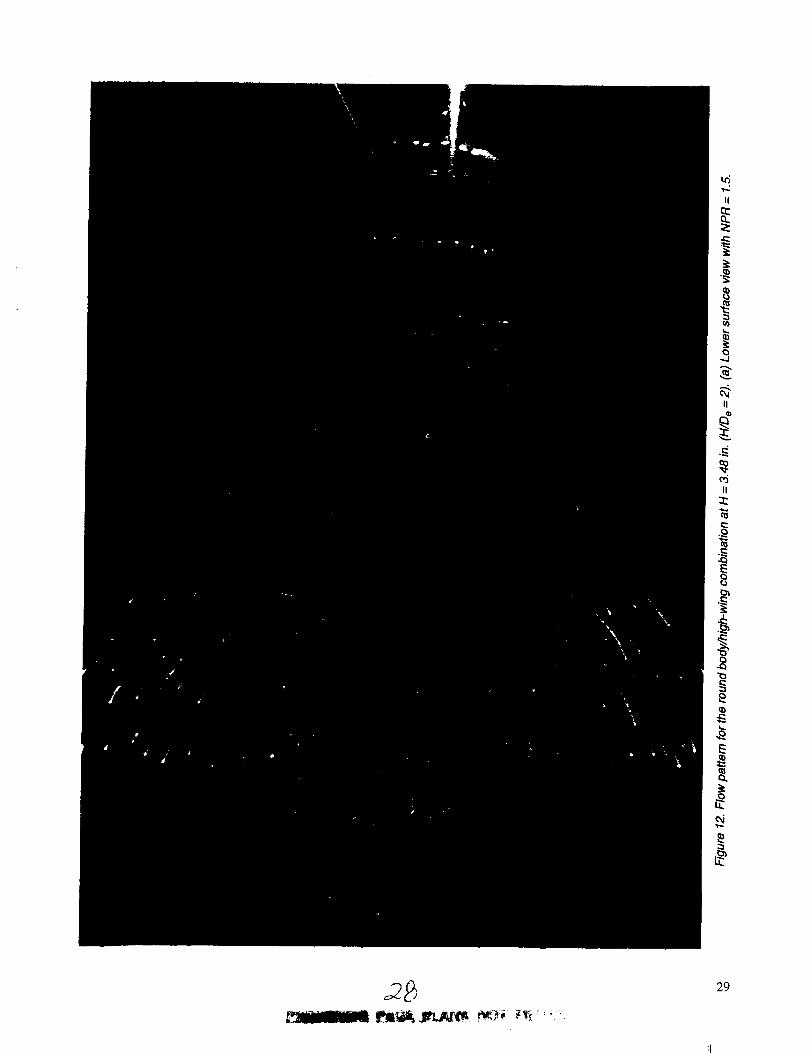
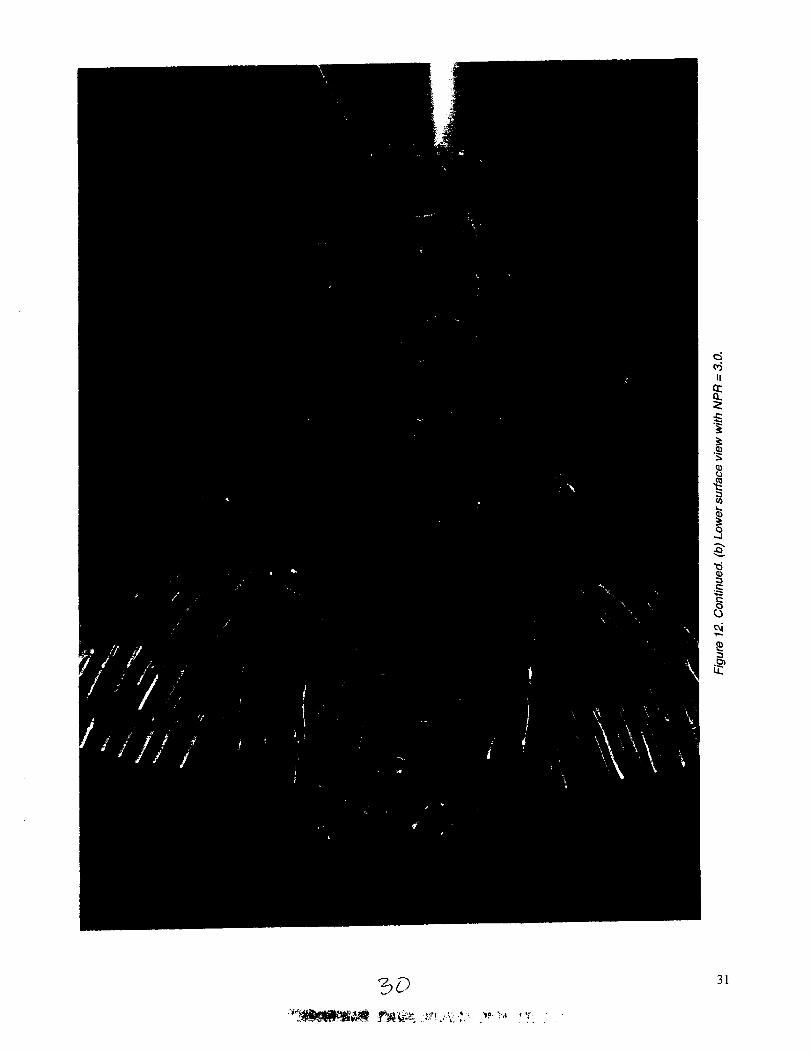
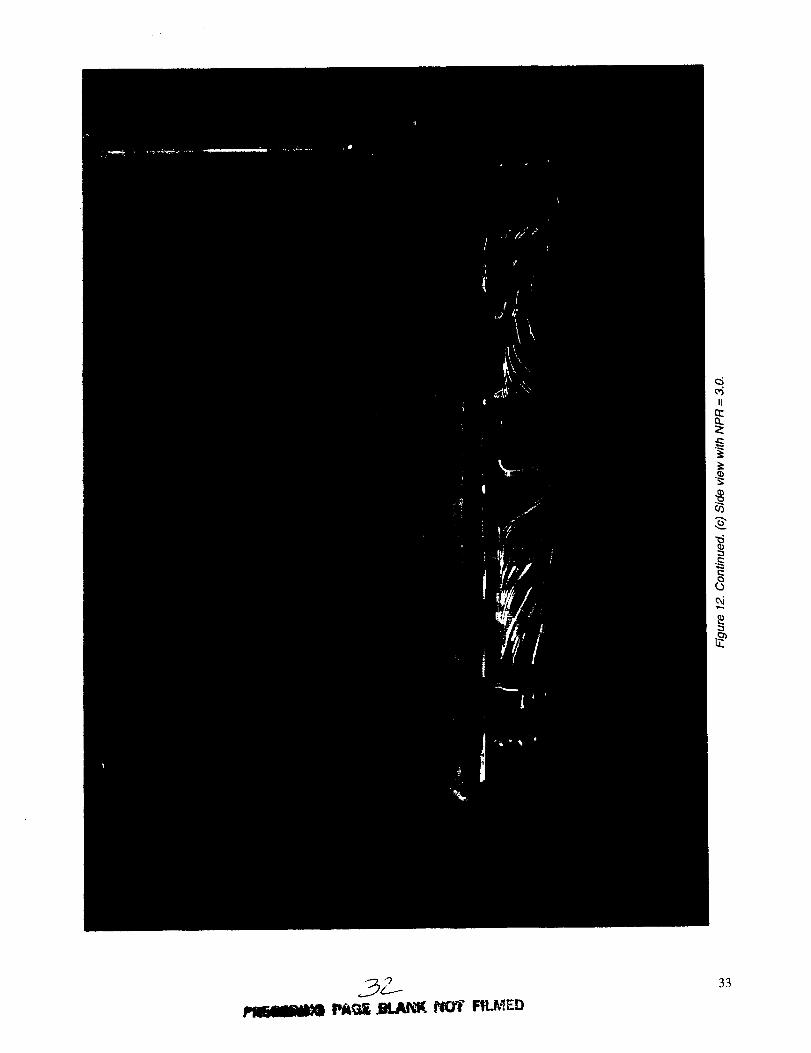
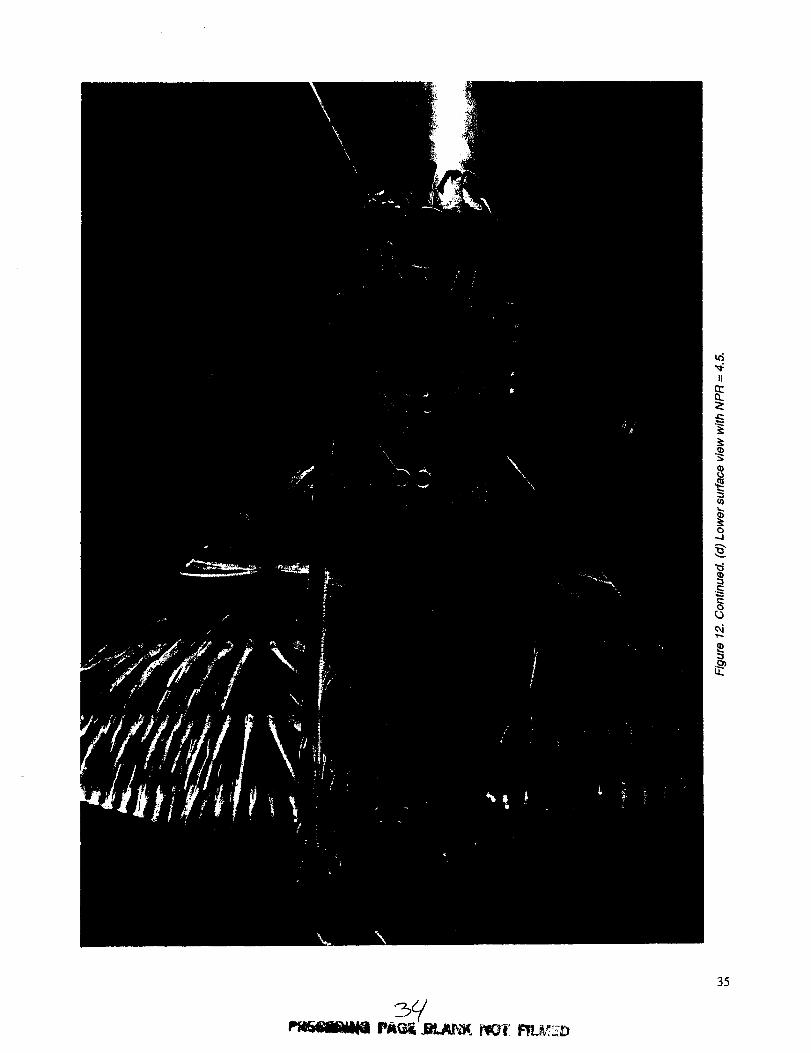
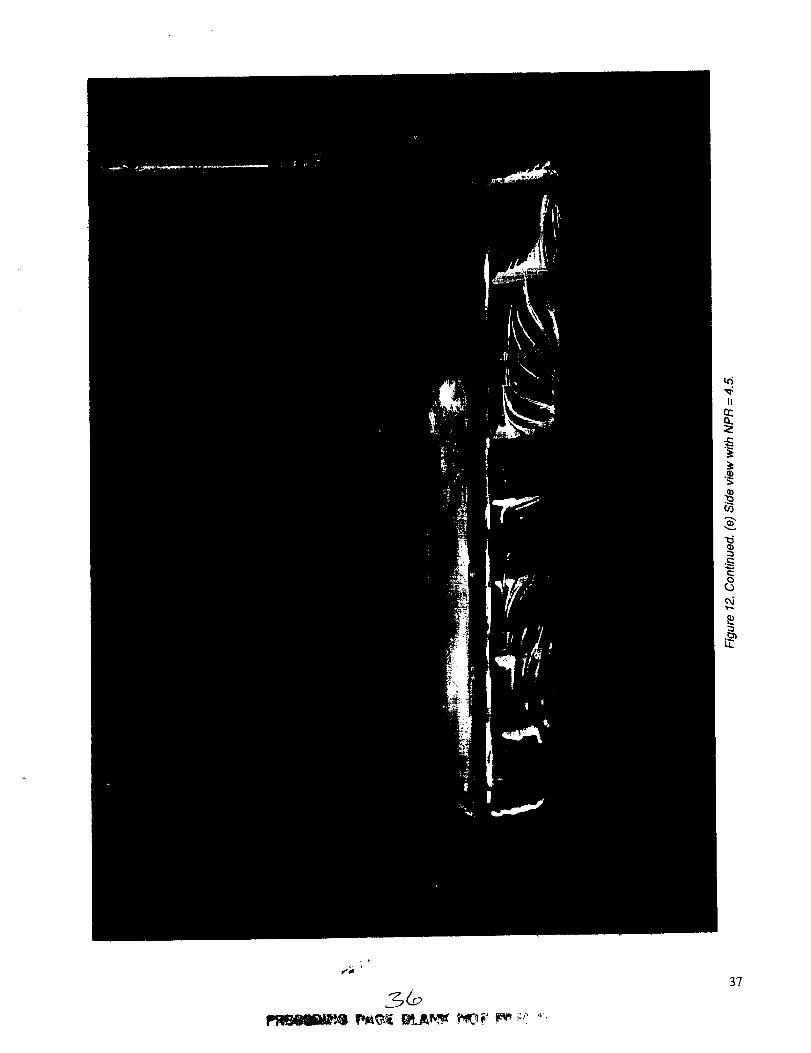
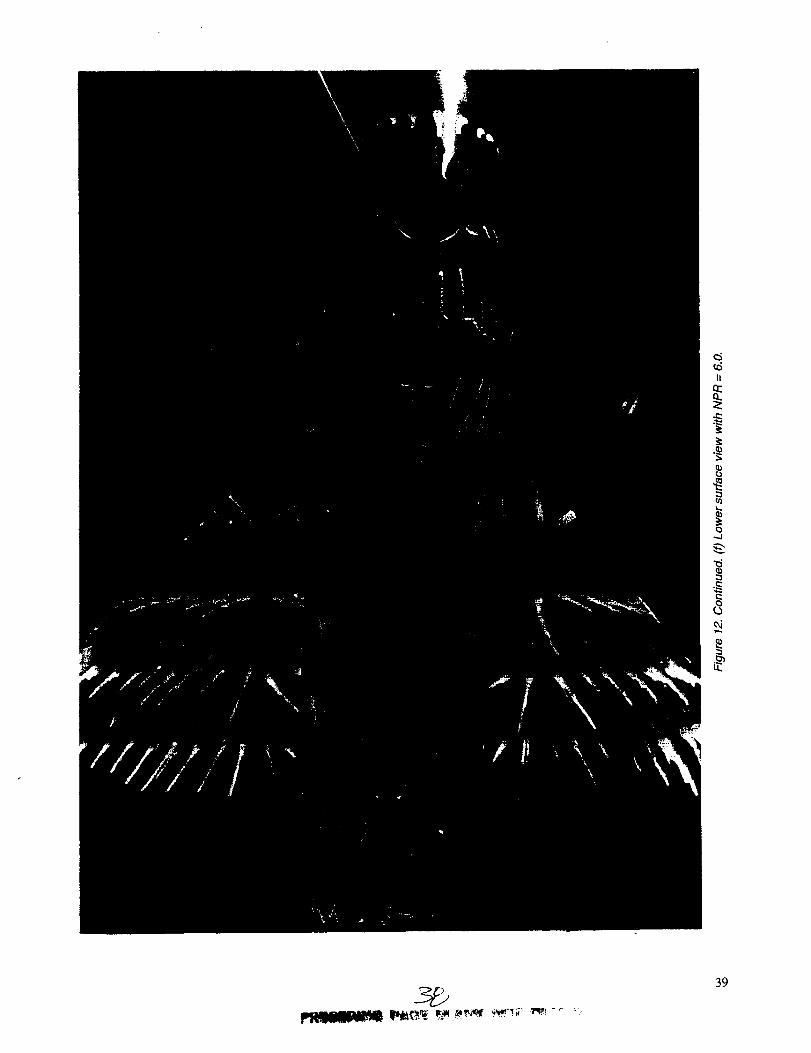
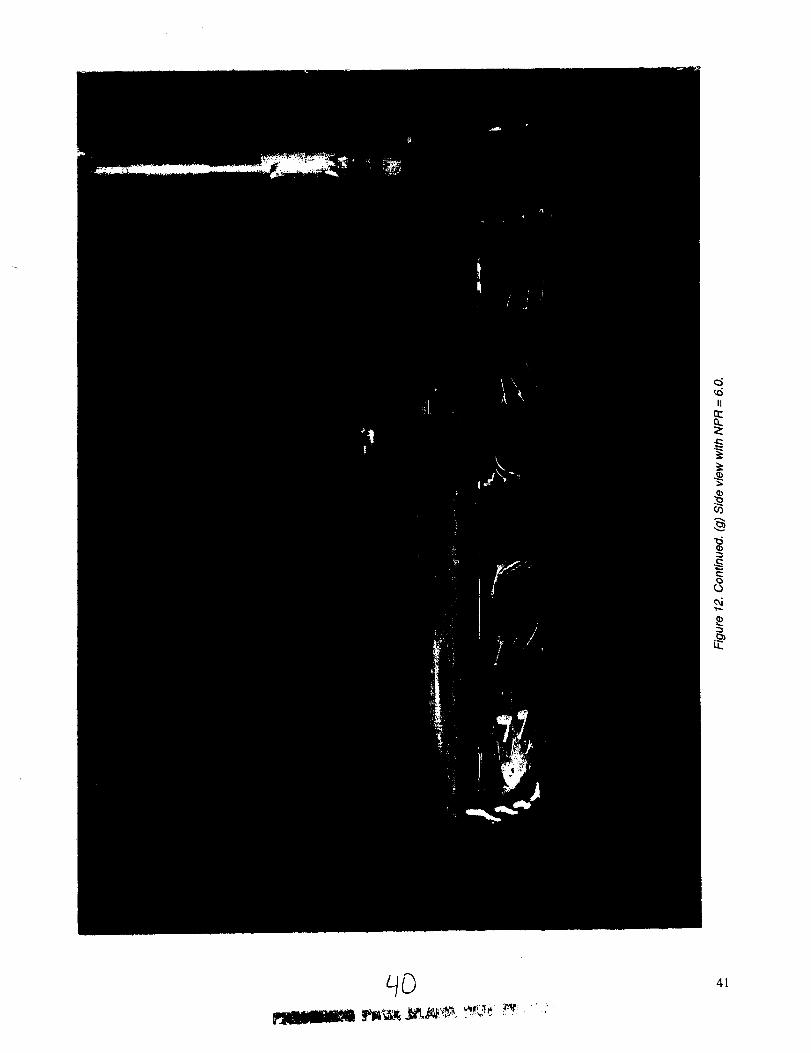
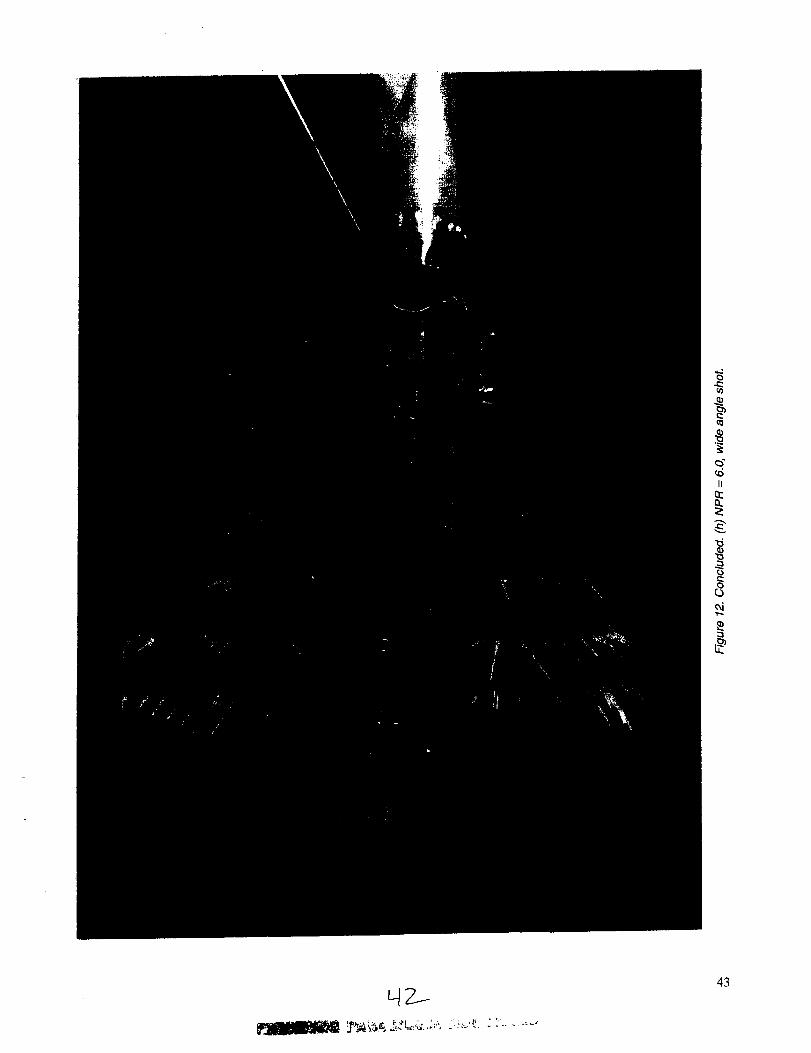
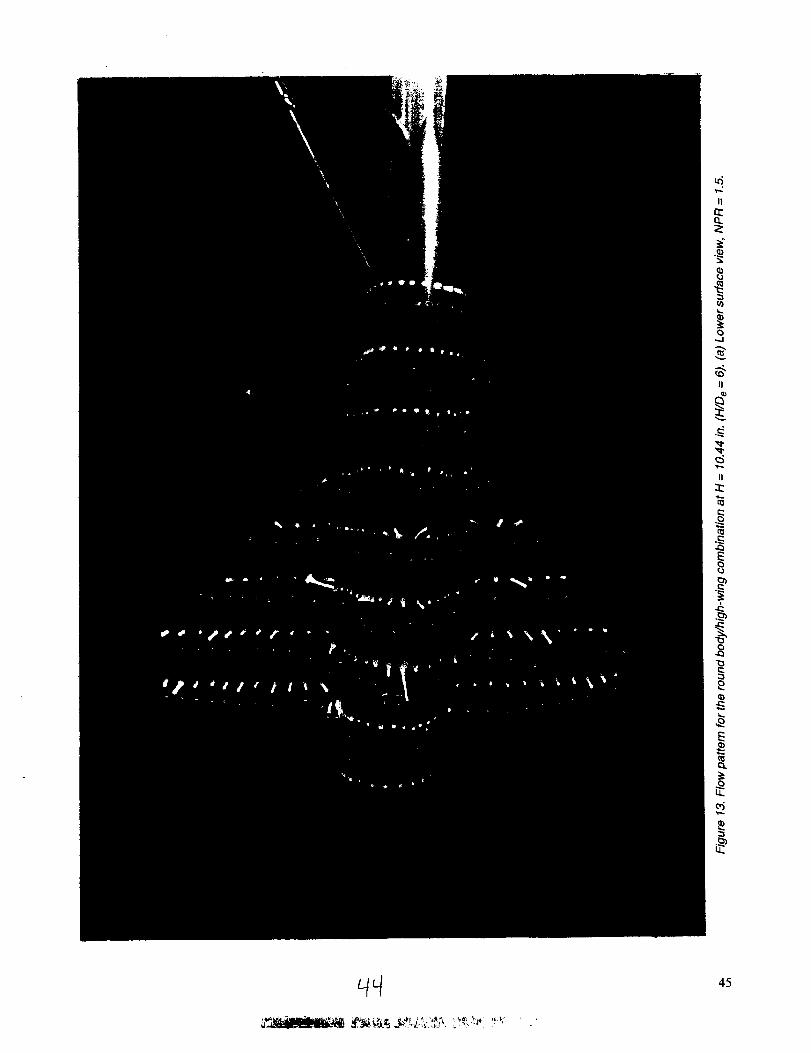
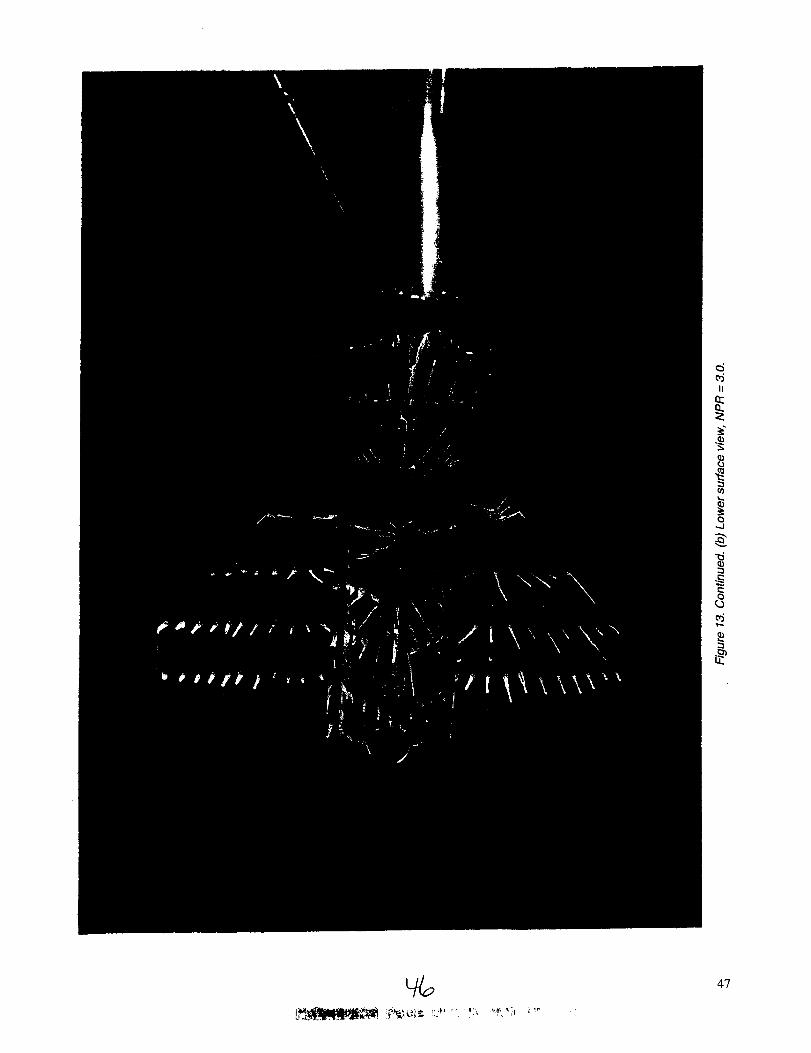
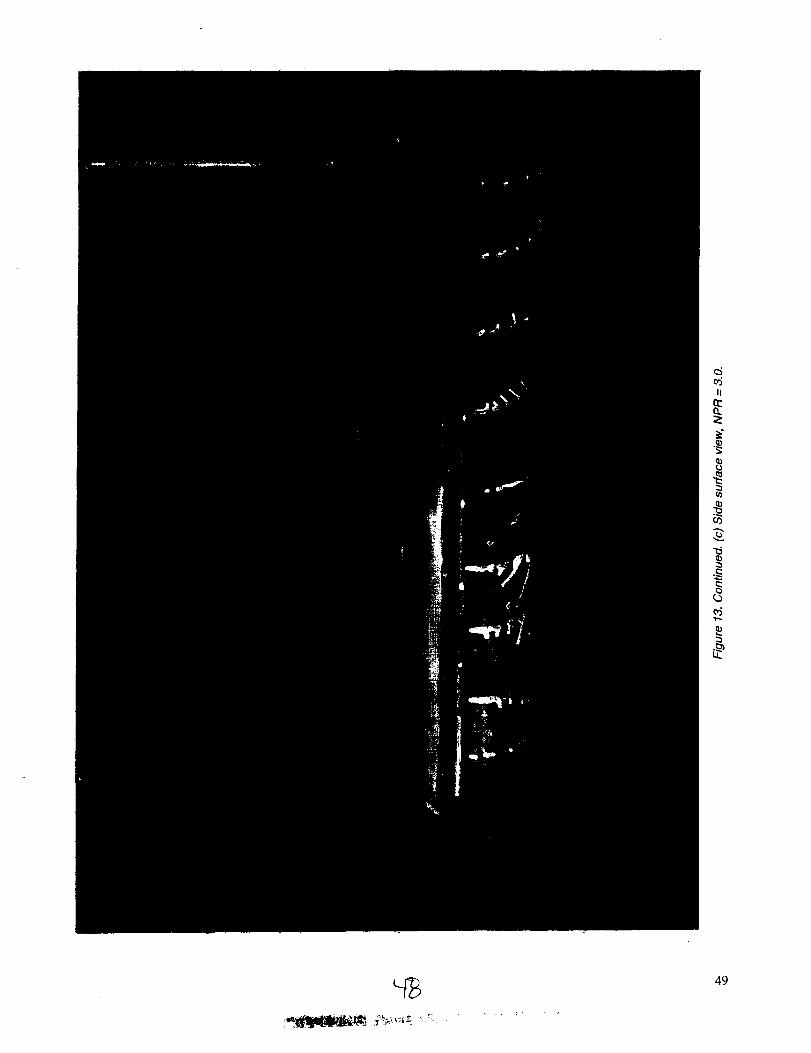
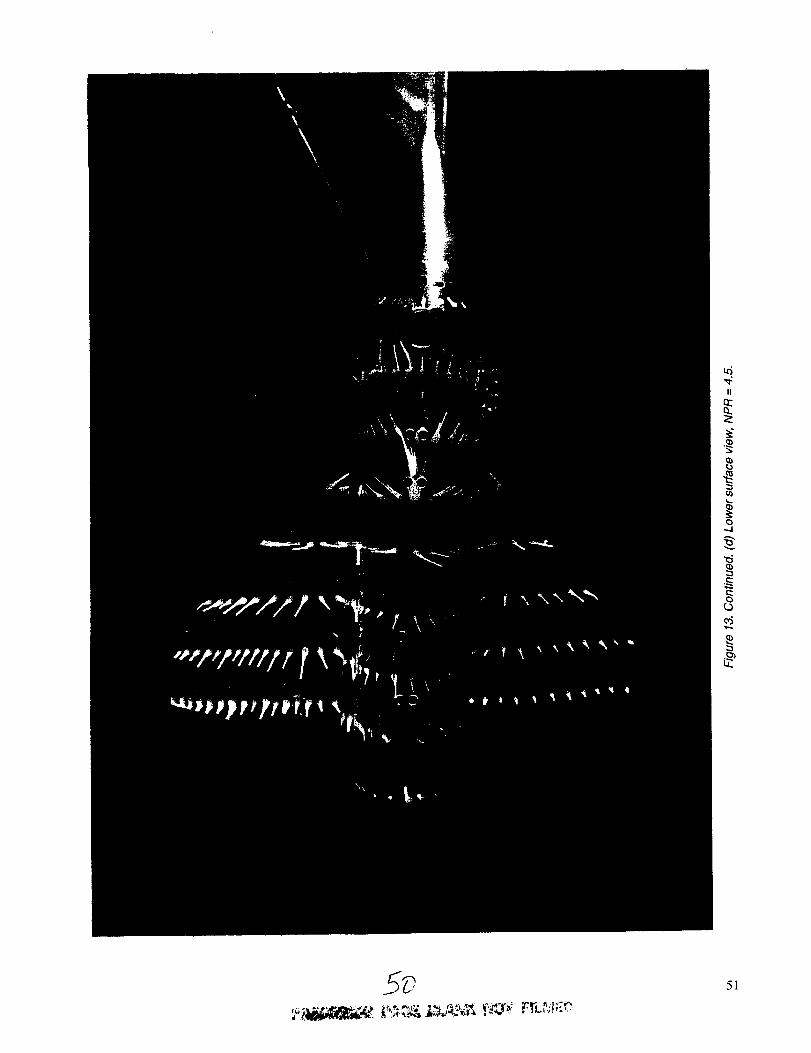
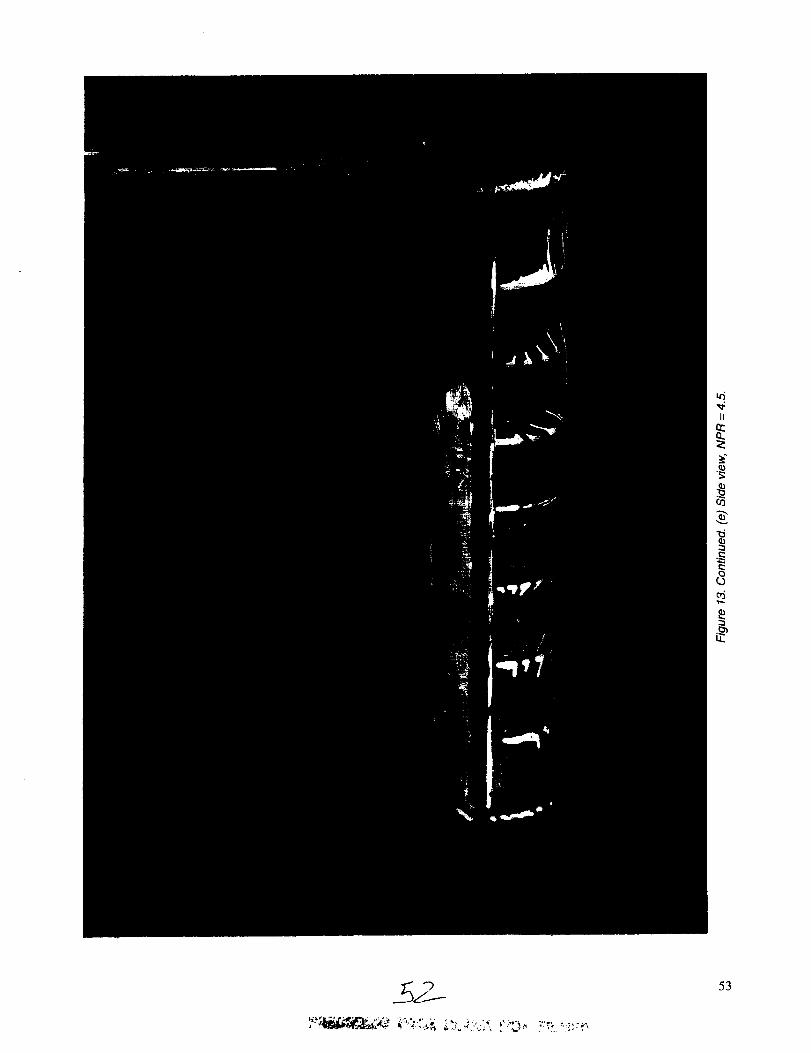
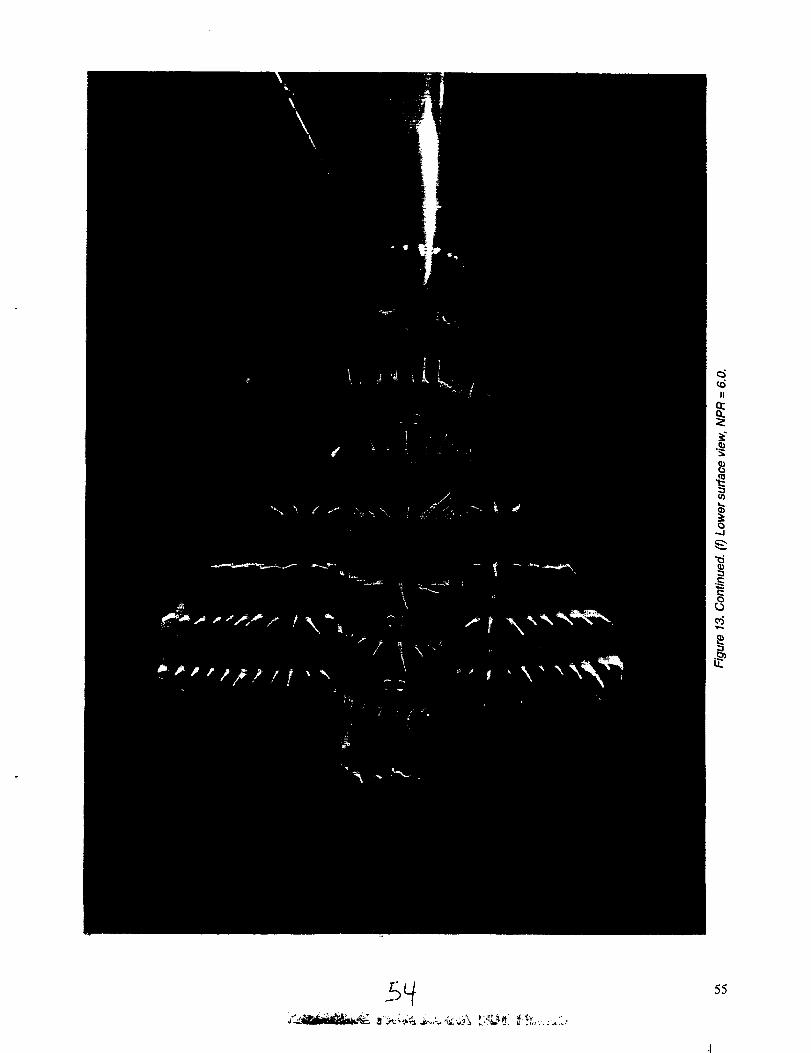
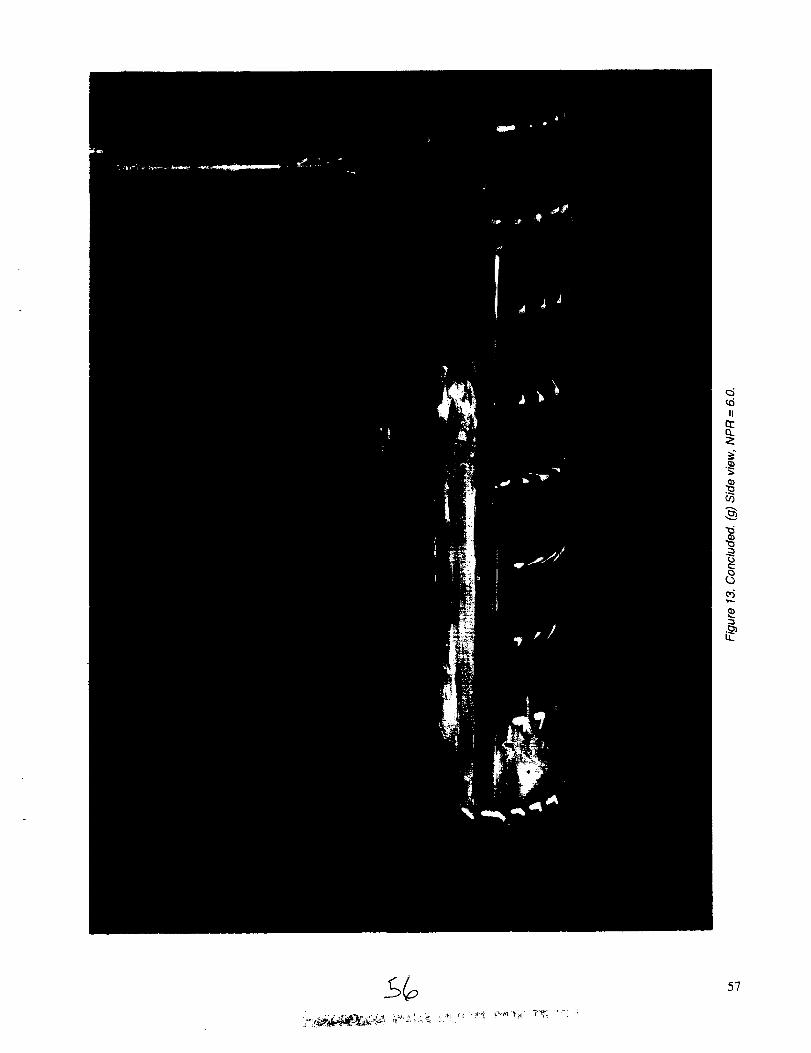
Round Body/High-Wing Combination
The effects of NPR on the undersurface flow for the
round body/high-wing model at a height of 3.48 in.
(H/D e = 2) are presented in figures 12(a)-12(h) and
at a height of 10.44 in. (H/D e = 6) are presented in
figures 13(a)-I 3(g). These photographs were obtainedfrom runs where the NPR was held constant while the
height was varied. For example, figure 13(a) was
photographed at H/D e = 6 and figure 12(a) wasphotographed later when the height was reduced to
H/D e = 2. As a result the manually applied paint
dot pattern varies through the photographs for
figures 12(a)-12(g) where H/D e = 2. These patterns
are exactly the same in the corresponding photographs
for figures 13(a)-13(g) where H/D e = 6. The two
photographs (figs. 12(a) and 13(a)) show the fountain
impingement on a red row of dots. Immediately aft of this
row on the fuselage centerline (fig. 13(a)) is a dot of blue
paint which appears to be larger than adjacent dots. It rantoward the right side of the fuselage. In figure 12(a) this
same dot may be seen to run even farther. Similar
comparisons of flow anomalies for selected paint dots
may be seen for parts (a) through (g) of both figures 12and 13.
The jet-induced fountain impinges the lower surface of
the wing-body at a location midway between the jet exits
and forms a spanwise stagnation line. The fountain
impingement line on the undersurface of the model can be
seen wrapping around the fuselage and extending laterallyon each side of the wing surface, all the way to the lead-
ing edges. The effect of the inlet duct mounting bracketscan be seen in the photographs. As the upwash flow
wraps around the fuselage it separates at the sharp edges
of the brackets, probably forming a separation vortex
along the length of each bracket. These vortices bring the
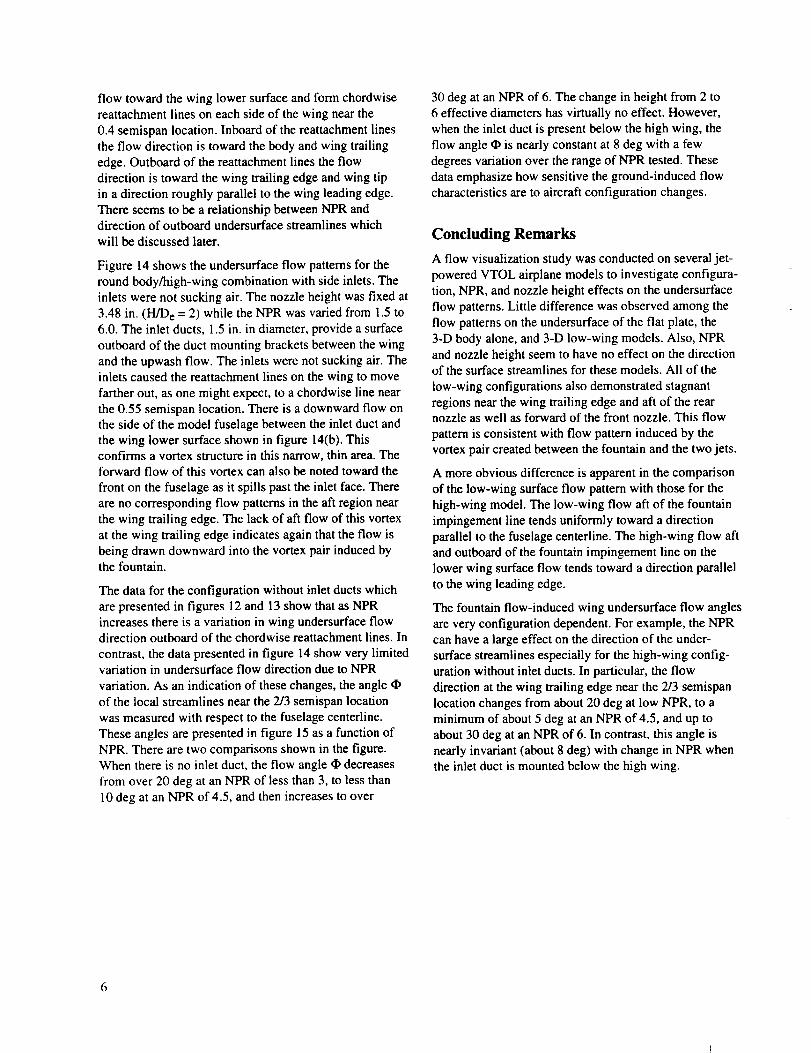
flowtowardthewinglowersurfaceandformchordwisereattachmentlinesoneachsideofthewingnearthe0.4semispanlocation.Inboardofthereattachmentlinestheflowdirectionistowardthebodyandwingtrailingedge.Outboardofthereattachmentlinestheflowdirectionistowardthewingtrailingedgeandwingtipinadirectionroughlyparalleltothewingleadingedge.Thereseemsto be a relationship between NPR anddirection of outboard undersurface streamlines which
will be discussed later.
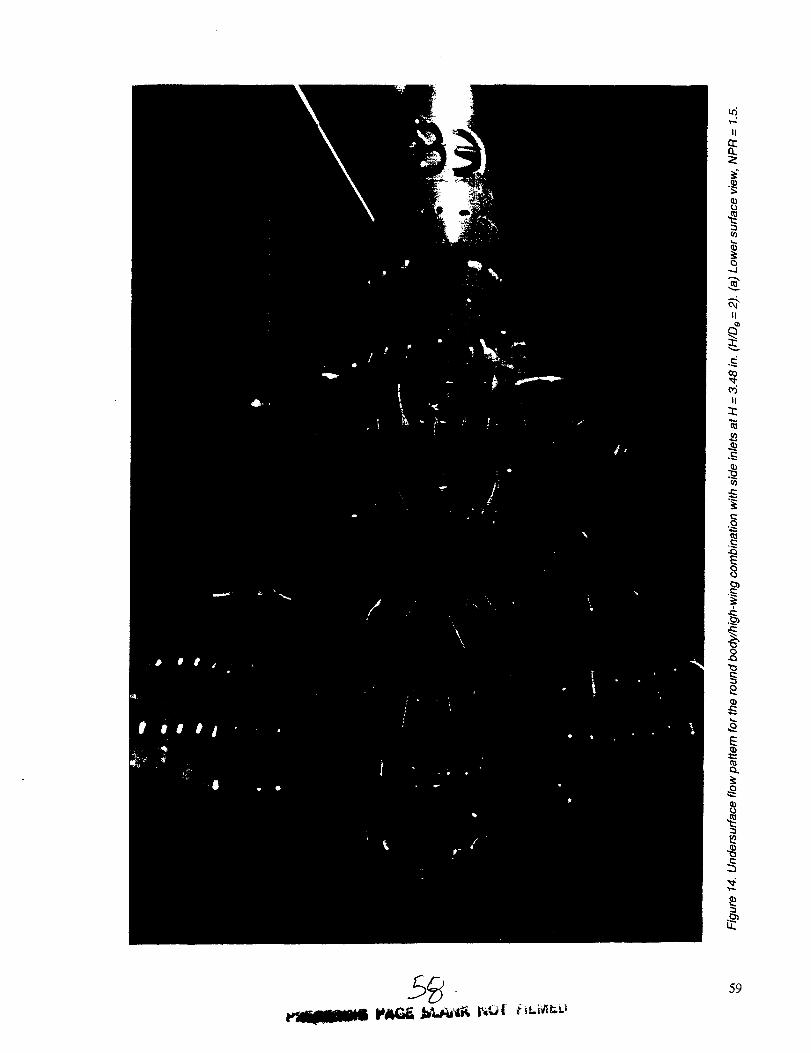
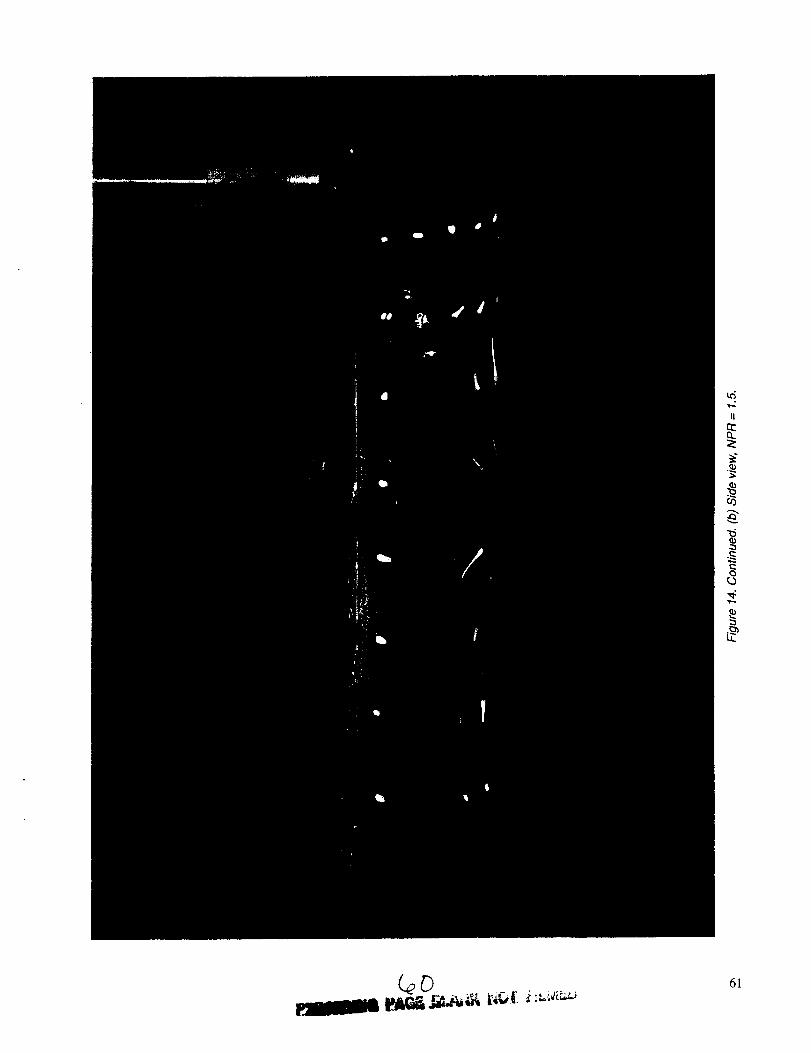
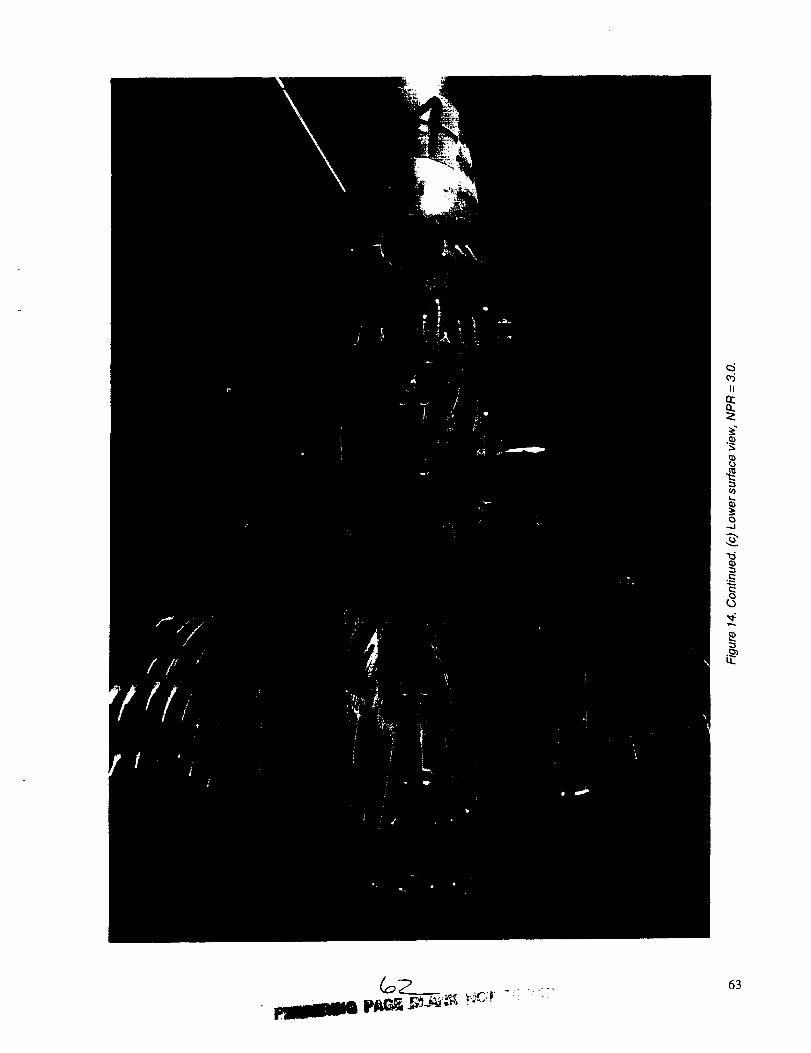
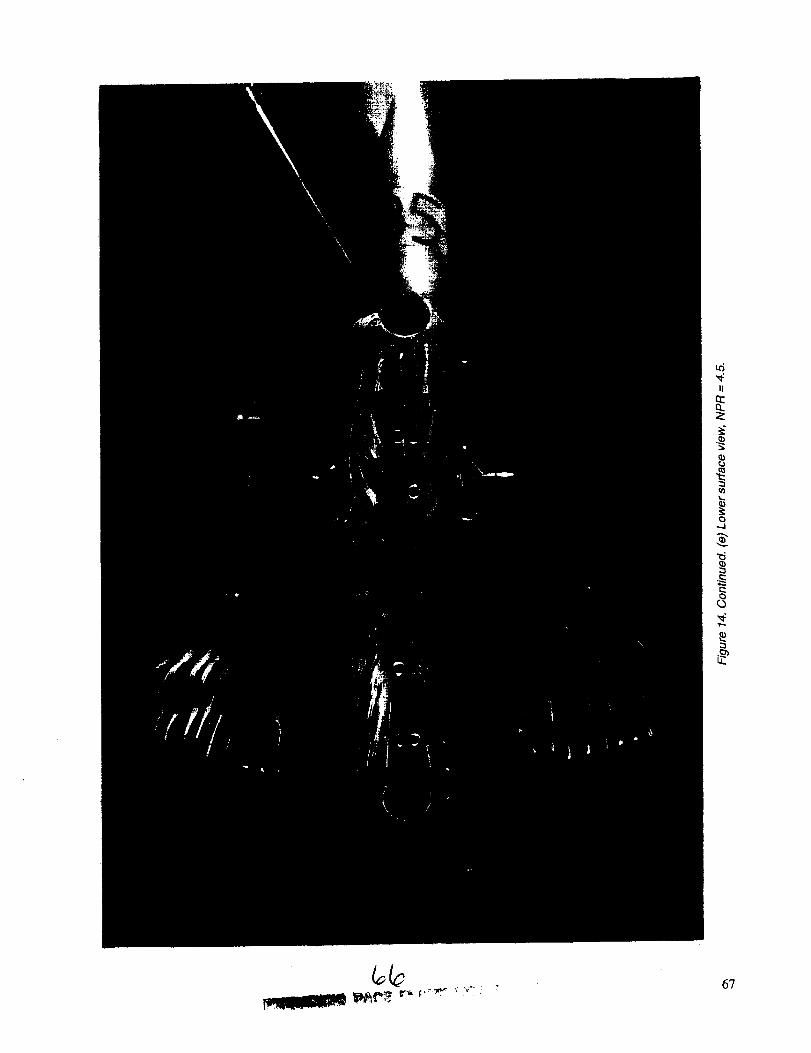
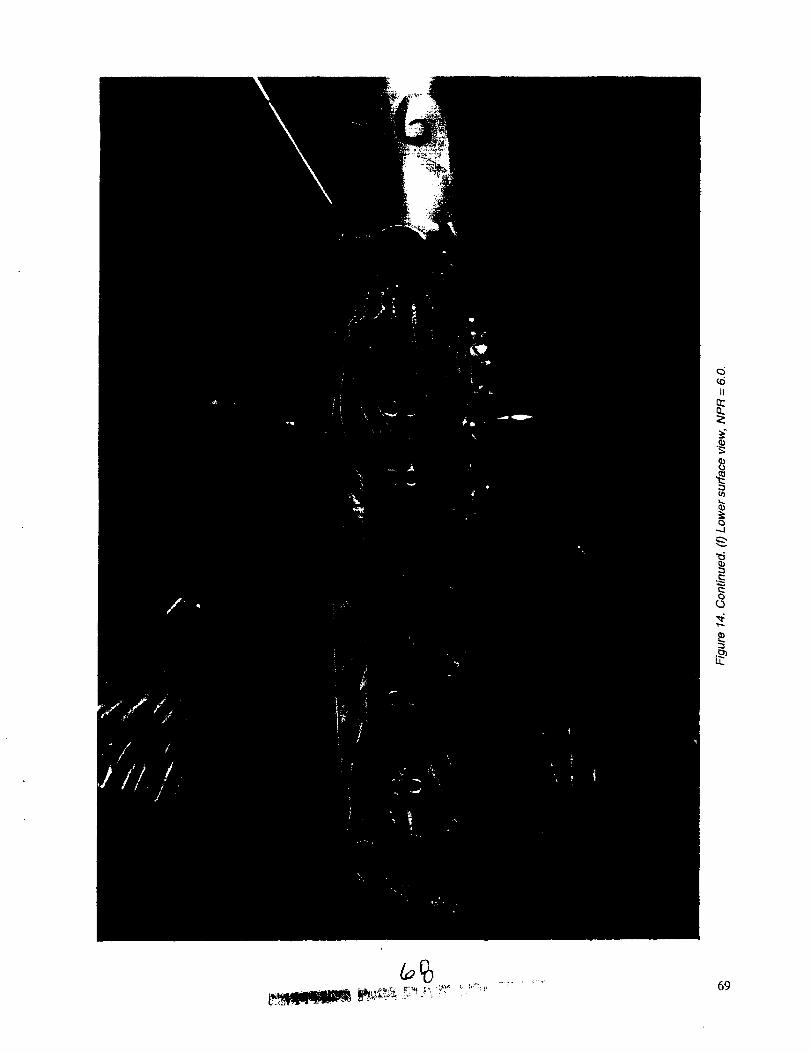
Figure 14 shows the undersurface flow patterns for the
round body/high-wing combination with side inlets. The
inlets were not sucking air. The nozzle height was fixed at
3.48 in. (H/D e = 2) while the NPR was varied from 1.5 to
6.0. The inlet ducts, 1.5 in. in diameter, provide a surface
outboard of the duct mounting brackets between the wing
and the upwash flow. The inlets were not sucking air. Theinlets caused the reattachment lines on the wing to move
farther out, as one might expect, to a chordwise line near
the 0.55 semispan location. There is a downward flow on
the side of the model fuselage between the inlet duct and
the wing lower surface shown in figure 14(b). Thisconfirms a vortex structure in this narrow, thin area. The
forward flow of this vortex can also be noted toward the
front on the fuselage as it spills past the inlet face. There
are no corresponding flow patterns in the aft region near
the wing trailing edge. The lack of aft flow of this vortex
at the wing trailing edge indicates again that the flow is
being drawn downward into the vortex pair induced bythe fountain.
The data for the configuration without inlet ducts which
are presented in figures 12 and 13 show that as NPRincreases there is a variation in wing undersurface flowdirection outboard of the chordwise reattachment lines. In
contrast, the data presented in figure 14 show very limitedvariation in undersurface flow direction due to NPR
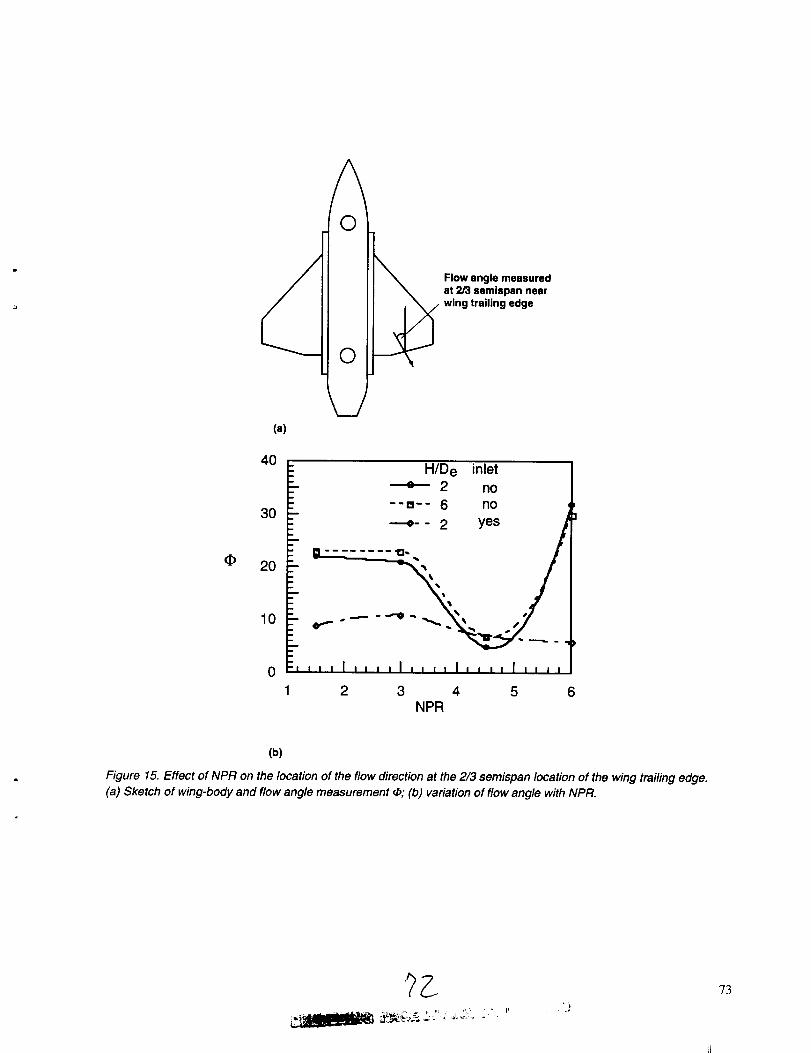
variation. As an indication of these changes, the angle
of the local streamlines near the 2/3 semispan location
was measured with respect to the fuselage centerline.
These angles are presented in figure 15 as a function of
NPR. There are two comparisons shown in the figure.
When there is no inlet duct, the flow angle • decreases
from over 20 deg at an NPR of less than 3, to less than
10 deg at an NPR of 4.5, and then increases to over
30 deg at an NPR of 6. The change in height from 2 to
6 effective diameters has virtually no effect. However,
when the inlet duct is present below the high wing, the
flow angle • is nearly constant at 8 deg with a few
degrees variation over the range of NPR tested. These
data emphasize how sensitive the ground-induced flowcharacteristics are to aircraft configuration changes.
Concluding Remarks
A flow visualization study was conducted on several jet-
powered VTOL airplane models to investigate configura-
tion, NPR, and nozzle height effects on the undersurface
flow patterns. Little difference was observed among the
flow patterns on the undersurface of the flat plate, the
3-D body alone, and 3-D low-wing models. Also, NPR
and nozzle height seem to have no effect on the directionof the surface streamlines for these models. All of the
low-wing configurations also demonstrated stagnant
regions near the wing trailing edge and aft of the rearnozzle as well as forward of the front nozzle. This flow
pattern is consistent with flow pattern induced by the
vortex pair created between the fountain and the two jets.
A more obvious difference is apparent in the comparison
of the low-wing surface flow pattern with those for the
high-wing model. The low-wing flow aft of the fountain
impingement line tends uniformly toward a direction
parallel to the fuselage centerline. The high-wing flow aft
and outboard of the fountain impingement line on the
lower wing surface flow tends toward a direction parallel
to the wing leading edge.
The fountain flow-induced wing undersurface flow angles
are very configuration dependent. For example, the NPR
can have a large effect on the direction of the under-surface streamlines especially for the high-wing config-
uration without inlet ducts. In particular, the flow
direction at the wing trailing edge near the 2/3 semispan
location changes from about 20 deg at low NPR, to a
minimum of about 5 deg at an NPR of 4.5, and up to
about 30 deg at an NPR of 6. In contrast, this angle is
nearly invariant (about 8 deg) with change in NPR whenthe inlet duct is mounted below the high wing.
Appendix--Photographic Procedure for
Oil Flow Visualization
This appendix describes the techniques and the equipment
used to take the photographs presented in this report. This
description has been abstracted from a more detailed
report prepared by the photographers, Tom Reddy andDominic Hart.
The objective of this test was to photograph fluorescentoil and tufts on the model using ultraviolet (UV) filters on
the light source, more commonly known as black lights.To better illuminate the model, flash units were neces-
sary. Because the UV filters absorb so much light, the
output from each flash head had to be high.
In the tests the primary variable was model height. Height
changes were achieved by moving the ground plane
vertically relative to a fixed model from a distance of54 in. to a distance of 3.5 in. To obtain photographs ofthe bottom of the model lower surface, a camera was
mounted in the ground plane with a transparent plasticsurface. The camera was selected to be able to still show
all (or most) of the model in the frame. For the same
reasons, light stands could not be positioned very close to
the platform because of the varying clearance between the
platform and the model. For safety reasons, people werenot allowed in the test area while the air was blowing so
the camera was triggered remotely from the control room
(a distance of about 50 ft).
Equipment and Supplies
A partial list of the equipment and supplies used is listedbelow:
• one 35 mm auto focus camera (Nikon F4) with time
code capabilities
• one 20 mm auto focus lens fl2.8 (Nikon)
• two Hassleblad ELM bodies
• two Hassleblad A12 film magazines
• one 250 mm lens (Hassleblad)
• one 80 mm lens (Hassleblad)
• one 50 mm lens (Hassleblad)
• four Norman LH2000 fan cooled lamp heads
• four non-UV-coated flash tubes
• four 6 in. round black light filters
• film: Kodak VPH ASA 400, Kodak T-Max 400, 120,
and 135 format
Setup Procedure
1. Setup of camera one, auto focus, 35 mm withthe 20 mm lens
A small tripod was placed on the scissor lift directly
under the Plexiglas window. Camera one was set to
print the hour/minute/second on the film and the framecount outside the frame. The camera was loaded with
T-Max 400 film for an exposure test. The camera was setto manual mode at 1/125 second shutter speed and started
at the maximum f stop for the film test, stopping down
one stop for each of the following exposures. The camerawas then attached to the tripod. The receiving unit of the
radio slave was placed next to the tripod and the cord wasattached to the camera. The antenna was placed so that it
would not touch any metal (it was taped to a plastic part
of the tripod so it would not move during the test);otherwise, misfires or nonfires would occur. The multiple
synchronization plug was placed into the camera and then
two 12 fl synchronization cords were run from the plug toeither side of the test platform (these were later attached
to the power packs).
2. Setup of the Hassleblad cameras two and threefor side views
A second camera was located in a fixed location at the
height of the nonmoving model to obtain a model side
view. A third camera was set up on a tripod locatedfarther from the test area to show a side view of the entire
area. A motor driven film advance was needed because
the camera was inside the test area. Since the model was
suspended 12 ft off the ground the camera was mounted
on a tripod located on a tall, stable platform. Once the
camera was on the platform, the 250 mm lens wasfocused on the model. The radio slave was set up next to
the camera and the cord was attached. A 12 ft synchroni-zation extension cord was run from the camera to the
platform. This was later attached to two other cords and
then to the power packs. The shutter speed was set to1/125 second and the aperture was set wide open to
start the film test. The film pack was loaded back with
T-Max 400 film and placed on the camera.
3. Setup of the flash heads to hold the Lrv filters
An adaptor was built to fit filters to the flash heads.Four 6 in. x 4 in. strips were cut out of a thin sheet ofaluminum. The aluminum was then twisted into circle
tubes the size of the flash head and carefully taped to
form the adaptors. The adaptors were made taller than theflash tube so the filters would not rest on the flash tubes.
Finally, the filters were placed on the aluminum tubes and
held in place with safety wire. If the modeling light is
accidentally left on, the heat would damage the flash
head. Therefore the modeling light was taken out of each
of the lamp heads to prevent overheating because the
UV filters transmit only the ultraviolet light while all
other wavelengths stay inside, including infrared heat.
4. Mounting of the flash unit to the A-frame
The flash units were mounted on the A-frame surrounding
and supporting the test model to ensure the light stands
were not in the jet-induced flow. Three flash heads were
placed on the A-frame and one was attached to a boom
arm mounted to the A-frame. Three large C-clamps andthree metal dowels machined to fit into the flash head
were used. Two areas on the dowel were flattened to fit
securely between the A-frame and C-clamp. When
attached to the A-frame, the flash heads were positioned
high enough to provide light between the platform and the
model when the platform was at its closest point.
5. Setting the power packs and synchronization cords
Four Norman P2000 power packs were used, one for each
light, two on each side of the A-frame. The power settingfor each light was 2,000 watts. Two power packs were
plugged into one outlet on one side of the building and
two at the other end. Separating the packs reduced thechance of a blown circuit. Because of condensation
during the test run, plastic bags covered the power
packs to keep them from getting wet. Each camera had
two flash heads and two power packs. The synchroni-
zation cords were attached to the power packs allowingeach camera to have one flash head on either side of
the A-frame.
Film Test
For the film test, T-max 400 film and VPH film rated at
ASA 400 were used. Initially, the apertures were set wide
open on both cameras. An exposure was made using each
camera and its corresponding power packs. Cameras one
and two were stopped down one stop and another
exposure was made. The process was repeated until the
smallest aperture on both cameras was reached. The film
was processed and analyzed to see which aperturesworked best with each film and camera combination.
The results showed that on camera one, f/4 worked well
for both black and white and color. F/5.6 gave a good
exposure on cameras two and three. The apertures wereset and remained the same for the duration of the test. The
exposure was set at 1/125 second for both cameras twoand three.
Comments
The images were clear and the information from the oil
flow showed up as brilliant and vibrant colors. They gave
an accurate display of the flow around the airplane model.The background fluorescent safety light used for the
35 mm gave a green cast to the side of the model and, in
some cases, it put a bright highlight on the model. It was
necessary to have it on at all times, but the use of a
magenta filter over it, as well as the flash units, would
have cut down on the green cast and helped in the color
balance and exposure.
Visualization of the flow in the region of the nozzles was
made possible by shining UV light on the paint/oil drops
painted on the model. The first camera, located in the
ground plane, was auto focus because of the 50.5 in.
distance it moved during the runs. Even at the closedistances to the model, the image was still in focus, which
would have been impossible with a standard manual focus
camera. The use of four 2,000 watt power packs for the
flash heads was also a necessity because of the intensity
loss with the filters and the distance from the subject.
Setting the exposure at f/4 resulted in a better depth offield and showed the entire model in focus. A second
camera was located in a fixed location at the height of the
nonmoving model. A third camera was set up on a tripodlocated farther from the test area to show a side view of
the entire area. This camera was able to show the visible
air blown out of the nozzles in ground proximity. For
the exposure, a long shutter release cable was used to
manually open and close the lens. When it was time to
expose the other two cameras, the shutter was opened for
normal exposures. Cameras one and two fired their own
strobes; the third camera, whose lens was open, was
exposed in the process. Its lens was then closed and the
camera would automatically advance the film for the
next exposure.
References
1. McLemore, H.; and Smith, Charles C., Jr.: Hot-Gas
Ingestion Investigation of Large-Scale Jet VTOL
Fighter-Type Models. NASA TN D-4609, 1968.
2. McLemore, H. Clyde; Smith, Charles C., Jr.; and
Hemeter, Patricia G.: Generalized Hot-Gas
Ingestion of Large-Scale Jet VTOL Fighter-typeModels. NASA TN D-5581, Jan. 1970.
3. Williams, John; and Wood, Maurice N.:
Aerodynamic Interference Effects With Jet-LiftV/STOL Aircraft Under Static and Forward-
Figure 4. Sketches of nozzle and plenum assembly. (a) Details of thenozzle exit.nozzle and plenum assembly; (b) detail of
P_glJll tLI_G,E BLANK NOT FILMED 15
Figure 5. Kiel probe used in nozzle.
16
(a)
(b)
III
14.70" "
_ 8.34" ----_
9.66"
_--_ 7.34"'----_p . o
/MOMENT REFERENCE /
TASK BALANCE (1.5 MK [[ C)
ATTACHMENT POINT
24.34"
4.00"
@
t1.00"
CONSTANT
J
Splan/Sje t = 50.2
Sie t = 2.38 SQ. IN.
= 9.95 IN.
(EQUIVALENT MODEL
DIAMETER)DIMENSIONS IN INCHES
.05"
.25"
3.00"
T10.00"
L 4.00" I
2_._ /I ASPECTRATIO=2.28MOMENT REFERENCE" ,_ / / Splan/Sje t =105
TASKBA'ANCE,5MK"Cr\'_ // Sj,,=23BSOINATTACHMENT POINT _ _ I I 5 = 16 9 IN
1.00" " _ _ I I (EQUIVALENT MODEL
CONSTANT _ DIAMETER)DIMENSIONS IN INCHES
.05"
.25"
L 34.00" -J,Figure 6. Flat-plate mode/. (a) Body alone; (b) flat-plate model, wing/body combination.
]7
'91 34.00 In.
4.00 In. diam. 1.50 in. diam.
/
(s)
Duct mountingbracket
Task balance (1.SMK llC)attachment pointcenter 16.95 in. from nose
24.36 in.
II
--- 3.00 in.
34.00 in.
(b)
7.40 in.
i- Fuselage
1.50in._ _ /__ _
diam. "_--_"_/ __'_
2.15in.J \__Jj \ / \'__J_
diam. • v _, ._. fj v ;inlet
(c) (d)
Figure 7. Three-dimensional round model. (a) Top view of body alone model with side inlets, (b) side view of the body
alone model with side inlets; (c) front view of the low-wing model with side inlets; (d) front view high-wing model withside inlets.
18
c_
II
c_Q_
II
c_
c_II
@Q)
E
c_L
q)
c_
19
II
cc
II
O0
c_II
:Z:
.Q
0
@q)
E
q)
2O
P_ PAGE BLANK NOT FILP,',_:_;,_)
21
II
II
II
:Z::
-w,...
23
25
11
II
II
Q)
27
L_
II
.£
,,.,.I
II
II
k_C_
i|
2
Q)
I
29
c_c_
II
_J
c_
_qr4
_L_' _ _, _ _ • • • x
c_oiII
(o
"dq)
J_ 33
li
,-,..I
35
L_
Ii
_ _J_ _,_l_ _IC_ _ _ __
37
c_II
Q_
C__J
q_
c_
_ W_r _ _ _ _!i_1_r,_ _
39
_5II
q:q..
cs_
_S
41
c_
II
Q.
g
g
43
L_
11
c_Q_
c_
C_..J
II
c5
II
E
l
C_
Q)
E
c_
45
II
,,,,,,I
4?
c_
II
q_
Q_
49
L_
II
c_Q_
Q_r_
C_
Q_
c_
_ _t_ _ w- _-t'l_Lr_ _o'
51
II
"15
_g2-- 53
c_
C_q_
_J _ _o_ _ _ _i _
55
c_II
c_Q_
_ _ _ .... _ _,_ _r_ _ _ __i _
57
tl
.,,..I
II
II
E
2
E
59
II
61
c_
II
c_
Q_
C__J
63
c_
II
Q_
Q_
65
L_
II
a_c_
C__J
Q_
67
al
o
"dQ_
L_
69
c_
I!
_r4
i__ I _ _ _r__ _ 71
Form Approved
REPORT DOCUMENTATION PAGE oM8No.o7o4.o188
Public reporting burden for this collection of information is estimated to average 1 hour per response, including the time for reviewing instructions, searching existing data sources,
gatheringand maintaining the data needed, and completingand reviewing the collectionof information. Send comments regardingthis burden estimate or any other aspect of thiscollectionof information,includingsuggestionsfor reducingthis burden, to WashingtonHeadquartersServices, Directorate for informationOperations and Reports, 1215 JeffersonDavis Highway, Suite 1204, Arlington, VA 22202-4302, and to the Office of Management and Budget, Paperwork Reduction Pro act (0704-0188), Washington, DC 20503.
1. AGENCY USE ONLY (Leave blank) 2. REPORT DATE 3. REPORT TYPE AND DATES COVERED
January 1995 Technical Memorandum4. TITLE AND SUBTITLE 5. FUNDING NUMBERS
Flow Visualization Studies of VTOL Aircraft Models
During Hover In Ground Effect
6. AUTHOR(S)
Nikos J. Mourtos,* Stephane Couillaud,* Dale Carter,* Craig Hange,
Doug Wardwell, and Richard J. Margason
7. PERFORMING ORGANIZATION NAME(S) AND ADDRESS(ES)
Point of Contact: Richard J. Margason, Ames Research Cente_ MS 247-2, Moffea Field, CA 94035-1000;
(415) 604-5O33*San Jose State University_ San Joser California.
12a. DISTRIBUTION/AVAILABILITY STATEMENT
Unclassified -- Unlimited
Subject Category 02
12b. DISTRIBUTION CODE
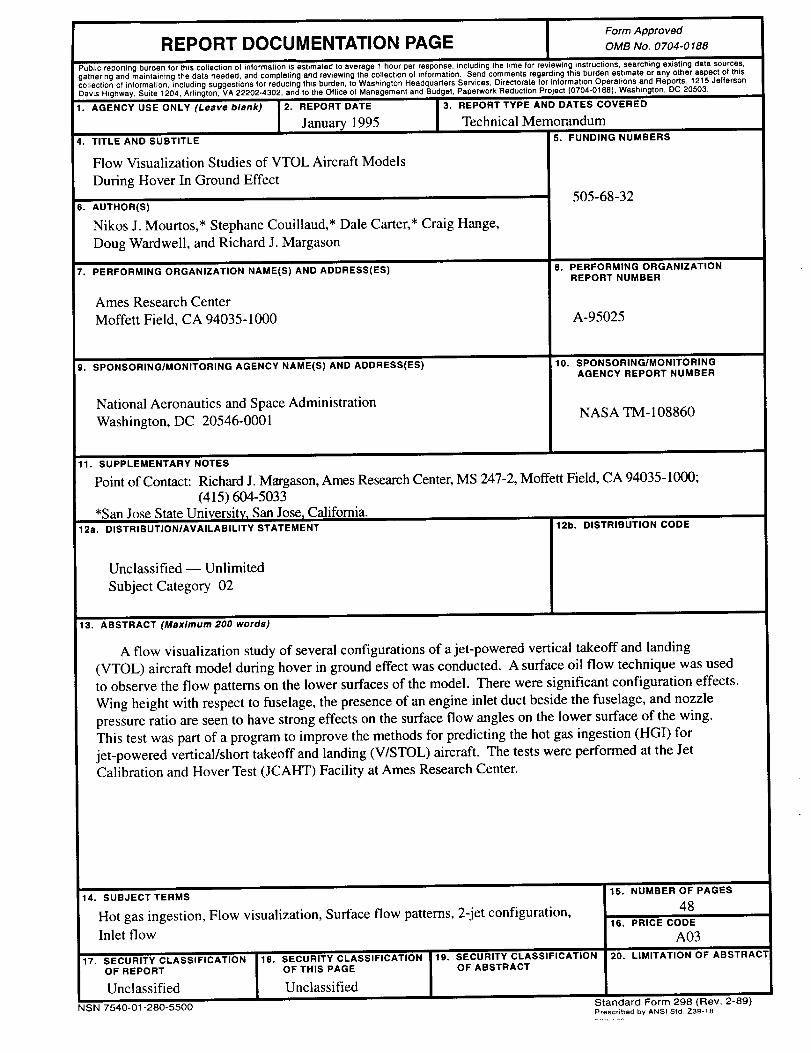
13. ABSTRACT (Maximum 200 words)
A flow visualization study of several configurations of a jet-powered vertical takeoff and landing
(VTOL) aircraft model during hover in ground effect was conducted. A surface oil flow technique was used
to observe the flow patterns on the lower surfaces of the model. There were significant configuration effects.
Wing height with respect to fuselage, the presence of an engine inlet duct beside the fuselage, and nozzle
pressure ratio are seen to have strong effects on the surface flow angles on the lower surface of the wing.
This test was part of a program to improve the methods for predicting the hot gas ingestion (HGI) for
jet-powered vertical/short takeoff and landing (V/STOL) aircraft. The tests were performed at the JetCalibration and Hover Test (JCAHT) Facility at Ames Research Center.
14. SUBJECT TERMS
Hot gas ingestion, Flow visualization, Surface flow patterns, 2-jet configuration,
Inlet flow
17. SECURITY CLASSIFICATIONOF REPORT
Unclassified
NSN 7540-01-280-5500
18. SECURITY CLASSIFICATIONOF THIS PAGE
Unclassified
19. SECURITY CLASSIFICATIONOF ABSTRACT
15. NUMBER OF PAGES
4816. PRICE CODE
A0320. LIMITATION OF ABSTRACI
Standard Form 298 (Rev. 2-89)Prescribed by ANSI Std. Z39-18