24
2016 - 2017

2016 - 2017
1
A word from our Co‐Director, Don
Florida’s Positive Behavioral Interventions & Support
The 2016‐2017 year was an exciting one for PBIS in Florida. We neared 1900 total schools trained
in PBIS Tier 1 with 84% of the schools remaining active. We continued to see a high level of
implementation from most (74%) of Florida schools and corresponding better outcomes (lower
ODRs and OSS) from those implementing schools. All of Florida schools reporting outcomes also
indicated that nearly 87% of all Florida students receive only 0‐1 referral each year, another sign
of effective implementation.
While these outcomes are notable, the Florida PBIS Project was most pleased with the response
of our schools and districts to the increased attention and support we provided to address equity
issues and revise our model school application to require schools to begin to address equity. We
saw tremendous increases of schools that began to report to our Project equity data for ODRs
(up 17%) and for OSS (up 38%). This reporting of data is evidence that districts and schools are
taking the first steps to gather necessary data to understand and address the issues impacting
equity. The Florida PBIS Project supported the districts in these equity issues by assisting with
the collection and analysis of the data necessary to understand the degree of disproportionality
in the district and schools. We also supported districts and schools with effective problem‐solving
to address the equity issues, provided training and support to develop culturally responsive
schools, and hosted many focus groups to give families and students a voice and provide feedback
to the district on equity issues. We are excited that we are starting to see some results from
those activities.
In 2016‐2017, we changed our model school process to only look at Tier 1 implementation but to
require evidence of student outcomes for a silver level award and evidence of attention to equity
issues for a gold level award. We were surprised and excited that 17% of all active schools
achieved model school status in 2016‐2017 and 160 schools achieved gold status (a nearly 100%
increase over 2 years ago). Our goal is to continue to increase the requirement for schools to be
responsive to improving all student outcomes including those of student groups that have not
experienced equitable discipline outcomes in the past. In the future, we will also be planning for
how we will recognize schools who are implementing Tiers 2 and 3 PBIS with fidelity.
Contact Information:
Florida Center for Inclusive Communities
● Department of Child & Family Studies
● College of Behavioral & Community Sciences
● University of South Florida
● 13301 Bruce B Downs
MHC 2113A Tampa, Florida
33612
http://www.flpbis.org
813.974.6440 (phone) 813.974.6115 (fax)

2
Our Mission
Table of Contents Page
Percent of Schools Trained in Districts 3
Percent of Active Trained Schools 3
Number of Schools Trained by Year 3
Number of Trainings and Technical Assistance Activities 4
Satisfaction with Training and Technical Assistance 4
BoQ and Fidelity of Implementation by School Year 5
ODR Rates by Level of Implementation by School Year 6
OSS Rates by Level of Implementation by School Year 6
Change in Outcomes from Baseline to Year 1 7
Statewide Core Effectiveness 7
ODR Rates for Project Schools with Baseline and 3 Years 8
OSS Rates for Project Schools with Baseline and 3 Years 8
Investigating Discipline Disparities 9
About Florida’s Districts: Exceptional Districts 11
About Florida’s District: Size‐Alike Comparisons 12
Restraint and Seclusion 13
District Coordinator Satisfaction 15
School Climate Transformation 16
Response to Intervention for Behavior 17
Model Schools 18
Spotlight on Social Media 19
Closing Words from our Co‐Director, Heather 20
Increase the capacity of Florida’s school districts to use team‐based planning
and problem‐solving to implement positive behavioral interventions and
supports within a multi‐tiered system of support.
Co‐Directors Don Kincaid
Heather Peshak George
Staff Supporting
Districts Kathy Christiansen
Karen Cox
Dia Davis
Lauren Evanovich
Brian Gaunt
Rose Iovannone
Ashley MacSuga‐Gage
Stephanie Martinez
Devon Minch
Martha Murray
Catherine Raulerson
Therese Sandomierski
Robyn Vanover
Chris Vatland
Rebecca Webster
Anna Winneker
Support Staff Wendy Adkins
Michael Greeson
This product was developed in collaboration with several projects located at the University of South Florida, Department of Child & Family Studies: (a) Florida’s Positive Behavioral Interventions and Support Project, funded by the State of Florida, Department of Education, Bureau of Exceptional Education & Student Services, through federal assistance under the Individuals with Disabilities Education Act (IDEA), Part B; (b) Florida School Climate Transformation, funded by the State of Florida, Department of Education, Bureau of Exceptional Education & Student Services, through the federal Office of Safe and Healthy Students, U.S. Department of Education (S184F140023); and (c) the Technical Assistance Center on Positive Behavioral Interventions and Supports, Office of Special Education Programs, U.S. Department of Education (H326S130004).
FLPBIS Project ‐ A Multi‐Tiered Support System

3
87 8154
82
120
220
387
205
118
69 59
93 8058
0
50
100
150
200
250
300
350
400
450
2003‐2004
2004‐2005
2005‐2006
2006‐2007
2007‐2008
2008‐2009
2009‐2010
2010‐2011
2011‐2012
2012‐2013
2013‐2014
2014‐2015
2015‐2016
2016‐2017
Total Schools Receiving Initial Training
Florida Schools' Initial PBIS Tier 1 Training
Training
Percent of Schools Trained in Districts (Note: Map may not represent currently active schools)
1593
300
0%
10%
20%
30%
40%
50%
60%
70%
80%
90%
100%
1
Percent of Schools Active
1893 Total Schools Trained
Inactive Schools Statewide
Active Schools Statewide
84% Remain active
90%‐100%70%‐89% 50%‐69% 25%‐49% 1%‐24% 0%

4
56% of active PBIS
districts in Florida
have trained at
least 90% of their
schools. Only 16%
of active districts
have trained fewer
than half of their
schools.
74 schools teams in 16 districts were retrained in the Tier 1
226 previously trained school received supplementary Tier 1 training
37 schools completed Tier 2 & 20 schools completed Tier 3 training
All 67 districts received some type of technical assistance in 2016‐2017
5.25.4 5.5 5.45.3
5.5 5.5 5.5
0.0
1.0
2.0
3.0
4.0
5.0
6.0
IncreaseKnowledge
Meets Objectives UsefulInformation
RecommendOthers
Average Rating 1 (not at all) ‐6 (greatly)
Training Satisfaction2015‐2016 N=1998 2016‐2017 N=1992
Satisfaction
On a scale of 1‐ 6,
with 6 being best,
all elements of
trainings have
been consistently
rated 5 or higher.
Annually across the
last 5 years the
number of initial
PBIS Tier 1
trainings has
remained below
100. However,
this year, we have
provided over 250
tier 1 retraining
and/or
supplementary
trainings
(refresher,
problem solving,
disproportionality).
Overall Activites
126 Trainings
1997 Technical Assistance activities
5
73 7667
71
0
20
40
60
80
100
2015‐16N=473
2016‐17N=419
Average Percentage Score
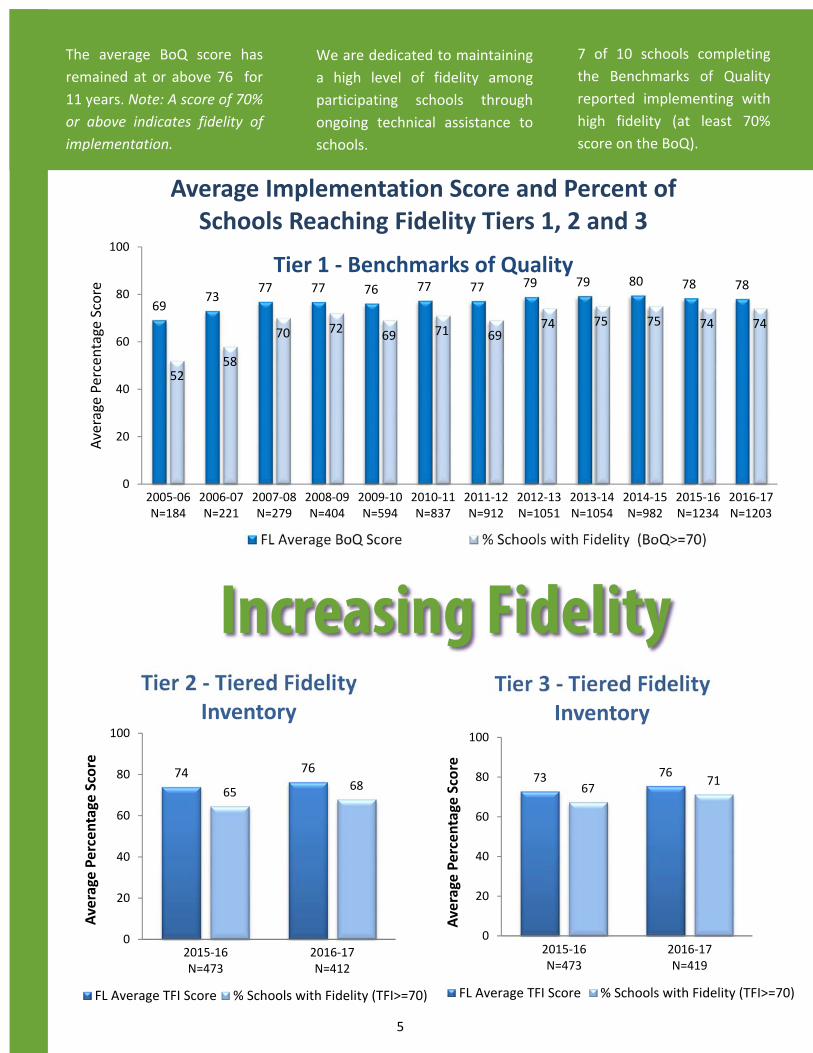
Tier 3 ‐ Tiered Fidelity Inventory
FL Average TFI Score % Schools with Fidelity (TFI>=70)
74 76
6568
0
20
40
60
80
100
2015‐16N=473
2016‐17N=412
Average Percentage Score
Tier 2 ‐ Tiered Fidelity Inventory
FL Average TFI Score % Schools with Fidelity (TFI>=70)
6973
77 77 76 77 77 79 79 80 78 78
5258
70 7269 71 69
74 75 75 74 74
0
20
40
60
80
100
2005‐06N=184
2006‐07N=221
2007‐08N=279
2008‐09N=404
2009‐10N=594
2010‐11N=837
2011‐12N=912
2012‐13N=1051
2013‐14N=1054
2014‐15N=982
2015‐16N=1234
2016‐17N=1203
Average Percentage Score
Average Implementation Score and Percent of Schools Reaching Fidelity Tiers 1, 2 and 3
Tier 1 ‐ Benchmarks of Quality
FL Average BoQ Score % Schools with Fidelity (BoQ>=70)
Average score on the Benchmarks of Quality
remained constant at 79%. The average
BoQ score has remained at or above 76%
for 8 years. Note: A score of 70 or above
indicates fidelity of implementation.
We highly value implementation
fidelity and are dedicated to
maintaining a high level among
participating schools through on‐
going technical assistance to districts.
7 of 10 schools completing
the Benchmarks of Quality
reported implementing with
high fidelity (at least 70%
score on the BoQ).
The average BoQ score has
remained at or above 76 for
11 years. Note: A score of 70%
or above indicates fidelity of
implementation.
We are dedicated to maintaining
a high level of fidelity among
participating schools through
ongoing technical assistance to
schools.
Increasing Fidelity
6
97
10799
93 9086
99
8177
6763
54 52 55 52 50
0
20
40
60
80
100
120
2009‐1021%
2010‐1137%
2011‐1236%
2012‐1342%
2013‐1442%
2014‐1536%
2015‐1647%
2016‐1739%
Average # of ODRs per 100 Students
Implementation Level
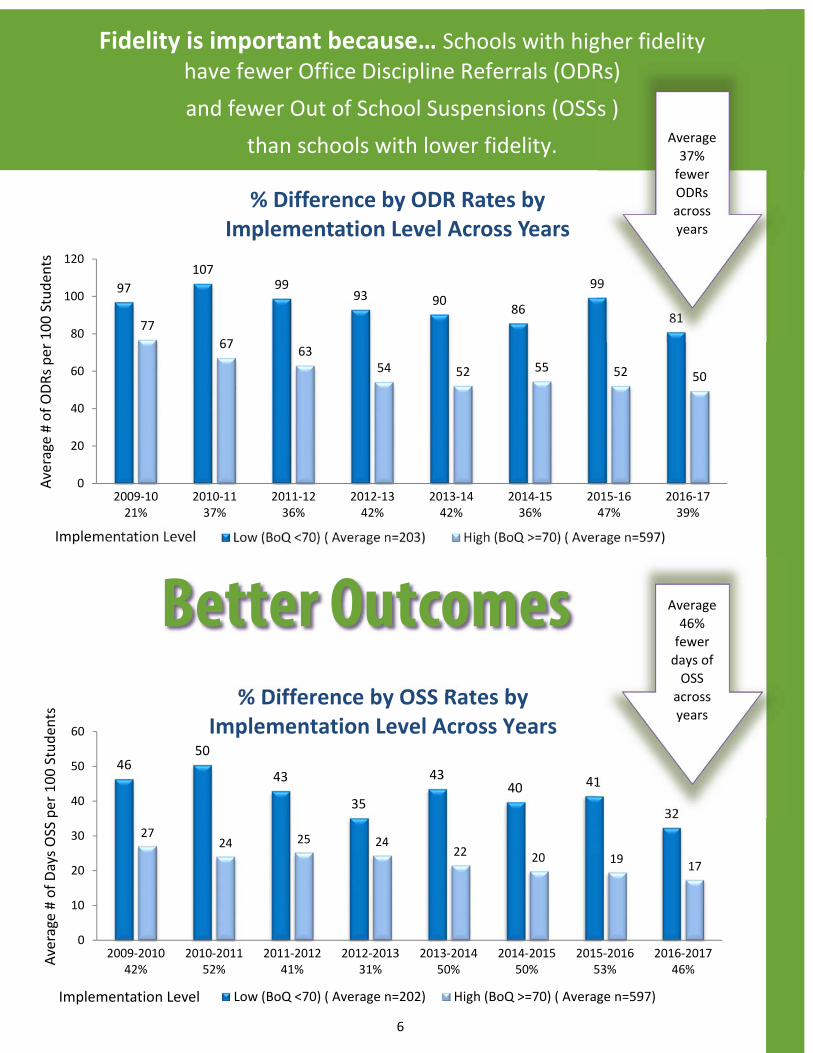
% Difference by ODR Rates by Implementation Level Across Years
Low (BoQ <70) ( Average n=203) High (BoQ >=70) ( Average n=597)
4650
43
35
4340 41
32
2724 25 24
22 20 1917
0
10
20
30
40
50
60
2009‐201042%
2010‐201152%
2011‐201241%
2012‐201331%
2013‐201450%
2014‐201550%
2015‐201653%
2016‐201746%
Average # of Days OSS per 100 Students
Implementation Level Low (BoQ <70) ( Average n=202) High (BoQ >=70) ( Average n=597)
no
Fidelity is important because… Schools with higher fidelity have fewer Office Discipline Referrals (ODRs)
and fewer Out of School Suspensions (OSSs )
than schools with lower fidelity.
Average
37%
fewer
ODRs
across
years
Average
46%
fewer
days of
OSS
across
years % Difference by OSS Rates by
Implementation Level Across Years
Better Outcomes

7
‐14%
‐34%
‐12%‐16%
‐11%
3%
‐12%
‐27%
11%
‐25%
‐8%
‐43%
‐15%‐19%
‐3%
‐50%
‐40%
‐30%
‐20%
‐10%
0%
10%
20%
ODR/100 Students ISS/100 Students OSS/100 Students
Mean Percentage Change
Change in Student Outcomesfrom Baseline to Year 1 (by school type)
Elementary Middle High Other All Types
Statewide Core Effectiveness (all school types)
0‐1 referrals 2‐5 referrals 6+ referrals
All school types
demonstrate positive
outcomes in student
outcomes.
Across time,
secondary schools
report decreases in
referrals and days
of OSS even though
changes after the
first year of
implementation
are not yet
evident.
Note: The data above
represent schools that
reported discipline data
both before and after
the first year of
implementation. They do
not represent a
particular set of school
years.
Tier 1 is effective for most students
across all levels.
Note: “Other” schools include those with irregular grade ranges such as K‐8.
Alternative/center schools are not included due to the variable nature of their data.
4.1% 9.3%
86.3%
8
38
167
140
34
133
121
33
125
102
31
121
103
0
20
40
60
80
100
120
140
160
180
Elementary (322 schools) Middle (95 schools) High (54 schools)
Averagte ODRs per 100 Students
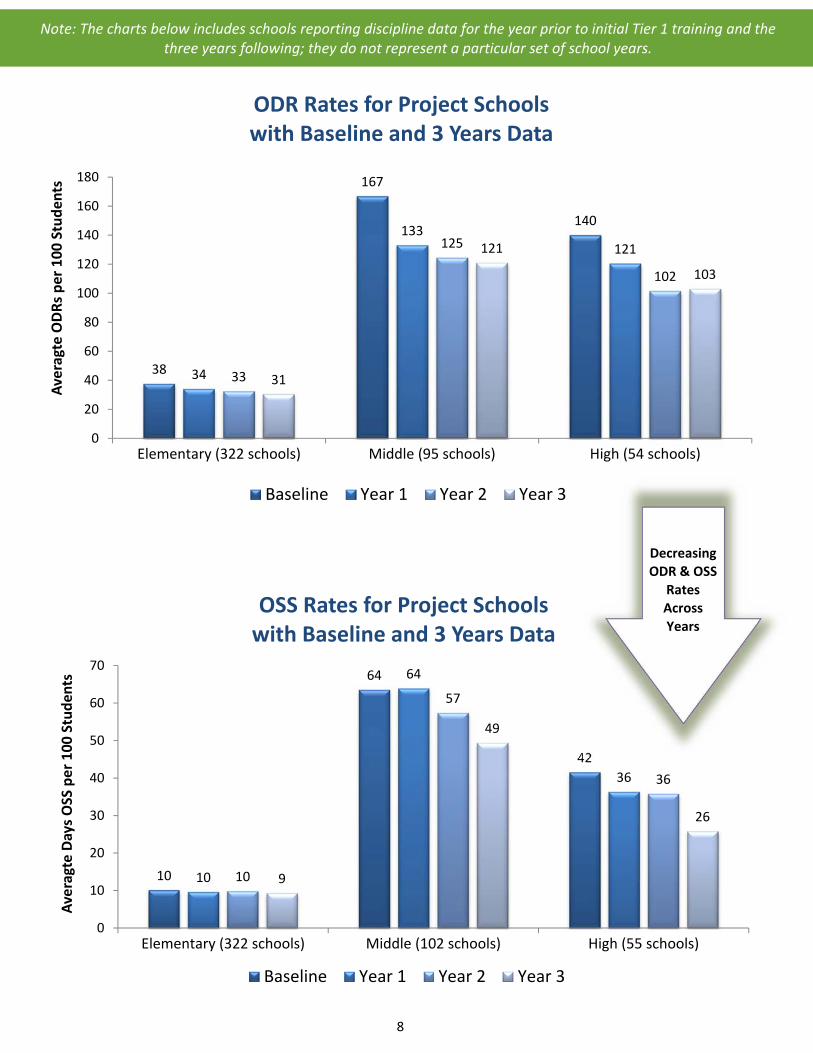
ODR Rates for Project Schoolswith Baseline and 3 Years Data
Baseline Year 1 Year 2 Year 3
10
64
42
10
64
36
10
57
36
9
49
26
0
10
20
30
40
50
60
70
Elementary (322 schools) Middle (102 schools) High (55 schools)
Averagte Days OSS per 100 Students
OSS Rates for Project Schoolswith Baseline and 3 Years Data
Baseline Year 1 Year 2 Year 3
Note: The charts below includes schools reporting discipline data for the year prior to initial Tier 1 training and the three years following; they do not represent a particular set of school years.
Decreasing
ODR & OSS
Rates
Across
Years

9
Investigating Discipline Disparities Similar to previous years, approximately 70% of schools continue to submit annual data. However, the
proportion of schools submitting equity data free from obvious errors was noticeably higher in 2016‐2017.
Enhancements to the data collection system along with education and technical assistance to district and school
staff likely played a role in the improvement.
7765
90 90
0
20
40
60
80
100
n=869 n=994ODR Equity Data
n=739 n=994OSS Equity Data
% of Reporting Schools
Percentage of Schools Reporting Usable Equity Data
2015‐16 2016‐17
7666
7 8
55 58
76
61
9 7
62 60
0
20
40
60
80
100
660 751 ODR
499 604OSS
60 88ODR
59 71OSS
478 611ODR
478 600OSS
African American/Black Hispanic/Latino Students with Individual EducationPlan (IEP)
Percent of Schools
Percentage of Schools with Disproportionate Outcomes
2015‐16 2016‐17
(The existence of disproportionate outcomes is determined by the “e‐formula,” which relies on the standard error to
identifiy when a group’s representation in discipline is higher than their representation within the school population.)

10
2.62
3.62
1.68
2.70
1.62
2.18
2.75
4.62
1.94
4.01
1.70
2.39
1.00
2.00
3.00
4.00
5.00
ODR OSS ODR OSS ODR OSS
African American/Black(660/758 schools)
Hispanic/Latino(60/89 schools)
Students with IEP(478/617 schools)
Average Risk Ratio
Average Risk Ratio Across Schools with Disproportionate Outcomes
2015‐16 2016‐17
Investigating Discipline Disparities Level of Risk for Disparate Outcomes
Risk ratio of 1.0 = Equal risk compared to all other students. 2.0 = Twice the risk. 3.0 = three times the risk
Moderate 2.0‐2.9
Low 1.2‐1.9
Substantial 3.0+
11
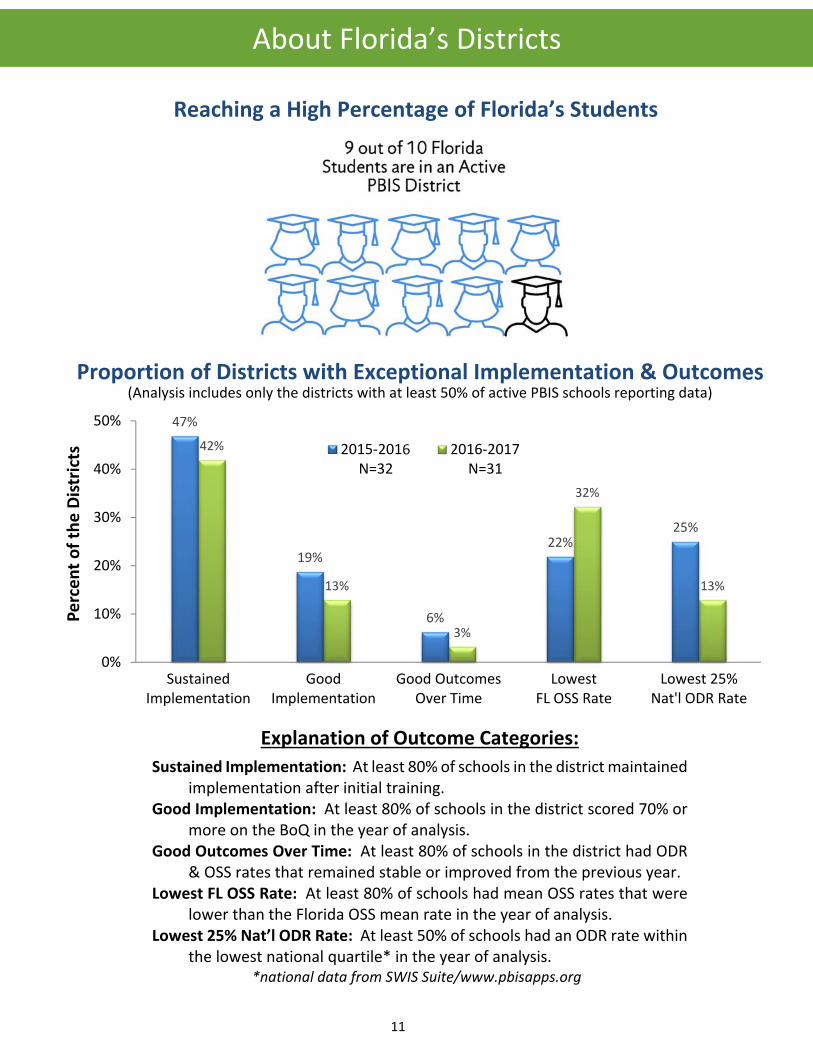
Reaching a High Percentage of Florida’s Students
About Florida’s Districts About Florida’s Districts
47%
19%
6%
22%25%
42%
13%
3%
32%
13%
0%
10%
20%
30%
40%
50%
SustainedImplementation
GoodImplementation
Good OutcomesOver Time
LowestFL OSS Rate
Lowest 25%Nat'l ODR Rate
Percent of the Districts 2015‐2016
N=322016‐2017 N=31
Proportion of Districts with Exceptional Implementation & Outcomes(Analysis includes only the districts with at least 50% of active PBIS schools reporting data)
Explanation of Outcome Categories:
Sustained Implementation: At least 80% of schools in the district maintained implementation after initial training.
Good Implementation: At least 80% of schools in the district scored 70% or more on the BoQ in the year of analysis.
Good Outcomes Over Time: At least 80% of schools in the district had ODR & OSS rates that remained stable or improved from the previous year.
Lowest FL OSS Rate: At least 80% of schools had mean OSS rates that were lower than the Florida OSS mean rate in the year of analysis.
Lowest 25% Nat’l ODR Rate: At least 50% of schools had an ODR rate within the lowest national quartile* in the year of analysis.
*national data from SWIS Suite/www.pbisapps.org

12
Solely for the purpose of working with districts in the state, the Florida Department of Education’s
Bureau of Exceptional Education and Student Services (BEESS) categorizes districts into size‐alike
groups using total enrollment as the determinant.
Size‐Alike Districts with Active PBIS Schools
Number of Districts Active
w/FLPBIS
% of District Type Active
w/FLPBIS
% of Districts with at least
half of Schools
PBIS Trained
% of Districts with at least half of Schools with Evaluation
Data
Very Large >100,000 7 88% 38% 25%
Large >40,000 13 100% 62% 54%
Medium >20,000 7 88% 75% 75%
Medium‐Small >7,000 11 85% 77% 62%
Small <7,000 13 52% 44% 32%
Size‐Alike Districts with Evaluation Data
Number of Districts with 50%+ of schools with all Required Evaluation Data
50%+ Schools Implementing with Fidelity (BoQ=70+)
50%+ Schools with Stable or Improved OSS
rates
Very Large >100,000 2 100% 50%
Large >40,000 7 86% 86%
Medium >20,000 6 67% 67%
Medium Small >7,000 8 63% 100%
Small <7,000 8 63% 88%
Medium sized school districts have the highest proportion of schools
trained and submitting the highest proportion of evaluation data. The
Medium Small districts also had more stable or improved outcomes.
76% of Florida’s districts are Active with FLPBIS.
Medium/Medium‐Small districts have a higher percentage of their
schools trained in PBIS than Small and Very Large.
About Florida’s Districts

13
Restraint and Seclusion
0 100 200 300 400 500 600
Small
Small
Small
Med.Small
Med.Small
Med.Small
Med.Small
Medium
Medium
Medium
Large
Large
Large
Large
Large
Large
Large
School D
istrict Rep
resented by Size
(see previous page for size‐alike explanation)
Number of Restraints by School District
2013‐14 2014‐15 2015‐16 2016‐17
Brevard County Public Schools
Brevard County is a district of approximately 75,000 students, 17.5% of whom are identified as having a
disability. Staff in 38 schools have been trained in PBIS tier 1 prevention and supports. This includes
elementary, middle and high schools, charter schools and alternative schools. These schools
demonstrated a 53% reduction in the use of restraint from the 2013‐2014 to the 2016‐2017 school year.
0
100
200
300
400
500
600
2013‐14 2014‐15 2015‐16 2016‐17
Brevard County Schools Restraints 53%
reduction in
restraints
across 4 years
14
We assist districts in addressing the following areas:
a) implementation or augmentation of data collection and analysis in order to better assess and address patterns of restraint/seclusion,
b) assessment of current training and training needs, at universal, targeted, and individual levels, and
c) review of policies and practices that influence the use of restraint and seclusionary practices.
All districts statewide are also invited to take part in the
new Professional Learning Community (PLC) on reducing
the use of restraint/seclusion. Over 50 virtual attendees at
first meeting where representatives from St. John’s,
Manatee, and Brevard showcased their data collection
systems, action planning guides, and professional
development opportunities.
http://www.livebinders.com/play/play?id=2291786
The webinars available on the link above provide
an introduction to school‐wide and classroom‐level
practices that impact educators' use of Restraint
and Seclusion.
Restraint and Seclusion
Florida’s PBIS Project has been engaged in the development
of resources and activities to support districts interested in
minimizing the use of restraint and seclusionary practices.

15
District Coodinator Satisfaction
District
Coordinators
(DCs) continue to
express a high
level of
satisfaction with
the technical
assistance
provided by the
Project.
The resources
rated as most
useful were the
RtIB Database
and technical
assistance to the
district. The top
resources utilized
by DCs were
related to the
Project website.
Which recently
was completely
updated!
ALL NEW
FLPBIS website!

16
In 2014, the Bureau of Exceptional Education and Student Services (BEESS) at the Florida Department of Education was
one of 12 states awarded a 5‐year collaborative grant from the U.S. Department of Education. The State Education Agency
(SEA) School Climate Transformation (Florida SCT) grant, totaling over $3.3 million, expands the FLPBIS:MTSS Project by
enhancing the existing state‐wide system of behavioral support.
School Climate Transformation

17
25143
460
26
181
476
22
170
342
19
176
430
20
183
886
18
160
628
0
200
400
600
800
1000
Districts Schools Individuals
Number of Active Users
Actively Using Accounts Over Time
2011 ‐ 2012 2012 ‐ 2013 2013 ‐2014 2014 ‐ 2015 2015 ‐2016 2016 ‐ 2017
DISCLAIMER:This information represents only the Florida schools that have opted to use the RtIB Database and should be not interpreted as reflecting the entire state or as
representing state norms.
Response to Intervention for Behavior
38.949.6
65.9
0
20
40
60
80
100
2014‐2015(n=37)
2015‐2016(n=74)
2016‐2017(n=114)
% of Studen
ts M
aking Progress Students Making
Progress in Tier 3
85
70
49
94
81
59
93
78
57
0
20
40
60
80
100
n=645 n=646 n=65360% + of Daily Points
n=532 n=552 n=55170% + of Daily Points
n=376 n=402 n=40480% + of Daily Points
% Studen
ts Earning DailyPoints
Performance of Students Receiving Tier 2
2014‐2015 2015‐2016
0.40.9 0.7
0.20.7
4.5
0.50.9
0.2 0.2 0.1
5.4
0.0
1.0
2.0
3.0
4.0
5.0
6.0
Elementary (n=91) Middle (n=27) High (n=16) PreK (n=1) Other (n=10) Alt/Center (n=12)
Average Inciden
ts per Studen
t
Average Discipline Incidents per Student 2016‐2017
Average Majors per Student Average Minors per Student

18
We are excited that
our 2016‐17 awards
were announced just
weeks after the
application due date.
And we had the most
Gold Model Schools
than in any
previous year!
Great job 2016‐2017
Model Schools, keep
up the amazing work!
In 2016‐2017 we
moved to an
automated system
with greater emphasis
on timely and accurate
data submitted
throughout the year
and having effective
outcomes for all
subgroups of students.
Model Schools
31%
25%
13%12% 12% 12%
10%
12%
17%
0%
5%
10%
15%
20%
25%
30%
35%
2008‐09 2009‐10 2010‐11 2011‐12 2012‐13 2013‐14 2014‐15 2015‐16 2016‐17
% of Active Schools with M
odel Status
School Year
Percent of Active Schools with Model Status
3461
44 48 63 55 39 4516
71 3027
54 32 41
25 12 81
2671
50
42 4964
83
142
178
0
50
100
150
200
250
300
2008‐09 2009‐10 2010‐11 2011‐12 2012‐13 2013‐14 2014‐15 2015‐16 2016‐17
Number of Schools with M
odel Status
School Year
Model Schools by Level of Award Over Time
Bronze Silver Gold
Note: Applying for model school status with Florida’s PBIS Project is optional. Each
year about 10% percent of active schools complete an application and at least 90%
of those schools are recognized at some level of model status.

19
Nothing beats “seeing PBIS in action” to help
your team develop new ideas and generalize PBIS
principles to new practices.
Spotlight on Social Media: It’s not just for fun anymore!
Social media isn’t just about being social anymore ‐ it provides an informal way to connect with quality
information. More school districts are encouraging their schools to model appropriate use of social
media for their students and use these venues to connect with families and community partners.
Facebook Website You Tube Twitter
@Florida PBIS FLPBIS.ORG #@FLBPISyoutube.com/user/flpbs1
548
2,265
590
1,188
2015 2016 2017
# Followers Over Time
Engage with us on social media to:
See and share implementation examples with schools,
Increase positive visibility and political support for your school’s (or district’s) implementation,
Announce & remind about virtual FLPBIS events,
Learn about reports and recent research from national partners & PBIS‐friendly organizations, and
Connect with other implementers for ideas & suggestions.
Social media connects you with videos, pictures,
and stories of how other schools use PBIS with
their students & staff.

20
Closing words from our Co‐Director, Heather
As in previous years, the FLPBIS:MTSS Project was extremely productive
during 2016‐2017. Our participating schools and districts continued their
commitment to the PBIS framework by either increasing or maintaining their
high level of implementation fidelity. This dedication to prevention science
has resulted in improved behavioral outcomes for Florida’s students. Our
districts are sustaining PBIS implementation through their ongoing data‐based
problem solving with their leadership teams. Understanding that academics
and behavior are interrelated and must be simultaneously addressed have
assisted districts in working smarter with their resource allocation. An
articulated vision that transforms learning environments so that students learn
better, teachers teach more effectively, and schools become spaces to intentionally develop the whole child
helps districts stay focused on their priorities and recruit stakeholders. Florida’s PBIS districts are working to
align their resources to improve the social competence, emotional well‐being and cognitive abilities of their
students. Evidence of districts promoting systemic improvement coordinated through one comprehensive plan
is growing! While there continues to be a need for improvement and ongoing work to do, our actively
participating schools and districts are making a positive impact in Florida!
The School Climate Transformation (Florida SCT) is a 5‐year grant funded in 2014 by the United States
Department of Education, Office of Safe and Healthy Students to boost the FLPBIS:MTSS Project by: (1)
expanding the implementation of PBIS across districts, schools and settings; (2) increasing the fidelity of
implementation of PBIS; (3) increasing positive behavioral outcomes for students; (4) expanding the capacity of
LEAs to support sustained implementation of PBIS; and (5) expanding the capacity of the SEA to support
sustained implementation of PBIS. Collaboration of Florida SCT with the FLPBIS:MTSS Project has been essential.
Our SCT Workgroups have been a primary way to accomplish these objectives while simultaneously meeting
our State’s educational needs and established priorities. In 2016‐2017, districts engaged in problem‐solving
disproportionality to improve discipline equity across students, reducing the use of restraint and seclusion, and
redesigning their Tier 3 systems. Further, districts engaged in extensive training in early childhood, classroom
strategies, and expanding coaching supports. Congratulations to all active participants in being a part of this
process and experiencing the positive effects that PBIS can make!
Research has indicated that PBIS is related to: (a) reductions in problem and bullying behaviors, (b) increased
academic performance and perception of teacher efficacy, and (c) improved organizational efficiency, social‐
emotional competence and perception of safety. PBIS works! School climate matters! The FLPBIS:MTSS Project
and Florida SCT remain committed in 2017‐2018 in assisting Florida’s districts in developing effective behavior
support strategies for all students. We would not be successful without the project team and established
collaborations from our state, districts and schools in Florida! Thank you for partnering with the
FLPBIS:MTSS Project to work towards increasing the safety and school climate of our schools in order to enhance
the educational success of Florida’s children. We look forward to continued collaborations in 2017‐2018


