50
March 1982 NASA ' 1976 1 c. 1 TP i I Static and Wind-Tunnel Inuest igat ions James A. Schoenster https://ntrs.nasa.gov/search.jsp?R=19820013163 2018-03-26T21:14:23+00:00Z
March 1982
NASA ' 1976 1
c . 1
TP i
I
Static and Wind-Tunnel Inuest igat ions
James A. Schoenster
https://ntrs.nasa.gov/search.jsp?R=19820013163 2018-03-26T21:14:23+00:00Z
TECH LIBRARY KAFB, "I
NASA Technical Paper 1976
1982
NASA National Aeronautics and Space Administration
Scientific and Technical Information Branch
..
006834b
Fluctuating Pressures on Fan Blades of a Turbofan Engine
Static and Wind-Tunnel Investigations
James A. Schoenster Langley Research Center Hampton, Virginia

U s e of trade names o r names of manufacturers i n t h i s r epor t does not c o n s t i t u t e an o f f i c i a l endorsement of such products o r manufacturers, e i t h e r expressed or impl ied , by t h e Nat ional Aeronautics and Space Administration.
ii
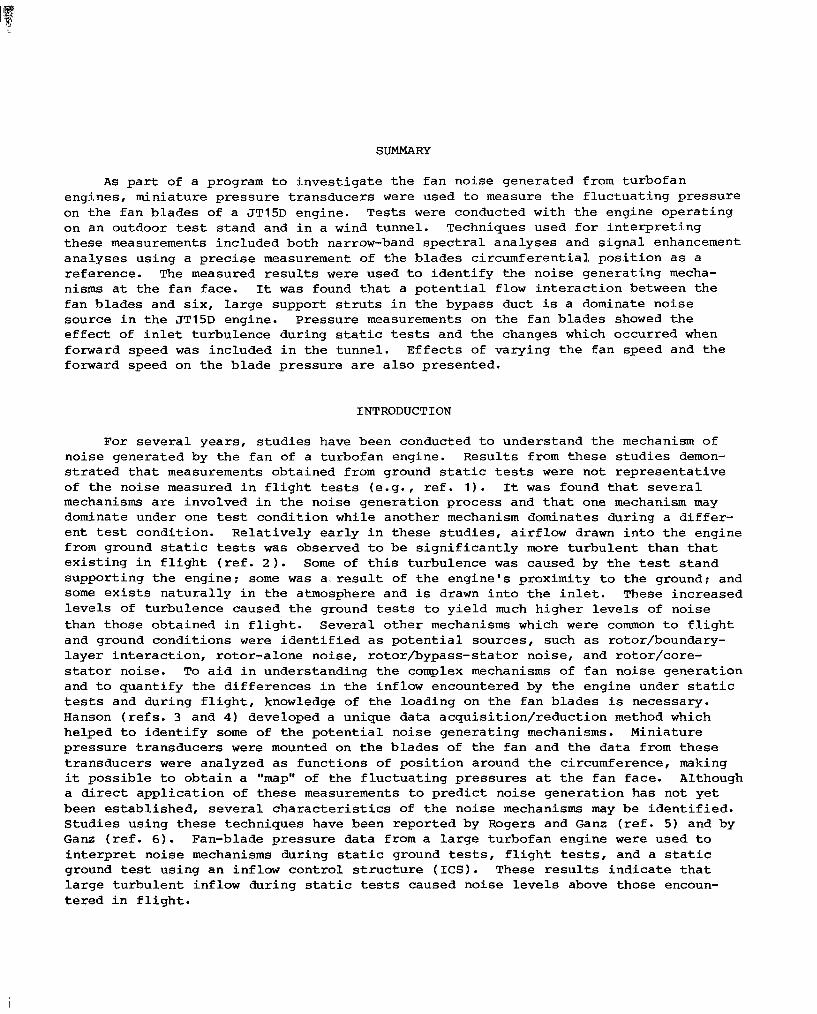
SUMMARY
As p a r t of a program t o inves t iga t e t h e f an noise generated from turbofan engines, miniature pressure t ransducers were used t o measure t h e f l u c t u a t i n g pressure on t h e fan blades of a JT15D engine. Tests w e r e conducted with t h e engine opera t ing on an outdoor test s tand and i n a wind tunnel. Techniques used f o r i n t e r p r e t i n g these measurements included both narrow-band s p e c t r a l analyses and s i g n a l enhancement analyses using a p r e c i s e measurement of t h e blades c i rcumferent ia l pos i t i on a s a reference. The measured r e s u l t s w e r e used t o i d e n t i f y t h e noise generat ing mecha- nisms a t t h e f an face. It was found t h a t a p o t e n t i a l flow i n t e r a c t i o n between t h e fan blades and s i x , l a rge support s t r u t s i n t h e bypass duct is a dominate noise source i n t h e JT15D engine. Pressure measurements on the fan blades showed t h e effect of i n l e t turbulence during s t a t i c tests and t h e changes which occurred when forward speed w a s included i n t h e tunnel . E f fec t s of varying t h e fan speed and t h e forward speed on the blade pressure are a l s o presented.
INTRODUCTION
For seve ra l years , s tud ie s have been conducted t o understand t h e mechanism of noise generated by t h e f an of a turbofan engine. Resul ts from these s t u d i e s demon- s t r a t e d t h a t measurements obtained from ground s t a t i c tes ts w e r e not r ep resen ta t ive of t h e noise measured i n f l i g h t tests (e.g. , r e f . . I ) . It was found t h a t s eve ra l mechanisms are involved i n t h e noise generat ion process and t h a t one mechanism may dominate under one test condi t ion while another mechanism dominates during a d i f f e r - en t test condi t ion. Rela t ive ly e a r l y i n these s tud ie s , a i r f low drawn i n t o t h e engine from ground s t a t i c tests was observed t o be s i g n i f i c a n t l y m o r e t u rbu len t than t h a t e x i s t i n g i n f l i g h t ( r e f . 2). Some of t h i s turbulence was caused by t h e test s tand support ing t h e engine; s o m e was a . r e s u l t of t h e engine's proximity t o t h e ground; and some e x i s t s na tu ra l ly i n t h e atmosphere and is drawn i n t o t h e i n l e t . These increased l e v e l s of turbulence caused t h e ground tes ts t o y i e l d much higher l eve l s of noise than those obtained i n f l i g h t . Several o the r mechanisms which w e r e common t o f l i g h t and ground condi t ions w e r e i d e n t i f i e d as p o t e n t i a l sources, such as rotor/boundary- l aye r i n t e r a c t i o n , rotor-alone noise , ro tor /bypass-s ta tor noise , and rotor/core- s t a t o r noise. To a id i n understanding t h e complex mechanisms of f an noise generat ion and t o quant i fy t h e d i f f e rences i n t h e inflow encountered by t h e engine under s t a t i c tests and during f l i g h t , knowledge of t h e loading on t h e f an blades is necessary. Hanson ( r e f s . 3 and 4 ) developed a unique data acquis i t ion / reduct ion method which helped t o i d e n t i f y s o m e of t h e p o t e n t i a l noise generat ing mechanisms. Miniature pressure t ransducers w e r e mounted on t h e blades of t h e f an and t h e data from these t ransducers w e r e analyzed as funct ions of pos i t i on around t h e circumference, making it poss ib l e t o ob ta in a "map" of t he f l u c t u a t i n g pressures a t t h e f an face. Although a direct app l i ca t ion of t hese measurements t o p r e d i c t noise generat ion has not y e t been es tab l i shed , several c h a r a c t e r i s t i c s of t h e noise mechanisms may be i d e n t i f i e d . S tudies using these techniques have been reported by Rogers and Ganz (ref. 5) and by Gam (ref. 6). Fan-blade pressure data from a l a rge turbofan engine w e r e used t o i n t e r p r e t noise mechanisms during s t a t i c ground tests, f l i g h t tes ts , and a s t a t i c ground test using an inflow cont ro l s t r u c t u r e ( I C s ) . These r e s u l t s i n d i c a t e t h a t l a r g e tu rbu len t inflow during s t a t i c tests caused noise l e v e l s above those encoun- t e r e d i n f l i g h t .
In view of the large differences in the radiated sound field between ground static tests and actual flight conditions, it became apparent that reliable ground- test methods to simulate actual flight conditions must be developed. In a coopera- tive effort among NASA research centers, a program was established to study, in detail, methods to improve simulated flight conditions during ground tests. At Lewis Research Center (refs. 7 , 8, and 91, ground static tests have been conducted using various configurations of a modified JT15D engine. Measurement results included far- field acoustic data, effects of modifying the inflow conditions, and effects of inflow control structures on the noise generated by the fan. At Langley Research Center, ground static tests and wind-tunnel flight-simulation tests have been con- ducted and flight tests on the same engine are currently being conducted. A compari- son among these three sets of results is expected to provide the needed information on the improvement of simulated flight-test methods on fan noise. The ground tests were performed on the static test stand at NASA Ames Research Center, and the flight- simulation tests were conducted in the Ames 40- by 80-Foot Wind Tunnel. The measure- ments in these two tests included far-field noise and extensive fan-blade fluctuating pressure, obtained from fan-blade-mounted transducers (FBMT's). Far-field data and some preliminary FBMT data were presented in reference 10.
The purpose of this report is to provide a more extensive analysis of the FBMT data from the JT15D turbofan engine. FBMT measurements obtained from a static test stand and in a wind tunnel are presented. The experimental results are discussed in terms of narrow-band spectrum, space/time histories, the mean of the deviation and standard deviation, and the harmonic order analysis.
SYMBOLS
fan rotational frequency, Hz fn
N total number of fan revolutions
P pressure, Pa
0 total number of discrete, angular, fan-blade positions
d standard deviation of pressure, Pa
Subscripts:
n number of fan revolutions
0 angular position around inlet circumference, deg
Abbreviations:
CCW counterclockwise
FBMT fan-blade-mounted transducer
FFT fast Fourier transform
2
J
f req
ref
frequency
re ference
A b a r ( - 1 over a symbol denotes t h e mean value.
DESCRIPTION OF EXPERIMENT
T e s t Engine
The t e s t engine, a modified JT15D turbofan, ' i s a twin-spool, f ront-fan j e t propuls ion engine which has a fu l l - length annular bypass duct. It has a nominal bypass r a t i o of 3.3 and a maximum t h r u s t capab i l i t y of 9790 N. (See t a b l e I f o r s p e c i f i c a t i o n s . )
The f an i s 53.3 cm i n diameter and has 2 8 blades. (See f i g s . 1 and 2 . ) The fan is followed by a s t a t o r assembly cons is t ing of a bypass s t a t o r which has 66 vanes and a core s t a t o r which has 71 vanes. The l a t t e r is t h e only major d i f f e rence between a production JT15D engine (which has 33 core-s ta tor vanes) and t h e tes t engine. The modified core s t a t o r has more blades and is a f t of t h e r o t o r blade root a d i s tance of 0.63 fan-blade root chord (compared t o 0 . 2 8 chord f o r a production engine) so t h a t t h e fan ro tor /core-s ta tor i n t e r a c t i o n tone was acous t i ca l ly cu t of f and t h e broadband noise was diminished. The next r o t a t i n g blade assembly is t h e compressor which is a combination ax ia l - cen t r i fuga l compressor having 16 blades i n t h e leading a x i a l p a r t of t h e u n i t .
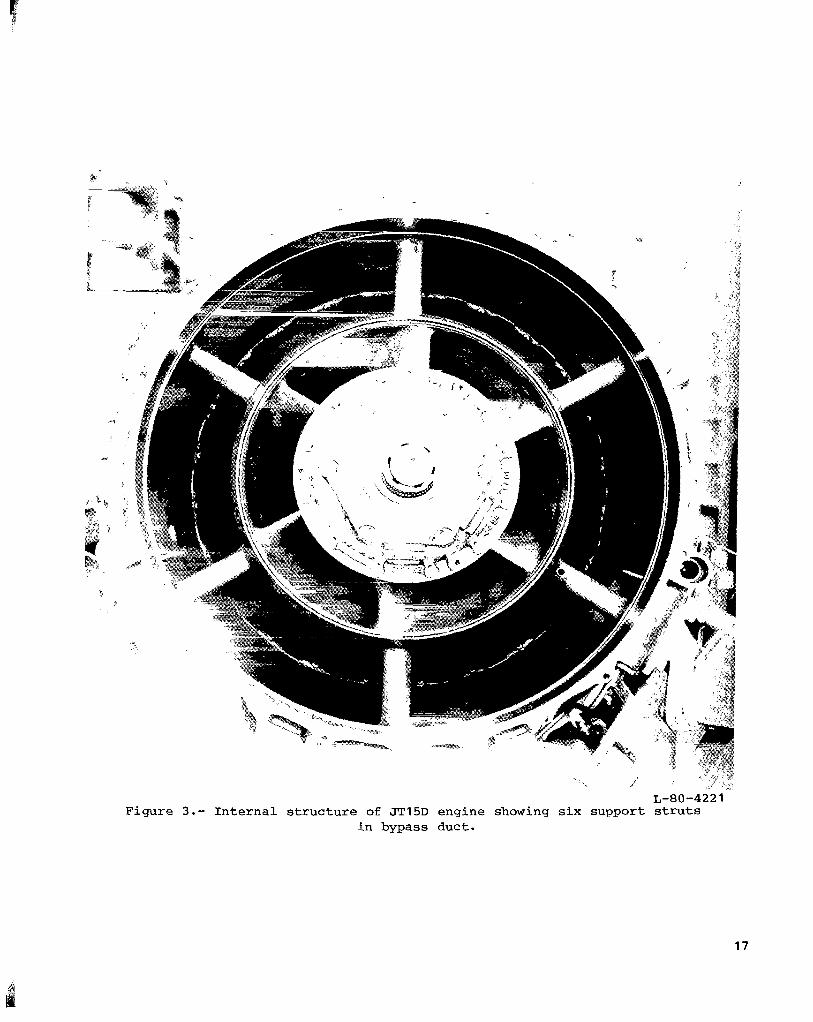
A s shown i n f i g u r e 3 , t h e engine core i s supported by s i x i n t e r n a l struts which are located i n t h e intermediate case of t h e engine. These supports t r a v e r s e t h e compressor and bypass ducts t o a t t a c h the core t o t h e ou te r wal l of t h e engine in t e r - mediate case. A s shown i n f i g u r e 2 , these s t r u t s a r e loca ted behind t h e s t a t o r assembly.
The tes t engine w a s f i t t e d with a muff ler t o reduce t h e a f t - r ad ia t ed noise from the bypass duct. This was considered necessary t o minimize any poss ib l e contamina- t i o n of t h e measurements of f ront - rad ia ted fan noise of i n t e r e s t i n t h e present i nves t iga t ion . The muff ler was designed so t h a t t he bypass and core e x i t a r e a s remained t h e s a m e as i n an unt rea ted engine.
T e s t F a c i l i t i e s and Setup
Outdoor test stand.- The engine w a s mounted outdoors on a s i n g l e strut 4.57 m above t h e ground, and t h e engine w a s encased i n a nace l l e with t h e exception of one sec t ion on t h e bottom s ide . (See f i g . 4 . ) Microphones f o r f a r - f i e l d measurements (a t r ave r s ing microphone supported on a r a i l and pole microphones) w e r e p laced no c l o s e r than 4.05 m from t h e fan face of t he engine. A concrete pad supports t h e e n t i r e setup. This tes t se tup presents a minimum of flow d i s t o r t i o n i n t o t h e engine i n l e t r e s u l t i n g from t h e support s t ruc tu re , t h e ground plane, or t h e instrumentat ion supports.
'Manufactured by P r a t t 6 Whitney A i r c r a f t of Canada.
3
Wind tunnel.- The same mounting strut used in the outdoor test was used to install the engine in the Ames 40- by 80-Foot Wind Tunnel (fig. 5). The test-section floor and walls in the immediate area surrounding the engine were lined with a 7.62-cm-thick layer of acoustic foam. Far-field microphones similar to those used outdoors were mounted around the engine. During the wind-tunnel tests, the entire nacelle was in place. Tests were conducted for conditions ranging from the tunnel off to a simulated forward speed of 44 m/s. With the tunnel off, the operation of the engine induced a flow in the tunnel test section; however, the maximum induced speed was less than 6 m/s.
Test conditions.- Data obtained on the outdoor test stand were at nominal fan speeds from 6750 to 13 490 rpm. To allow for stable engine operation (constant engine speeds), tests were conducted only when the speed of the prevailing wind was less than 3 m/s.
For the wind-tunnel tests, data were obtained for several combinations of fan speed and tunnel speed. For purposes of comparison with the outdoor tests, results were obtained at a fan speed of 6750 rpm with a tunnel speed of 44 m/s. To study the effect of fan speed.on the blade pressure fluctuations, the tunnel was turned off and the fan speed was slowly varied from 12 800 to 8450 rpm while data were continuously recorded. The effect of flight speed was studied by keeping a steady fan speed at 10 500 rpm and acquiring data with the tunnel off and at tunnel speeds of 10, 31, and 44 m/s. Temperature was about 17OC (62OF) during the outdoor tests and about 19OC (67OF) in the wind tunnel. Adjusting the fan speed for temperature effects would result in a difference of less than 1 percent between the outdoor and wind-tunnel tests, and therefore, actual speeds are used in this paper.
Instrumentation and Data Processing
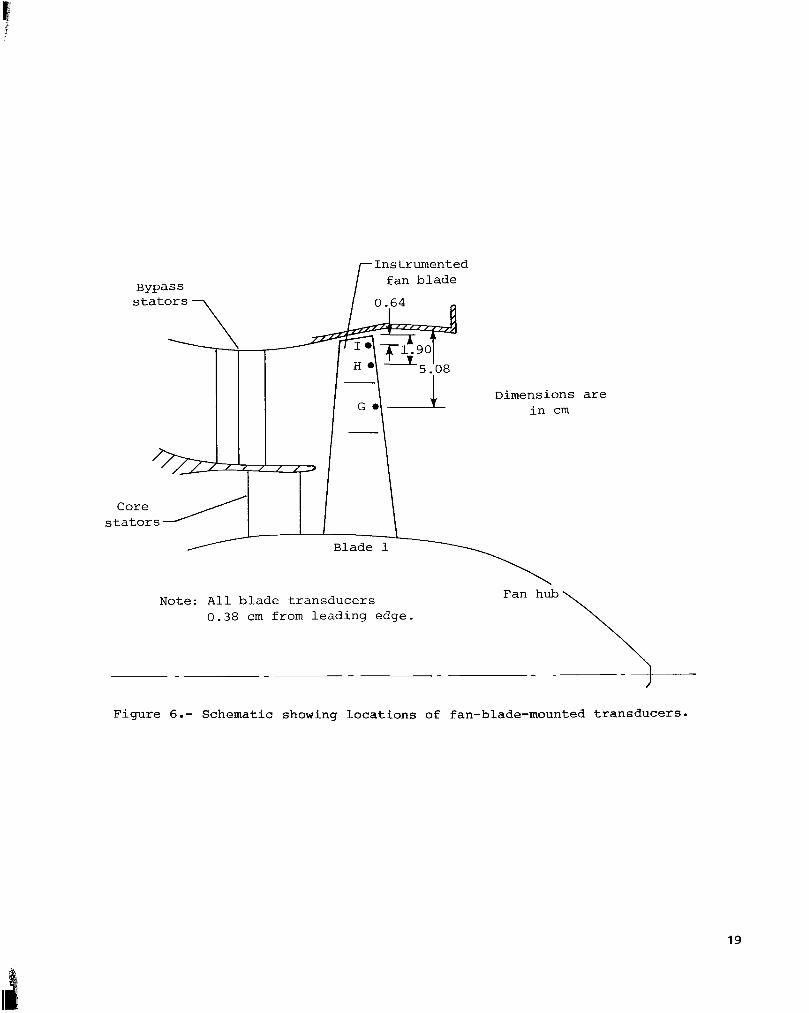
Fan-blade-mounted transducers.- Miniature (I-mm diam) pressure transducers were bonded to the blade surface at three locations along the span (fig. 6). The total thickness of the mounted transducer was less than 0 . 3 3 mm above the surface of the blade including the rubberized bonding material which was used to fair the transducer to the curvature of the blade. Based on an evaluation of this mounting arrangement (ref. ll), the addition of the transducers to the blade is not expected to have a significant effect on the pressure field being investigated in this study. A photo- graph of the installation is presented in figure 7. Signals from these transducers were transmitted from the fan hub to an antenna in the inlet duct wall and recorded on magnetic tape as analog pressure signals (fig. 8). The system was designed to measure pressures in the range of 20 Hz to 20 kHz with a sensitivity of 0.145 mV/Pa (1 V/psi). The systems signal to noise ratio is 50 dB and %he dynamic range is from 120 to 170 dB. Details explaining the data acquisition system for these transducers may be found in reference 12.
Data processing.- Data from the fan-blade-mounted transducers presented in this paper were analyzed by one of two methods. The first method for analyzing data from the fan-speed sweep test uses an on-line spectrum analyzer having a 10-Hz nominal bandwidth of analysis up to 5000 Hz and a three-dimensional display generator. Each spectrum represents 256 averages, and as the fan speed is varied, each subsequent averaged spectrum is displaced on the plot to yield a stepped time history of the spectra. Sixteen independent spectra are presented, covering a fan speed of 12 800 to 8450 rpm. The change in fan speed during any one averaging time is about 5 Hz, or half the bandwidth of analysis.
4
The second data ana lys i s method follows a procedure developed by Hanson ( r e f . 4) t o analyze data from transducers on r o t a t i n g machinery. Applications of t h i s method w e r e made i n re ferences 4, 5, 9 , 10, and 13. The method r e l a t e s t he measured pres- sure s i g n a l from t h e FBMT with a p rec i se measurement of t h e fan-blade pos i t ion . This allows t h e data t o be evaluated i n terms of t he angular pos i t i on of t he blade-mounted t ransducers . Thus, t he measured pressure is analogus t o the measurements of a con- t inuous c i r c u l a r a r r ay of f ixed t ransducers . The blade-posi t ion sensor incorporates an o p t i c a l sensor system which is t r igge red each t i m e a s e l ec t ed pol ished b lade passes the sensor. This s i g n a l is converted i n t o a 2 - m s constant-amplitude pulse whose r i s i n g slope ind ica t e s t h e passing of t he pol ished blade. This s igna l is recorded along with the pressure data , and f o r t h i s tes t , t he sharp r i s i n g s lope provides an accurate ind ica t ion t h a t t he instrumented blade is a t t h e top-center p o s i t i o n of t h e engine i n l e t . Additional d e t a i l s of t h i s system may be found i n reference 12.
With the pulsed s i g n a l a s a reference, t he pressure data a r e d i g i t i z e d a t a r a t e of 360 po in t s per revolu t ion (independent of t h e f an speed) . These d i g i t i z e d da ta a r e then processed through a f a s t Fourier transform (FFT) ana lys i s program which provides a spectrum i n bandwidths of 0.35fn, where f n is t h e fan r o t a t i o n a l f re - quency. This is t h e spectrum of t h e o v e r a l l p ressure v a r i a t i o n on t h e r o t a t i n g blade.
The data a r e then ordered i n t h e form Pn e where n i s the number of t he fan revolu t ion ( e s t ab l i shed from an a r b i t r a r y s t a r c i n g po in t ) and 8 i s the number of t h e data po in t i n a revolu t ion ( represent ing t h e angular pos i t i on around the i n l e t circumference a t which the measurement was obta ined) .
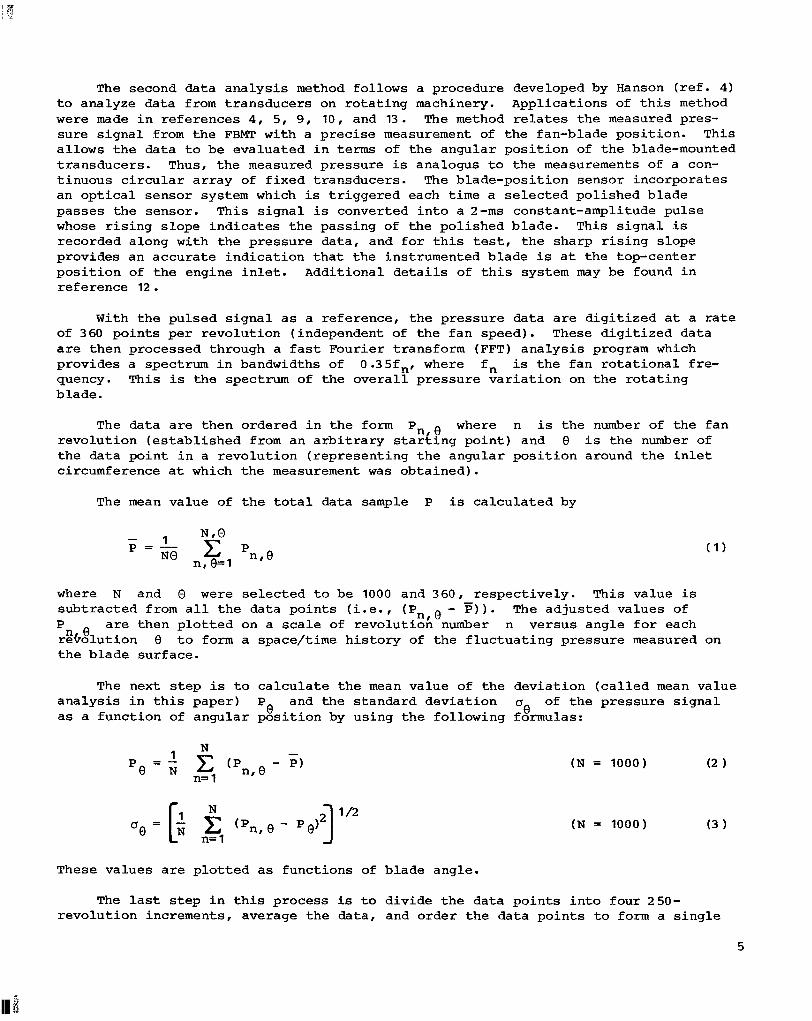
The mean value of t h e t o t a l data sample P is ca l cu la t ed by
where N and 0 w e r e s e l ec t ed t o be 1000 and 360, respec t ive ly . This value is subt rac ted from a l l t h e data po in t s ( i . e . , (Pn,e - P ) ) .
a r e then p l o t t e d on a s c a l e of revolut ion number n versus angle f o r each recolu t ion t h e blade surface.
- The ad jus ted values of
'n e 8 t o form a space/time h i s t o r y of t he f l u c t u a t i n g pressure measured on
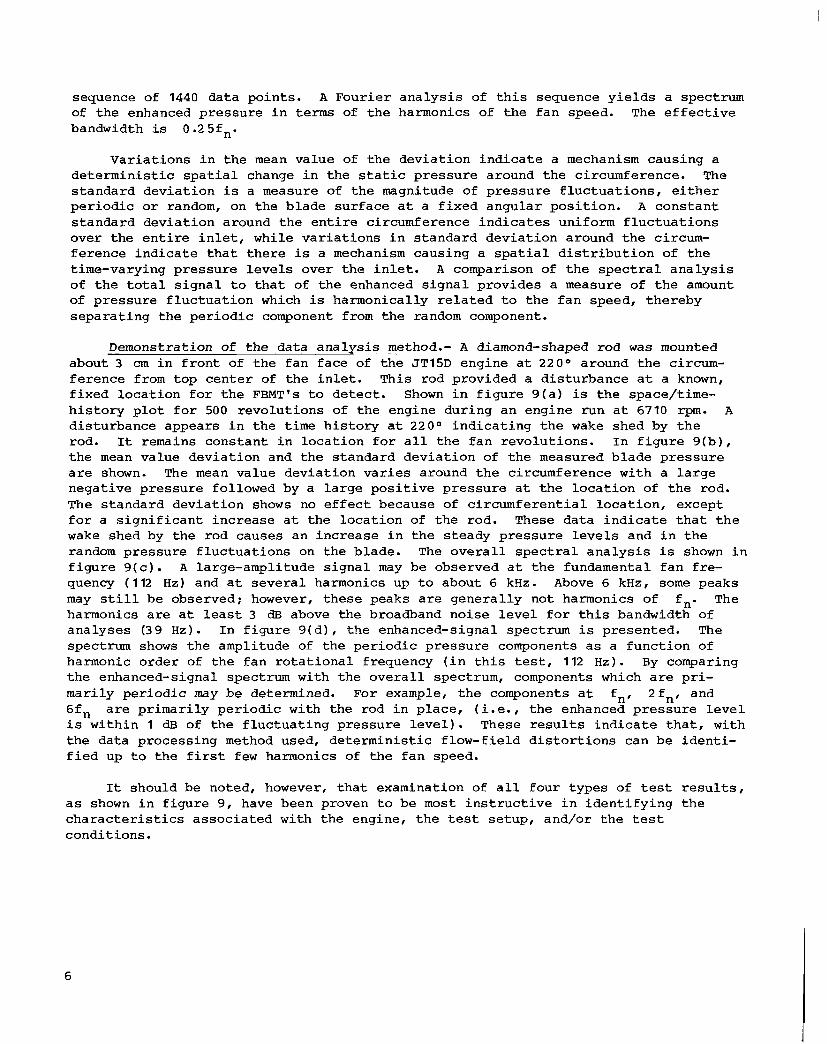
The next step is t o c a l c u l a t e t h e mean value of t h e devia t ion ( c a l l e d mean value Po and the s tandard devia t ion 0 of t h e pressure s i g n a l e ana lys i s i n t h i s paper)
a s a funct ion of angular pos i t i on by using t h e following formulas:
These values a r e p l o t t e d a s funct ions of blade angle.
( N = 1000) (2 1
( N = 1000) (3 1
The l a s t step i n t h i s process is t o d iv ide t h e data po in t s i n t o four 2 50- revolu t ion increments, average the data , and order t h e da ta po in t s t o form a s i n g l e
5
sequence of 1440 data poin ts . A Fourier ana lys i s of t h i s sequence y i e lds a spectrum of the enhanced pressure i n terms of t he harmonics of t he fan speed. The e f f e c t i v e bandwidth is 0.2 5fn.
Var ia t ions i n t h e mean value of t h e devia t ion i n d i c a t e a mechanism causing a de te rminis t ic s p a t i a l change i n the s t a t i c pressure around the circumference. The s tandard devia t ion is a measure of t he magnitude of pressure f luc tua t ions , e i t h e r per iodic or random, on the blade sur face a t a f i xed angular pos i t i on . A cons tan t s tandard devia t ion around the e n t i r e circumference i n d i c a t e s uniform f l u c t u a t i o n s over the e n t i r e i n l e t , while va r i a t ions i n s tandard devia t ion around t h e circum- ference ind ica t e t h a t t he re is a mechanism causing a s p a t i a l d i s t r i b u t i o n of t he time-varying pressure l e v e l s over t he i n l e t . A comparison of t h e s p e c t r a l ana lys i s of t h e t o t a l s i g n a l t o t h a t of t he enhanced s i g n a l provides a measure of t he amount of pressure f l u c t u a t i o n which is harmonically r e l a t e d t o the f an speed, thereby separa t ing t h e pe r iod ic component from the random component.
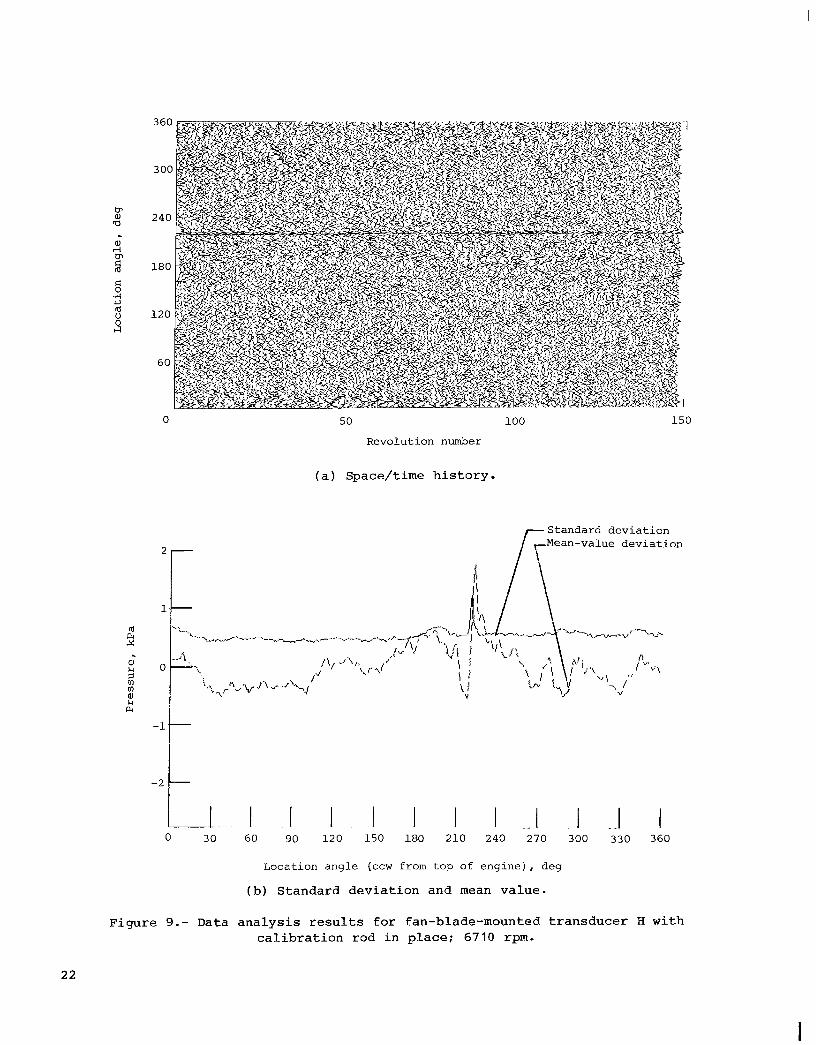
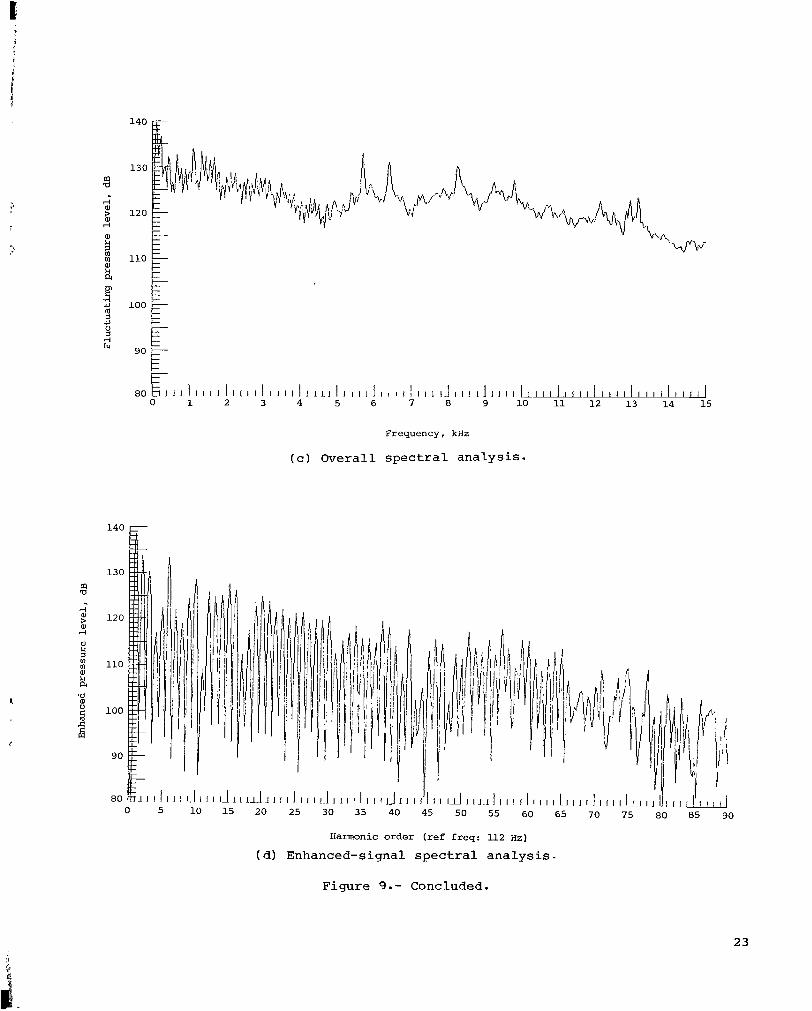
Demonstration of the data ana lys i s method.- A diamond-shaped rod was mounted about 3 an i n f r o n t of the fan face of - the JT15D engine a t 220O around the circum- ference from top cen te r of t he i n l e t . This rod provided a dis turbance a t a known, f ixed loca t ion f o r t he FBMT's t o de tec t . Shown i n f i g u r e 9 ( a ) is t h e space/time- h i s t o r y plot f o r 500 revolut ions of t he engine during an engine run a t 6710 r p m . A disturbance appears i n the t i m e h i s t o r y a t 2 2 0 O i nd ica t ing t h e wake shed by t h e rod. It remains constant i n loca t ion f o r a l l t he fan revolut ions. In f i g u r e 9 ( b ) , the mean value deviat ion and the standard devia t ion of t he measured blade pressure a r e shown. The mean value deviat ion va r i e s around the circumference with a l a rge negative pressure followed by a la rge p o s i t i v e pressure a t t h e loca t ion of t h e rod. The s tandard devia t ion shows no e f f e c t because of c i rcumferent ia l loca t ion , except f o r a s i g n i f i c a n t increase a t t he loca t ion of the rod. These data i n d i c a t e t h a t t h e wake shed by the rod causes an increase i n t h e s teady pressure l e v e l s and i n t h e random pressure f luc tua t ions on the blade. The o v e r a l l s p e c t r a l ana lys i s is shown i n f i g u r e 9 ( c ) . A large-amplitude s igna l may be observed a t t h e fundamental f an f re - quency (112 H z ) and a t severa l harmonics up t o about 6 k H z . Above 6 k H z , some peaks may s t i l l be observed; however, these peaks a r e genera l ly not harmonics of fn . The harmonics a r e a t l e a s t 3 dB above the broadband noise l e v e l f o r t h i s bandwidth of analyses (39 H z ) . I n f i g u r e 9 ( d ) , t he enhanced-signal spectrum i s presented. The spectrum shows the amplitude of the per iodic pressure components a s a func t ion of harmonic order of t he fan r o t a t i o n a l frequency ( i n t h i s test , 112 H z ) . By comparing the enhanced-signal spectrum with the o v e r a l l spectrum, components which a r e p r i - marily per iodic may be determined. For example, t h e components a t fn , 2 f n , and 6 f n a r e pr imar i ly per iodic with the rod i n place, ( i .e. , t he enhanced pressure l e v e l i s wi th in 1 dB of the f luc tua t ing pressure l e v e l ) . These r e s u l t s i n d i c a t e t h a t , with the data processing method used, de te rminis t ic f l o w - f i e l d d i s t o r t i o n s can be iden t i - f i e d up t o the f i r s t few harmonics of t he fan speed.
It should be noted, however, t h a t examination of a l l four types of test r e s u l t s , a s shown i n f igu re 9, have been proven t o be most i n s t r u c t i v e i n iden t i fy ing t h e c h a r a c t e r i s t i c s assoc ia ted with the engine, t he tes t setup, and/or t h e t es t condi t ions.
6
FLESTJLTS AND DISCUSSION
outdoor S t a t i c Tes ts
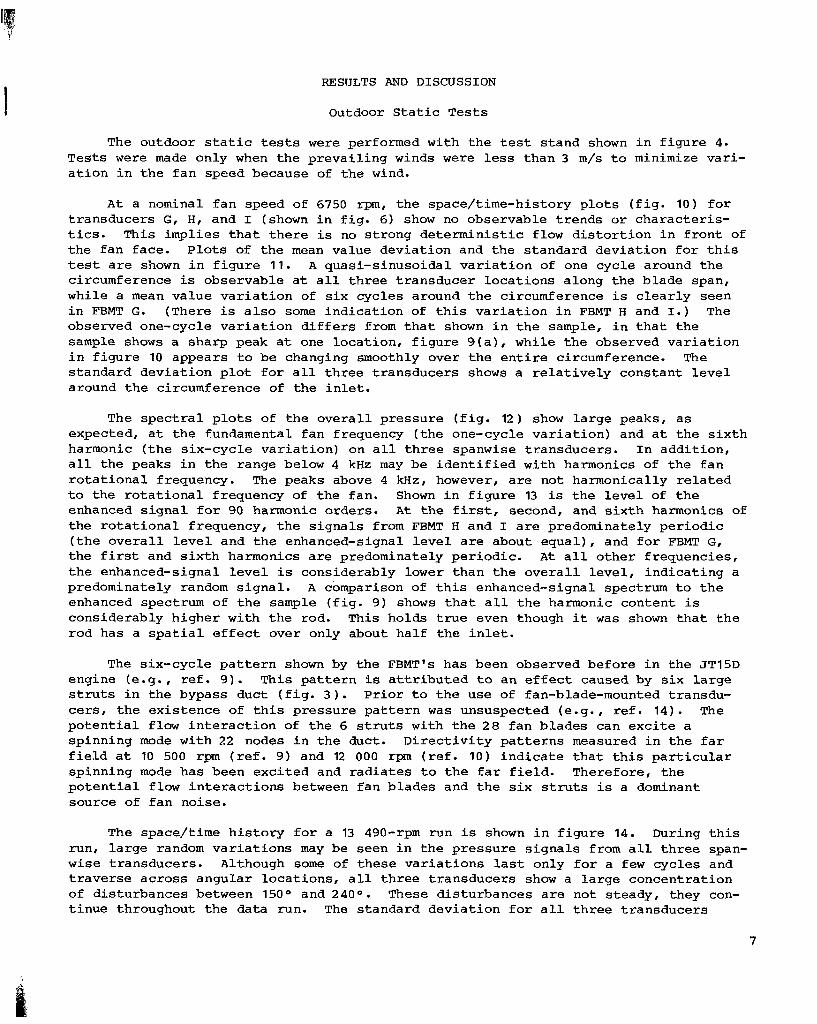
The outdoor s t a t i c tests were performed with the t e s t s tand shown i n f igu re 4. Tests w e r e made only when t h e preva i l ing winds w e r e less than 3 m/s t o minimize var i - a t i o n i n t h e f an speed because of t he wind.
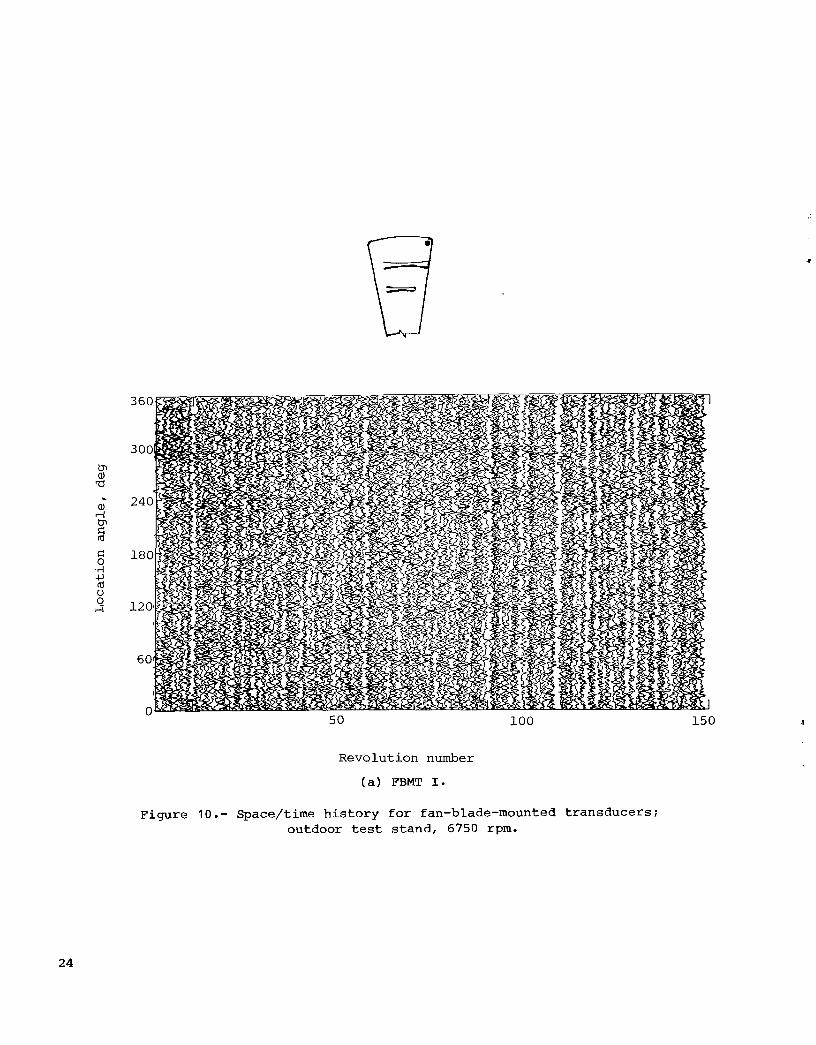
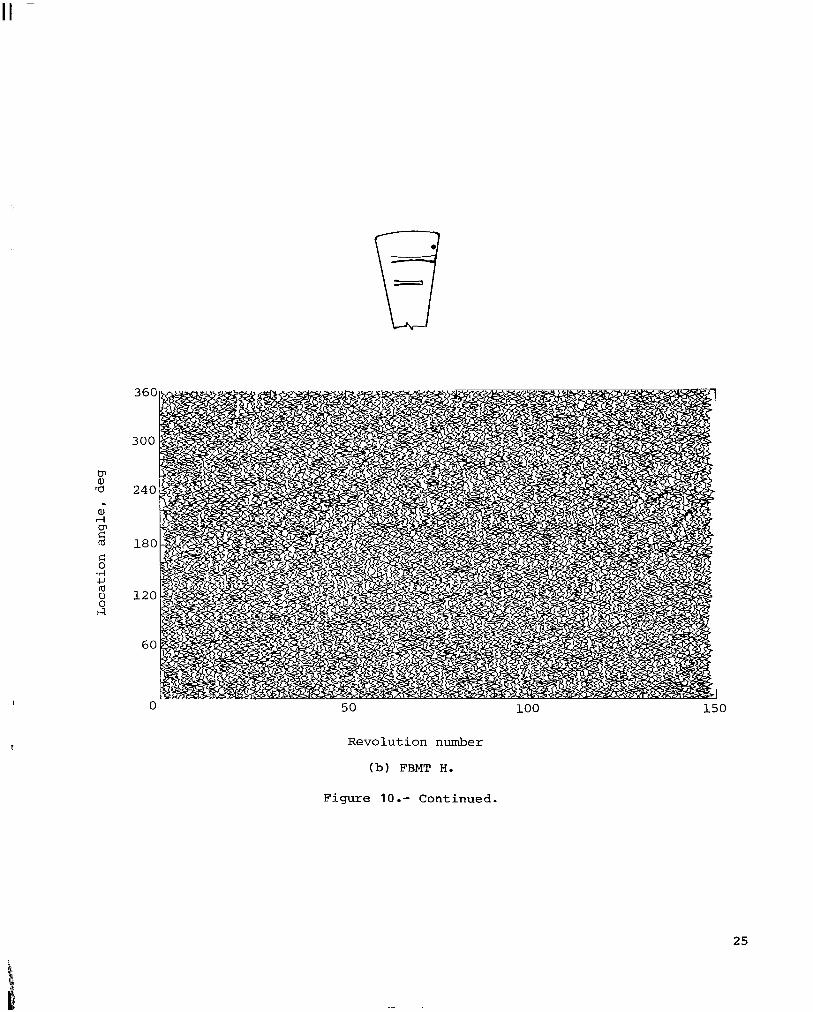
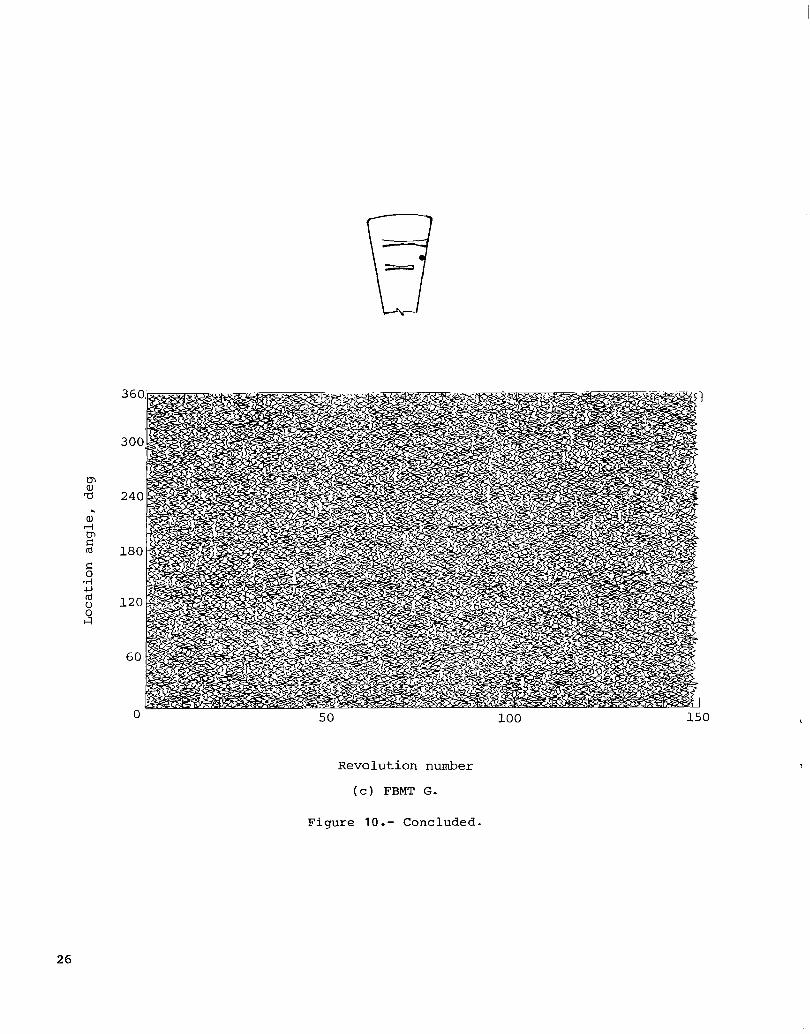
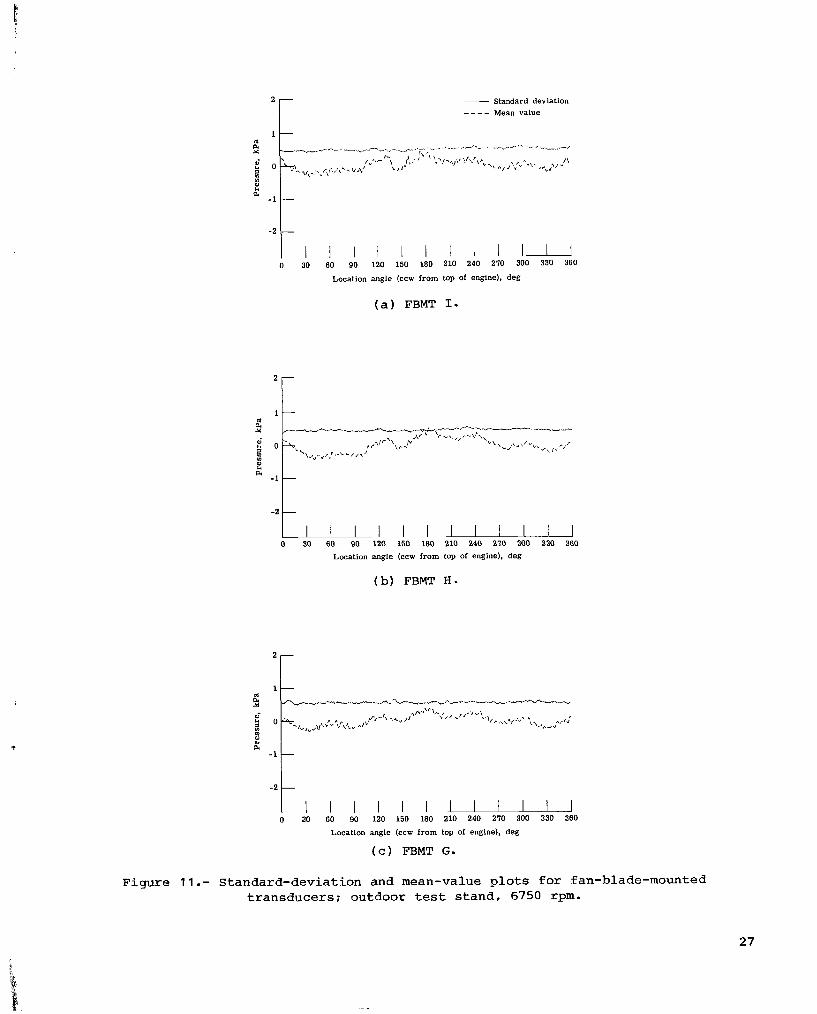
A t a nominal f an speed of 6750 xpm, t h e space/time-history p l o t s ( f i g . 1 0 ) f o r t ransducers G, H, and I (shown i n f i g . 6) show no observable t rends o r charac te r i s - t ics . This i m p l i e s t h a t t he re is no s t rong de te rmin i s t i c flow d i s t o r t i o n i n f r o n t of t he fan face. P l o t s of t he mean value deviat ion and the s tandard devia t ion f o r t h i s t e s t a r e shown i n f i g u r e 11. A quasi-s inusoidal v a r i a t i o n of one cycle around t h e circumference is observable a t a l l th ree t ransducer loca t ions along the blade span, while a mean value v a r i a t i o n of s i x cycles around t h e circumference is c l e a r l y seen i n FBMT G. (There is a l s o s o m e ind ica t ion of t h i s v a r i a t i o n i n FBMT H and I.) The observed one-cycle v a r i a t i o n d i f f e r s from t h a t shown i n t h e sample, i n t h a t t he sample shows a sharp peak a t one loca t ion , f i g u r e 9 ( a ) , while t h e observed v a r i a t i o n i n f igu re 10 appears t o be changing smoothly over t h e e n t i r e circumference. The s tandard devia t ion plot f o r a l l t h ree t ransducers shows a r e l a t i v e l y constant l e v e l around t h e circumference of t h e i n l e t .
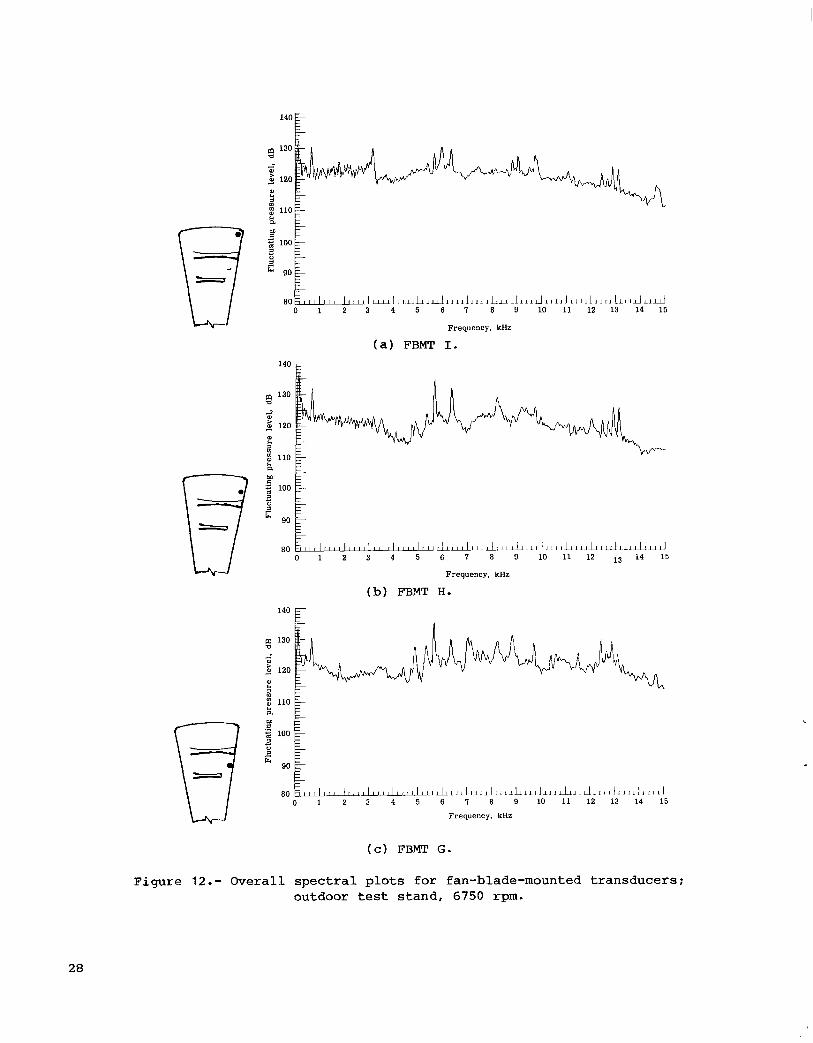
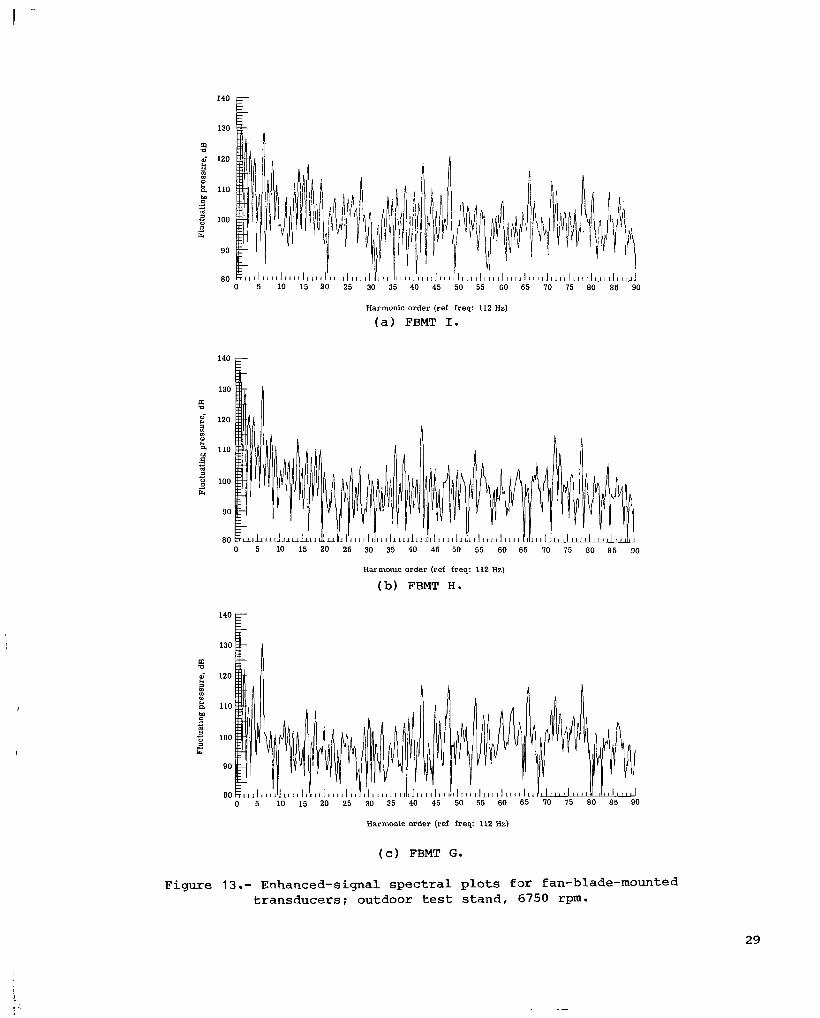
The s p e c t r a l p lots of t he ove ra l l p ressure ( f i g . 12) show l a rge peaks, a s expected, a t t h e fundamental fan frequency ( t h e one-cycle v a r i a t i o n ) and a t t he s i x t h harmonic ( t h e s ix-cycle va r i a t ion ) on a l l t h ree spanwise t ransducers . I n addi t ion , a l l the peaks i n t h e range below 4 kHz may be i d e n t i f i e d with harmonics of t he f an r o t a t i o n a l frequency. The peaks above 4 kHz, however, a r e not harmonically r e l a t e d t o the r o t a t i o n a l frequency of t he fan. Shown i n f i g u r e 13 is the l e v e l of t h e enhanced s i g n a l f o r 90 harmonic orders . A t t h e f i r s t , second, and s i x t h harmonics of t he r o t a t i o n a l frequency, t h e s igna l s from FBMT H and I a r e predominately pe r iod ic ( t h e o v e r a l l l e v e l and t h e enhanced-signal l e v e l a r e about equa l ) , and f o r FBMT G, the f irst and s i x t h harmonics a r e predominately per iodic . A t a l l o the r f requencies , t h e enhanced-signal l e v e l is considerably l o w e r than t h e o v e r a l l l eve l , i nd ica t ing a predominately random s igna l . A comparison of t h i s enhanced-signal spectrum t o t h e enhanced spectrum of t h e sample ( f i g . 9 ) shows t h a t a l l t h e harmonic content is considerably higher with the rod. This holds true even though it was shown t h a t t h e rod has a s p a t i a l e f f e c t over only about half t h e i n l e t .
The s ix-cycle p a t t e r n shown by the FBMT's has been observed before i n the JT15D engine (e.g., r e f . 9 ) . This p a t t e r n is a t t r i b u t e d t o an e f f e c t caused by s i x l a rge struts i n the bypass duct ( f i g . 3 ) . P r i o r t o t h e use of fan-blade-mounted transdu- cers, t h e ex is tence of t h i s pressure p a t t e r n was unsuspected (e.g., r e f . 14) . The p o t e n t i a l flow i n t e r a c t i o n of t he 6 struts with t h e 2 8 fan blades can e x c i t e a spinning mode with 22 nodes i n t h e duct. D i r e c t i v i t y p a t t e r n s measured i n t h e f a r f i e l d a t 10 500 r p m ( r e f . 9 ) and 12 000 rpm ( r e f . 10) i n d i c a t e t h a t t h i s p a r t i c u l a r spinning mode has been exc i ted and r ad ia t e s t o t h e f a r f i e l d . Therefore, t he p o t e n t i a l flow i n t e r a c t i o n s between fan blades and t h e s i x struts is a dominant source of f an noise.
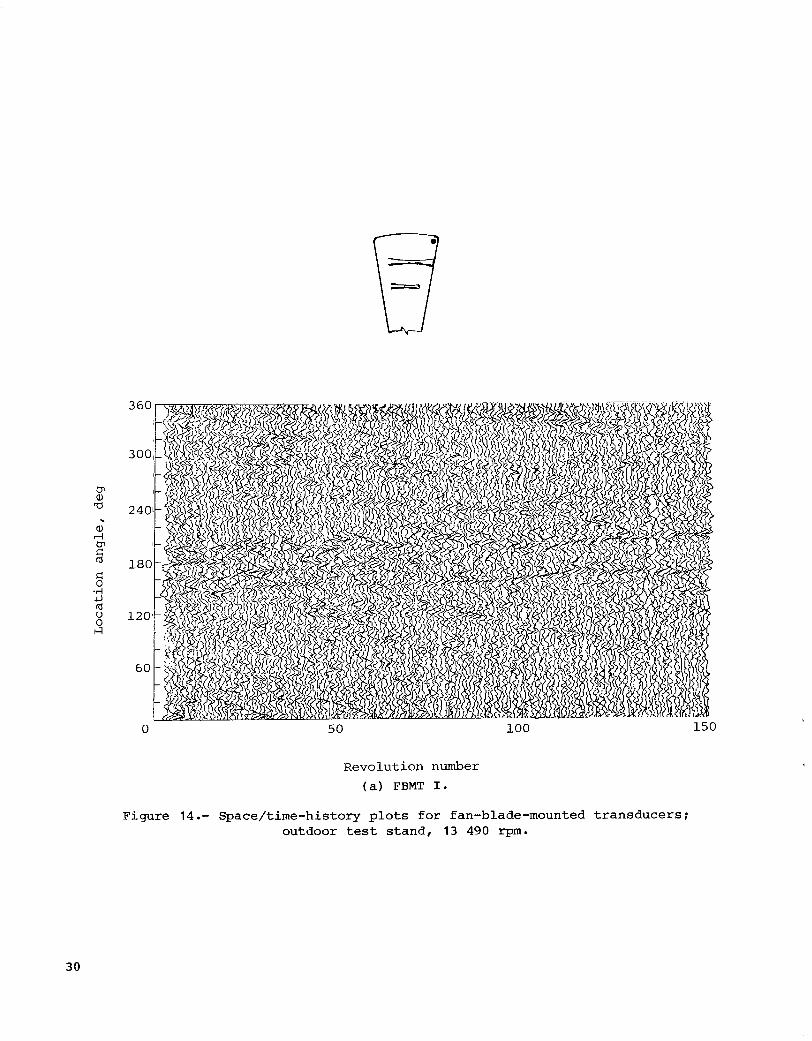
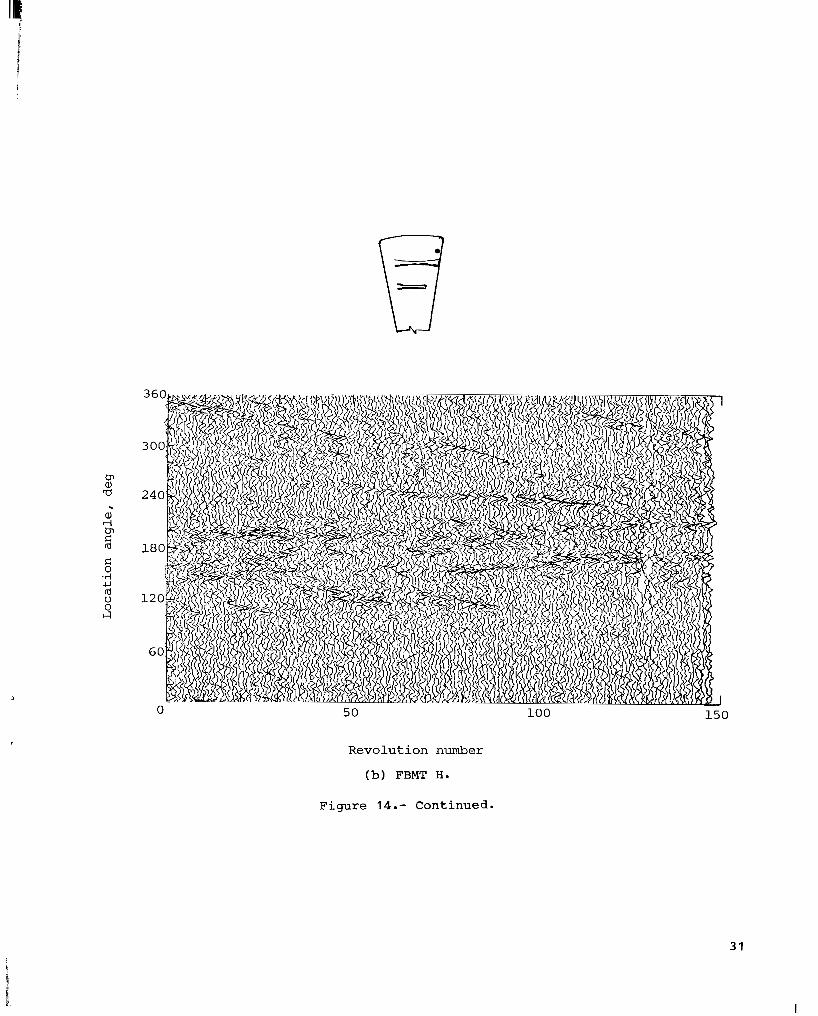
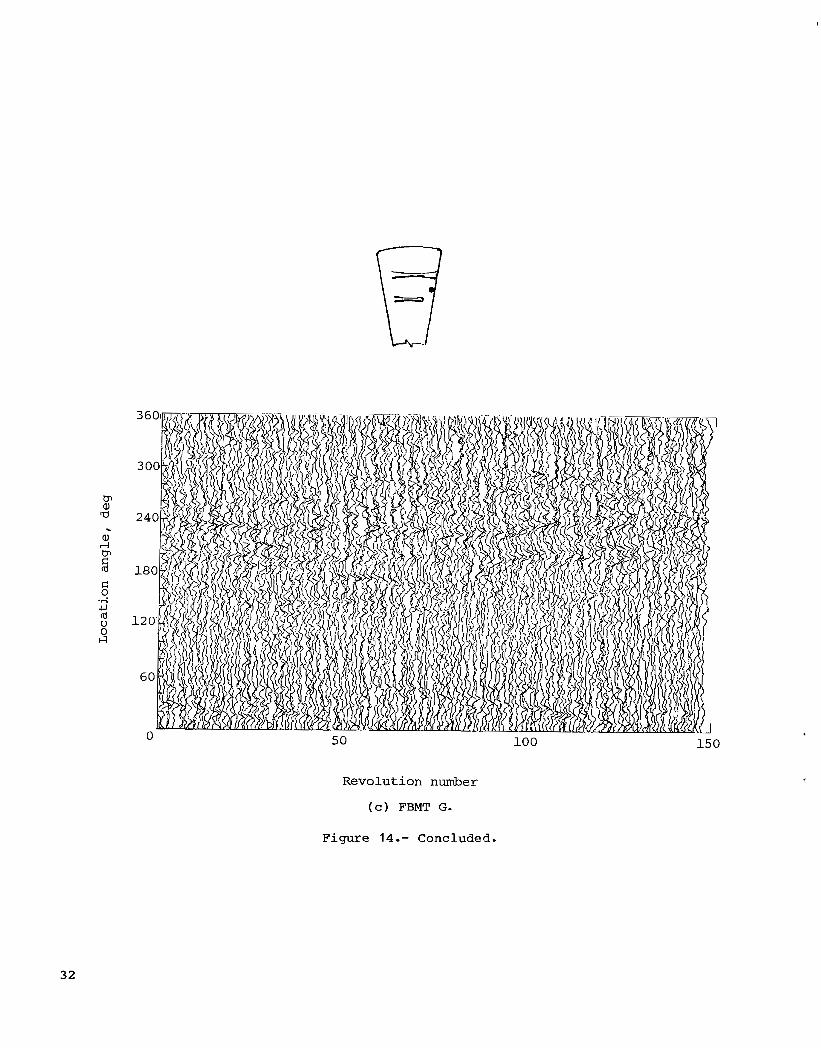
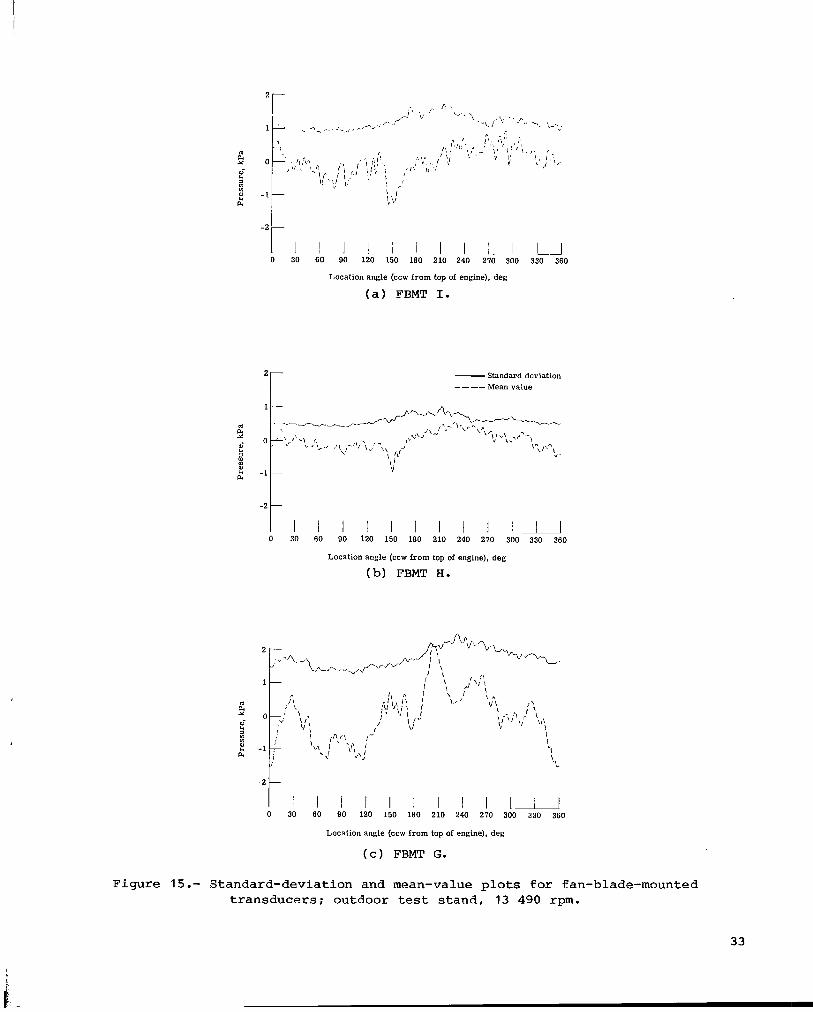
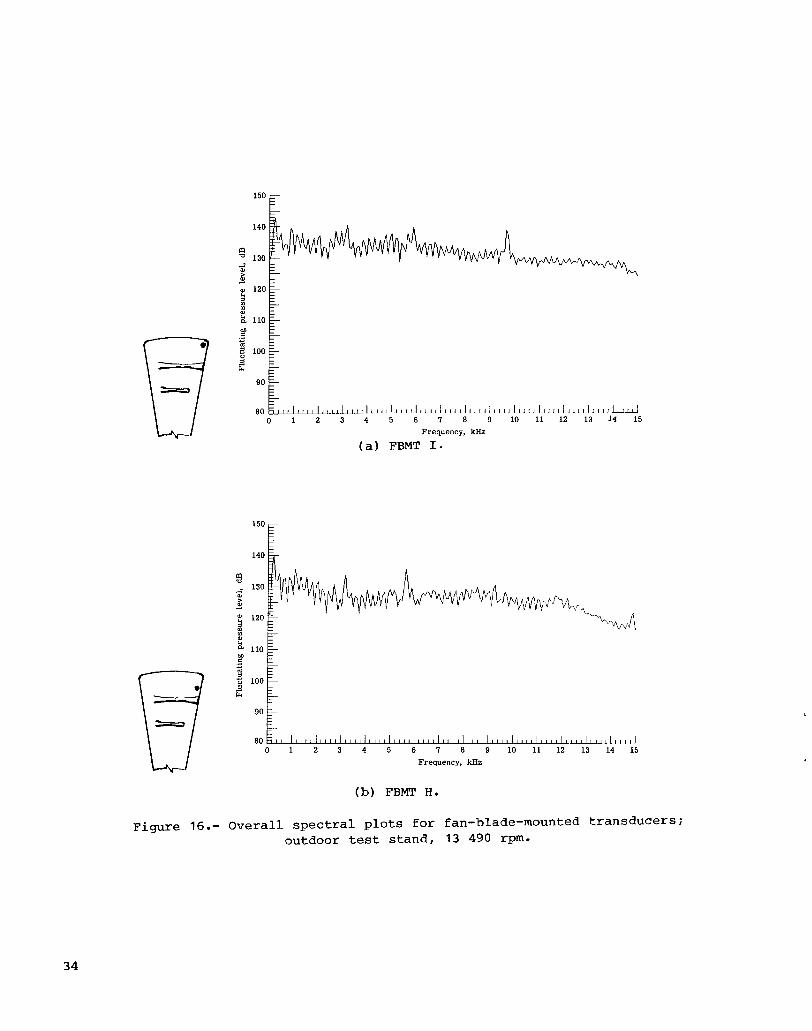
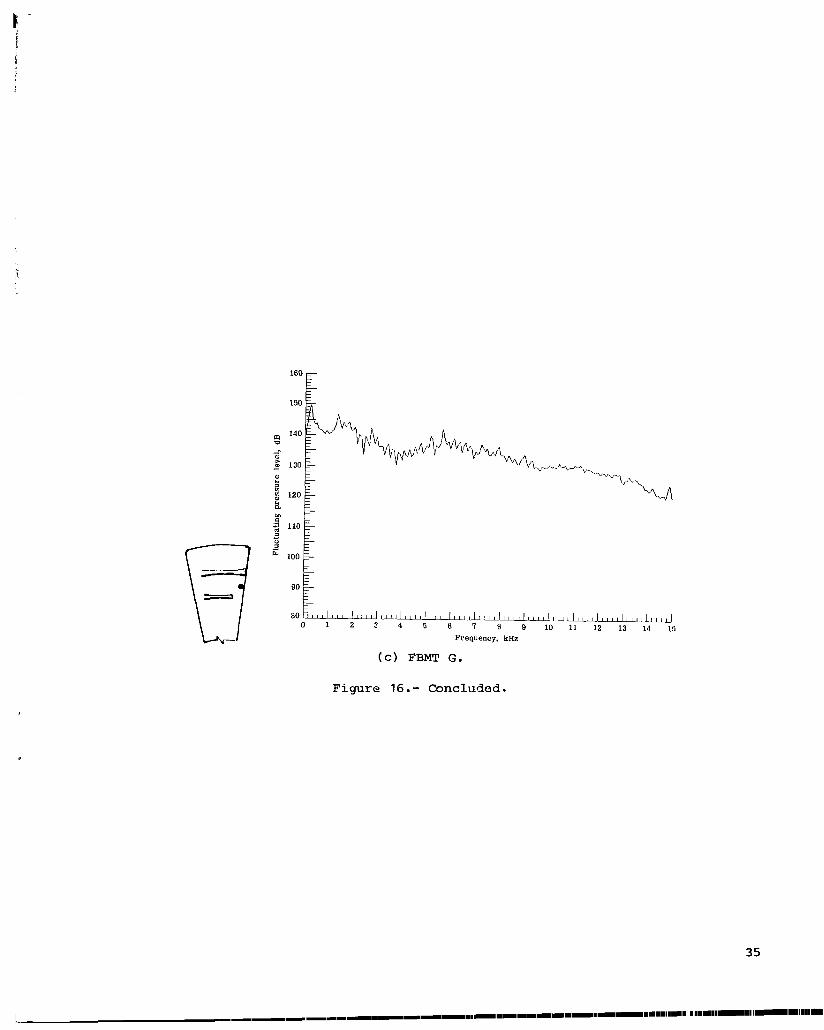
The space/time h i s t o r y f o r a 13 490-rpm run i s shown i n f i g u r e 14. During t h i s run, Parge random v a r i a t i o n s may be seen i n the pressure s i g n a l s from a l l t h r e e span- w i s e t ransducers . Although some of these v a r i a t i o n s l a s t only f o r a few cycles and t r ave r se across angular loca t ions , a l l t h ree t ransducers show a l a rge concentrat ion of dis turbances between 150° and 240O. These dis turbances a r e not steady, they con- t i nue throughout t he data run. The standard devia t ion f o r a l l t h ree t ransducers
7
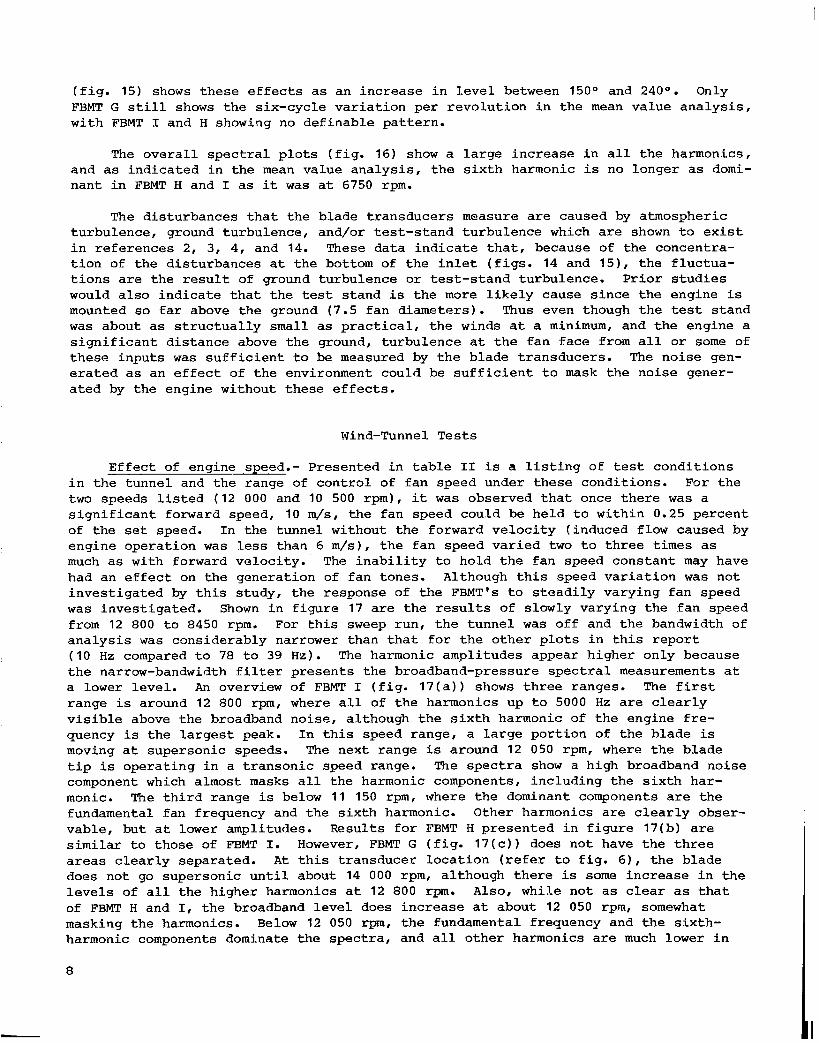
(fig. 15) shows these effects as an increase in level between 150° and 240O. Only FBMT G still shows the six-cycle variation per revolution in the mean value analysis, with FBMT I and H showing no definable pattern.
The overall spectral plots (fig. 16) show a large increase in all the harmonics, and as indicated in the mean value analysis, the sixth harmonic is no longer as domi- nant in FBMT H and I as it was at 6750 rpm.
The disturbances that the blade transducers measure are caused by atmospheric turbulence, ground turbulence, and/or test-stand turbulence which are shown to exist in references 2, 3, 4, and 14. These data indicate that, because of the concentra- tion of the disturbances at the bottom of the inlet (figs. 14 and 15), the fluctua- tions are the result of ground turbulence or test-stand turbulence. Prior studies would also indicate that the test stand is the more likely cause since the engine is mounted so far above the ground (7.5 fan diameters). Thus even though the test stand was about as structually small as practical, the winds at a minimum, and the engine a significant distance above the ground, turbulence at the fan face from all or some of these inputs was sufficient to be measured by the blade transducers. The noise gen- erated as an effect of the environment could be sufficient to mask the noise gener- ated by the engine without these effects.
Wind-Tunnel Tests
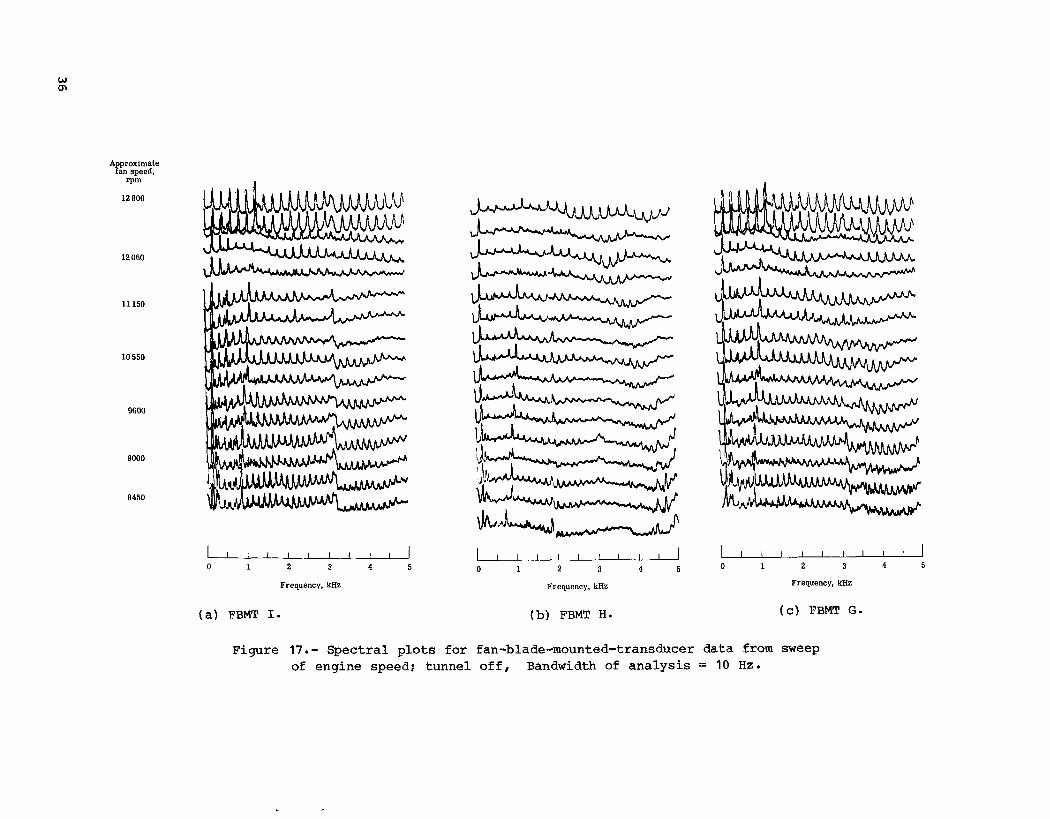
Effect of engine speed.- Presented in table I1 is a listing of test conditions in the tunnel and the range of control of fan speed under these conditions. For the two speeds listed (12 000 and 10 500 rpm), it was observed that once there was a significant forward speed, 10 m/s, the fan speed could be held to within 0.25 percent of the set speed. In the tunnel without the forward velocity (induced flow caused by engine operation was less than 6 m/s), the fan speed varied two to three times as much as with forward velocity. The inability to hold the fan speed constant may have had an effect on the generation of fan tones. Although this speed variation was not investigated by this study, the response of the FBMT's to steadily varying fan speed was investigated. Shown in figure 17 are the results of slowly varying the fan speed from 12 800 to 8450 rpm. For this sweep run, the tunnel was off and the bandwidth of analysis was considerably narrower than that for the other plots in this report (IO Hz compared to 78 to 39 Hz). The harmonic amplitudes appear higher only because the narrow-bandwidth filter presents the broadband-pressure spectral measurements at a lower level. An overview of FBMT I (fig. 17(a)) shows three ranges. The first range is around 12 800 rpm, where all of the harmonics up to 5000 Hz are clearly visible above the broadband noise, although the sixth harmonic of the engine fre- quency is the largest peak. In this speed range, a large portion of the blade is moving at supersonic speeds. The next range is around 12 050 rpm, where the blade tip is operating in a transonic speed range. The spectra show a high broadband noise component which almost masks all the harmonic components, including the sixth har- monic. The third range is below 1 1 150 rpm, where the dominant components are the fundamental fan frequency and the sixth harmonic. Other harmonics are clearly obser- vable, but at lower amplitudes. Results for FBMT H presented in figure 17(b) are similar to those of FBMT I. However, FBMT G (fig. 17(c)) does not have the three areas clearly separated. At this transducer location (refer to fig. 6), the blade does not go supersonic until about 14 000 rpm, although there is some increase in the levels of all the higher harmonics at 12 800 rpm. Also, while not as clear as that of FBMT H and I, the broadband level does increase at about 12 050 rpm, somewhat masking the harmonics. Below 12 050 rpm, the fundamental frequency and the sixth- harmonic components dominate the spectra, and all other harmonics are much lower in
8
amplitude. A s noted i n reference 9, it is very d i f f i c u l t t o maintain t h e fan speed within 300 r p m when t e s t i n g outdoors with no inflow cont ro l devices. The s w e e p spec- t r a l data shown i n d i c a t e t h e loading on the blades va r i e s considerably a s t he fan speed approaches supersonic ve loc i ty , and such va r i a t ion could e a s i l y cause d i f f e r e n t noise generat ion mechanisms ( r e f s . 3 and 15) t o be t r iggered . This v a r i a t i o n would make it very d i f f i c u l t , i f not impossible, t o separa te the d i f f e r e n t mechanisms caus- ing t h e noise.
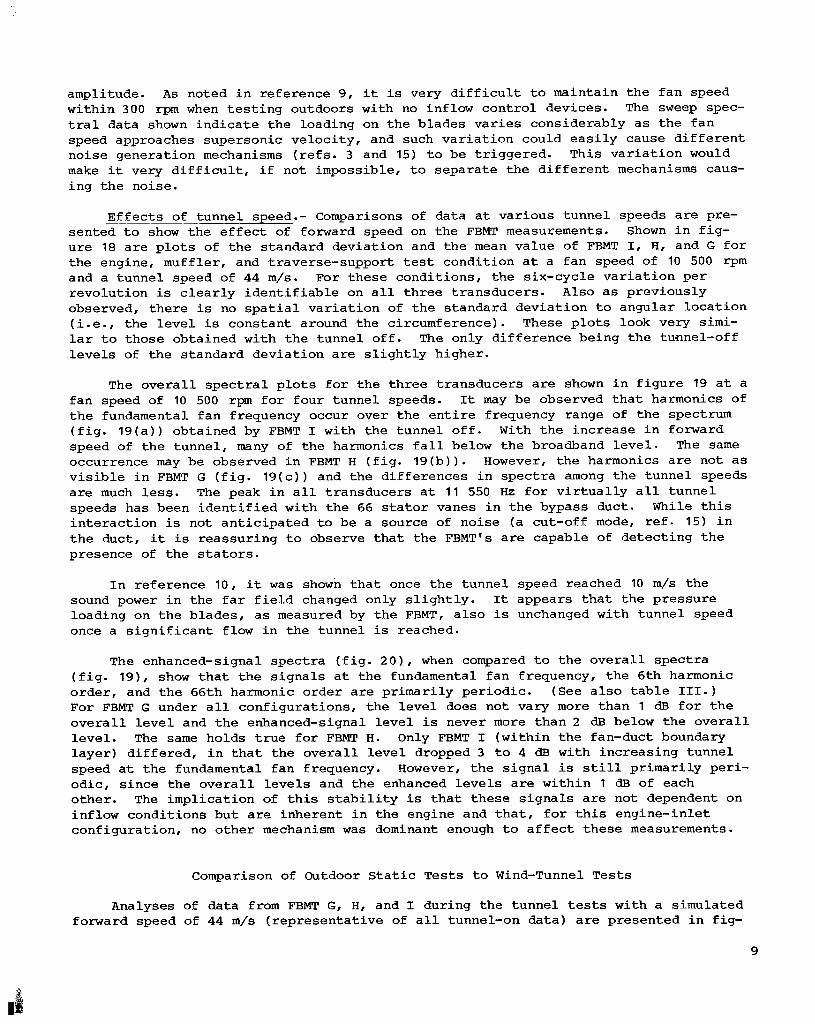
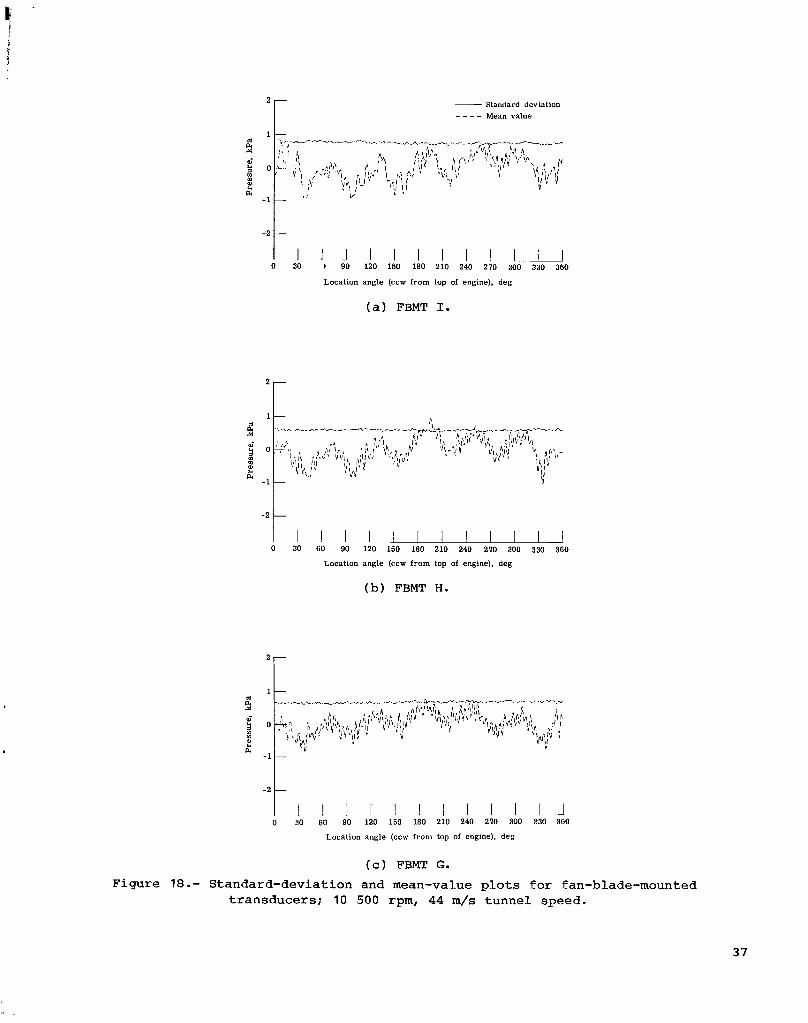
E f fec t s of tunnel speed.- Comparisons of data a t var ious tunnel speeds a r e pre- sented t o show the e f f e c t of forward speed on the FBMT measurements. Shown i n f ig - ure 18 a r e p l o t s of t he s tandard deviat ion and t h e mean value of FBMT I, H, and G f o r the engine, muffler, and traverse-support test condi t ion a t a fan speed of 10 500 r p m and a tunnel speed of 44 m/s. For t hese condi t ions, t he six-cycle v a r i a t i o n pe r revolut ion is c l e a r l y i d e n t i f i a b l e on a l l t h ree t ransducers . A l s o a s previously observed, t he re is no s p a t i a l v a r i a t i o n of t he s tandard devia t ion t o angular loca t ion ( i .e . , t he l e v e l is constant around the circumference). These plots look very simi- l a r t o those obtained with the tunnel o f f . The only d i f fe rence being t h e tunnel-off l eve l s of t h e s tandard devia t ion a r e s l i g h t l y higher .
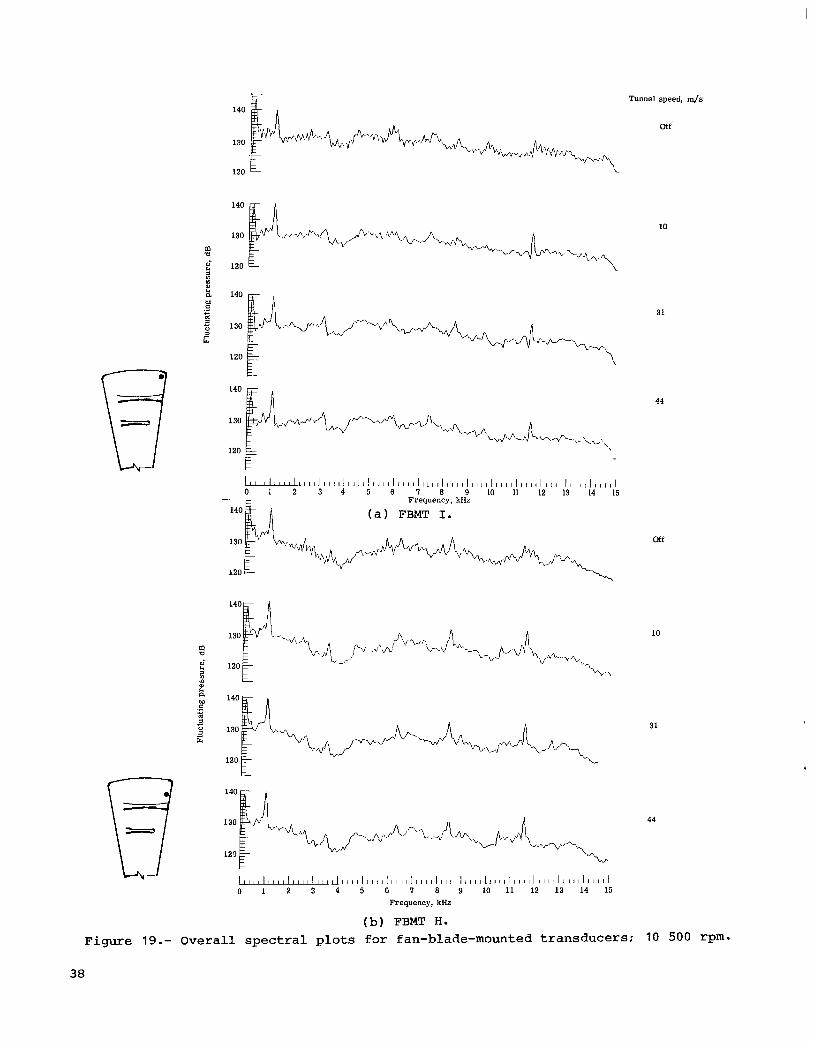
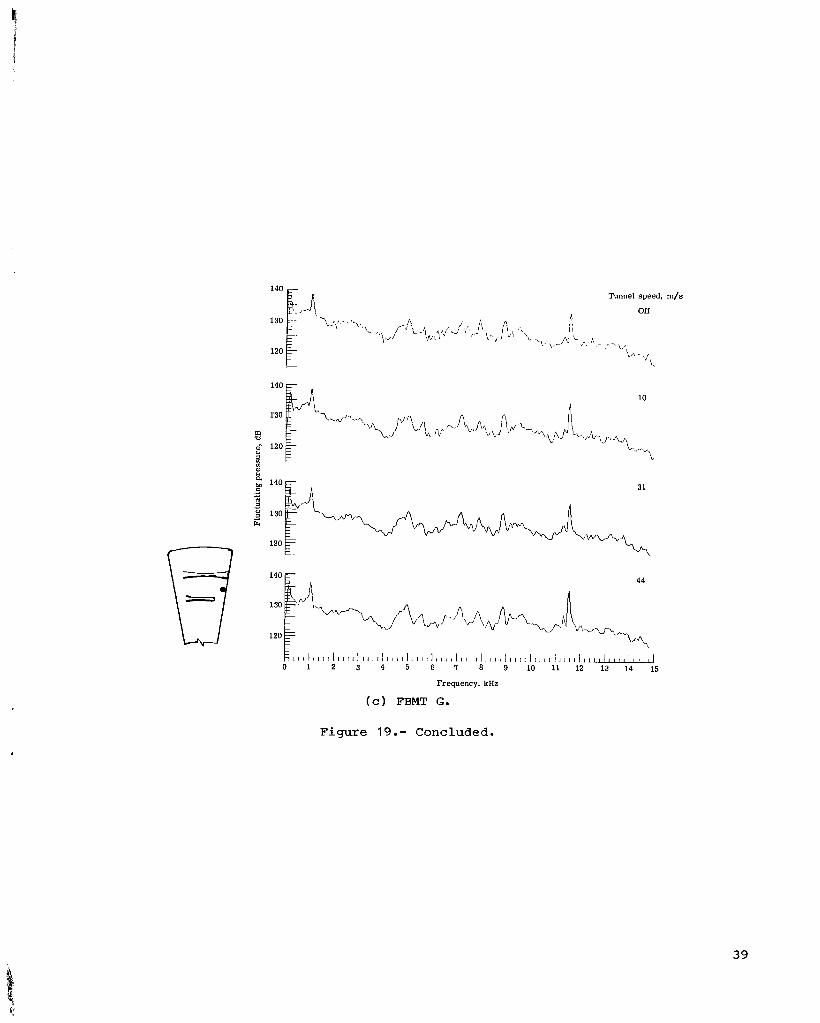
The o v e r a l l s p e c t r a l p l o t s f o r t he th ree t ransducers a r e shown i n f igu re 19 a t a fan speed of 10 500 rpm f o r four tunnel speeds. It may be observed t h a t harmonics of t h e fundamental fan frequency occur over t he e n t i r e frequency range of t h e spectrum ( f i g . 1 9 ( a ) ) obtained by FBMT I with the tunnel o f f . With t h e increase i n forward speed of t he tunnel , many of t he harmonics f a l l below t h e broadband l eve l . The same occurrence may be observed i n FBMT H ( f i g . 1 9 ( b ) ) . However, t he harmonics a r e not a s v i s i b l e i n FBMT G ( f i g . 1 9 ( c ) ) and the d i f fe rences i n spec t ra among the tunnel speeds a r e much l e s s . The peak i n a l l t ransducers a t 11 550 Hz f o r v i r t u a l l y a l l tunnel speeds has been i d e n t i f i e d with t h e 66 s t a t o r vanes i n the bypass duct. While t h i s i n t e r a c t i o n is not an t i c ipa t ed t o be a source of noise (a cut-off mode, r e f . 15) i n t h e duct, it is reassuring t o observe t h a t t he FBMT's a r e capable of detec t ing t h e presence of the s t a t o r s .
I n reference 10 , it was shown t h a t once the tunnel speed reached 10 m/s t he sound power i n the f a r f i e l d changed only s l i g h t l y . It appears t h a t the pressure loading on t h e blades, a s measured by the FBMT, a l s o is unchanged with tunnel speed once a s i g n i f i c a n t flow i n the tunnel is reached.
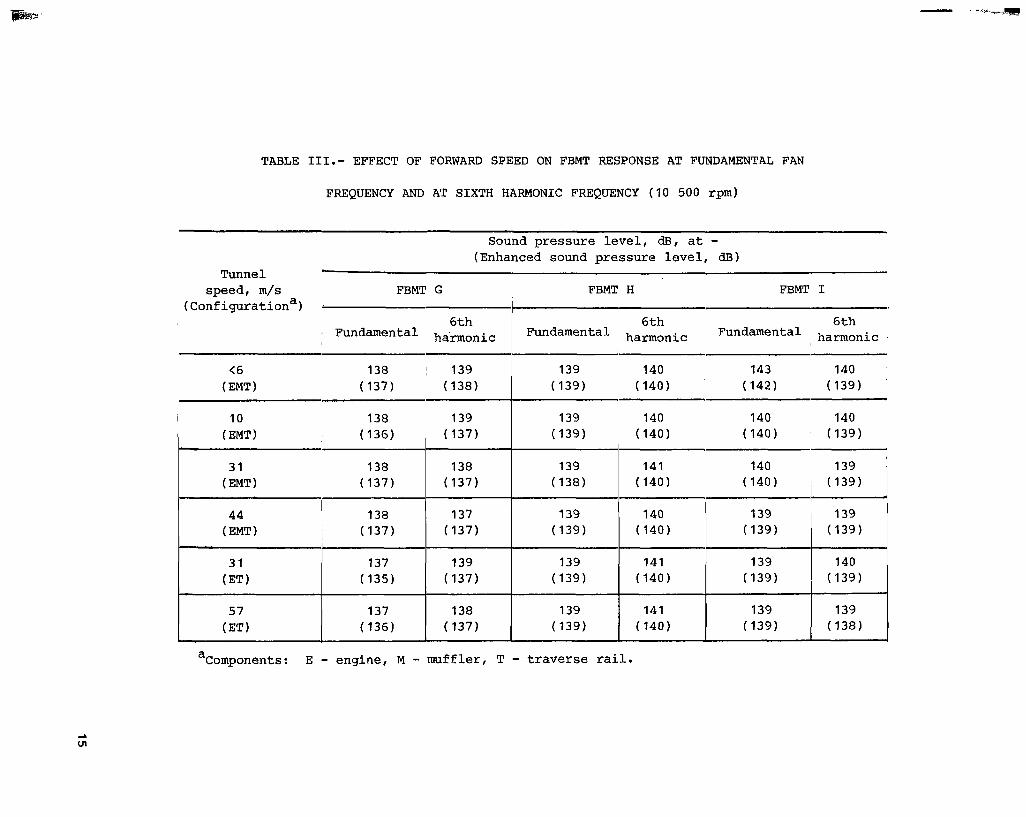
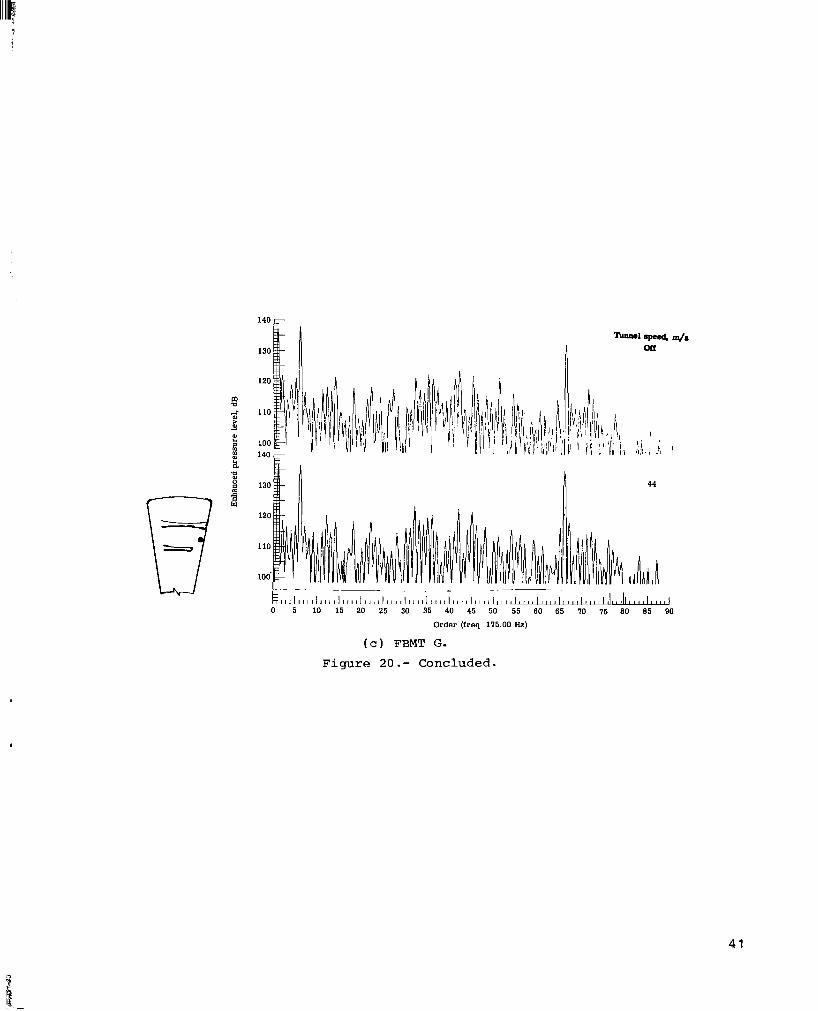
The enhanced-signal spec t ra ( f i g . 2 0 ) , when compared t o t h e o v e r a l l spec t ra ( f i g . 19) , show t h a t t h e s igna l s a t t he fundamental fan frequency, t he 6th harmonic order , and t h e 66th harmonic order a r e pr imari ly per iodic . (See a l s o t a b l e 111.) For FBMT G under a l l configurat ions, t he l e v e l does not vary more than 1 dB f o r t h e o v e r a l l l e v e l and t h e enhanced-signal l e v e l i s never more than 2 dB below the o v e r a l l l eve l . The same holds t r u e f o r FBM" H. Only FBMT I (wi th in the fan-duct boundary l aye r ) d i f f e red , i n t h a t t he o v e r a l l l e v e l dropped 3 t o 4 dB with increas ing tunnel speed a t t h e fundamental fan frequency. However, t he s i g n a l is s t i l l pr imar i ly peri- odic , s ince t h e o v e r a l l l e v e l s and the enhanced l e v e l s a r e within l dB of each o ther . The implicat ion of t h i s s t a b i l i t y is t h a t t hese s igna l s a r e not dependent on inflow condi t ions bu t a r e inherent i n t h e engine and t h a t , f o r t h i s engine- inlet configurat ion, no o the r mechanism was dominant enouqh t o a f f e c t these measurements.
Comparison of Outdoor S t a t i c T e s t s t o Wind-Tunnel Tests
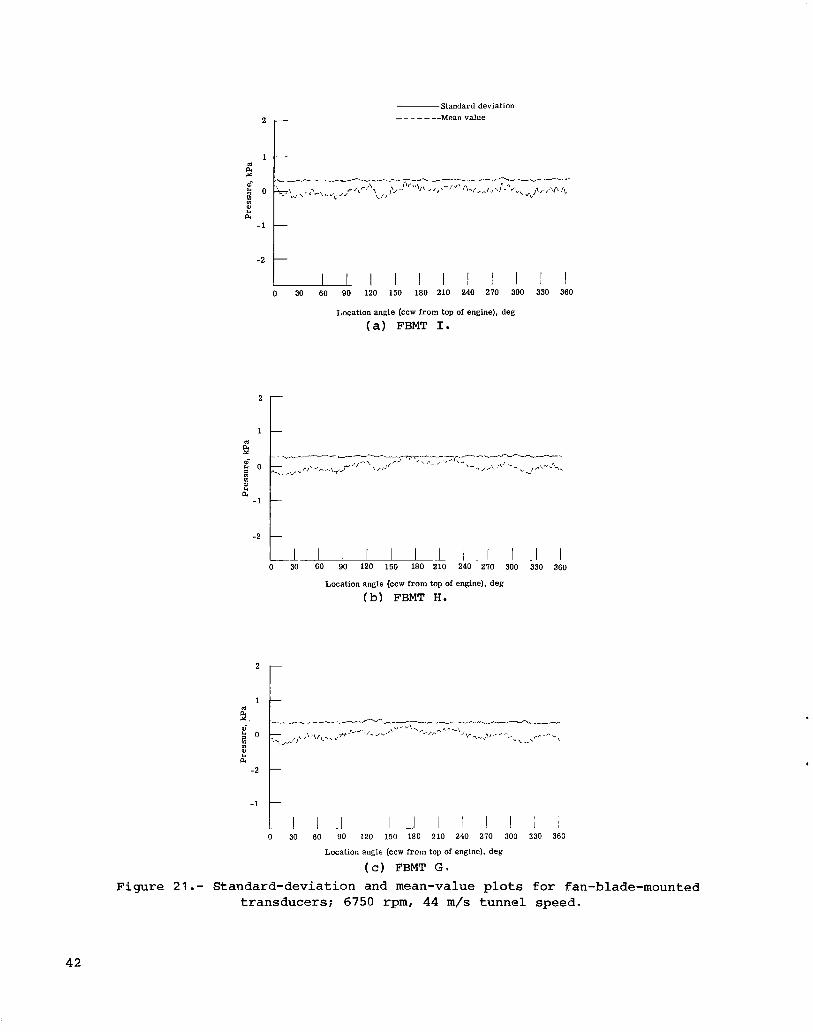
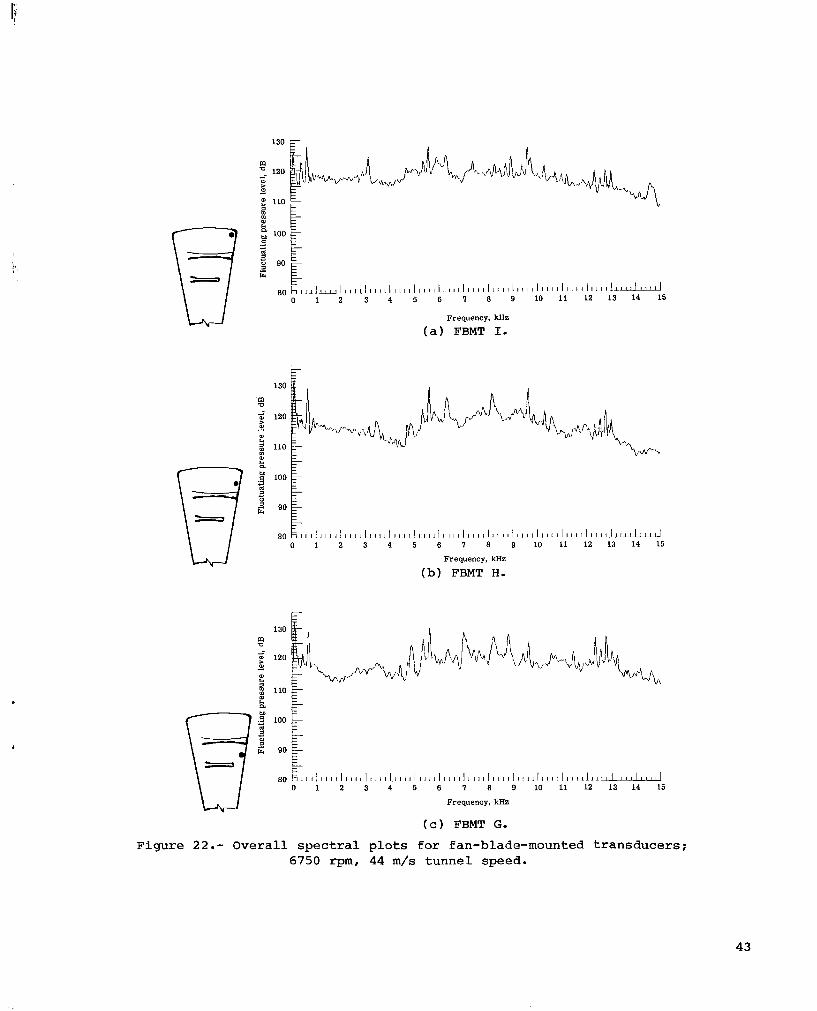
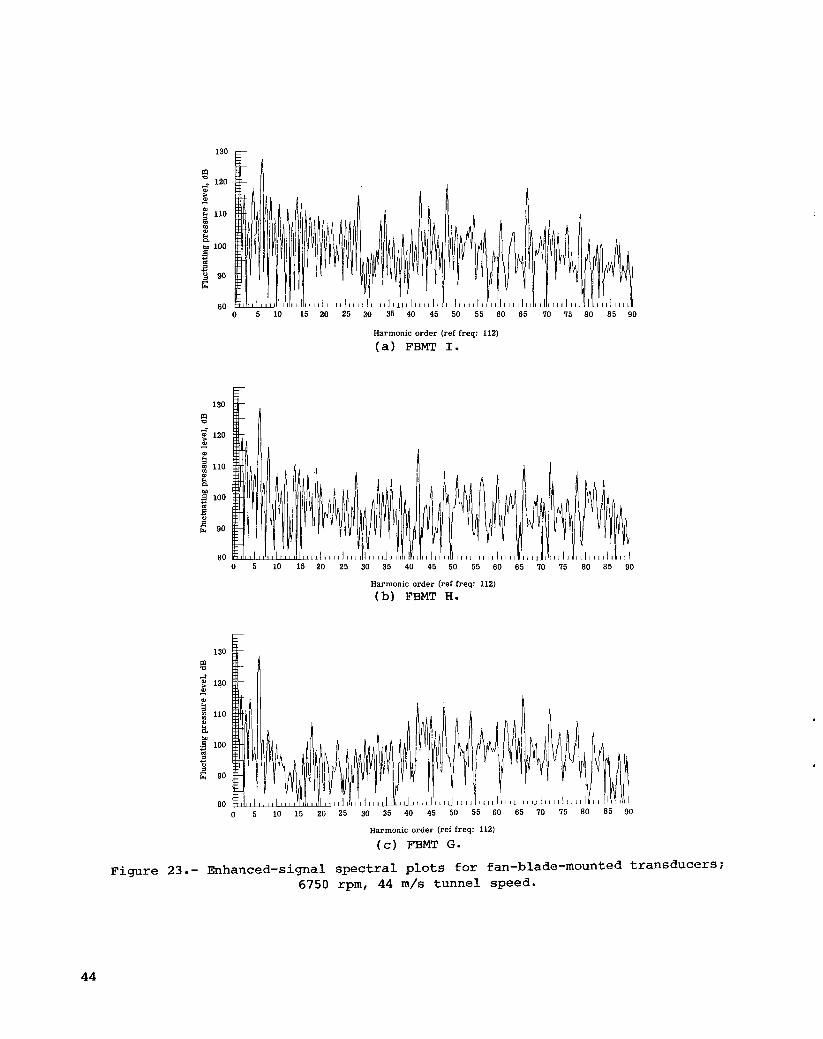
Analyses of data from FBMT G, H, and I during the tunnel tests with a simulated forward speed of 44 m/s ( r ep resen ta t ive of a l l tunnel-on da ta ) a r e presented i n f ig-
9

ures 2 1, 22 , and 23. The s tandard devia t ion and t h e mean value ana lys i s f o r FBMT G, H, and I a t 6750 rpm look very s i m i l a r t o t h e outdoor r e s u l t s . (See f i g s . 11, 12, and 13.) The mean value analyses show t h e same one- and six-cycle-per-revolution v a r i a t i o n s a s t he outdoor test . The only observable d i f f e rence is t h a t t h e l e v e l of t h e s tandard devia t ion is about 10 percent l o w e r i n t h e tunnel. However, t h i s small d i f fe rence i n the s tandard devia t ion is much more observable i n the o v e r a l l s p e c t r a l plots, compare f i g u r e 22 with f igu re 12. B e l o w 5000 Hz, a l l t h r e e t ransducers show a 4- t o 5-dB drop i n the broadband l e v e l compared t o the data obtained on t h e outdoor t es t stand. Above 5000 Hz, the l e v e l drops 2 o r 3 dB, although t h e r e is almost no change a t some frequencies . In addi t ion , t he mul t ip le harmonics, c l e a r l y v i s i b l e i n t h e outdoor tests, a r e now buried i n the broadband spec t ra of t h e tunnel tests, even though t h i s l e v e l is lower than before . The only s i g n a l l e v e l s s t i l l showing more than 6 dB above t h e broadband noise f o r a l l t h e spanwise measurements a r e t h e f i r s t and s i x t h harmonics. The enhanced-signal spec t ra ( f i g . 23 ) show t h a t , although t h e f i rs t -harmonic pe r iod ic components have var ied somewhat on a l l t h r e e t ransducers , t he sixth-harmonic l e v e l has remained a t almost t h e same amplitude i n the tunnel and outdoors. This is cons is ten t with t h e mean value plot observat ions.
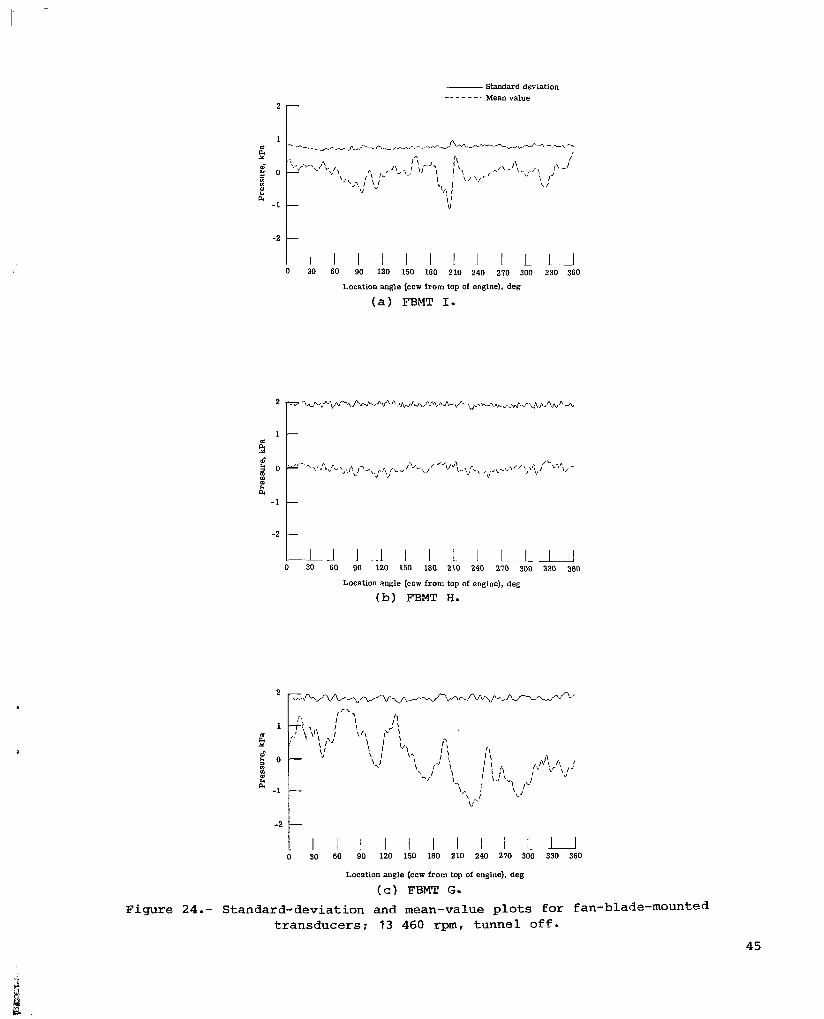
The space/time-history ana lys i s €or t h e 13 460-rpm run i n t h e tunnel showed no t r e n d o r observable pressure p a t t e r n s , even with t h e tunnel o f f . The s tandard devia- t i o n and mean value p l o t s ( f i g . 24 ) do not show any s i m i l a r i t y with the outdoor t e s t s (see f i g . 151, even with the tunnel o f f . While t h e r e is an ind ica t ion of t h e six- cycle v a r i a t i o n per revolut ion i n FBMT G, t he general shapes a r e not a t a l l s imi l a r . However, one phenomenon may be observed. The s tandard devia t ion ( i . e . , t h e random component), a s i n the tunnel a t 6750 r p m , does not have any p a r t i c u l a r sensi- t i v i t y t o angular loca t ion once t h e r e is any forward speed. The outdoor t es t r e s u l t s ( f i g . 15) showed a d e f i n i t e increase i n the s tandard devia t ion a t t he bottom of t h e engine, bu t t h i s s p a t i a l v a r i a t i o n disappears with forward speed.
The r e s u l t of these comparisons i n d i c a t e t h a t , even a t t he low fan speeds on t h e outdoor tes t s tand, extraneous turbulen t flow e n t e r s t h e i n l e t and is de tec ted on the fan blades. This tu rbulen t f l o w , which could con t r ibu te t o tone-l ike noise ( r e f . 11) i n t h e f a r f i e l d , is seen a s an increase i n t h e broadband l e v e l and i n t h e harmonic l eve l s of t he engine fundamental frequency on t h e FBMT. A s t he fan speed increases , e f f e c t s of the t e s t s tand and/or t he ground plane a r e i d e n t i f i a b l e a s angular nonuni- formi t ies which a l s o o f f e r an input t o tone-l ike noise generat ion. One e f f e c t t h a t was not s i g n i f i c a n t l y changed was t h e dominance of t he six-cycle-per-revolution phe- nomenon caused by the i n t e r n a l struts. This c h a r a c t e r i s t i c of t he engine was iden t i - f i a b l e and was of t he same magnitude with or without forward speed. The s i x struts appear t o a f f e c t only the mean pressure v a r i a t i o n and not t h e s tandard devia t ion of t h e pressure s igna l . This va r i a t ion of s t a t i c pressure , b u t not t he f l u c t u a t i n g components, with physical l oca t ion would i n d i c a t e a type of s p a t i a l l y f ixed p o t e n t i a l flow f i e l d s e t up by t h e struts. Additional da ta from f l u c t u a t i n g pressure measure- ments behind the fan face w i l l be necessary t o determine the exact nature of t h i s s ix-cycle v a r i a t i o n a t t he fan face because of t h e complex nature of t he fan, s t a t o r s , and bypass duct.
CONCLUSIONS
A s p a r t of a program t o inves t iga t e the fan noise of a turbofan engine, tes ts have been conducted using a JT15D engine. TO a i d i n understanding t h e mechanism of the fan noise generat ing process, data from pressure t ransducers mounted d i r e c t l y on t h e fan blades w e r e obtained during normal opera t ion of t h e engine. Conventional and enhanced-signal data reduction methods w e r e implemented t o i n t e r p r e t t h e s ign i f i cance
10
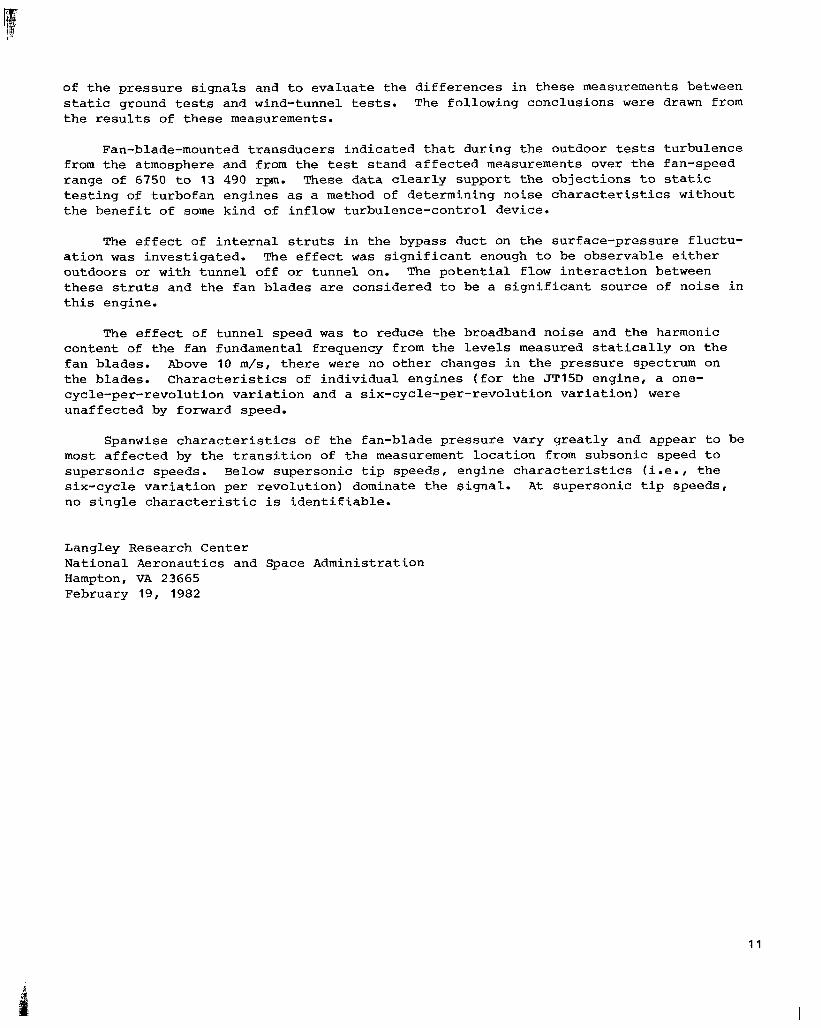
of the pressure signals and to evaluate the differences in these measurements between static ground tests and wind-tunnel tests. The following conclusions were drawn from the results of these measurements.
Fan-blade-mounted transducers indicated that during the outdoor tests turbulence from the atmosphere and from the test stand affected measurements over the fan-speed range of 6750 to 13 490 rpm. These data clearly support the objections to static testing of turbofan engines as a method of determining noise characteristics without the benefit of some kind of inflow turbulence-control device.
The effect of internal struts in the bypass duct on the surface-pressure fluctu- ation was investigated. The effect was significant enough to be observable either outdoors or with tunnel off or tunnel on. The potential flow interaction between these struts and the fan blades are considered to be a significant source of noise in this engine.
The effect of tunnel speed was to reduce the broadband noise and the harmonic content o f the fan fundamental frequency from the levels measured statically on the fan blades. Above 10 m/s, there were no other changes in the pressure spectrum on the blades. Characteristics of individual engines ( f o r the JT15D engine, a one- cycle-per-revolution variation and a six-cycle-per-revolution variation) were unaffected by forward speed.
Spanwise characteristics of the fan-blade pressure vary greatly and appear to be most affected by the transition of the measurement location from subsonic speed to supersonic speeds. Below supersonic tip speeds, engine characteristics (i.e., the six-cycle variation per revolution) dominate the signal. At supersonic tip speeds, no single characteristic is identifiable.
Langley Research Center National Aeronautics and Space Administration Hampton, VA 23665 February 19, 1982
1 1
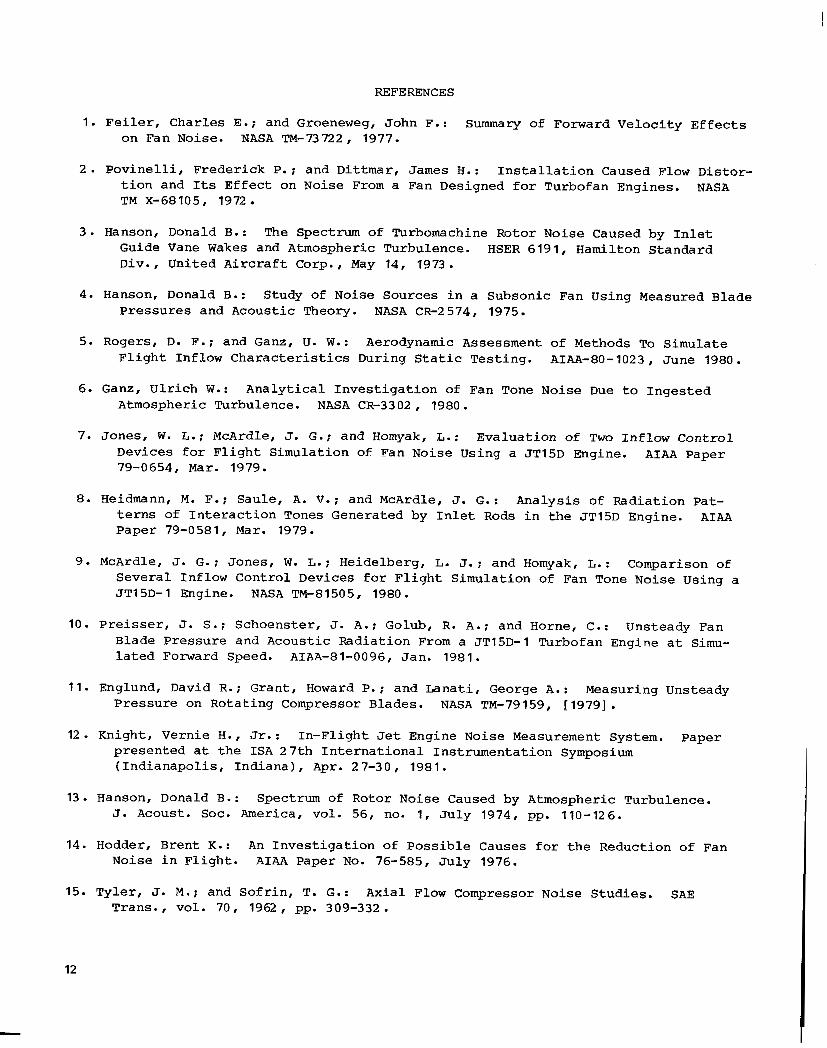
REFERENCES
1. F e i l e r , Charles E . ; and Groeneweg, John F.: Summary of Forward Veloci ty Ef fec t s on Fan Noise. NASA TM-73722 , 1977.
2 . Pov ine l l i , Frederick P. ; and D i t t m a r , J a m e s H. : I n s t a l l a t i o n Caused low D i s t o r - t i o n and Its Effec t on Noise From a Fan Designed f o r Turbofan Engines. NASA TM X-68105, 1972
3 . Hanson, Donald B.: The Spectrum of Turbomachine Rotor N o i s e Caused by I n l e t Guide Vane Wakes and Atmospheric Turbulence. HSER 619 1 , Hamilton Standard D i v . , United Aircraft Corp . , May 14, 1973.
4. Hanson, Donald B.: Study of Noise Sources i n a Subsonic Fan Using Measured Blade Pressures and Acoustic Theory. NASA CR-2574, 1975.
5. Rogers, D. F.; and Ganz, U. W.: Aerodynamic Assessment of Methods To Simulate F l i g h t Inflow Charac te r i s t i c s During S t a t i c Testing. AIAA-80- 1023 , June 1980.
6. Ganz, Ul r ich W.: Analyt ical Inves t iga t ion of Fan Tone N o i s e Due t o Inges ted Atmospheric Turbulence. NASA CR-3302 , 1980.
7. Jones, W. L.; McArdle, J. G.; and Homyak, L.: Evaluation of Two Inflow Control Devices f o r F l i g h t Simulation of Fan Noise Using a JT15D Engine. AIAA Paper 79-0654, Mar. 1979.
8. Heidmann, M. F.; Saule, A. V.; and M c A r d l e , J. G.: Analysis of Radiation Pat- t e r n s of I n t e r a c t i o n Tones Generated by I n l e t Rods i n t h e JT15D Engine. AIAA Paper 79-0581, M a r . 1979.
9. McArdle, J. G . ; Jones, W. L.; Heidelberg, L. J.; and Homyak, L.: Comparison of Several Inflow Control Devices f o r F l i g h t Simulation of Fan Tone N o i s e Using a JT15D-1 Engine. NASA TM-81505, 1980.
10. PreiSSer, J. S . ; Schoenster, J. A , ; Golub, R. A . ; and Horne, C.: Unsteady Fan Blade Pressure and Acoustic Radiation From a JT15D-1 Turbofan Engine a t simu- l a t e d Forward Speed. AIAA-8 1-0096, Jan. 198 1.
11. Englund, David R.; Gran t , Howard P. ; and Lanat i , George A.: Measuring Unsteady Pressure on Rotating compressor Blades. NASA TM-79159, [1979].
12. Knight, Vernie H. , Jr.: In-Fl ight Je t Engine N o i s e Measurement System. Paper presented a t t h e ISA 27th In t e rna t iona l Instrumentat ion Symposium ( Indianapol i s , Ind iana) , A p r . 27-30 , 1981.
13. Hanson, Donald B.: Spectrum of Rotor N o i s e Caused by Atmospheric Turbulence. J. ACOUSt. Soc. America, vol. 56, no. 1, Ju ly 1974, pp. 110-126.
14. Hodder, Brent K.: An Inves t iga t ion of Poss ib le Causes f o r t h e Reduction of Fan N o i s e i n F l igh t . AIAA Paper No. 76-585, Ju ly 1976.
15. Tyler, J. M.; and Sofr in , T. G.: A x i a l Flow Compressor Noise Studies . SAE Trans., vol. 70, 1962, pp. 309-332.
12
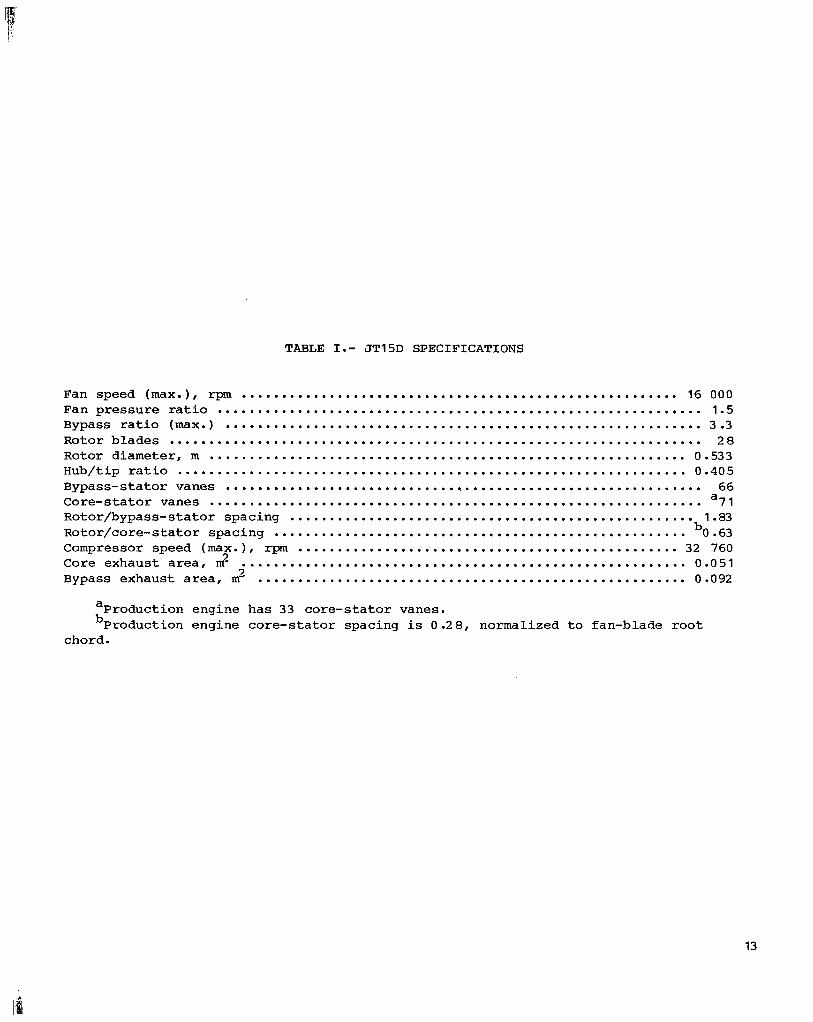
TABLE I.- JT15D SPECIFICATIONS
Fan speed (max.), rpm ....................................................... 16 000 Fan pressure r a t i o ............................................................. 1.5 Bypass r a t i o (max.) ............................................................ 3.3 Rotor blades ................................................................... 28 Rotor diameter. m ............................................................ 0.533 Hub/tip r a t i o ................................................................ 0.405 Bypass-stator vanes ............................................................ 66 Core-s ta tor vanes .............................................................. a 7 ~ Rotor/bypass-stator spacing ................................................... 1.83 Rotor/core-stator spacing .................................................... . 63 Compressor speed (max.), r p m ................................................ 32 760 C o r e exhaust area. n? ........................................................ 0.051 Bypass exhaust area. 2 ...................................................... 0.092
aProduction engine has 33 core-s ta tor vanes . bProduction engine core-s ta tor spacing is 0.2 8. normalized t o fan-blade roo t
chord .
13
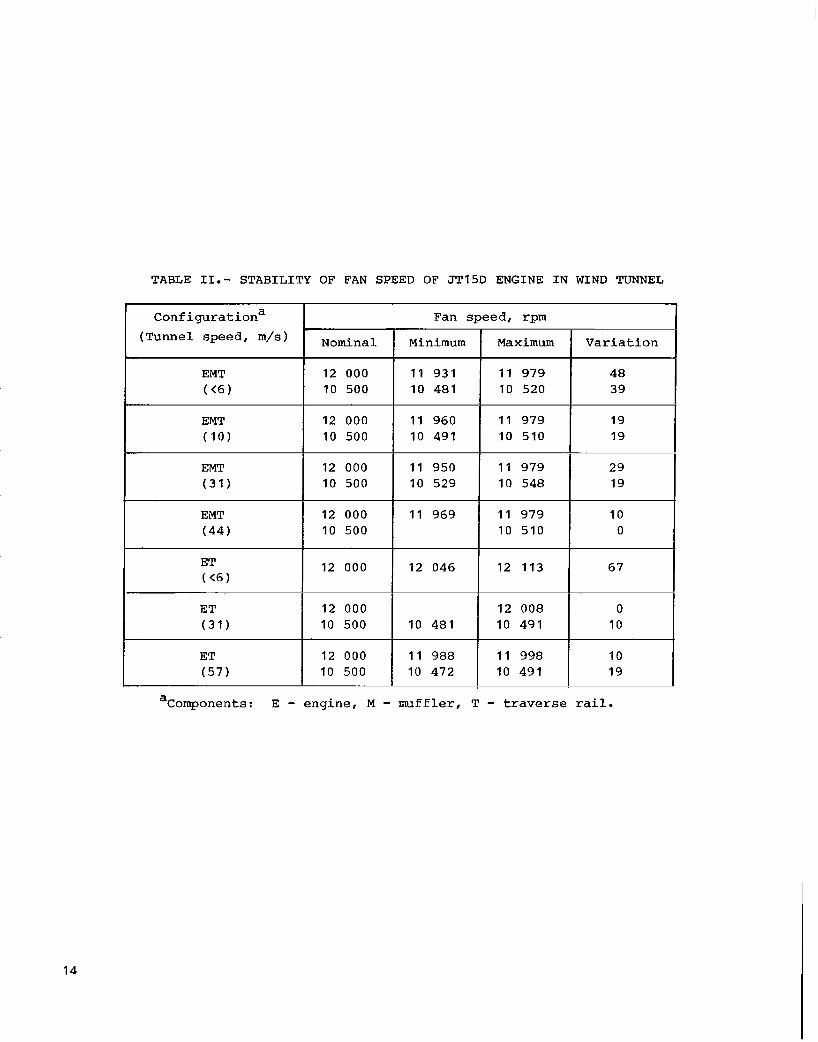
TABLE 11.- STABILITY OF FAN SPEED OF JT15D ENGINE IN WIND TUNNEL
1 1 950 10 529
Configurationa (Tunnel speed, m/s)
1 1 979 10 548
12 000 10 500
12 000 (10) 10 500
1 1 969
EMT (31 1
1 1 979 10 510
12 000 10 500
12 046
EMT (44)
12 113
12 000 10 500
10 481
I 12 000
12 008 10 491
12 000 10 500
1 1 988 10 472
12 000 10 500
1 1 998 10 491
Fan speed, rpm
Minimum I Maximum
1 1 931 1 1 979 10 481 10 520
1 1 960 1 1 979 10 491 10 510
Variation
48 39
19 19
29 19
10 0
67
0 10
10 19
aComponents: E - engine, M - muffler, T - traverse rail.
14
- ------
speed I m/s FBMT G ( Configurationa)
TABLE 111.- EFFECT OF FORWARD SPEED ON FBMT FtESPONSE AT FUNDAMENTAL FAN
FREQUENCY AND AT SIXTH HARMONIC FREQUENCY (IO 500 rpm)
FBMT I FBMT H
31 (ET)
57 (ET)
6th 6th Fundamental hgmonic Fundamental harmonic Fundamental harmonic I
137 139 139 141 139 140 (135) (137) (139) (140) (139) (139)
137 138 139 141 139 139 (136) (137) (139) (140) (139) (138)
10 138 139 140 140 140 1 (EMT) (136) 1 1 (139) (140) ( 140) (139)
a Components: E - engine, M - muffler, T - traverse rail.
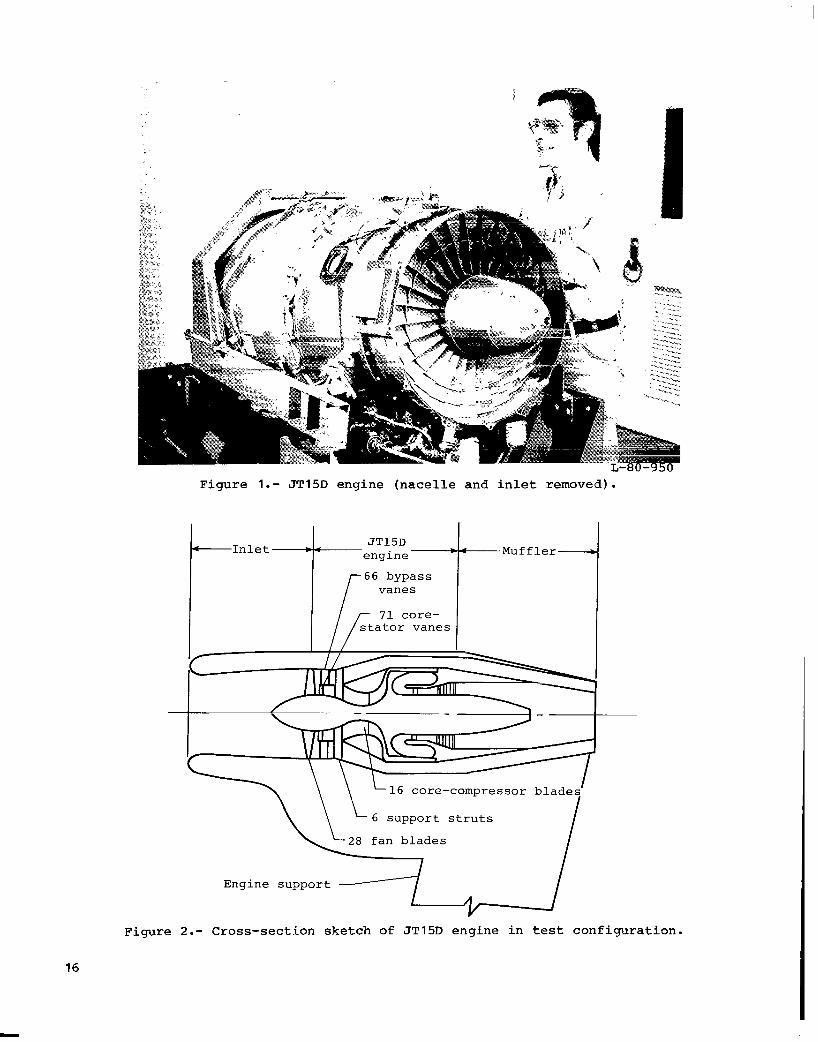
Figure 1.- JT15D engine ( n a c e l l e and i n l e t removed).
vanes
71 core-
16 core-compressor blades I
L 6 support struts \i, 28 fan blades Engine support
Figure 2.- Cross-section sketch of JT15D engine i n tes t conf igura t ion .
16
"I.
..
.-1
I:" .
L-80-4221 Figure 3 . - I n t e r n a l s t r u c t u r e of JT15D engine showing six support s t r u t s
i n bypass duct.
17

L-82- I 17 Figure 4.- JT15D engine on outdoor s ta t ic - tes t s tand a t Ames Research Center.
.
L-82-118 Figure 5.- JT15D engine mounted i n Ames 40- by 80-Foot Wind Tunnel.
18
Bypass
Instrumented fan blade
Dimensions are in cm
Note: All blade transducers 0.38 cm from leading edge. ””’?
Fan hub
- -~
Figure 6.- Schematic showing locations of fan-blade-mounted transducers-
19
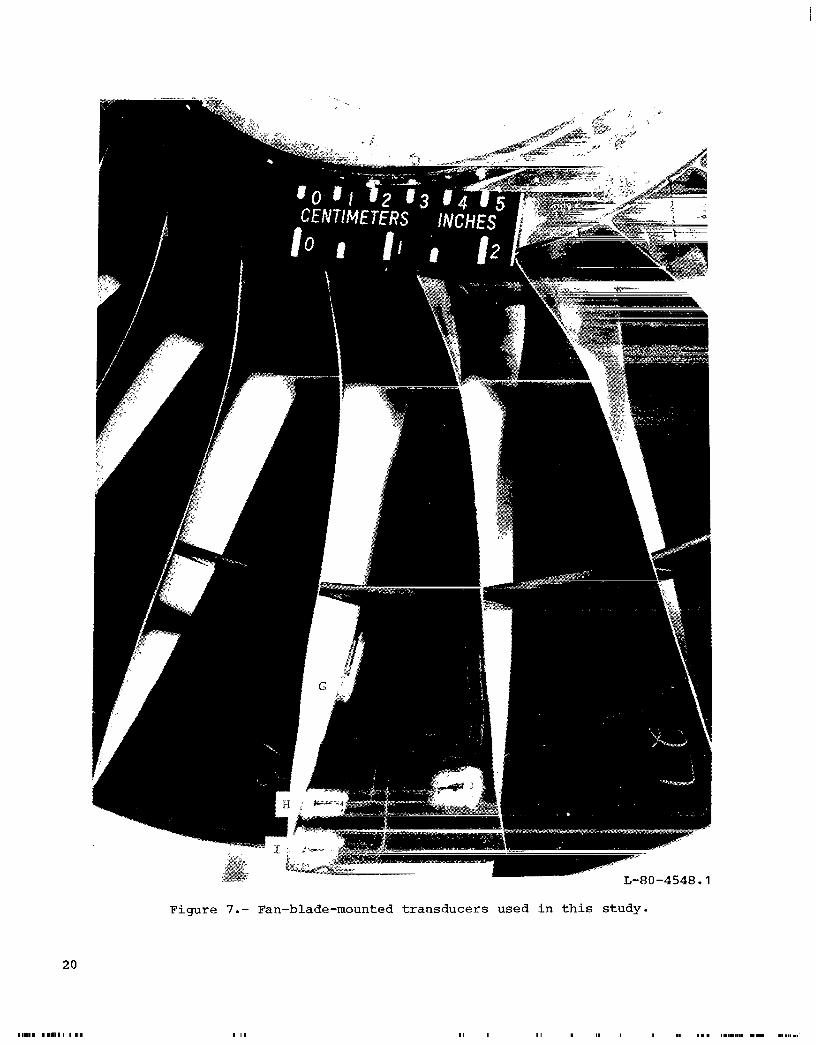
Figure 7.- Fan-blade-mounted t ransducers used i n t h i s study.
20
11.111 . 1 1 1 I I I 1111

Optic a1 Tape sensor
pulse 4 recorder
A Te Fan-: ade -mom t ed transducers
I I
Figure 8.- Sketch of fan-blade-mounted-transducer data system in JT15D engine.
2 1
0 50 100
Revolu t ion number
150
( a ) Space/time h i s to ry .
0 30 6 0 90 1 2 0 150 180 210 240 270 300 330 360
Locat ion ang le ( c c w f r o m top of e n g i n e ) , deg
( b ) Standard devia t ion and mean value.
Figure 9.- D a t a ana lys i s r e s u l t s €or fan-blade-mounted t ransducer H with c a l i b r a t i o n rod i n place; 6710 r p m .
22
m a 4 c
3
&
4 a,
m a,
a
; A ::
E- d
0 1 2 3 4 5 6 7 8 9 10 11 12 13 14 15
Frequency, kHz
(c) Overall spectral analysis.
0 ! I I I 1-1 L 1 I ~ L I 1 1 1 L l 1 1 I I I I 1 1
5 10 15 20 25
' I 1 ' 1 I I I I d 1 1 l l l t l l l d l I 1 l l J I I I 1 I I l l l l l l I 1 1 1 1 1 1 1 1 1 1 ! ! ! I 1 I111 1 : I I 35 40 45 50 55 60 65 7 0 75 80 85 90
Harmonic order (ref freq: 112 Hz)
(d) Enhanced-signal spectral analysis.
Figure 9.- Concluded.
23 3
tr a, a .
50 100 150 "
Revolution number
(a) FBMT I.
Figure 10.- Space/time history for fan-blade-mounted transducers; outdoor test stand, 6750 rpm.
24
.
0 50 100
Revolution number
(b) FBMT H.
Figure 10 .- Continued.
150
25
tn a, a
50 100
Revolution number
( c ) FBMT G.
F i g u r e 10.- Concluded.
150 1
26
t
-2
- Standard deviation _ _ _ _ Mean value
-
-2 I I I I I I I I I I I I 2 0 30 60 90 120 150 180 210 240 270 300 330 360
Location angle (ccw from top of engine), deg
(a) FBMT I.
1
(b) FBMT H.
-1
-.F, I I I 1 1 - 0 30 60 90 120 150 180 210 240 270 300 330 360
Location angle (ccw from top of engine), deg
( C ) FBMT G.
Figure 11.- Standard-deviation and mean-value plots for fan-blade-mounted transducers; outdoor test stand, 6750 rpm.
27
p 100
P E : k 90
80 k I I I I I I I I 1 I I I I d U L I l L d 1 I I I I , 1 1 lLlU L 1 1 Ild I 1 I 1 I 1 I 1 1 I I 1 I 1 ! L I I J L l d 0 1 2 3 4 5 6 7 8 9 1 0 1 1 1 2 1 3 1 4 1 5
Frequency, kHz
(a) FBMT I. 140
130 a 2
# t 120 m h r%
6: 110
j= 100
i gob 80
0 1 2 3 4 5 6 7 8 9 1 0 1 1 1 2 1 3 1 4 15
Frequency, kHz
(b) FBMT H- 140
Frequency, kHz
(C) FBMT G.
Figure 12.- Overall spectral plots for fan-blade-mounted transducers; outdoor test stand, 6750 rpm.
28
m P
I 80 El I I I I 1 1 1 I 1 1 1 1 1 1 I 1 I I l l 1 1 1 1 I I I I I SI I I111 1111‘1 I I I I 1 I I 1 I I 1 I I I I ; I I I I I I , I I 1 I I I I 1 1 I I I L I I I I ! I I I I , 1 1 1
0 5 10 15 20 25 30 35 40 45 50 55 60 65 ‘70 75 80 85 90
Harmonic order (ref freq: 112 Hz)
(a) FBMT I.
130
B f 120 I
a 110 0)
M
.* ..a
1 u 8 100 E
90
80 0 5 10 15 20 25 30 35 40 45 50 55 60 65 70 75 80 85 90
Harmonic order (ref freq: 112 Hz)
(b) FBMT H.
m
I 2 110
P
d 120
m
M
.e ..a
G 100
E 90
80 0 5 10 15 20 25 30 35 40 45 50 55 60 65 70 75 80 85 90
Harmonic order (ref freq: 112 Hz)
(C) FBMT G.
Figure 13.- Enhanced-signal spectral plots €or fan-blade-mounted transducers; outdoor test stand, 6750 rpm.
29
0 50 100 150
Revolution number (a) FBMT I.
Figure 14.- Space/time-history plots for fan-blade-mounted transducers; outdoor test stand, 13 490 rpm.
30
0 50 100
Revolution number
(b) FBMT H-
Figure 14.- Continued.
150
31
. a, l-l b, d Id
0
w
50 100
Revolution number
(c) FBMT G.
Figure 14.- Concluded.
150
32
I I I I I i i I I ;. I LA 0 30 60 90 120 150 180 210 240 270 300 330 360
Location angle (ccw from top of engine), deg
(a) FBMT I.
zr - Standard deviation ----Mean value
m B
T I I I I I I I I I I I I 0 30 60 90 120 150 180 210 240 270 300 330 360
Location angle (ccw from top of engine), deg
(b) FBMT H.
-2 t- I I I I I I I I I I I I I 0 30 60 90 120 150 180 210 240 270 300 330 360
Location angle (ccw from top of engine), deg
(c) FBMT G.
Figure 15.- Standard-deviation and mean-value plots for fan-blade-mounted transducers; outdoor test stand, 13 490 rpm.
33
80 I I 1 1 1 ! I I I I I I I I I I I I I 1 1 1 1 1 1 1 1 1 1 1 I I I I I I I I I I I I I I I I I I I I ~ 0 1 2 3 4 5 6 7 8 9 1 0 1 1 1 2 1 3 1 4 1 5
Frequency, kHz
(a) FBMT I-
80 I I I L I I I 1 1 I I I ~ I I I 1 1 1 I I 1 1 1 I I I 1 1 I I I ~ I I I I ! I I I I I I I I I 1 1 I I I 1 1 I I I I I L L L L u l I I 1 I I I ! 0 1 2 3 4 5 6 7 8 9 1 0 1 1 1 2 1 3 1 4 1 5
Frequency, kHz
(b) FBMT H.
Figure 16.- Overall spectral plots for fan-blade-mounted transducers; outdoor test stand, 13 490 rpm.
34
i
w ( C ) FBMT G.
Figure 16. - Concluded.
W cn
Approximate fan speed,
rpm
12 800
12 050
11 150
10 550
9600
9000
8450
1110111 0 1 2 3 4 5
Frequency, kHz
(a ) FBMT I.
A 0 1 2 3 4 5
Frequency, kHz
(b) FBMT H*
I(II(IIIII( 0 1 2 3 4 5
Frequency, kHz
(c ) FBMT G -
Figure 17.- Spectral p l o t s f o r fan-blade-mounted-transducer data from sweep of engine speed; tunnel o f f , Bandwidth of ana lys i s = 10 Hz.
:r - Standard deviation _ _ _ _ Mean value
I I I J I I I I I ! 1 . I 0 30 J 90 120 150 180 210 240 270 300 330 360
Location angle (ccw from top of engine), deg
(a) FBMT I.
-2 t 0 30 60 90 120 150 180 210 240 270 300 330 360
Location angle (ccw from top of engine), deg
(b) FBMT H.
-2 c I I I I i I I I I 12 0 30 60 90 120 150 180 210 240 270 300 330 360
Location angle (ccw from top of engine), deg
(c) FBMT G. Figure 18.- Standard-deviation and mean-value plots for €an-blade-mounted
transducers; 10 500 rpm, 44 m/s tunnel speed.
37
w 120 IG \
Tunnel speed, m/s
ori
10
31
44
m V
10
31
1 I I I I I I ! I I I I I I I ! I I I11 I I I I ] I I I I I I I I I I I I I I I I I I I I I I I I I I I I I I I I I I I I I I I I I I I I I I I 1 I 1 0 1 2 3 4 5 6 7 8 9 1 0 1 1 1 2 1 3 1 4 1 5
Frequency, kHz
(b) FBMT H. Figure 19.- Overall spectral plots for fan-blade-mounted transducers; 10 500 rpm.
38
1 I I I I I I I 1 1 I I I I I I I I I I I I I I I I I I I I I I I I I I I I I 1 I I I I I I I I I 1 1 I I I I I I I I I I I I I I I I I I I I IJ 0 1 2 3. 4 5 6 I 8 9 1 0 1 1 1 2 1 3 1 4 15
Frequency, kHz
( C ) FBMT G.
Figure 19.- Concluded.
39

w m 7J e-
%
P
0
1 w
44
off
d I 44
120
110
1-00
(b) FBMT H.
Figure 20.- Enhanced-signal spectral plots for fan-blade-mounted transducers; 10 500 rpm.
.
40
I 44
. . - w 0 5 10 15 20 25 30 35 40 45 50 55 60 65 70 75 80' 85 90
Order (freq 175.00 Hz)
( c) FBMT G.
Figure 20. - Concluded.
4 1
Standard deviation Mean value - - - - - - -
0 30 60 90 120 150 180 210 240 2'70 300 330 360
Location angle (ccw from top of engine), deg
(a) FBMT I.
L-1 I I I I I .L 1 . 1 I . I I 0 30 60 90 120 150 180 210 240 270 300 330 360
Location angle (ccw from top of engine), deg
(b) FBMT H.
2
1 d PI x . 6 2 0 m h PI
-2
-1 t
4 , Ll . I I I _ I I I ! ! I. d 0 30 60 90 120 150 180 210 240 270 300 330 360
Location angle (ccw from top of engine), deg
(c) FBMT G. Figure 21.- Standard-deviation and mean-value plots €or fan-blade-mounted
transducers; 6750 rpm, 44 m/s tunnel speed.
42
.
80 ET I I I I I I I I I I I I I I I I I I I I I I I I I I I 1 I I I I I I I I I I I I I I I I I I I I I I I I I I I l l LLLllllllllllllll 0 1 2 3 4 5 6 I 8 9 10 11 1 2 1 3 1 4 1 5
Frequency, kHz
(b) FBMT H.
c
80 kl I , I I I I I I I I I I I I I I I I I I I I I I I I I I I I I I I I I I I I I I I I I ! 1 1 I I I I 11.1 I I L l l I L U 0 1 2 3 4 5 6 I 8 9 1 0 1 1 1 2 1 3 1 4 15
Frequency, kHz
(c) FBMT G.
Figure 22.- Overall spectral plots €or fan-blade-mounted transducers; 6750 rpm, 44 m/s tunnel speed.
43
130 F
g
tl
E 110 I
120 W - W
a 100
.L( u
B p 90 I*
80 0 5 10 15 20 25 30 35 40 45 50 55 60 65 70 75 EO 85 90
Harmonic order (ref freq: 112)
(a) F B M T I.
‘cf m 130 E A t 120 W
0 - g 110 W
a M E 100 c
: f 90
EO 0 5 10 15 20 25 30 35 40 45 50 55 60 65 70 75 80 85 90
Harmonic order (ref freq: 112)
(b) F B M T H.
Harmonic order (ref freq: 112)
( C ) F B M T G.
Figure 23.- Enhanced-signal spectral plots for fan-blade-mounted transducers; 6750 rpm, 44 m/s tunnel speed.
‘
44
- Standard deviation Mean value - - - - - - -
-2 c 0 30 60 90 120 160 180 210 240 270 300 330 360
Location ande (ccw from top of engine), deg
(a) FBMT I.
0 30 60 90 120 150 180 210 240 270 300 330 360
Location angle (ccw from top of engine), deg
(b) FBMT H.
tl I I I I I I 1 i L U 0 30 60 90 120 150 180 210 240 270 300 330 360
Location angle (ccw from top of engine), deg
( c ) FBMT G. Figure 24.- Standard-deviation and mean-value plots €or fan-blade-mounted
transducers; 13 460 rpm, tunnel off.
45
- - -- ~
2. Government Accession No.
-
1. Report No.
NASA TP- 1976 ~
4. Title and Subtitle FLUCTUATING PRESSURES ON FAN BLADES OF A TURBOFAN ENGINE - STATIC AND WIND-TUN" INVESTIGATIONS
. ~ _ _ . -
7. Author(s1
James A. Schoenster -
9. Performing Organization Name and Address
NASA Langley Research Center Hampton, VA 23665
~.
12. Sponsoring Agency Name and Address
National Aeronautics and Space Administration Washington, DC 20546
- r - .
I 5. Supplementary Notes
~~ ~
3. Recipient's Catalog No.
5. Report Date
March 1982 6. Performing Organization Code
505-32-03-04 - _ _ ~~
8. Performing Organization Report No.
L- 1 49 1 3 10. Work Unit No.
11. Contract or Grant No.
13. Type of Report and Period Covered
Technical Paper 14. Sponsoring Agency Code
.. -. . - - . . - . . . .. -. . . . . . . . . - . . . .= . . ~ .. ..~ ~ ~~
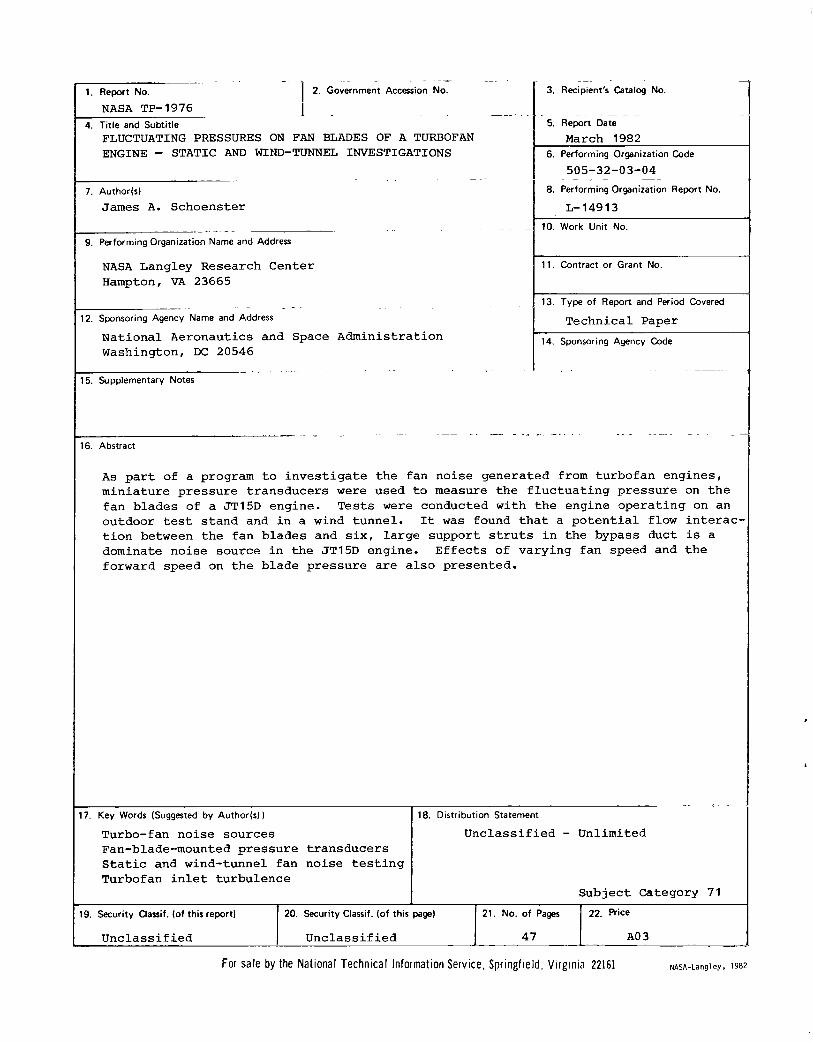
16. Abstract
As part of a program to investigate the fan noise generated from turbofan engines, miniature pressure transducers were used to measure the fluctuating pressure on the fan blades of a JT15D engine. Tests were conducted with the engine operating on an outdoor test stand and in a wind tunnel. It was found that a potential flow interac- tion between the fan blades and six, large support struts in the bypass duct is a dominate noise source in the JT15D engine. Effects of varying fan speed and the forward speed on the blade pressure are also presented.
7. Key Words (Suggested by Author(s)) 18. Distribution Statement . . - .. . .
Turbo-fan noise sources Fan-blade-mounted pressure transducers Static and wind-tunnel fan noise testing Turbofan inlet turbulence
Unclassified - Unlimited
Subject Category 71 20. Security Ciassif. (of this page)
Unclassified 1 ~ A03
1 21. NO. y7pa*s 22. Rice I 9. Security Classif. (of this report)
Unclassified
For sale by the National Technical Information Service, Sprinefield. Virginia 22161 NASA-Lang1 eY 9 1982
National Aeronautics and Space Administration
Washington, D.C. 20546 Official Business
. Penalty for Private Use, $300
THIRD-CLASS B U L K RATE Postap and Fees Paid National Aeronautics and Space Administration NASA451
POSTMASTER : If Undeliverable (Section 1 5 8 Postal Manual) Do Not Return


