Fluid dynamic and heat transfer parameters in an urban canyon S. Bottillo ⇑ , A. De Lieto Vollaro, G. Galli, A. Vallati Sapienza University of Rome – DIAEE – Via Eudossiana 18, 00184 Rome, Italy Received 28 June 2013; received in revised form 22 October 2013; accepted 24 October 2013 Available online 22 November 2013 Communicated by: Associate Editor Matheos Santamouris Abstract A microclimatic analysis in a typical urban configuration, has been carried out. Using a CFD method, a N-S oriented urban street canyon, with a given H/Wratio, has been examined. The standard k–eturbulence model has been used to simulate a three-dimensional flow field and to calculate the thermo-fluid dynamics parameters that characterize the street canyon. The aim of this study is to inves- tigate the effect of solar radiation on the flow field and thermal parameters within the canyon. A comparison between transient and sta- tionary simulations has been performed to evaluate the importance of considering the thermal inertia effects in an urban street canyon study. The dynamic characteristics of the 3D flow in the canyon have been compared with other numerical simulations and experimental results. Furthermore a thermo-fluid dynamic analysis of natural convection effects on the heat transfer coefficient and turbulent kinetic energy, has been carried out. 2013 Elsevier Ltd. All rights reserved. Keywords: Urban microclimate; Urban canyon ; CFD; Solar radiati on 1. Introduction The landscape of dense urban areas can be described by units of street delimited by two continuous rows of build- ings to form a canyon . This geometry is often described by a si ngle pa ramet er, the can yon as pe ct rati o (H/W), which is defined as the ratio of the building height ( H) to the width between buildings (W). As to the incoming solar radiation and the heating of canyon surfaces, the orienta- tion of the canyon relative to the solar path is also critical in determini ng the timing and extent to whi ch sur fac es receive direct sunlight. Several studies have been performed on different street canyons ( Takebayashi and Moriyama, 2012; Bozonnet et al., 2005; Lei et al., 2012; Xie et al., 2007). An experimental validation of a 3D numerical sim- ulation has been perf ormed by Assimako pou los et al. (2006); they performed tests using a numerical model on a grid of buildings. By numerical tests characterized by a 2D spa tial domain and with assigned surfaces temper a- tures,Lei et al. (2012) studied the impact of ground heating on the flow fields in a street canyons, Xie et al. (2007) stud- ied the effects of fac ades and ground heating on the pollu- tant dispersion, Saneinejad et al. (2011) investigated on the heat transfer coefficient in a street canyon, simulated as a cav ity , using the low-Rey nold s number modeling; they found a strong influence of thermal effect on the flow field. Allegrini et al. (2012a) analyzed the convective heat trans- fer at build ing fac ade s in sev era l urb an con figurat ions, using the adaptive wall function approach developed by Defrae ye et al. (2011 ) and Allegrini et al. (2012b) ; they con- cluded that the AWF provides more accurate heat transfer analysis in urban CFD studies. Offerle et al. (2007) used wind and temperature measurements to examine the ther- mal str uct ure within a street canyon. The y found tha t buoyancy effects were not seen to have as large an impact on the measured flow field as has been shown in the numer- ical experiments. Kovar-Panskus et al. (2002) performed a 0038-092X/$ - see front matter2013 Elsevier Ltd. All rights reserved. http://dx.doi.org/10.1016/j.solener.2013.10.031 ⇑ Corresponding author. Tel.: +39 06 44 58 56 64; fax: +39 06 48 80 120. E-mail address: [email protected](S. Bottillo). www.elsevier.com/locate/solener Available online at www.sciencedirect.com ScienceDirectSolar Energy 99 (2014) 1–10
Transcript
7/23/2019 Fluid dynamic and heat transfer parameters in an urban canyon.pdf
A microclimatic analysis in a typical urban configuration, has been carried out. Using a CFD method, a N-S oriented urban streetcanyon, with a given H /W ratio, has been examined. The standard k – e turbulence model has been used to simulate a three-dimensionalflow field and to calculate the thermo-fluid dynamics parameters that characterize the street canyon. The aim of this study is to inves-tigate the effect of solar radiation on the flow field and thermal parameters within the canyon. A comparison between transient and sta-tionary simulations has been performed to evaluate the importance of considering the thermal inertia effects in an urban street canyonstudy. The dynamic characteristics of the 3D flow in the canyon have been compared with other numerical simulations and experimentalresults. Furthermore a thermo-fluid dynamic analysis of natural convection effects on the heat transfer coefficient and turbulent kineticenergy, has been carried out. 2013 Elsevier Ltd. All rights reserved.
Keywords: Urban microclimate; Urban canyon; CFD; Solar radiation
1. Introduction
The landscape of dense urban areas can be described byunits of street delimited by two continuous rows of build-ings to form a “canyon”. This geometry is often describedby a single parameter, the canyon aspect ratio (H /W ),which is defined as the ratio of the building height (H ) tothe width between buildings (W ). As to the incoming solarradiation and the heating of canyon surfaces, the orienta-tion of the canyon relative to the solar path is also critical
in determining the timing and extent to which surfacesreceive direct sunlight. Several studies have been performedon different street canyons (Takebayashi and Moriyama,2012; Bozonnet et al., 2005; Lei et al., 2012; Xie et al.,2007). An experimental validation of a 3D numerical sim-ulation has been performed by Assimakopoulos et al.(2006); they performed tests using a numerical model on
a grid of buildings. By numerical tests characterized by a2D spatial domain and with assigned surfaces tempera-tures, Lei et al. (2012) studied the impact of ground heatingon the flow fields in a street canyons, Xie et al. (2007) stud-ied the effects of facades and ground heating on the pollu-tant dispersion, Saneinejad et al. (2011) investigated on theheat transfer coefficient in a street canyon, simulated as acavity, using the low-Reynolds number modeling; theyfound a strong influence of thermal effect on the flow field.Allegrini et al. (2012a) analyzed the convective heat trans-
fer at building facades in several urban configurations,using the adaptive wall function approach developed byDefraeye et al. (2011) and Allegrini et al. (2012b); they con-cluded that the AWF provides more accurate heat transferanalysis in urban CFD studies. Offerle et al. (2007) usedwind and temperature measurements to examine the ther-mal structure within a street canyon. They found thatbuoyancy effects were not seen to have as large an impacton the measured flow field as has been shown in the numer-ical experiments. Kovar-Panskus et al. (2002) performed a
0038-092X/$ - see front matter 2013 Elsevier Ltd. All rights reserved.
wind tunnel study of the influence of wall-heating on theflow regime in a simulated canyon. They found little evi-dence of thermal effects, except in a very thin layer nearthe heated wall, as Louka et al. (2002) noted from an exper-imental campaign in Nantes, France. Most of numericalstudies have been performed on infinitely long street can-
yons and the prevailing wind direction has been assumedperpendicular to them, so that the spatial domain has beensimplified from 3-D to 2-D. In this study, simulations havebeen performed on a 3-D domain, investigating the impactsof solar heating and ambient wind speed on the flow fieldsand surfaces temperatures in a street canyon with a fixedH /W and L/W ratios. It has been chosen to study a streetcanyon isolated from the urban environment, as Blockenet al. (2007) and Allegrini et al. (2012a) did, to evaluatehow the buildings configuration affects a spatially homoge-neous dynamic and thermal field. Using the commercialCFD code Ansys-Fluent, a series of numerical tests wereperformed to point out the differences between transient
and steady simulations and to investigate the effects of ther-mal field on the surface temperature on the heat transfercoefficient and air velocity and turbulence.
2. CFD numerical model
In this section, the parameters of the computationalmodel and the boundary conditions are outlined.
The simulations have been performed with the commer-cial CFD code Ansys Fluent 14.0, 3D double precision,pressure based version and the steady RANS equationshave been solved in combination with the standard k– e
model. The governing equations can be expressed asfollows:
Momentum equation:
u j@ ui
@ x j¼
1
q
@ p
@ xiþ l
q
@ 2ui
@ xi@ x j
@
@ x ju0iu
0 j
þ f i: ð1Þ
Continuity equation:
@ ui
@ xi¼ 0: ð2Þ
Heat conservation equation:
ui @ T @ xiþ @ @ xi
K T @ T @ xi
¼ 0; ð3Þ
where ui is the average speed of air flow; u0iu
0 j is the Rey-
nolds stress; q is the air density; l is the molecular viscosity; f i is the thermal-induced buoyant force; T is the potentialtemperature; K T is the heat diffusivity. The standard k – emodel has been used to solve the turbulence problem.The turbulence kinetic energy, k , and its rate of dissipation,e, are obtained from the following transport equations:
@
@ t ðqk Þ þ
@
@ xiðqkuiÞ ¼
@
@ x jl þ
lt
rk
@ k
@ x j
þ G k þ G b qe
ð4Þ
and
@
@ t ðqeÞ þ
@
@ xiðqeuiÞ ¼
@
@ x jl þ
lt
re
@ e
@ x j
þ C 1ee
k ðG k þ C 3eG bÞ C 2eq
e2
k ð5Þ
where G k is the generation of turbulence kinetic energy dueto the mean velocity gradients; G b is the generation of turbu-lence kinetic energy due to buoyancy; C 1e, C 2e and C 3e con-stants and the K T and lt expressions are reported in thestandard k – e model of Ansys Fluent 14.0, 2011; rk and reare the turbulent Prandtl numbers for k and e, respectively.To evaluate the impact of thermal effects, the incompressibleideal gas module has been used for air density.
The simulated urban canyon has the following charac-teristics: it has an aspect ratio H /W = 1 and L/W = 5,the orientation is N–S, the buildings width and height are20 m, the street width is 20 m and the street length is
100 m. Based on the best practice guidelines by Frankeet al. (2007) and Tominaga et al. (2008), the dimensionsof the computational domain have been chosen in relationto the buildings height H (Fig. 1): the distance between theside walls of the buildings and the north, east and southplanes is 5H = 100 m, instead the west plane is15H = 300 m from the westerly building. The distancebetween the roofs of the buildings and the upper plane is5H = 100 m. The buildings dimensions determine the dif-ferent domain extension behind the built area. When theflow direction is transversal to the canyon length, theobstacle size is maximum and the flow re-development
requires a distance of 15H from the buildings to theoutflow bounds. Instead when the flow is longitudinal tothe canyon direction, the obstacle size is minimum andthe distance behind the built area is 5H . Those dimensionsallow to set the zero static pressure on the outlet plane andzero gradients of all variables at the top and lateral sides of the domain. The domain dimension over the buildings havebeen chosen to take into account the blockage ratio,defined as the ratio of the area blocked by the buildingsto the total cross-section area. This parameter dependson the obstacles size and wind direction: when the buildingobstacle area is minimum, the blockage ratio assumes thevalue of 2%, instead when the wind impacts transversallyto the canyon direction, it assumes the maximum valueof 5.5%. To simulate the soil influence, the computationaldomain has been extended 5 m below the ground level.The soil has been simulated setting the followingparameters: density = 1000 kg/m3; specific heat = 1000 J/kgK; thermal conductivity = 2 W/mK; temperatureat -5 m = 288 K; emissivity = 0.9; solar radiation absorp-tivity (direct visible and infrared) = 0.8. The building wallshave: density = 1000 kg/m3; specific heat = 1000 J/kg K;thermal conductivity = 0.15 W/m K; thickness = 0.30 m;internal air temperature = 299 K; emissivity = 0.9; solarradiation absorptivity (direct visible and near infra-
red) = 0.8. The resulting domain size is: 17.25 106
m3
.
2 S. Bottillo et al./ Solar Energy 99 (2014) 1–10
7/23/2019 Fluid dynamic and heat transfer parameters in an urban canyon.pdf
The temperature of surfaces has been obtained as result of the heat transfers, setting up: the solar load module (longi-tude: 9.18, latitude: 45.47, UTC: +1), the temperature of undisturbed air (303 K), the temperature of the internal
air of the buildings (299 K). To ensure an high quality of the computational grid, it is fully structured and the shapeof the cells has been chosen hexahedral (Fig. 2): the normalvector of a cell surface is parallel to the line connecting themidpoints of neighboring cells. To simulate flow fields, inthe area of interest, 40 cells per cube root of the buildingvolume has been used and 20 cells per building separation(Franke et al., 2007). For the vertical resolution of the can-yon 20 cells have been used. Furthermore, the grid has beenarranged so that the evaluation height (1.5–5 m) and thepedestrian wind speed at 1.5–2 m height is located higherthan the 3rd grid from ground surface. According to thestudy of Ramponi and Blocken (2012), the velocity profilehas been set giving a uniform velocity magnitude of 2 m/sat the velocity inlet boundary, the turbulence intensity at10%. The aerodynamic roughness value z0 has been set inrelation to the roughness parameters in the ground surfaceboundary conditions (Ramponi and Blocken, 2012): thesand-grain roughness height k s and the roughness constantC s. Setting k s = 1m and C s = 0.5, the resulting z0 (Eq. (6))is 0.05 m (Blocken et al., 2007; Ansys Fluent User’s Guide,2011), that has been considered an appropriate value torepresent the roughness of the outer region (Blockenet al., 2007; Norris and Richards, 2010). A zero roughnessheight has been used for the building surfaces.
k s ¼ 9:793 z 0
C sð6Þ
As the flow approaches the built area the velocity inletprofile looks fully-developed before reaching the buildings,as it can be seen in Fig. 3, and it can be represented by Eq.(7), where u* is the friction velocity, k is the Von Karmanconstant (0.4) and z is the height coordinate.
uð z Þ ¼ u
k ln
z þ z 0
z 0
ð7Þ
The friction velocity value has been obtained by the cor-relation with the calculated value of the turbulent kineticenergy (k ) at the first node above the ground, as shownin Eq. (8) (Franke et al., 2007).
u ¼ k 0:5C 0:25l ð8Þ
where C l = 0.09.In Fig. 4 is shown the comparison between the velocity
inlet profile before reaching the urban canyon and the pro-file calculated with the logarithmic law (Eq. (7)).
3. Validation of the CFD model by wind tunnel experiment
data
The validation of the mathematical model used in ourstudy has been carried out through the comparison withthe wind tunnel experiment performed by Uehara et al.(2000). In order to describe the roughness elements of the
urban environment, 44 rows of blocks with a size of
Fig. 1. Three-dimensional domain view and points and planes of interest.
100 100 50 mm3 have been used. Further, to representstreet canyons, 14 rows of blocks with a size of 100 100 100 mm3 have been set. The measured datahave been carried out in the space between the 5th andthe 6th of the 14 rows. The experiment has been character-ized by a flow direction transversal to rows of blocks and,at the measurement location, the flow appeared totally can-alized. A numerical validation test has been performed onour street canyon model, which has been scaled by thereduction factor 1/200 and where the wind direction hasbeen considered totally transversal to the canyon direction.The air temperature T a was set as 20 C (293 K) and theground temperature T f was set as 79 C (352 K), the inflowwind speed u0 was set as 1.5 m/s in order to reproduce theconditions of the experimental tests. The comparisonbetween the data obtained with the wind tunnel experi-ments and the numerical test are illustrated in Fig. 5: thevertical profile of normalized horizontal velocity u/u0 andT T f T aT f
, evaluated on a central vertical line within the streetcanyon. As in Lei et al. (2012) study, it can be observedthat there is a good agreement between the mathematicalmodel and the wind tunnel experiment within the canyon.Instead the numerical tests overestimate the wind velocity
and the air temperature above the canyon.
4. Results
4.1. Comparison between steady and transient simulation
A comparison between the results obtained by thesteady simulation and the transient one has been carried
out. The steady simulation has been performed on 26 Juneat 14:00, instead the transient simulation has been startedon 18 June at 00:00 and it has been stopped 9 days after,on 26 June at 24:00. The ground temperature has been cho-sen as parameter of comparison between the transient andsteady simulation, to highlight the thermal inertia effects,because the ground is the element with higher thermalcapacity. The results of the steady simulation have beencompared with the last day results of the transient one.In Fig. 6 are shown the ground temperature values of thethree points of interest (Point A and B within the canyon,placed at 1 m away from building, respectively from the
easterly fac
ade and from the westerly one; Point Ext, exter-nal to the canyon, as shown in Fig. 1). As it can beennoticed, the temperatures of the various points chosen tostudy the urban canyon in transient case are very similarto the stationary one. This does not mean that the temper-ature of the soil inner layers are the same for both simula-tions, but we are interested on the surface temperature andto study its influence on the flow field. The ground temper-ature of the external point is the same for both simulations,instead, it can be noticed a difference of 3 for the point Aand a smaller one for point B. Those differences are due tothe ground thermal inertia which determines a lower tem-perature value as the point passes from shadow to sunexposition and viceversa. The same consideration with anopposite sign can be applied to the point B, which enterinto shadow shortly before 14:00. It can be concluded thatthe stationary case for a thermo-fluid dynamic simulationof a street canyon is representative of the physical phenom-ena of the maximum solar load. For this reason, furtheranalysis will be performed on the stationary case, whichis much lighter as to the computational time. The analysisof hourly trends of ground temperatures shows that it ishigher within the canyon than outside, during the hoursof maximum solar radiation, while, during the rest of theday, their values are significantly lower due to the effect
of shadows.
Fig. 3. Wind velocity inlet profiles at different distances from the velocity inlet.
Fig. 4. Comparison between the simulated wind velocity inlet profile and
the profile calculated with the logarithmic law (Eq. (7)).
4 S. Bottillo et al./ Solar Energy 99 (2014) 1–10
7/23/2019 Fluid dynamic and heat transfer parameters in an urban canyon.pdf
In order to evaluate the impact of thermal effects on ourstreet canyon model, a comparison between two simula-tions has been performed. The simulations have been per-formed in stationary case on 26 June at 11:00. In the firstsimulation the natural convection has been excluded,instead in the second one it has been considered. The flowregime impacting on the built area is described by a veloc-
ity inlet magnitude of 2 m/s and a wind direction of 45N,so that the hottest facade is the windward one. The result-ing average Richardson number (Ri) for the windward fac-ade is 2.9 and for the leeward one is 1.0. The threedimensional effect of the flow is evident in the formationof a spiral flow, produced by the combination of the down-ward vertical vortex and the longitudinal component of thewind velocity, as reported in other 3D simulations (Assi-makopoulos et al., 2006; Santamouris et al., 1999); they
Fig. 5. Comparison between the simulated data and the observed data by Uehara et al. (2000). (a) u/u0 and (b) (T T f )/(T a T f ).
Fig. 6. Comparison between transient and steady simulation: hourly trends of ground temperature of the three points of interest and the values calculatedat 14:00 with the steady simulation.
found that the wind field in urban areas is quite complexand the simulated wind speed intensities can be totally dif-ferent from the measured data. Fig. 7 shows the velocityvectors on three vertical planes of interest for both simula-tions. The figure shows the XZ velocity vectors for bothsimulations and the XY velocity vectors for the simulation
with natural convection activated. On the XY plane, theflow pattern does not change significantly for the two sim-ulations; Fig. 7(d) shows that the flow within the canyon istransported from the north opening to the south one. TheNorth and South planes are placed at 10 m from therespective openings, instead the Central plane is in the mid-dle of the canyon. The facade of the easterly building, inshadow, is on the right side of the figures, instead thefacade of the westerly one, exposed to the sun radiationis on the left side. When the natural convection is deacti-vated, the flow pattern changes significantly from the northopening to the Central plane. Instead, from the Central
plane to the south opening, the flow pattern remains basi-cally constant. As it can be seen in Fig. 7(a1) and (d), in theNorth plane the formation of a double vortex can beobserved. The vortices are generated by geometricaldiscontinuities (the roof and the vertical corner of the east-erly building) and they have two different rotation axis. The
upper vortex has its axis parallel to the canyon direction(Fig. 7(a1)), and the lower has a vertical one (Fig. 7(d)).From Central plane to the South plane, the aerodynamicvortex coming from the roof is fully-formed and it occupiesall the space between buildings (Fig. 7(b1) and (c1)). In theSouth plane (Fig. 7(c1)) the mass flow rate coming from theroof is zero and the vortex is transported from the easterlyfacade to the westerly one by the longitudinal flow. Theflow pattern of the North plane when the natural convec-tion is activated (Fig. 7(a2)), is double-vortex in structureas in the first simulation. In the Central and South plane(Fig. 7(b2) and (c2)) the flow pattern is divided in two
Fig. 7. XZ velocity vectors on the North, Central and South planes, respectively (a), (b) and (c). No natural convection simulation (a1), (b1) and (c1);
simulation with natural convection activated (a2), (b2) and (c2). XY velocity vectors at 10 m height with natural convection activated (d).
6 S. Bottillo et al./ Solar Energy 99 (2014) 1–10
7/23/2019 Fluid dynamic and heat transfer parameters in an urban canyon.pdf
counter-rotating vortex: the upper one due to the geomet-rical discontinuity and the second one, in the low cornernear the hot wall, due to the buoyancy effect. The convec-tive vortex appears less developed than the simulations car-ried out by Lei et al. (2012) and Xie et al. (2007), probablybecause of the 3D nature of our simulation. The impact of
thermal effects have been studied also through the analysisof velocity and turbulent kinetic energy near the canyonsurfaces on the Central plane, for both simulations. Forthe building facades a vertical line near the westerly oneexposed to the sun radiation, from ground level to buildingroof, has been considered. For the ground surface instead,an horizontal line, from the easterly facade to the westerlyone, has been taken. All those lines of interest are placed at0.40 m from the respective surfaces. In Fig. 8 are shown:the vertical trends of Z velocity component and turbulentkinetic energy near the sun exposed facade, wall tempera-ture and heat transfer coefficient on the facade itself; veloc-ity magnitude and turbulent kinetic energy above the
ground, temperature and heat transfer coefficient on theground are shown in Fig. 8(d1) and (d2). The Z velocitycomponent along a vertical line at 0.40 m from the sun-exposed wall (Fig. 8(a1) and (a2)) without natural convec-tion is negative (downward) and it is affected only by theaerodynamic vortex, instead, when the natural convectionis activated, it is affected by buoyancy forces and it is posi-tive, from the ground to the half height of the building. Onthe central plane, the buoyancy effect is maximum at 4 mheight from the ground level and it extends up to 0.60 mdistance from the hot wall. It has been noticed that thetemperatures of the facade and of the ground that are
not exposed to the direct radiation, are 6 higher thanthe air temperature, but it does not seem to have relevanteffects on the flow field. On the horizontal line the velocitymagnitude is lower when the thermal effects are excluded.The turbulent kinetic energy is higher near all the surfaceswhen the natural convection is activated and it stronglyaffects the heat transfer coefficient trends. In particular,Fig. 8(b1), (b2), (d1) and (d2) shows that, activating thenatural convection, the turbulent kinetic energy increasesfour times and the heat transfer coefficient doubles, fromground level to half height of the building. The naturalconvection effect determines also an increase of air circula-tion within the canyon; as it can be seen in Fig. 8(c1) and(c2), when the natural convection module is activated, thevelocity magnitude reaches the value of 2 m/s, insteadwhen it is deactivated, the maximum velocity magnitudevalue is 1.5 m/s. As it can be seen in Fig. 8(a1), (a2), (c1)and (c2), the surfaces temperatures are several degreeslower when natural convection is activated. In order toevaluate the impact of 3D effects on the heat transfer coef-ficient, we have performed a 2D simulation and a 3D sim-ulation characterized by a transversal wind direction,excluding the natural convection. The results show that,when the domain is tridimensional and the wind directionis transversal to the canyon axis, the heat transfer coeffi-
cient values are very similar to the 2D simulation. The
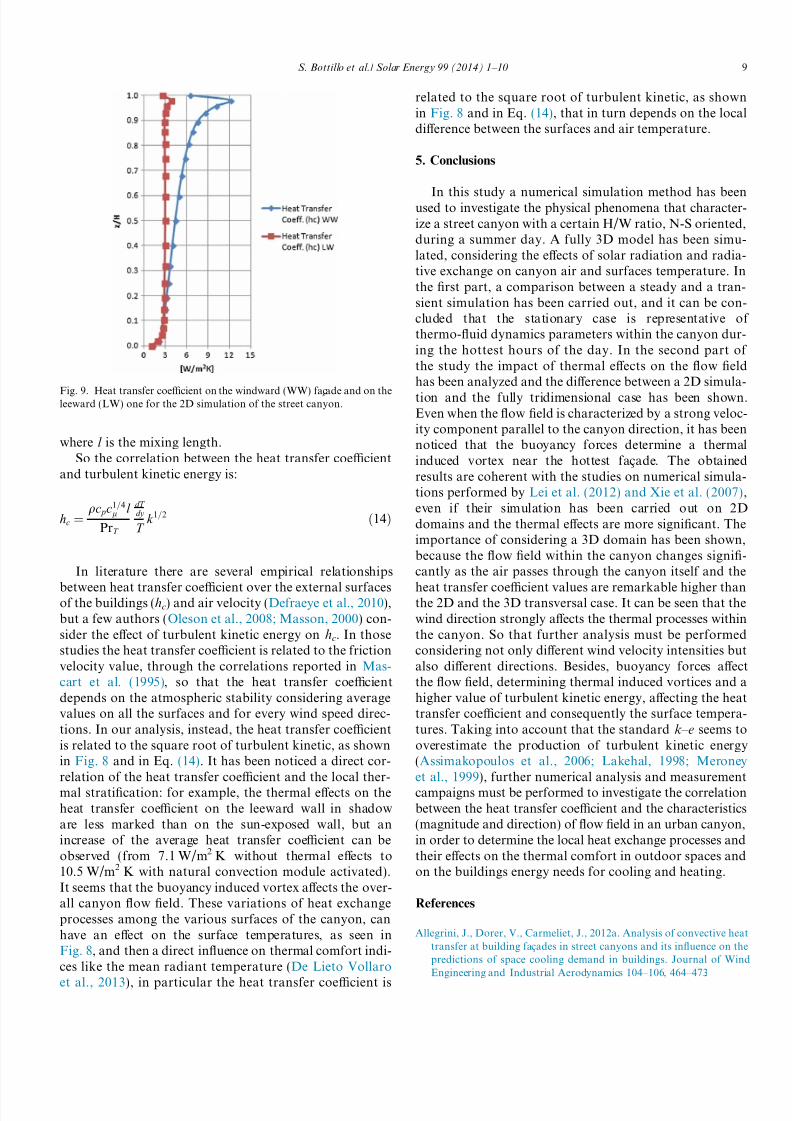
2D results of the heat transfer coefficient (Fig. 9) are con-gruent with the values reported in Saneinejad et al.(2011), except for the upper part of the windward facade,where our simulation shows higher values; this differenceof heat transfer coefficient is due to the shape of our 2Dcanyon model; Saneinejad et al. (2011) simulate the street
canyon as a cavity in the ground, instead we simulate itas two buildings over the ground level. When the domainis 3D and the wind direction is 45N, the heat transfer coef-ficient values without buoyancy effects, shown inFig. 8(b1), and the values obtained with buoyancy effects,Fig. 8(b2), are higher than the ones found in our 2D(Fig. 9) and 3D transversal simulation, and the onesreported by Saneinejad et al. (2011) and Allegrini et al.(2012a). Those differences are probably due to the 3Deffects and to the longitudinal speed component withinthe canyon that, when the ambient wind speed is 2 m/sand the direction is 45N, is more than two times higherthan the value of 0.5 m/s of the 2D simulations, reported
in Saneinejad et al. (2011). Allegrini et al. (2012b) showedthat, when the Ri > 1, the standard wall function overesti-mates the value of heat transfer coefficient; our resultsshow that even when the natural convection is not consid-ered, the hc values are much higher than the 2D simula-tions. Natural convection increases remarkably (as shownin Fig. 8) and the values seem to be similar to the measuredones on building facades (Defraeye et al., 2010). In thisstudy, the calculation of the heat transfer coefficient (hc)is carried out at numerical level by the usual relations of the standard k – e model and it is strongly related to air ther-mal conductivity (kT ):
hc ¼kT
dT dy
T ð9Þ
The air thermal conductivity is given by the followingexpression:
kT ¼ qc p K T ð10Þ
where the thermal turbulent diffusivity (K T ) is related to thekinematic turbulent viscosity (tT ) through the turbulentPrandtl number:
PrT ¼ tT
K T ð11Þ
Which is taken equal to 0.85.Thus, the kinematic turbulent viscosity is related to the
turbulent kinetic energy (k ) and to turbulent dissipationrate (e) according to the following relationship:
tT ¼ cl
k 2
e ð12Þ
where cl is 0.09.The turbulent dissipation rate e is expressed by the fol-
lowing equation (Tominaga et al., 2008):
e ¼c3=4l k
3=2
l ð13Þ
S. Bottillo et al./ Solar Energy 99 (2014) 1–10 7
7/23/2019 Fluid dynamic and heat transfer parameters in an urban canyon.pdf
Fig. 8. Impact of thermal effects on a vertical central plane within the canyon, comparison between parameter evaluated without natural convection(subscript 1) and with natural convection (subscript 2): Z velocity component along a vertical line at 0.40 m from the windward facade and its temperatureon a parallel line on the facade itself (a1 and a2); turbulent kinetic energy and heat transfer coefficient along the same lines (b1 and b2); velocity magnitudealong an horizontal line at 0.40 m from the ground surface and it is temperature (c1 and c2), turbulent kinetic energy and heat transfer coefficient along thesame lines (d1 and d2).
8 S. Bottillo et al./ Solar Energy 99 (2014) 1–10
7/23/2019 Fluid dynamic and heat transfer parameters in an urban canyon.pdf
where l is the mixing length.So the correlation between the heat transfer coefficient
and turbulent kinetic energy is:
hc ¼qc p c
1=4l l
PrT
dT dy
T k 1=2 ð14Þ
In literature there are several empirical relationships
between heat transfer coefficient over the external surfacesof the buildings (hc) and air velocity (Defraeye et al., 2010),but a few authors (Oleson et al., 2008; Masson, 2000) con-sider the effect of turbulent kinetic energy on hc. In thosestudies the heat transfer coefficient is related to the frictionvelocity value, through the correlations reported in Mas-cart et al. (1995), so that the heat transfer coefficientdepends on the atmospheric stability considering averagevalues on all the surfaces and for every wind speed direc-tions. In our analysis, instead, the heat transfer coefficientis related to the square root of turbulent kinetic, as shownin Fig. 8 and in Eq. (14). It has been noticed a direct cor-relation of the heat transfer coefficient and the local ther-mal stratification: for example, the thermal effects on theheat transfer coefficient on the leeward wall in shadoware less marked than on the sun-exposed wall, but anincrease of the average heat transfer coefficient can beobserved (from 7.1 W/m2 K without thermal effects to10.5 W/m2 K with natural convection module activated).It seems that the buoyancy induced vortex affects the over-all canyon flow field. These variations of heat exchangeprocesses among the various surfaces of the canyon, canhave an effect on the surface temperatures, as seen inFig. 8, and then a direct influence on thermal comfort indi-ces like the mean radiant temperature (De Lieto Vollaro
et al., 2013), in particular the heat transfer coefficient is
related to the square root of turbulent kinetic, as shownin Fig. 8 and in Eq. (14), that in turn depends on the localdifference between the surfaces and air temperature.
5. Conclusions
In this study a numerical simulation method has beenused to investigate the physical phenomena that character-ize a street canyon with a certain H/W ratio, N-S oriented,during a summer day. A fully 3D model has been simu-lated, considering the effects of solar radiation and radia-tive exchange on canyon air and surfaces temperature. Inthe first part, a comparison between a steady and a tran-sient simulation has been carried out, and it can be con-cluded that the stationary case is representative of thermo-fluid dynamics parameters within the canyon dur-ing the hottest hours of the day. In the second part of the study the impact of thermal effects on the flow fieldhas been analyzed and the difference between a 2D simula-
tion and the fully tridimensional case has been shown.Even when the flow field is characterized by a strong veloc-ity component parallel to the canyon direction, it has beennoticed that the buoyancy forces determine a thermalinduced vortex near the hottest facade. The obtainedresults are coherent with the studies on numerical simula-tions performed by Lei et al. (2012) and Xie et al. (2007),even if their simulation has been carried out on 2Ddomains and the thermal effects are more significant. Theimportance of considering a 3D domain has been shown,because the flow field within the canyon changes signifi-cantly as the air passes through the canyon itself and the
heat transfer coefficient values are remarkable higher thanthe 2D and the 3D transversal case. It can be seen that thewind direction strongly affects the thermal processes withinthe canyon. So that further analysis must be performedconsidering not only different wind velocity intensities butalso different directions. Besides, buoyancy forces affectthe flow field, determining thermal induced vortices and ahigher value of turbulent kinetic energy, affecting the heattransfer coefficient and consequently the surface tempera-tures. Taking into account that the standard k – e seems tooverestimate the production of turbulent kinetic energy(Assimakopoulos et al., 2006; Lakehal, 1998; Meroneyet al., 1999), further numerical analysis and measurementcampaigns must be performed to investigate the correlationbetween the heat transfer coefficient and the characteristics(magnitude and direction) of flow field in an urban canyon,in order to determine the local heat exchange processes andtheir effects on the thermal comfort in outdoor spaces andon the buildings energy needs for cooling and heating.
References
Allegrini, J., Dorer, V., Carmeliet, J., 2012a. Analysis of convective heattransfer at building facades in street canyons and its influence on thepredictions of space cooling demand in buildings. Journal of WindEngineering and Industrial Aerodynamics 104–106, 464–473.
Fig. 9. Heat transfer coefficient on the windward (WW) fac
ade and on theleeward (LW) one for the 2D simulation of the street canyon.
Allegrini, J., Dorer, V., Defraeye, T., Carmeliet, J., 2012b. An adaptivetemperature wall function for mixed convective flows at exteriorsurfaces of buildings in street canyons. Building and Environment 49,55–66.
Ansys Fluent version 14.0.0, 2011. User’s Guide.Assimakopoulos, V.D., Georgakis, C., Santamouris, M., 2006. Experi-
mental validation of a computational fluid dynamics code to predictthe wind speed in street canyons for passive cooling purposes. SolarEnergy 80, 423–434.
Blocken, B., Stathopoulos, T., Carmeliet, J., 2007. CFD simulation of theatmospheric boundary layer: wall function problems. AtmosphericEnvironment 41, 238–252.
Bozonnet, E., Belarbi, R., Allard, F., 2005. Modeling solar effects on theheat and mass transfer in a street canyon, a simplified approach. SolarEnergy 79, 10–24.
Defraeye, T., Blocken, B., Carmeliet, J., 2010. Convective heat transfercoefficients for exterior building surfaces: existing correlations andCFD modeling. Energy Conversion and Management.
Defraeye, T., Blocken, B., Carmeliet, J., 2011. An adjusted temperaturewall function for turbulent forced convective heat transfer for bluff bodies in the atmospheric boundary layer. Building and Environment46 (11), 2130–2141.
De Lieto Vollaro, R., Vallati, A., Bottillo, S., 2013. Different methods toestimate the mean radiant temperature in an urban canyon. AdvancedMaterials Research 650, 647–651.
Franke, J., Hellsten, A., Schlunzen, H., Carissimo, B., 2007. Best practiceguideline for the CFD simulation of flows in the urban environment.COST Action 732.
Kovar–Panskus, A., Moulinneuf, L., Savory, E., Abdelqari, A., Sini, J.F.,Rosant, J.M., Robins, A., Toy, N., 2002. A wind tunnel investigationof the influence of solar-induced wall-heating on the flow regime withina simulated urban street canyon. Water, Air, and Soil Pollution: Focus2, 555–571.
Lakehal, D., 1998. Application of the k – e model to flow over a buildingplaced in different roughness sublayers. Journal of Wind Engineeringand Industrial Aerodynamics 73, 59–77.
Lei, L., Lin, Y., Li-Jie, Z., Yin, J., 2012. Numerical study on the impact of ground heating and ambient wind speed on flow fields in streetcanyons. Advances in Atmospheric Sciences 29, 1227–1237.
Louka, P., Vachon, G., Sini, J.F., Mestayer, P.G., Rosant, J.M., 2002.Thermal effects on the airflow in a street canyon – Nantes’99experimental results and model simulations. Water, Air, Soil Pollution:Focus 2, 351–364.
Mascart, P., Noilhan, J., Giordani, H., 1995. A modified parameterizationof flux-profile relationship in the surface layer using different rough-
ness length values for heat and momentum. Boundary-Layer Meteo-rology 72, 331–344.
Masson, V., 2000. A physically-based scheme for the urban energy budgetin atmospheric models. Boundary-Layer Meteorology 94, 357–397.
Meroney, R.N., Leitl, B.M., Rafailidis, S., Schatzmann, M., 1999. Wind-tunnel and numerical modeling of flow and dispersion about severalbuilding shapes. Journal of Wind Engineering and Industrial Aerody-namics 81, 333–345.
Offerle, B., Eliasson, I., Grimmond, C.S.B., Holmer, B., 2007. Surfaceheating in relation to air temperature, wind and turbulence in an urbanstreet canyon. Boundary-Layer Meteorology 122, 273–292.
Oleson, K.W., Bonan, G.B., Feddema, J., Vertenstein, M., Grimmond,C.S.B., 2008. An urban parameterization for a global climate model.Part I: Formulation and evaluation for two cities. Journal of AppliedMeteorology and Climatology 47, 1038–1060.
Ramponi, R., Blocken, B., 2012. CFD simulation of cross-ventilation fora generic isolated building: impact of computational parameters.Building and Environment 53, 34–48.
Saneinejad, S., Moonen, P., Defraeye, T., Carmeliet, J., 2011. Analysis of convective heat and mass transfer at the vertical walls of a streetcanyon. Journal of Wind Engineering and Industrial Aerodynamics99, 424–433.
Santamouris, M., Papanikolaou, N., Koronakis, I., Livada, I., Asimok-opoulos, D., 1999. Thermal and air flow characteristics in a deeppedestrian canyon under hot weather conditions. Atmospheric Envi-ronment 33, 4503–4521.
Takebayashi, H., Moriyama, M., 2012. Relationships between theproperties of an urban street canyon and its radiant environment:introduction of appropriate urban heat island mitigation technologies.Solar Energy 86, 2255–2262.
Tominaga, Y., Mochidab, A., Yoshiec, R., Kataokad, H., Nozue, T.,Yoshikawaf, M., Shirasawac, T., 2008. AIJ guidelines for practicalapplications of CFD to pedestrian wind environment around build-ings. Journal of Wind Engineering and Industrial Aerodynamics 96,1749–1761.
Uehara, K., Murakami, S., Oikawa, S., Wakamatsu, S., 2000. Windtunnel experiments on how thermal stratification affects how in andabove urban street canyons. Atmospheric Environment 34, 1553–1562.
Xie, X., Liu, C.H., Leung, D.Y.C., 2007. Impact of building facades andground heating on wind flow and pollutant transport in street canyons.Atmospheric Environment 41, 9030–9049.
10 S. Bottillo et al./ Solar Energy 99 (2014) 1–10