Page 1
FLUID FLOW, GAS ACCUMULATIONS, AND GAS HYDRATE FORMATION IN
KUMANO FOREARC BASIN DETERMINED BY SEISMIC REFLECTION
INTERPRETATION AND WELL DATA CORRELATION
A THESIS SUBMITTED TO THE GRADUATE DIVISION OF THE
UNIVERSITY OF HAWAI‘I AT MĀNOA IN PARTIAL FULFILLMENT
OF THE REQUIREMENTS FOR THE DEGREE OF
MASTER OF SCIENCE
IN
GEOLOGY AND GEOPHYSICS
MAY 2013
By
Jessica L. Barnes
Thesis Committee:
Gregory Moore, Chairperson
Clinton Conrad
Gregory Ravizza
Keywords: Kumano forearc basin, gas hydrate, BSR, free gas, fluid migration
Page 2
ii
ACKNOWLEDGEMENTS
I would like to take this time to thank the people that helped with the success of
my masters. My work was supported by funds from the National Science Foundation and
the Office of Naval Research. I would like to thank my committee members Greg Moore,
Greg Ravizza, and Clint Conrad for their insight and expertise on my thesis topic and
structure of the paper. I would also like to thank my family for all of their love and
support during this time in my life. I also thank my friends who provided a lot of support
and for always encouraging me to go further.
Page 3
iii
ABSTRACT
A marine three dimensional (3-D) seismic reflection data set reveals a gas hydrate
related bottom simulating reflector (BSR) within Kumano forearc basin, offshore Japan.
Well data collected from Site C0002 within the surveyed area provides information on
the physical and chemical properties of basin sediments and allows for correlation with
the dipping sedimentary layers imaged in the dataset. Calculation of gas saturations in
these horizons based on Archie’s Law shows preferential concentrations within sandier
horizons. Structural controls such as faults and channels affect the gas distribution and
illuminate migration pathways for gas to the BSR. Correlation of the strength of the BSR
amplitude with the physical and chemical properties of the dipping stratigraphic horizons
that are intersected by the BSR, determined by well log and core data, reveals the
applicability of BSR amplitude maps in determining locations of elevated gas hydrate
and free gas concentrations away from the wellbore.
Page 4
iv
TABLE OF CONTENTS
Acknowledgements ................................................................................................................... ii
Abstract .................................................................................................................................... iii
List of Figures .......................................................................................................................... vi
1. Introduction ..........................................................................................................................1
2. Gas Hydrates ........................................................................................................................6
3. Regional Background...........................................................................................................8
4. Well Data ...........................................................................................................................10
4.1.Well Log Data ........................................................................................................10
4.1.1. Gamma Ray .........................................................................................11
4.1.2. Caliper ..................................................................................................12
4.1.3. Resistivity ............................................................................................12
4.1.4. Porosity ................................................................................................13
4.1.5. Sonic Velocity ......................................................................................14
4.1.6. Well Log Interpretation........................................................................15
4.2.Core Data ...............................................................................................................17
4.2.1. Lithology ..............................................................................................18
4.2.2. Structure ...............................................................................................19
Page 5
v
4.2.3. Geochemistry .......................................................................................20
5. Indicators of gas hydrate, free gas accumulations, and fluid flow in seismic reflection
data .....................................................................................................................................22
5.1. BSR Distribution ...................................................................................................23
5.2. High Amplitude Reflections .................................................................................24
5.3. Gas Accumulation within Channels......................................................................25
5.4. Fault interactions ...................................................................................................26
6. Gas hydrate and free gas concentration estimates at the wellbore from well logs ............28
6.1. Methods for determining gas hydrate and free gas saturations.............................28
6.2. Correlation of gas saturation estimates with other log properties .........................30
7. Use of BSR amplitude for extrapolation of gas content away from the wellbore .............32
7.1. Amplitude of the BSR within the basin ...............................................................32
7.2. Projection methods of BSR amplitude to Hole C0002A .....................................33
7.3. Interpretation and correlation of BSR amplitude at the wellbore ........................33
8. Conclusions ........................................................................................................................35
References ................................................................................................................................58
Page 6
vi
LIST OF FIGURES
Figure Page
1. Location maps ....................................................................................................................38
2. Profile of seismic data along InLine 2530 ..........................................................................39
3. Profile of Kumano basin along InLine 2530 .......................................................................40
4. Cartoon demonstrating difference processes related to gas ...............................................41
5. Location of holes at site C0002 and well data gas .............................................................42
6. Summary of well logs from Hole C0002A ........................................................................43
7. Correlation of intervals in Zones A and B from EXP314 ..................................................44
8. Correlation of well logs and seismic data in Zone B .........................................................45
9. Inorganic chemistry profiles of C0002 ..............................................................................46
10. Organic chemistry profiles of C0002 .................................................................................47
11. Structure and isochore maps of seafloor and BSR ............................................................48
12. Seismic profile with high amplitude reflections ..............................................................50
13. Seismic profile with high amplitudes in Zone B ..............................................................51
14. Seismic profile with amplitudes of horizons, channel, and faults ....................................52
15. Correlation of gas saturations with seismic and well logs in basin ..................................53
16. Correlation of gas hydrate saturations with well logs above BSR ....................................54
17. Amplitude map of the BSR ...............................................................................................55
18. Seismic profile with projection of BSR amplitude to wellbore ........................................56
Page 7
vii
19. Correlation of BSR amplitude to well logs .......................................................................57
Page 8
1
CHAPTER 1: INTRODUCTION
Research on gas hydrates has increased in the past few decades, fueled by the
growing interest in their implications including their potential role as an energy resource. In
fact, during March 2013, Japan Oil (Japan Oil, 2013) produced gas from offshore methane
hydrate bearing layers for the first time in history. The location of this production is in the
Daini Atsumi Knoll, just northeast of Kumano forearc basin, the region of focus for this
paper (Fig. 1). Though production at this site is experimental rather than commercial, the
additional data collected will contribute to the understanding of gas hydrates, including the
process of gas hydrate dissociation and its resulting effects on the stability of the seafloor. A
decrease in seafloor or slope stability due to gas hydrate dissociation can cause slope failure.
Slope failure is a significant hazard to underwater installations, pipelines, cables, and drilling.
Knowledge of the concentration and distribution of gas hydrates will aid in determining
where the greatest hazards lie, as well as, target locations for energy extraction.
Gas hydrates are crystalline solids made up of a lattice of water molecules
surrounding a low-molecular weight gas molecule, typically methane. They are found in low
temperature high pressure environments such as on land in the permafrost and in the marine
realm on continental margins. Their occurrence is limited to a zone of stability, the gas
hydrate stability zone (GHSZ), defined by factors including temperature, pressure, and
composition of interstitial gas and water. Within the GHSZ, gas hydrates may occur as both
pore-filling and fracture-filling gas hydrates, provided sufficient gas is available. Pore-filling
gas hydrates replace pore fluid in coarse-grained sediments, reducing the porosity and
Page 9
2
permeability of the sediment and thereby provide an excellent trap for free gas at the base of
the gas hydrate stability zone (BGHSZ) (Bahk et. al., 2011).
Although it is well known that gas migration by advection from below is the
dominant process in the accumulation of gas hydrates (e.g., Collett et al., 2009), the
mechanism of the gas advection and hydrate accumulation is debatable. Methane is believed
to migrate upward either as a dissolved phase in pore water (Hyndman and Davis, 1992) or
as a bubble phase, but both models require permeable pathways, such as fault systems or
porous permeable sediment layers, to allow for the migration of water and/or a gas phase
(Collett et al., 2009). Without effective migration pathways, it is unlikely that a significant
volume of gas hydrate could accumulate (Collette, 2009). In addition, most field
investigations of gas hydrate occurrence have shown that the concentration of gas hydrate is
mostly controlled by the presence of fractures and/or coarser grained sediments (e.g., Riedel
et al., 2006; Hutchinson et al., 2008, Park et al., 2008, Tsuji et al., 2009; Torres et al., 2008).
The presence of hydrates reduces the permeability of sediment, making the hydrate-
bearing sediment a seal that can trap any free gas that may be migrating from below (Berndt
et al., 2004; Hustoft et al., 2007). In marine seismic data, the BGHSZ is marked by either a
bottom simulating reflection (BSR), often with high amplitude and opposite polarity to the
seabed, or aligned terminations of high amplitude reflections caused by the low velocity gas-
charged sediment trapped beneath the BGHSZ (Andreassen et al., 1997). Gas hydrate-related
BSRs have been documented around the world including the Storegga Slide, offshore
Norway; Krishna–Godavari Basin, India; Cascadia Margin, off the coast of Oregon and
Vancouver Island; Blake Ridge region, off the east coast of the United States; the Pacific
Page 10
3
margin, offshore Costa Rica and Nicaragua (Berndt et al., 2004; Brown et al., 2006; Shankar
et al., 2010; Bangs et al., 2005; Shipboard Scientific Party, 1996; Talukder et al., 2007). They
have also been identified and documented off the coast of Japan including in the Eastern
Nankai Trough (Foucher et al., 2002; Ashi et al., 2002; Colwell et al., 2004; Martin et al.,
2004; Tsuji et al., 2009).
The Kumano forearc basin overlies the Nankai Trough accretionary prism offshore
the Kii Peninsula of Honshu, Japan. Seismic surveys show that this basin contains a
widespread negative-polarity BSR, suggesting the presence of gas hydrates and associated
free gas (e.g., Ashi et al., 2002; Colwell et al., 2004). The BSR was imaged in detail on a
three-dimensional (3-D) marine seismic reflection dataset acquired in 2006 under contract by
Petroleum Geo-Services using the commercial vessel M/V Nordic Explorer (Moore et al.,
2007; Bangs et al., 2010).The survey encompasses an area approximately 585 km2, imaging
the Kumano forearc basin, Nankai accretionary prism, and subducting oceanic plate (Figs. 1,
2). This is the first ever academic 3D marine seismic data set collected, providing the
scientific community with a chance to study the BSR more extensively (Tobin et al., 2009).
This data set was used to locate the sites for drilling during several Integrated Ocean Drilling
Program (IODP) Expeditions (Moore et al., 2009). The well C0002A, which was drilled at
one of these sites in 2007 as part of the Integrated Ocean Drilling Project (IODP) Expedition
314, also suggests the presence of gas hydrates in the basin by well log responses. Elevated
resistivity responses in Hole C0002A, above the BSR, were interpreted to indicate the
presence of hydrates within sandy layers above the BSR since gas hydrates are highly
resistive due to their resistive hydrogen-bond lattice (Expedition 314 Scientists., 2009b).
Page 11
4
In addition to imaging the BSR, the seismic reflection survey revealed key aspects
pertaining to structure within the basin. The sedimentary bedding in the basin consists of
high dipping beds intersecting the BSR as they dip to the north-northwest direction (Fig. 3).
Numerous normal faults were identified with offsets of 5-30 meters (m) cutting the
sedimentary section (Gulick et al., 2010; Moore et al., 2013). The amplitudes of the BSR
and sedimentary horizons exhibit variability associated with the occurrence of these normal
faults, with contrasts of high amplitude and low amplitude on either side of the fault. The
pattern of amplitude variation suggests the method of fluid advection is dominated by
migration within preferential horizons. If gas is being advected upward along small fractures
in the basin, then there should be a relatively uniform gas distribution, resulting in relatively
uniform BSR amplitude. In contrast to this, if gas is migrating along preferential horizons
such as more permeable sandy layers, then differential amplitude strength of the BSR may be
expected.
We hypothesize that the prominent advection method in Kumano forearc basin is by
upward migration within the permeable sandy layers. As illustrated in Figure 4, the dipping
layers provide a migration pathway to the GHSZ where free gas and water form gas hydrate,
creating an impermeable barrier and trapping gas beneath, resulting in the manifestation of
the BSR in the seismic reflection data set. BSR amplitude maps may aid in illuminating
these migration pathways. If this hypothesis is correct, we expect to see high BSR amplitudes
where sandy layers meet the BGHSZ, as well as lower BSR amplitudes correlated with less
permeable layers intersecting the BSR. We test this by identifying and mapping the BSR and
other high amplitude reflections on the 3-D seismic dataset and integrating well log and
core data to the seismic data to determine the properties of the sedimentary horizons imaged
Page 12
5
in the seismic dataset. Further, relationships between BSR amplitude strength and properties
of intersecting horizons are made by amplitude extraction and correlation with interpreted
well data. By relating the properties of the BSR with sedimentary layers in the vicinity of the
well, we will be able to extrapolate results to the extents of the seismic survey. This will
provide essential information about gas hydrate concentration, free gas, and migration of gas
at a more extensive scale, essential information for obtaining these natural resources as well
as preventing disaster during drilling of this region.
Page 13
6
CHAPTER 2: GAS HYDRATES
Gas hydrates are stable in low temperature and high pressure environments, being
found at continental margins and the permafrost. The thickness of this gas hydrate stability
zone (GHSZ) is highly dependent on factors including the bottom water temperature,
geothermal gradient, pressure (defined by depth), composition of gas, and formation water
salinity (Sloan, 1990). For oceanic settings, the gas hydrates need a minimum of 300 to 500
meters of water depth to form and for bottom water temperatures to approach 0˚C
(Kvenvolden, 1993). The maximum depth of gas hydrate formation is approximately 2000
meters below the solid surface and is limited by increasing temperature at depth
(Kvenvolden, 1993). Gas hydrates may form as cement in the pore space of sediment as well
as layers and nodules of pure hydrate. Recent studies by (Lu et. al., 2011 and Bahk et.al.,
2011), have suggested sediment grain size to be an influential factor on the formation of gas
hydrates, where they have found pore-filling gas hydrates to tend to occur in coarse grained
sediment and fracture-filling gas hydrates to occur in fine grained sediments such as shale.
The cementation process reduces the porosity and permeability, providing an excellent trap
for any existing gas beneath.
Since the base of the GHSZ is a function of pressure and temperature, any events that
affect these parameters including tectonic uplift, sea level fall, and warming of bottom water
temperatures, may cause larger accumulations of gas as the gas hydrates at the base of the
GHSZ go into dissolution, decomposing into fresh water and methane. However, the
liberated methane may also be re-concentrated within the GHSZ and reform as hydrate if it
can find a migration pathway back into stable conditions of the GHSZ (e.g. Paull et al., 1994;
Page 14
7
Baba et al., 2004; von Huene et al., 1999). Other main factors that influence the formation or
dissociation of gas hydrates include pore fluid/formation water salinity, gas concentration,
and the nature of the gas (Shankar et al., 2010).
Four types of BSRs within the Japanese island-arc have been classified based on
distribution of the BSRs and accumulation process of gas hydrates including ridge, buried
anticline, accretionary prism, and basin margin types (Baba and Yamada, 2004). Though all
four types are encountered within the 3-D seismic reflection survey, we focus on the basin
margin type BSR for this study.. The basin margin type BSR is manifested toward the edge
of the basin, crosscutting through basin center dipping stratigraphic reflections. It is thought
that this type of BSR is formed by upward migration and accumulation of gas through
permeable layers toward basin margin (Baba and Yamada, 2004).
Page 15
8
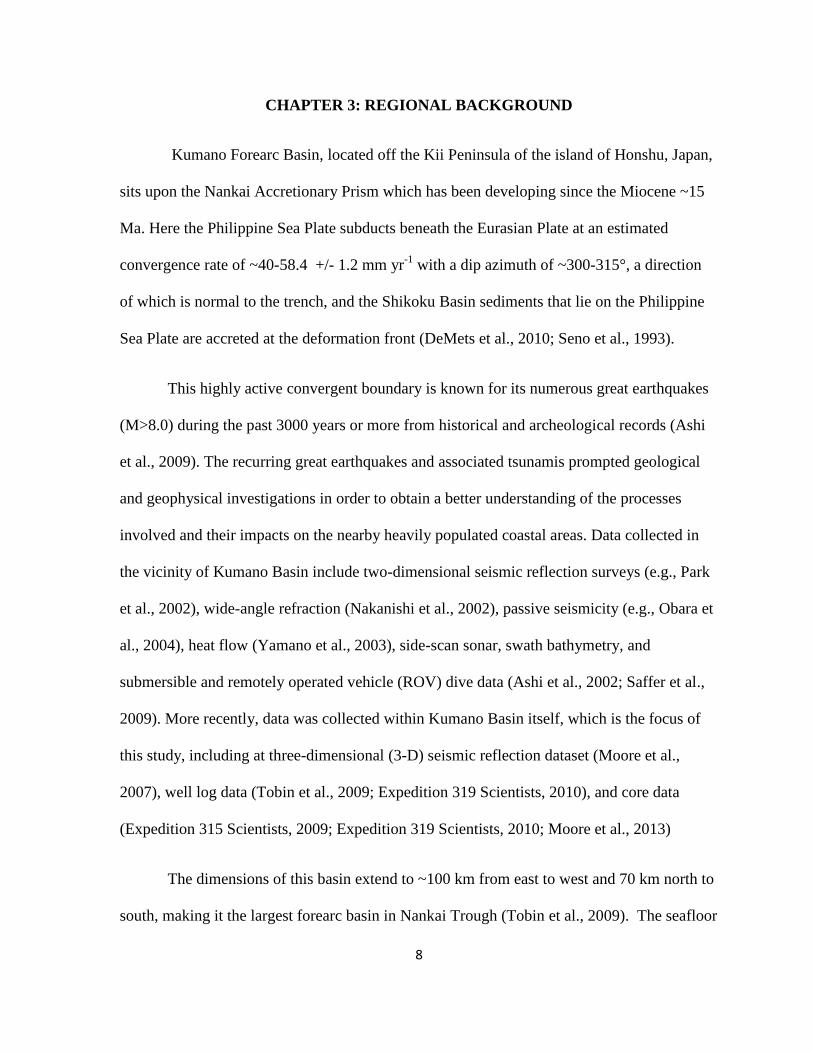
CHAPTER 3: REGIONAL BACKGROUND
Kumano Forearc Basin, located off the Kii Peninsula of the island of Honshu, Japan,
sits upon the Nankai Accretionary Prism which has been developing since the Miocene ~15
Ma. Here the Philippine Sea Plate subducts beneath the Eurasian Plate at an estimated
convergence rate of ~40-58.4 +/- 1.2 mm yr-1
with a dip azimuth of ~300-315°, a direction
of which is normal to the trench, and the Shikoku Basin sediments that lie on the Philippine
Sea Plate are accreted at the deformation front (DeMets et al., 2010; Seno et al., 1993).
This highly active convergent boundary is known for its numerous great earthquakes
(M>8.0) during the past 3000 years or more from historical and archeological records (Ashi
et al., 2009). The recurring great earthquakes and associated tsunamis prompted geological
and geophysical investigations in order to obtain a better understanding of the processes
involved and their impacts on the nearby heavily populated coastal areas. Data collected in
the vicinity of Kumano Basin include two-dimensional seismic reflection surveys (e.g., Park
et al., 2002), wide-angle refraction (Nakanishi et al., 2002), passive seismicity (e.g., Obara et
al., 2004), heat flow (Yamano et al., 2003), side-scan sonar, swath bathymetry, and
submersible and remotely operated vehicle (ROV) dive data (Ashi et al., 2002; Saffer et al.,
2009). More recently, data was collected within Kumano Basin itself, which is the focus of
this study, including at three-dimensional (3-D) seismic reflection dataset (Moore et al.,
2007), well log data (Tobin et al., 2009; Expedition 319 Scientists, 2010), and core data
(Expedition 315 Scientists, 2009; Expedition 319 Scientists, 2010; Moore et al., 2013)
The dimensions of this basin extend to ~100 km from east to west and 70 km north to
south, making it the largest forearc basin in Nankai Trough (Tobin et al., 2009). The seafloor
Page 16
9
of Kumano Basin is relatively flat and situated at approximately 2000 meters below sea level
(mbsl), being filled with sediments from submarine fan deposits which were subsequently cut
by normal faults (Park et al., 2002). This basin is confined by several high topographic
features, which are indicated in Figure 1B, including landward by the Shima Spur and
continental slope, the Daini Atsumi Knoll to the east, and seaward by an outer-arc high (Fig.
2) where a megasplay fault system surfaces (Ashi et al., 2009).
The basin can be divided into four main units based on angular unconformities (Tobin
et al., 2009); these are recognized in seismic reflection profiles (Fig. 3). The sediment
packages in the southern basin dip northward due to uplift of the seaward edge of the basin.
The depocenter is thought to have migrated over time, shifting arcward after each successive
unconformity. This pattern indicates deposition of these sedimentary units in a regime of
long-term uplift of the leading edge of the basin (Park et al., 2002; Moore et al., 2007).
Page 17
10
CHAPTER 4: WELL DATA
Site C0002 was logged during IODP Expedition 314 and cored during Expeditions
315 and 338. The collected data encompasses approximately 2000 meters below seafloor
(mbsf), comprised of basin sediments as well as the first few hundred meters of the
underlying accretionary prism. Well data from site C0002 supports the division of the basin
into the four units previously identified in seismic data, though a fifth unit in the underlying
accretionary prism was identified in Expedition 338, and is used in conjunction with the
seismic data to determine the physical properties of the dipping strata (Fig. 5). Unit I is
interpreted to be slope basin deposits, Units II as basin fill dominated by turbidite deposits,
Unit III as mudstone, and Unit IV as older accretionary prism (Tobin et al., 2009). Unit II
(135.5-830.4 mbsf ) is the main focus of this study as it includes the BSR (~400 mbsf), tilted
beds, and two zones of interest, Zone A (218.1-400.4 mbsf) , which is interpreted be a gas
hydrate bearing zone with gas hydrates concentrated within sandy layers, and Zone B
(481.6-547.1 mbsf), interpreted to be a potential gas-bearing interval focused in the
particularly sandy beds of the interbedded sandy/silty and shaley turbidite packages
(Expedition 314 Scientists, 2009b).
4.1. Well log data
Well log data is provided from Hole C0002A during IODP Expedition 314 with D/V
Chikyu. This hole was drilled with logging-while-drilling (LWD), measurement while
drilling (MWD), and annular-pressure-while-drilling (APWD) tools including several of
Schlumberger’s VISION series tools. The LWD-MWD-APWD tools include geoVISION
Page 18
11
and sonicVISION for LWD, MWD PowerPulse, seismicVISION, and adnVISION.
Measurements recorded with these tools that are most relevant to this study, providing
constraints on sand content, porosity, and fluid/gas content of the rocks include gamma ray
(GR), caliper, resistivity , image-derived bulk density (IDRO), thermal neutron porosity
(TNPH), and sonic P-wave velocity (Fig. 6; Expedition 314 Scientists, 2009b).
4.1.1. Gamma Ray
Natural gamma ray (GR) logs measure the radioactivity in sediments, based on the
combination of U, Th, and K elements present within the rock and fluids. Since sediments
such as shale and organic rich sediments have high natural GR values compared to the low
values expected for most (low radioactivity) sandstone, GR logs may be used to determine
the lithology of sediments, distinguishing between sands and muds/clays.
Gamma ray values in Unit II show an increasing trend in GR values from the top of
Unit II to approximately 474.5 mbsf, just above Zone B, suggestive of a trend towards a
more mudstone dominated lithology. After 474.5 mbsf, the GR values have an overall
decreasing trend till the bottom of Unit II, suggestive of a slightly more silty/sandy
environment. Gamma Ray values are rather variable throughout, indicative of the variable
lithology of the turbidites. Some of the strongest variability occurs within Zones A and B,
with highest frequency in Zone B. At a finer scale, many of these GR cycles have values that
drop abruptly, indicative of the deposition of sand over mud. These lower GR values then
gradually fine upwards toward the higher GR values of muddier sediments (Fig. 7;
Expedition 314 Scientists, 2009b).
Page 19
12
4.1.2. Caliper
Caliper logs may aid in determining the lithology of sediments. Calipers are used to
determine the borehole conditions by deploying a caliper tool that extends articulated arms
that push against the sides of the borehole, recording the size and shape of the borehole with
depth. Increased values in borehole diameter may be interpreted to be less consolidated
sediments as these sediments are more easily washed out from along the borehole. Good
caliper values were attained throughout most of the logging of Unit II except at two intervals,
Zone B and the lowermost section of Unit II (below ~700 mbsf) where values are
representative of borehole washout due to the presence of unconsolidated sandier intervals
(Expedition 314 Scientists, 2009b).
4.1.3. Resistivity
Resistivity logs measure a formation’s resistivity, the ability of the formation to
obstruct the flow of electric current that is sent by the logging tools. This tool was developed
to find hydrocarbons as they are highly resistive in contrast to rock materials and the
conductive nature of other enclosed fluids (Rider, 2002). Resistivity logs are an important
tool for this study, as they exhibit elevated responses in the presence of gas hydrates.
Schlumberger’s geoVISION tool was configured to record five resistivity measurements and
electrical images of the borehole wall including bit; ring; and shallow, medium, and deep
button. The tool is connected directly above the drill bit and uses the lower portion of tool
and bit as a measuring electrode. This bit resistivity measurement has a vertical resolution
just a few centimeters longer than the length of the bit and a depth of investigation of 12
Page 20
13
inches (Expedition 314 Scientists, 2009a). Ring resistivity is a focused lateral resistivity
measurement from a cylindrical electrode placed 102 cm from the bottom of the tool and
provides measurements with a depth of investigation of 7 inches and vertical resolution of 2-
3 inches (Expedition 314 Scientists, 2009a). Three azimuthally-focused button electrodes are
spaced along the longitudinal direction of the tool and provide shallow, medium, and deep-
focused resistivity measurements with different depths of investigation of 1, 3, and 5 inches
and vertical resolution of 2-3 inches (Expedition 314 Scientists, 2009a).
Elevated resistivity values are found in Unit II with an overall increase in resistivity
from the top of Unit II to the bottom of Zone A, followed by a slightly decreasing trend in
resistivity throughout the rest of the unit. Separation between shallow and deep resistivity is
~1 ohm m for most of the unit with two exceptions: Zone A and Zone B. The most
significant separation occurs within Zone A, the zone where the most significant resistivity
spikes occur, thought to imply the presence of gas hydrate (Fig. 6). The highest frequency in
resistivity spikes, with values reaching 50 ohm m, occurs towards the bottom of Zone A,
corresponding with the observation of the BSR. These large resistivity spikes are suggestive
of higher saturation values of gas hydrate just above the BSR. Resistivity values within Zone
B are scattered but remain low with highest values approaching 3 ohm m. Due to the
scattered nature of Zone B, many negative (conductive) intervals occur, most of which are
linked to sandier layers (Expedition 314 Scientists, 2009b).
4.1.4. Porosity
Schlumberger’s adnVISION azimuthal density neutron service provides
measurements of neutron porosity and formation bulk density. Thermal neutron porosity
Page 21
14
(TNPH) records a formation’s reaction as it is bombarded with neutrons (Rider, 2002).
Hydrogen nuclei have the greatest effect on the neutrons and therefore, the log is mostly a
measure of hydrogen content such as in the formation’s water content. This tool can be an
excellent determinant of porosity in sandstones; however, the neutron log cannot discern
between pore water and bound water, resulting in overestimation of porosity in clays due to
their bound water. The highest values of TNPH occur towards the top of Unit II and in Zone
B. The largest decrease in values occurs below Zone B, where the majority of values range
from 45 to 50% in contrast to the 50 to 60% range above.
Porosity is also calculated from the bulk density log by using values of constant grain
density of 2.65 g/cm3 and water density of 1.024 g/cm
3 (Expedition 314 Scientists, 2009b).
The resulting density porosity profile shows the highest average values within the top of Unit
II and Zone B. Porosity drops in the bottom half of Zone B from values ~53% to ~47%.
Values increase within Zone B with large scatter and then drop down to ~43% to the bottom
of Unit II, with scatter increasing again towards the bottom of the unit. The large scatter in
measurements by this tool suggests inaccurate measurements may have occurred; therefore,
these tools were used with caution.
4.1.5. Sonic Velocity
Sonic or acoustic logs measure the compressional or P-waves that arrive at the
receivers after being transmitted from the tool and reflected off of the formation. They are
used quantitatively to evaluate porosity, as well as aid with seismic investigations by
providing interval velocities. They can also be used qualitatively for correlation, source rock
evaluation, and determination of lithology, texture, and compaction and overpressure (Rider,
Page 22
15
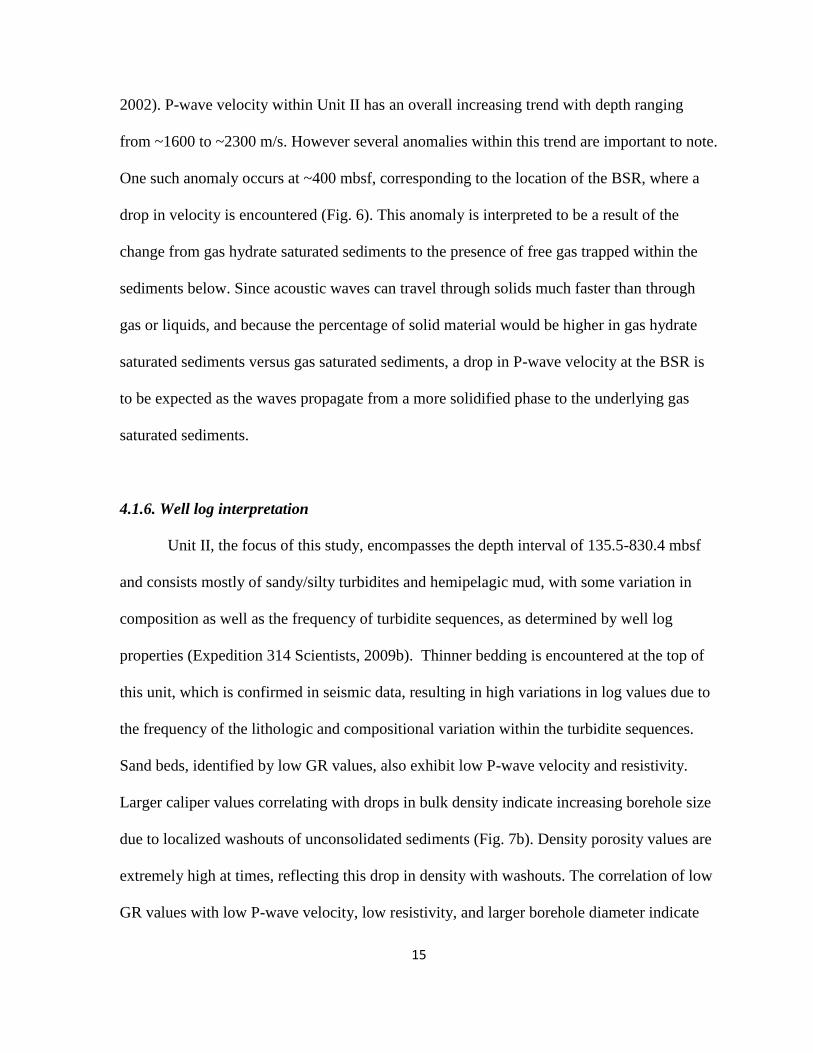
2002). P-wave velocity within Unit II has an overall increasing trend with depth ranging
from ~1600 to ~2300 m/s. However several anomalies within this trend are important to note.
One such anomaly occurs at ~400 mbsf, corresponding to the location of the BSR, where a
drop in velocity is encountered (Fig. 6). This anomaly is interpreted to be a result of the
change from gas hydrate saturated sediments to the presence of free gas trapped within the
sediments below. Since acoustic waves can travel through solids much faster than through
gas or liquids, and because the percentage of solid material would be higher in gas hydrate
saturated sediments versus gas saturated sediments, a drop in P-wave velocity at the BSR is
to be expected as the waves propagate from a more solidified phase to the underlying gas
saturated sediments.
4.1.6. Well log interpretation
Unit II, the focus of this study, encompasses the depth interval of 135.5-830.4 mbsf
and consists mostly of sandy/silty turbidites and hemipelagic mud, with some variation in
composition as well as the frequency of turbidite sequences, as determined by well log
properties (Expedition 314 Scientists, 2009b). Thinner bedding is encountered at the top of
this unit, which is confirmed in seismic data, resulting in high variations in log values due to
the frequency of the lithologic and compositional variation within the turbidite sequences.
Sand beds, identified by low GR values, also exhibit low P-wave velocity and resistivity.
Larger caliper values correlating with drops in bulk density indicate increasing borehole size
due to localized washouts of unconsolidated sediments (Fig. 7b). Density porosity values are
extremely high at times, reflecting this drop in density with washouts. The correlation of low
GR values with low P-wave velocity, low resistivity, and larger borehole diameter indicate
Page 23
16
that the beds are sandy, uncemented, soft, and permeable (Expedition 314 Scientists, 2009b).
The density profile indicates that the majority of turbidite cycles within Unit II are on the
scale of a meter. Within this unit, two zones, Zone A and Zone B, are distinguished based on
differences from the rest of the unit, potentially related to post-depositional properties
(Expedition 314 Scientists, 2009b).
Expedition 314 Scientists (2009b) interpreted Zone A (218.1-400.4 mbsf) to be a gas
hydrate bearing zone, with the highest concentration of gas hydrate within the sandy layers
inferred from large spikes in resistivity correlating with low GR values (Fig. 7a). This zone is
rather similar to the rest of Unit II in terms of GR and neutron porosity; however, the large
resistivity values make this zone distinguishable. Further, the resistivity response throughout
this zone is elevated compared to the rest of Unit II. Resistivity values range from ~1-50
ohm m within this zone and contains >50 significant resistivity spikes with thicknesses
ranging from 20-140 cm. The greatest concentration of these spikes occurs in the lowermost
portion of the zone at 350-400 mbsf where they are generally found >75 cm thick
(Expedition 314 Scientists, 2009b). Low GR values, high velocity, and better borehole
diameters are associated with these occurrences, reflecting more cemented sandy units,
presumably due to the gas hydrate in pore space (Fig. 7a). Further, the resistivity spikes are
typically found at the bases of asymmetric GR logs lows, which are interpreted as fining-
upward sequences with gradational tops, indicating a host bed grain-size control on gas
hydrate formation as highest resistivity values are found in the sandiest portions of the
turbidite sequence (Expedition 314 Scientists, 2009b). Resistivity and sonic values, whose
baseline values have increased throughout this zone, decrease abruptly at its base. This
sudden drop in P-wave velocity and resistivity coincides with the observed depth of the BSR
Page 24
17
(~400 mbsf) in the seismic dataset, reflecting the change from gas hydrate bearing sediment
to free gas and water saturated sediments.
Expedition 314 Scientists (2009b) identified Zone B (481.6-547.1 mbsf) with the
highest sustained frequency and magnitude of log variations within Unit II and interpreted
this zone to be a gas bearing interval with gas being concentrated within sandy horizons of
turbidites. Sandy beds, identified by the presence of conductive intervals with low GR
values, range in size from 0.2-1 m (Expedition 314 Scientists, 2009b). The thickest of these
sand beds occur in the middle of the zone between 500-525 m. Mud rich zones are
interpreted to occur above and below Zone B due to higher gamma ray values and lower
variability in resistivity logs responses. The presence of the permeable sandy layers
sandwiched between two less permeable mud rich zones, make Zone B a likely conduit for
gas and liquid. The presence of gas within this zone is suggested by the drop in P-wave
velocity, increased magnitude in variation of density logs, and the presence of a negative
polarity horizon (Fig. 8).
4.2. Core data
Two IODP expeditions, Expeditions 315 and 338, cored the depths of interest,
providing a complete and detailed record of the sediments encountered in the basin (Fig. 5).
Three holes were drilled and cored during Expedition 315 onboard D/V Chikyu in late 2007
with poor to moderate core recovery. The first hole, Hole C0002B, cored the depth interval
from 475.5 to 1057.0 mbsf, gathering data from Units II, III, and IV including Zone B within
Unit II. The other two holes, Hole C0002C and Hole C0002D were cored at depths of 0-
Page 25
18
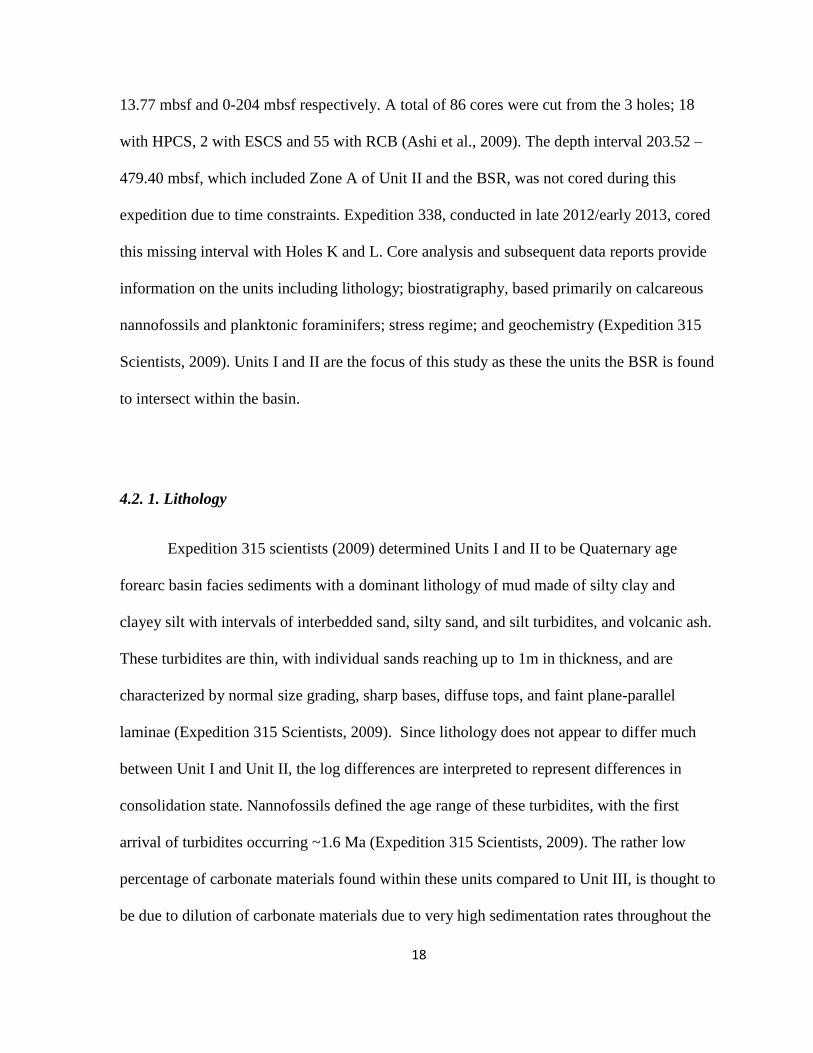
13.77 mbsf and 0-204 mbsf respectively. A total of 86 cores were cut from the 3 holes; 18
with HPCS, 2 with ESCS and 55 with RCB (Ashi et al., 2009). The depth interval 203.52 –
479.40 mbsf, which included Zone A of Unit II and the BSR, was not cored during this
expedition due to time constraints. Expedition 338, conducted in late 2012/early 2013, cored
this missing interval with Holes K and L. Core analysis and subsequent data reports provide
information on the units including lithology; biostratigraphy, based primarily on calcareous
nannofossils and planktonic foraminifers; stress regime; and geochemistry (Expedition 315
Scientists, 2009). Units I and II are the focus of this study as these the units the BSR is found
to intersect within the basin.
4.2. 1. Lithology
Expedition 315 scientists (2009) determined Units I and II to be Quaternary age
forearc basin facies sediments with a dominant lithology of mud made of silty clay and
clayey silt with intervals of interbedded sand, silty sand, and silt turbidites, and volcanic ash.
These turbidites are thin, with individual sands reaching up to 1m in thickness, and are
characterized by normal size grading, sharp bases, diffuse tops, and faint plane-parallel
laminae (Expedition 315 Scientists, 2009). Since lithology does not appear to differ much
between Unit I and Unit II, the log differences are interpreted to represent differences in
consolidation state. Nannofossils defined the age range of these turbidites, with the first
arrival of turbidites occurring ~1.6 Ma (Expedition 315 Scientists, 2009). The rather low
percentage of carbonate materials found within these units compared to Unit III, is thought to
be due to dilution of carbonate materials due to very high sedimentation rates throughout the
Page 26
19
history of Unit II at 400-800 m/m.y (Expedition 315 Scientists, 2009). The Unit II/III
boundary is defined in core data by a shift from turbidites above to condensed mudstone
below.
Unit III was interpreted by Expedition 315 Scientists (2009) as a Pleistocene to late
Miocene basal forearc basin deposit consisting of mudstone (silty claystone) with sparse beds
and irregular lenses of volcanic ash deposited above the CCD, both prior to and during the
early stages of the basin. The rate of sedimentation is much lower than Unit II, at a rate of
18-30 m/m.y, and preserves a diverse assemblage of infauna (Expedition 315 Scientists,
2009). Nannofossil age dating by Expedition 315 Scientists (2009) reveals an unconformity,
with a hiatus spanning ~3.8 to 5.0 Ma, at the base of this unit. This hiatus is also suggested
by a change in lithology at the contact between accreted trench-wedge sediment and initial
deposits of hemipelagic mud on the lowermost trench slope, is thought to be a manifestation
of uplift along a system of out-of-sequence (splay) faults at ~ 5 Ma (Expedition 315
Scientists, 2009). Unit IV was determined to be Miocene age upper accretionary prism
consisting of mudstone (silty claystone to clayey siltstone) interbedded with siltstone and
sandstone. A marked drop in concentrations of calcareous nannofossils from Unit II to IV
suggests these sediments were deposited below the CCD. Only one nannofossil event was
recognized, assigning this unit to late Miocene age (Expedition 315 Scientists, 2009).
4.2. 2. Structure
Three phases in the history of the stress regime are recorded in the deformation as
inferred from observations of textures and crosscutting relations in the cores (Expedition 315
Page 27
20
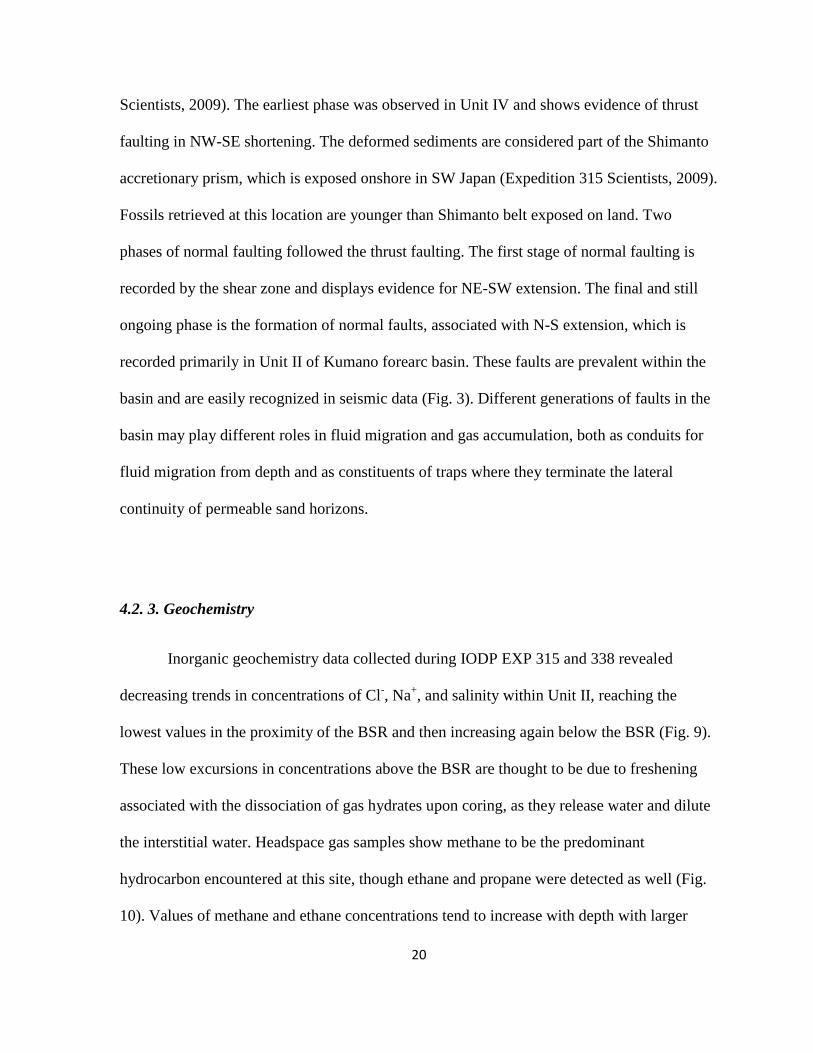
Scientists, 2009). The earliest phase was observed in Unit IV and shows evidence of thrust
faulting in NW-SE shortening. The deformed sediments are considered part of the Shimanto
accretionary prism, which is exposed onshore in SW Japan (Expedition 315 Scientists, 2009).
Fossils retrieved at this location are younger than Shimanto belt exposed on land. Two
phases of normal faulting followed the thrust faulting. The first stage of normal faulting is
recorded by the shear zone and displays evidence for NE-SW extension. The final and still
ongoing phase is the formation of normal faults, associated with N-S extension, which is
recorded primarily in Unit II of Kumano forearc basin. These faults are prevalent within the
basin and are easily recognized in seismic data (Fig. 3). Different generations of faults in the
basin may play different roles in fluid migration and gas accumulation, both as conduits for
fluid migration from depth and as constituents of traps where they terminate the lateral
continuity of permeable sand horizons.
4.2. 3. Geochemistry
Inorganic geochemistry data collected during IODP EXP 315 and 338 revealed
decreasing trends in concentrations of Cl-, Na
+, and salinity within Unit II, reaching the
lowest values in the proximity of the BSR and then increasing again below the BSR (Fig. 9).
These low excursions in concentrations above the BSR are thought to be due to freshening
associated with the dissociation of gas hydrates upon coring, as they release water and dilute
the interstitial water. Headspace gas samples show methane to be the predominant
hydrocarbon encountered at this site, though ethane and propane were detected as well (Fig.
10). Values of methane and ethane concentrations tend to increase with depth with larger
Page 28
21
local spikes occurring within Zones A and B of Unit II. Propane concentrations are rather
low throughout; however, larger spikes of propane are found corresponding with Zone A and
Zone B of Unit II, suggestive of a thermogenic contribution to gas generation. A large
positive spike in concentration of all three of these gases occurs at the boundary of Unit III
and Unit IV, which may indicate gas trapped below this unconformity. Expedition 315 and
388 scientists found that most of the methane generated is of microbial origin based on
C1/(C2+C3) ratios and δ13
C-CH4 values, with a maximum of 50% thermogenic methane at
~2000 mbsf (Moore et al, 2013). The predominance of gas produced by microbial
degradation suggests a slow generation and small accumulation of gas at this site.
Page 29
22
CHAPTER 5: INDICATORS OF GAS HYDRATE, FREE GAS ACCUMULATIONS,
AND FLUID FLOW IN SEISMIC REFLECTION DATA
Seismic reflection surveys are useful for mapping geologic structures in the
subsurface and evaluating hydrocarbon accumulations that might occur as amplitude
anomalies. The marine seismic data used in this study was acquired by Petroleum Geo-
Services by towing an arrangement of sources and receivers underwater behind the ship
which recorded the interactions of acoustic waves on geological layers. The source consists
of two arrays of air guns with 28 Sodera G-guns of 51L (3090 in3), fired alternately at 37.5 m
intervals (Moore et al., 2007). As an air gun is fired, it produces a pulse of acoustic energy
as it releases compressed air. This creates a bubble that expands and contracts in the water,
providing an acoustic source as it sends acoustic waves through the water and subsurface. As
the acoustic waves reflect off different materials and travel back through the water towards
the surface, they are recorded by the towed receivers. The receivers in this survey consist of
four streamers positioned 150 m apart. Each streamer is 4.5 km long and consists of 360
groups at a 12.5 m interval. Data was recorded at 2 ms sampling for a total recorded length of
11.246 s (Moore et al., 2007). A processed post stack depth migration (PSDM) 3-D seismic
reflection data set is used for most of the interpretation work including interpretation of
dipping sedimentary beds, the BSR, channels, and faults.
Gas hydrate related BSRs manifest in seismic reflection profiles as negative polarity
reflections due to differences in the acoustic impedance, the product of P-wave velocity and
density, of gas hydrates and underlying accumulations of free gas. The presence of free gas
has a strong effect on BSR amplitude strength as even small amounts of free gas may cause a
Page 30
23
decrease in P-wave velocity, resulting in a highly negative polarity in BSR amplitude (Yi, B.
et al., 2011). Even an increase in concentration of free gas from 0% up to 1-2% of pore space
may lead to a decrease in seismic velocity down to 1200 m/s (Golmshtok and Soloviev,
2006; Domenico, 1976). Knowledge of the lateral distribution of the BSR is key in
determining geographic extent of gas hydrates, as well as constraining possible gas migration
pathways. Other indicators such as high amplitude reflections in relation to the BSR, faults,
and channels may provide further evidence to the gas migration and accumulation occurring
in the basin.
5.1. BSR distribution
The BSR appears in the 3-D data set extensively throughout the basin and less
extensively in the accretionary prism. For the scope of this paper, we focus on the BSR
within the basin. The BSR is picked as a high amplitude reflection, located ~400 mbsf, where
it is characterized by its reverse polarity in relation to the seafloor. The BSR runs subparallel
to the seafloor as it crosscuts through dipping sedimentary packages. It is picked in a 3-D
post stack depth migration data set and gridded using closest point method to preserve the
distribution pattern of the BSR. The depth of the BSR ranges from ~225 to 630 mbsf within
the 3-D seismic data set, becoming shallower towards the seaward side of the basin as it
approaches an outer-arc high. The BSR forms a high in the southern corner portion of the
basin that is imaged by the 3-D dataset (Fig. 11a). The high formed by the BSR follows a
local high in the seafloor as confirmed by bathymetry (Fig. 11b) and isochore map of the
seafloor and BSR (Fig. 11c). The structural high formed by the BSR provides a potential
Page 31
24
location for the formation of larger gas accumulations due to the low permeability of gas
hydrate cemented sediments above.
5.2. High amplitudes reflections
Stratigraphic horizons are observed to be commonly enhanced with bright reflections
(increased amplitude) in the Kumano basin. These reflections are most often seen terminating
at the BSR, inferring a change in properties within the sediments across the BSR interface
such as a change from gas hydrate saturated sediments to free gas and water saturated
sediments. Many of these reflections only appear with heightened amplitude on one side of
the BSR. High amplitude reflections above the BSR may be associated with significant
accumulations of gas hydrates. When significant gas accumulates within the gas hydrate
stability zone, water and gas will solidify to form gas hydrate. This change in properties from
liquid and gas to a solid phase, increases the acoustic velocity and hence the acoustic
impedance of the horizon. A gas hydrate saturated horizon beneath a water saturated horizon,
may result in a positive amplitude reflection.
Additionally, high amplitudes may occur below the BSR based on the same principal.
However, these high amplitudes are a result of differences in accumulations of free gas and
water within a horizon where a gas saturated horizon has a lower acoustic impedance than a
water saturated horizon. When the water saturated horizon occurs above the gas saturated
horizon, a negative amplitude reflection will occur. When encountering a horizon that
intersects the BSR and has been supplied with gas, both in the gas hydrate form and free gas,
a change in polarity may occur along this horizon. High amplitude reflections above the
Page 32
25
BSR, high amplitude reflections below the BSR, and polarity changes across the BSR are all
observed within Kumano basin and suggest migration pathways for gas (Fig. 12).
One such region of enhanced reflections is found on the seaward margin of the basin.
Here, reflections are found as a package of enhanced reflections that terminate at the base of
the BSR (Fig. 13). Site C0002 intersects this package, which correlates to Zone B of Unit II
and is determined to be a thick package of highly variable alternating sand and mud intervals
making up the turbidites. This package of reflectors is sealed by an impermeable mud
dominated facies above it. The top stratigraphic bed in the package of enhanced reflectors is
of negative polarity, suggestive of a gas charged permeable layer that may be one of the big
players responsible for the gas supplied to the BSR. The negative polarity is due to an
acoustic impedance contrast caused by the muddy layers above this more permeable gas
charged layer below. Mapping of this horizon throughout the basin shows a polarity reversal
at the BSR, with a high positive amplitude above the BSR This high positive amplitude
suggests an accumulation of gas hydrates along this horizon within the GHSZ as there is an
increase in acoustic velocity from the overlying mud dominated layer to this gas hydrate-rich
layer.
5.3. Gas accumulation within channels
A channel cuts through horizons beneath the BSR, found stratigraphically lower than
Zone B and further seaward (Fig. 14). This channel is tilted along with the horizons
signifying infilling of this channel prior to recent tilting of the sedimentary beds. This
channel is observed to be moving NE from the vicinity of the structural high and is observed
Page 33
26
widening and becoming shallower in depth as it moves off the structural high. Channels may
form traps for free gas due to their sandy bottoms (Noguchi et al., 2011). The high amplitude
reflections within this channel may indicate accumulations of gas, trapped by both
impermeable sediments within the turbidite units and gas hydrates at the BSR above. Highly
negative BSR amplitude values found above the channel are supportive of the interpretation
of accumulations of free gas within this channel.
5.4. Fault Interactions
Kumano forearc basin is cut by numerous normal faults as result of extension within
the basin. Faults in the basin are seen encompassing various depths, with several faults
extending into the underlying old accretionary prism. The normal faults appear to be more
concentrated toward the margin, causing significant offsets of horizons ranging up to ~30m.
Amplitudes of horizons appear to be affected by some of these normal faults, apparent by a
noticeable difference in amplitude strength of horizons on either side of the fault (Fig 16).
Often, the amplitude is stronger within permeable layers on the down thrown side of the
fault, suggestive of gas accumulation trapped by the fault due to the shearing of clay particles
and/or placing of impermeable layers on the other side of the fault (Fig. 4) . High amplitudes
are also found between faults, indicative of either fault formation during the migration of
fluids between the faults or in situ gas generation between these faults. BSR amplitudes are
also affected by some of these faults as they trap significant amounts of gas within a horizon
and significant gas concentrations are not able to migrate to the GHSZ or be trapped by the
BSR just below (Fig. 14).
Page 34
27
Since most of the gas recovered in coring was determined to be of microbial origin,
the gas must be generated throughout the basin and then migrate within the permeable layers.
Through observations in the relationships between changes in amplitude of horizons and
normal faults, relative timing between these two events can be determined. Spikes in ethane
and propane within the basin observed in the headspace gas profiles at site C0002, suggest
the influx of thermogenically formed gas from depth. Spikes in ethane and propane values
are also found at the top of Unit IV, where gas has accumulated as it was trapped by the
impermeable mudstone layer of Unit III. The deep cutting faults that cut through the basin
and underlying accretionary prism may provide a pathway for the expulsion of fluids from
the accretionary prism as it becomes overpressured due to increased sedimentation. The deep
seated faults allow the thermogenically generated gas to migrate up to permeable layers
within the basin, causing the spikes of ethane and propane within layers that are surrounded
predominately by microbial generated gas.
Page 35
28
CHAPTER 6: GAS HYDRATE AND FREE GAS CONCENTRATION ESTIMATES
AT THE WELLBORE FROM WELL LOGS
Downhole logging tools are valuable tools that record many in situ physical and
chemical properties of the subsurface allowing scientists to determine hydrocarbon content
within the strata. As resistivity logs are sensitive to the presence of hydrocarbons,
relationships with these logs may be used to determine the amount of gas hydrate present in
the pore space of sediments. Archie’s Law (Archie, 1942) has been widely used to determine
hydrocarbon saturation in rocks from resistivity logs (Riedel et al. 2011; Riedel et al., 2006;
Colwell et al., 2004; Collet and Lee, 2012; Shankar and Riedel, 2011). Such a relationship
was used in this study to estimate the saturation of gas hydrates and free gas at Hole C0002A.
The results provided a valuable correlation tool to understanding the roles that sand content
and porosity have on gas distribution.
6.1. Methods for determining gas hydrate and free gas saturations
The hydrocarbon saturation ( ) in the pore space may be estimated by using
Archie’s (1942) equation:
(
)
⁄
where is formation water saturation; is the resistivity of connate water; m, and
are constants representing tortuosity coefficient, cementation factor, and the saturation
Page 36
29
coefficient respectively; is the porosity; and is the measured log resistivity. Values for
and m were determined to be 1 and 2.4 respectively based on a best fit of the lower bound
of the density-derived porosity (Expedition 314 Scientists, 2009b). A value of 2 was assumed
for based on common values found in literature (Pearson et al., 1983; Collett and Lee,
2012). Density derived porosity was used for porosity in estimation of gas hydrates within
pore space as neutron porosity logs may overestimate the porosity in sediments due to high
hydrogen content.
We created a density derived porosity log using values of 1.024 g/cm3 and 2.65
g/cm3 for the densities of seawater and a sandstone matrix with the following relationship:
. With this, the remaining variable that needed to be
solved for Archie’s equation is and was found with the use of Arp’s equation:
where = (representing the connate water resistivity at formation temperature), is
the resistivity at the seafloor, is the temperature at the seafloor, and is the temperature
at depth. is taken from the ring resistivity log. has previously been found to be 2°C
(Expedition 314 Scientists, 2009b). is found for a given depth with the geothermal
gradient of 40°C/km as determined by (Expedition 315 Scientists, 2009). The ring resistivity
log is used for because it has a greater depth of investigation, providing a truer reading of
resistivity as the effects of drilling fluids in the borehole are smaller.
Page 37
30
6.2. Correlation of hydrocarbon saturation estimates with other log properties
We calculate hydrocarbon saturation along Hole C0002A from the seafloor to 1000
mbsf. As the BSR, representing the BGHSZ, is found ~400 mbsf, it is assumed that
hydrocarbon saturation values above the BSR are representative of gas hydrates and values
below are free gas. An overall increasing trend in the percentage of gas hydrate in the pore
space is found between 100 and 400 mbsf, reaching a peak of ~80% gas hydrate saturation
within the pore space (Fig. 16, 17). Larger spikes in gas hydrate concentrations correlate with
lower excursions in gamma ray values, indicating a larger presence of gas hydrate within
sandy layers.
Since the BSR is thought to be representative of the BGHSZ, gas hydrates will not
form below this horizon and all gas calculated can may assumed to be free gas rather than
gas hydrate. There is a drop in gas concentration found below the BSR, correlating with
lower porosity and higher gamma ray values, reflective of the impermeable mud facies found
below the BSR at the well site (Fig. 16). Zone B, sitting under this impermeable mud facies,
contains sandier intervals in the turbidite units as indicated by high variations in porosity and
gamma ray values. Large excursions in gas values are also found within Zone B, correlating
with the larger porosity values and lower sandy gamma ray values. However, due to
uncertainties in the validity of porosity values in this unit, gas saturation values may be
overestimated.
Beneath Zone B, gas saturation values drop again with the exception of a few smaller
intervals until the interface of Unit III and Unit IV (Fig. 16). At this interface, porosity values
are extremely high, gamma ray values are at their lowest, and gas saturation percentages are
Page 38
31
extremely high. The correlation of these at the location of this interface indicates the trapping
of gas within sandier intervals of Unit IV by the impermeable mud facies of Unit III.
Page 39
32
CHAPTER 7: USE OF BSR AMPLITUDE FOR EXTRAPOLATION OF GAS
CONTENT AWAY FROM THE WELLBORE
Mapping the distribution of the BSR amplitude may illuminate changes in gas
accumulation below the BSR as well as fluid migration pathways (Baba et al., 2004). This
ability may prove to be a valuable and cost effective tool in estimating concentrations of gas
hydrates and free gas on a large scale.
7.1. Amplitude of the BSR within the basin
The amplitude of the BSR was extracted using largest negative values within a
window of 6 meters, 3 meters above and below, for the picked horizon. An amplitude map of
the BSR displays variances in amplitude within the basin with the largest concentration of
high amplitudes found toward the outer arc high at the edge of the basin (Fig. 17). Upon
further observation, the amplitudes in the basin take on a banded pattern. Since the tilted
sedimentary bedding layers intersect the BSR in a similar pattern, this indicates that the
banded amplitudes reflect differences in gas hydrate and free gas concentrations in the
sedimentary beds with higher concentrations being found within the sandy layers of the
turbidites due to availability of a more permeable conduit than surrounding muddy layers.
Highest concentrations of high negative amplitudes are found towards the southwest corner
of the basin, focused within the structural high of the BSR, signifying preferential fluid flow
along the tilted horizons and accumulation beneath this structural high as it acts as a trap
(Fig. 17).
Page 40
33
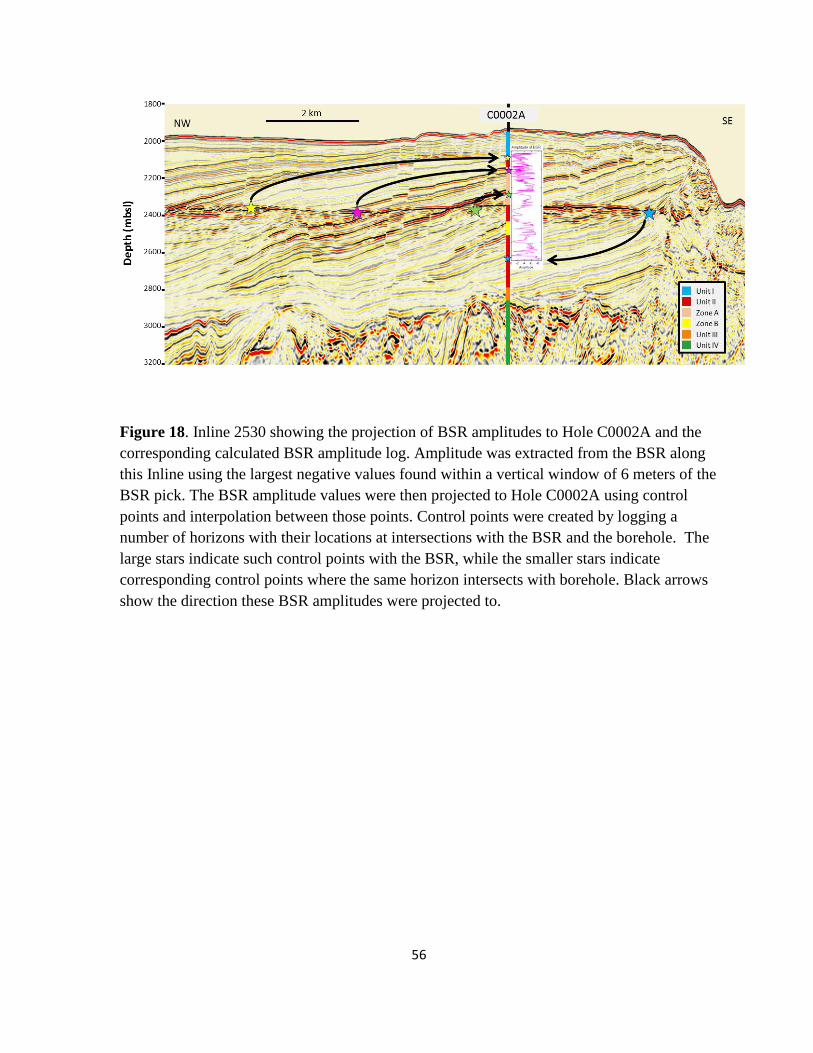
7.2. Projection methods of BSR amplitude to Hole C0002A
In order to better determine the relationship between gas hydrate saturation, free gas,
lithology, and BSR amplitude in this basin, the BSR amplitude was projected to depth along
Hole C0002A (Fig. 18) and compared to gamma ray values and gas concentrations (Fig. 19).
To project the BSR amplitude, the amplitude was extracted along IL2530, which falls closest
to where Hole C0002A was drilled. As the dipping layers, which intersect both the borehole
and the BSR, differ in thickness at these two positions, many control points were created in
order to preserve accuracies in the amplitudes. These control points were picked at both the
intersection of the BSR and wellbore for a number of horizons. BSR amplitudes that were
picked along one horizontal direction, along Inline 2530, were then projected to depth
direction at the wellbore with interpolation between each of the control points. Amplitude is
now displayed as another well log at Hole C0002A, where it can be compared to other well
logs. Errors in this method are due to ~10 m resolution in seismic data and inaccuracies in
picking control points due to interference of high amplitudes below the BSR and numerous
faults.
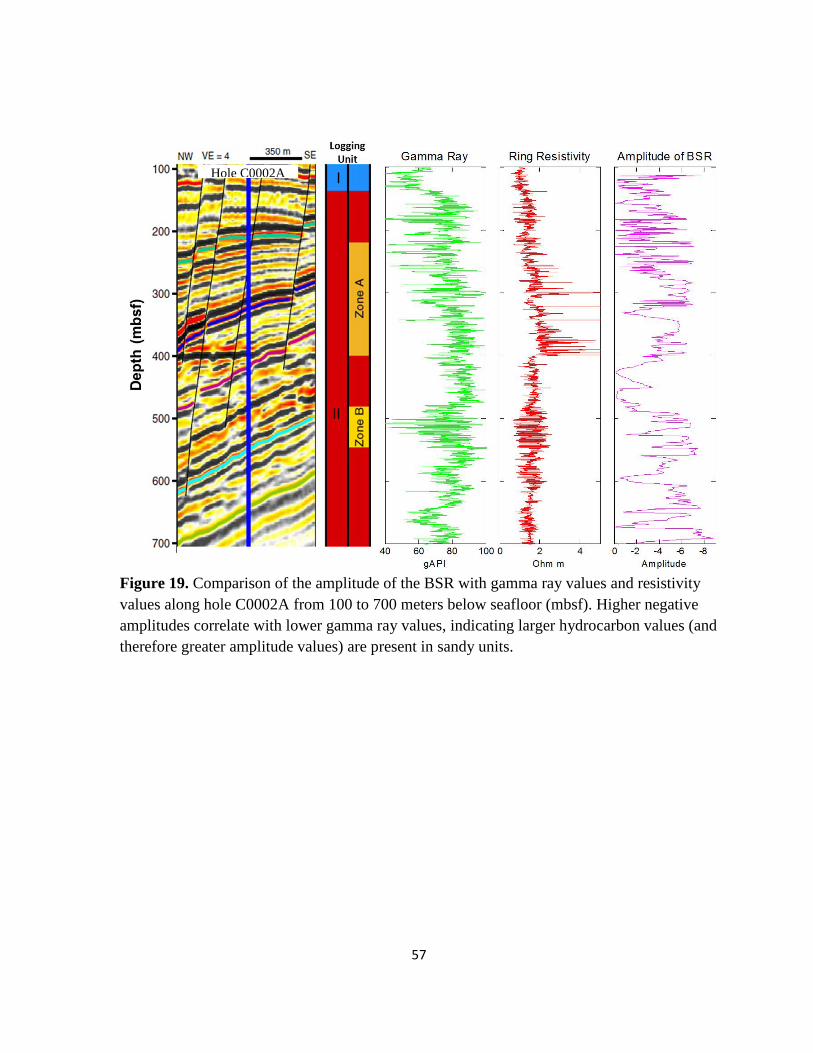
7.3. Interpretation and correlation of BSR amplitude at the wellbore
Correlation of the amplitude values of the BSR with gamma ray values relates the
effects of lithology on amplitude strength of the BSR. The amplitude of the BSR shows
differences in variation intensity along the log with a higher frequency of variation observed
at the top of the log and lower frequency towards the bottom (Fig. 19). These differences in
frequency of variation in amplitude may partly be explained by a higher frequency of
Page 41
34
horizons closer towards the seafloor due to the dipping with nature of these layers. There is a
gradual drop in frequency of horizons with depth along the wellbore; therefore, a drop in
frequency of variation within the BSR amplitude log is to be expected.
The BSR amplitude is variable towards the top of the log at 100 mbsf to ~250 mbsf.
Similar variability is seen in gamma ray values where (Fig. 19) lower gamma ray values
correlate with higher amplitudes spikes seen between these depths; indicating that strong
BSR amplitudes correspond with higher sand content due to larger gas hydrate
concentrations in sandy layers. Just below the BSR, higher gamma ray values correlate with
lower BSR amplitude values, indicating low hydrocarbon content within muddier facies.
Page 42
35
CHAPTER 8: CONCLUSIONS
Kumano forearc basin, off the coast of Japan, contains evidence for gas hydrate
saturated sediments forming at the basin margin, as determined from a gas hydrate related
BSR in the 3-D marine seismic reflection survey, large resistivity spikes and drops in P-wave
velocity in well logs, and interstitial water geochemistry trends from core data. Further, the
relative hydrocarbon saturation in sediments is controlled by lithology, with greater
concentrations of hydrocarbons founds within sandier intervals, indicating a grain size
control on the distribution of gas hydrates. After determining the relation between grain size
and gas hydrate and gas content at the wellbore, we extrapolated our findings to the rest of
the 3-D survey with the use of the BSR amplitude. An amplitude extraction of the BSR
shows a banded pattern in amplitude, following the intersections of horizons with the BSR,
suggesting a relationship between the properties in individual horizons and BSR amplitude
strength. The largest concentration of high amplitudes occurs within the structural high
formed by the BSR, suggesting a higher accumulation of hydrocarbons within the local high.
After determining the link of amplitude patterns seen in the BSR amplitude map and
intersecting horizons, we projected the BSR amplitude strength to the wellbore to correlate
this with well logs to determine what is controlling the amplitude of the BSR. We were able
to correlate the BSR amplitude with gamma ray values, indicating a relationship between
lithology and BSR amplitude. We determined that the BSR amplitude was strongest when it
intersected sandy intervals, those which have the highest hydrocarbon saturations. The BSR
amplitude grew weak when intersecting low permeability muddy intervals with low
hydrocarbon saturation. The presence of gas within sandy intervals in Zone B; suggested by
the geochemistry from core data, low excursions in gamma ray values, a drop in P-wave
Page 43
36
velocity, increased magnitude in variation in density logs, increased gas concentrations from
resistivity logs, the presence of a negative polarity reflector that changes polarity across the
BSR interface, and differences in amplitudes across faults; corresponded to high amplitudes
at the BSR. In contrast, impermeable mud dominated facies such as one that overlies Zone B,
suggested by lithology determination in core data, low amplitude reflections, higher gamma
ray values, lower resistivity, decreased porosity, and low gas saturation values; corresponded
to low amplitudes at the BSR.
With supportive evidence of effects hydrocarbon saturation within sandier intervals
on BSR amplitude values, the BSR amplitudes map is used to determine the location of
accumulations of free gas and gas hydrate elsewhere in the 3-D seismic dataset. Higher gas
saturation is determined to lie towards the seaward portion of the basin, towards the outer arc
high. Further, localized high amplitudes within the isolated local high suggest the high
contains a larger accumulation of gas hydrate and free gas, with the structural high of the
BSR providing a trapping mechanism for the free gas. This gas is determined to have
migrated up-dip through permeable sandy horizons such as Zone B, where it accumulated to
even greater concentrations than observed away from local high.
The presence of large concentrations of free gas and gas hydrates within this
structural high has several implications. As far as a production standpoint, in the wake of
news in March 2013 that gas has successfully been produced from marine gas hydrates, the
top of this local high may be an ideal place to drill and extract gas from both the gas hydrates
and trapped free gas in the near future. There are also implications about damage to human
structures in the vicinity of this isolate high. If gas hydrate dissociates within this high, the
resulting effect on seafloor stability could trigger submarine landslides. Such a submarine
Page 44
37
landslide could cause damage to any substrate on the seafloor as well as to drilling structures
that IODP continues to use to drill nearby as part of an ongoing research project.
Page 45
38
Figures
Figure 1.
(A) Location map showing key features including the surveyed region, indicated by the solid
red box, in relation to islands of Japan.
(B) Regional map showing displaying the 3D seismic survey (black line), boreholes (dots),
major earthquakes (starred), and previous interpretations (Seno et al., 1993; Heki, 2007) of
the direction of plate subduction of the Philippine Sea Plate (yellow arrows).
A
B
Page 46
39
Figure 2. Inline 2530. Seismic profile shows the Kumano Basin (Yellows and Oranges)
sitting on top of Nankai Accretionary Prism. The notch and outer arc high form the seaward
boundary of the basin. The BSR, identified with black arrows, crosscuts through the dipping
strata within the basin. Vertical Exaggeration =300%
Page 47
40
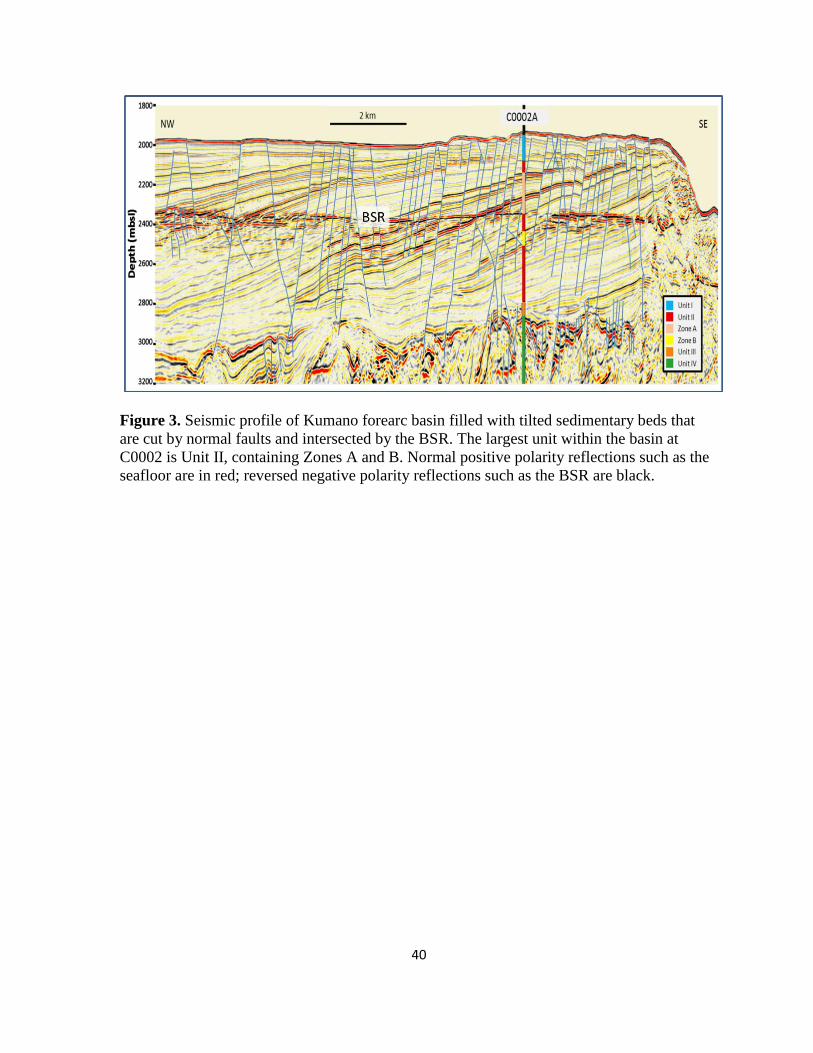
Figure 3. Seismic profile of Kumano forearc basin filled with tilted sedimentary beds that
are cut by normal faults and intersected by the BSR. The largest unit within the basin at
C0002 is Unit II, containing Zones A and B. Normal positive polarity reflections such as the
seafloor are in red; reversed negative polarity reflections such as the BSR are black.
Page 48
41
Figure 4. Schematic drawing demonstrating the migration of free gas, formation of gas
hydrates and the BSR, and trapping mechanisms for the free gas.
Page 49
42
Figure 5. Figure from Moore et al., 2013. Seismic section at the location of site C0002 with
the location of holes drilled and data recovered. Units and subunits drilled are marked and
show that the majority of the basin itself consists of Unit II. Medium resistivity at the bit
(RAB) image provides a 360° look at the resistive and conductive layers along the borehole.
Gamma ray, resistivity, and P-wave velocity logs demonstrate the differences in the units as
well as Zones A and B within Unit II.
Page 50
43
-
Figure 6. From Expedition 314 Scientists, 2009b. Summary of well logs recorded from hole
C0002A. LSF= LWD depth below the seafloor. High resistivity spikes in Zone A indicate the
presence of gas hydrates. At the BGHSZ, indicated by the BSR, resistivity values and sonic
velocity values drop confirming that there are no gas hydrates below the BSR. Zone B
contains lower gamma ray values, slightly lower velocity, and larger scatter in density
suggestive of sandier turbidite intervals.
Page 51
44
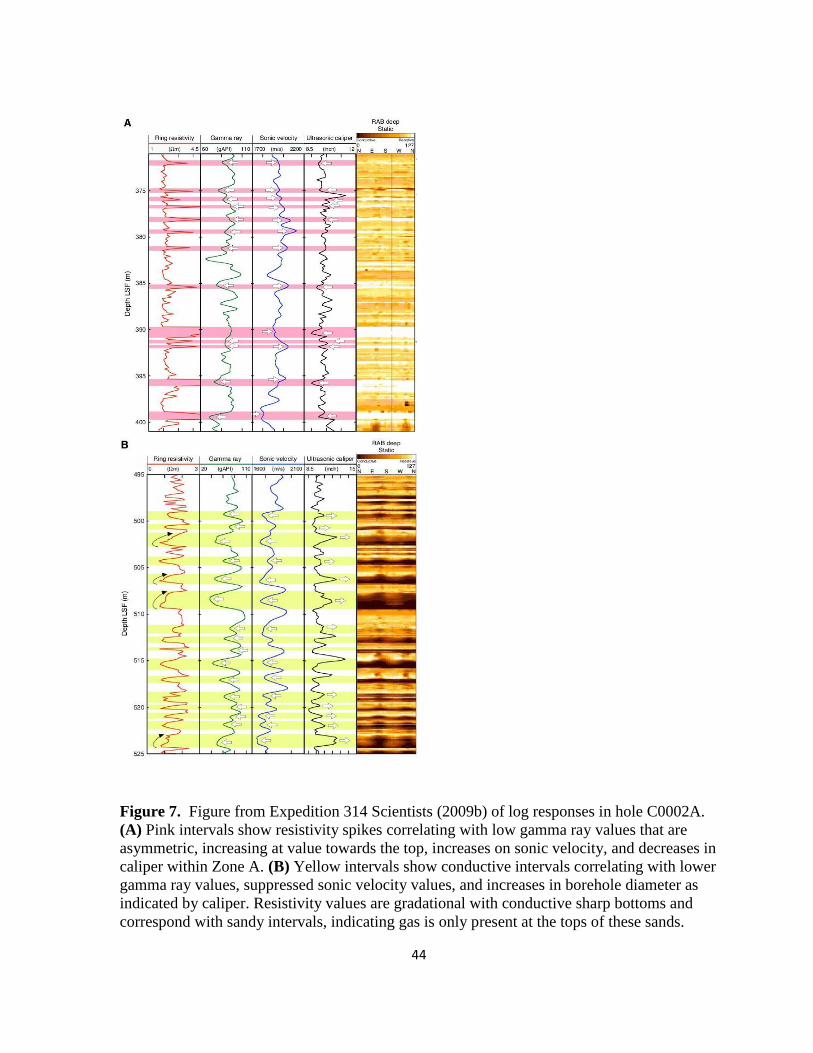
Figure 7. Figure from Expedition 314 Scientists (2009b) of log responses in hole C0002A.
(A) Pink intervals show resistivity spikes correlating with low gamma ray values that are
asymmetric, increasing at value towards the top, increases on sonic velocity, and decreases in
caliper within Zone A. (B) Yellow intervals show conductive intervals correlating with lower
gamma ray values, suppressed sonic velocity values, and increases in borehole diameter as
indicated by caliper. Resistivity values are gradational with conductive sharp bottoms and
correspond with sandy intervals, indicating gas is only present at the tops of these sands.
Page 52
45
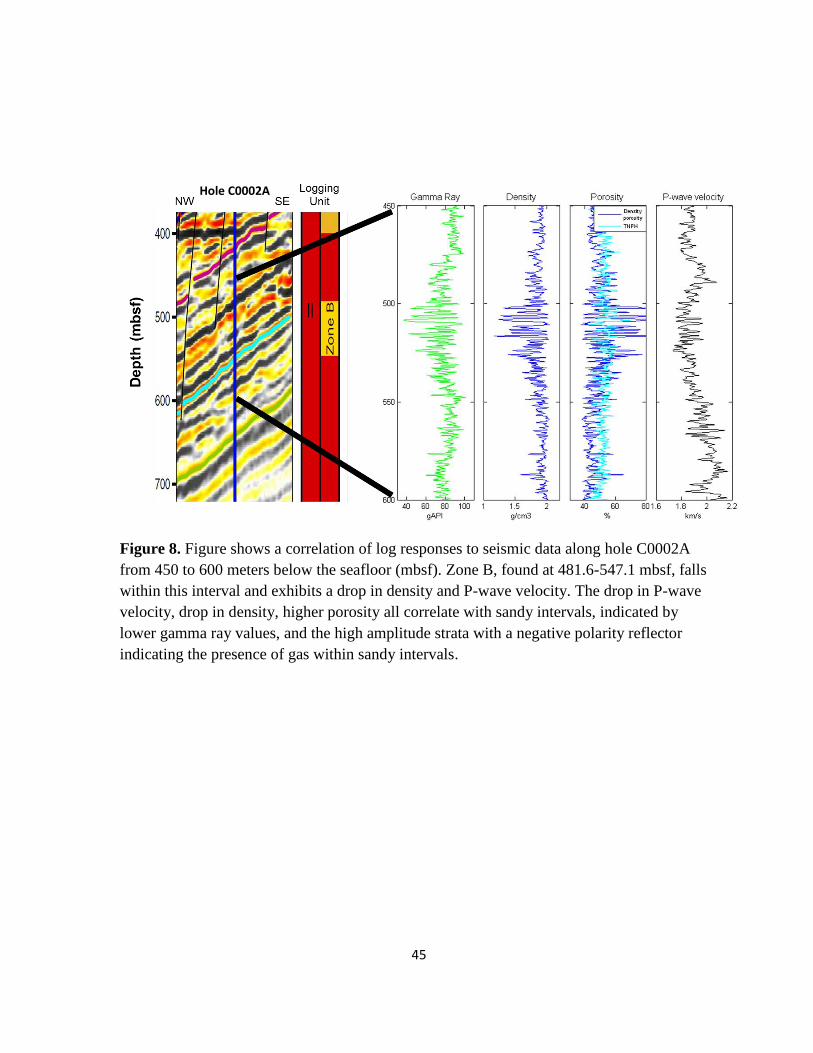
Figure 8. Figure shows a correlation of log responses to seismic data along hole C0002A
from 450 to 600 meters below the seafloor (mbsf). Zone B, found at 481.6-547.1 mbsf, falls
within this interval and exhibits a drop in density and P-wave velocity. The drop in P-wave
velocity, drop in density, higher porosity all correlate with sandy intervals, indicated by
lower gamma ray values, and the high amplitude strata with a negative polarity reflector
indicating the presence of gas within sandy intervals.
Hole C0002A
Page 53
46
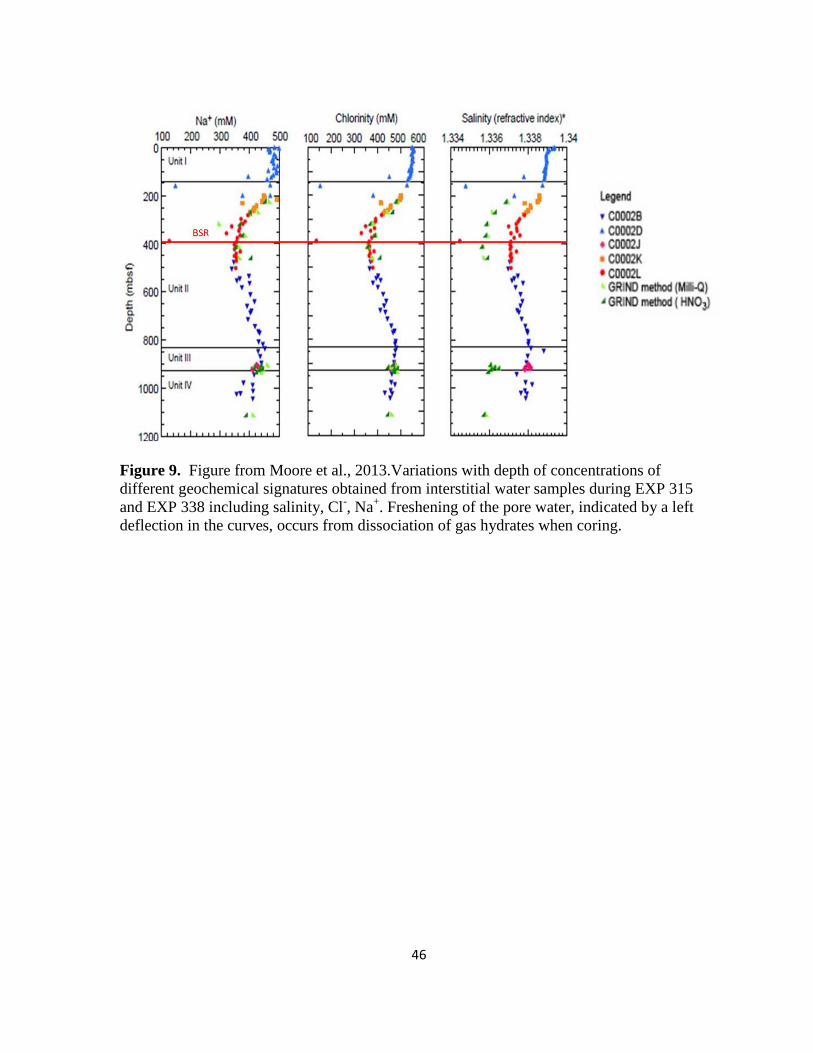
Figure 9. Figure from Moore et al., 2013.Variations with depth of concentrations of
different geochemical signatures obtained from interstitial water samples during EXP 315
and EXP 338 including salinity, Cl-, Na
+. Freshening of the pore water, indicated by a left
deflection in the curves, occurs from dissociation of gas hydrates when coring.
Page 54
47
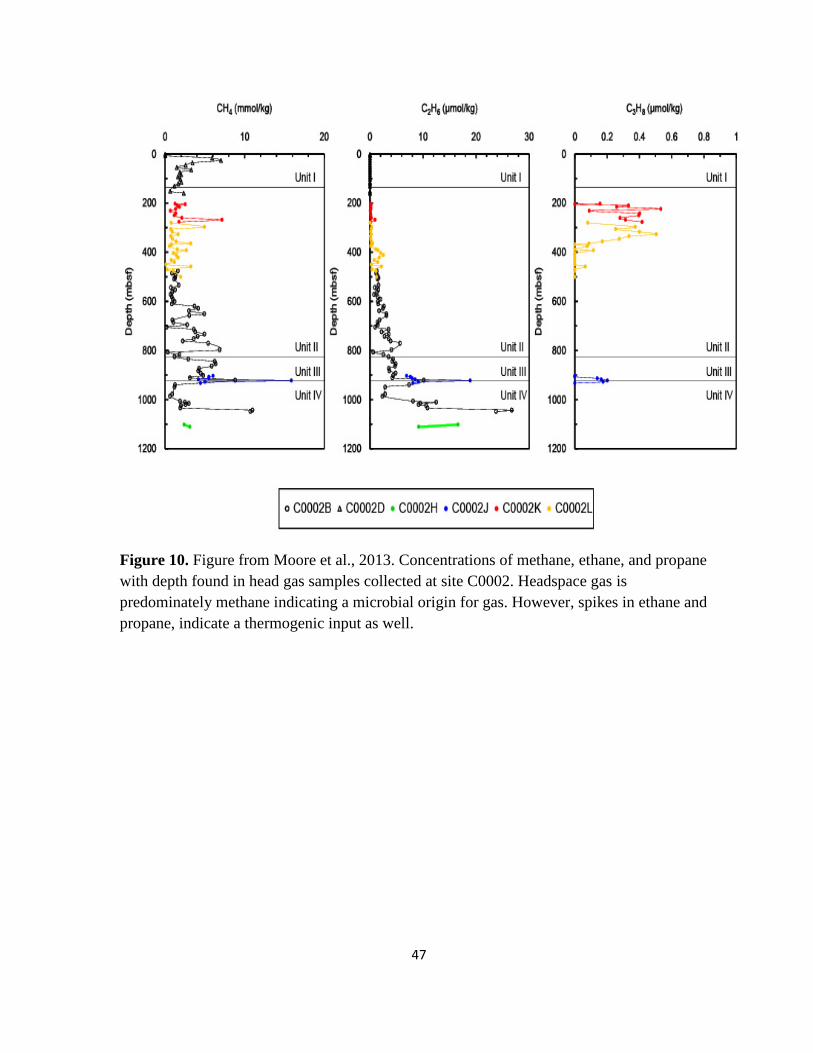
Figure 10. Figure from Moore et al., 2013. Concentrations of methane, ethane, and propane
with depth found in head gas samples collected at site C0002. Headspace gas is
predominately methane indicating a microbial origin for gas. However, spikes in ethane and
propane, indicate a thermogenic input as well.
Page 56
49
C
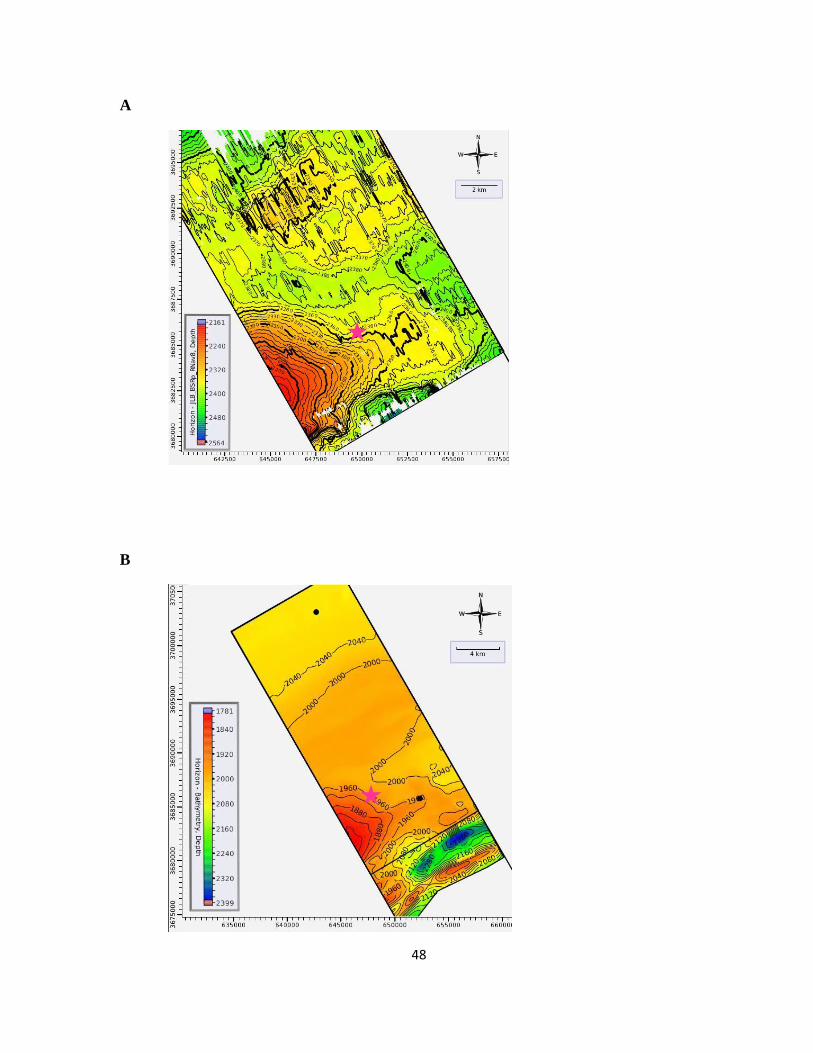
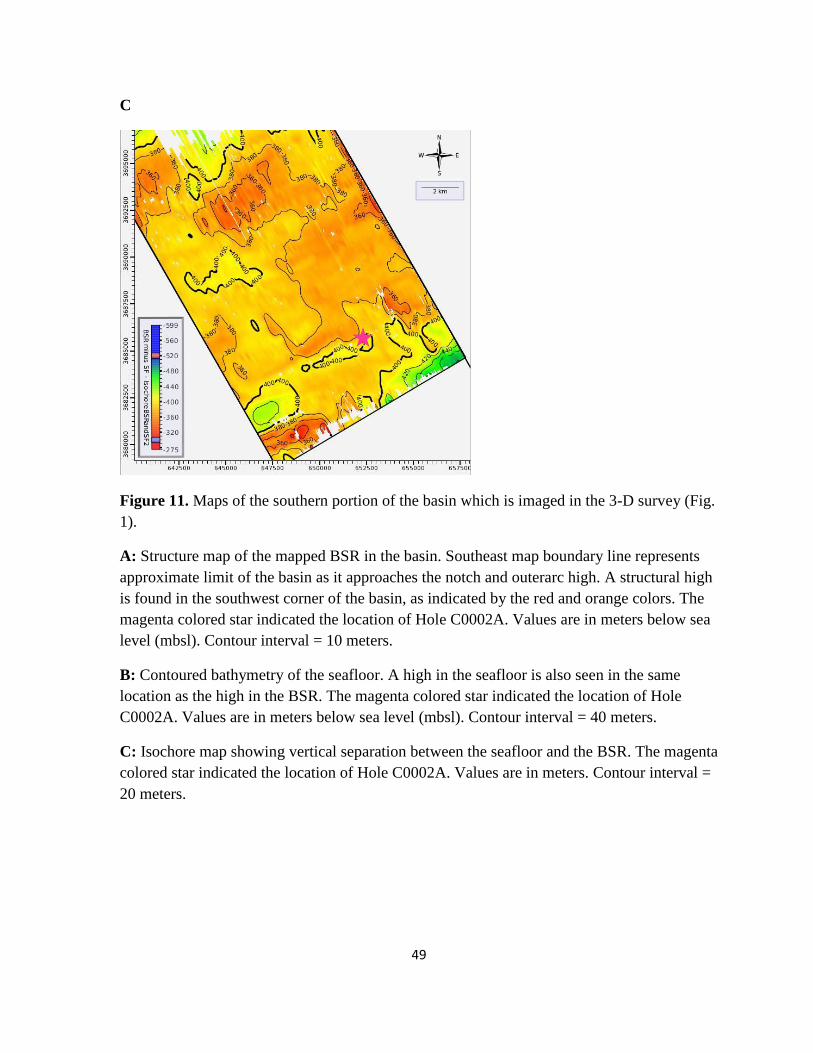
Figure 11. Maps of the southern portion of the basin which is imaged in the 3-D survey (Fig.
1).
A: Structure map of the mapped BSR in the basin. Southeast map boundary line represents
approximate limit of the basin as it approaches the notch and outerarc high. A structural high
is found in the southwest corner of the basin, as indicated by the red and orange colors. The
magenta colored star indicated the location of Hole C0002A. Values are in meters below sea
level (mbsl). Contour interval = 10 meters.
B: Contoured bathymetry of the seafloor. A high in the seafloor is also seen in the same
location as the high in the BSR. The magenta colored star indicated the location of Hole
C0002A. Values are in meters below sea level (mbsl). Contour interval = 40 meters.
C: Isochore map showing vertical separation between the seafloor and the BSR. The magenta
colored star indicated the location of Hole C0002A. Values are in meters. Contour interval =
20 meters.
Page 57
50
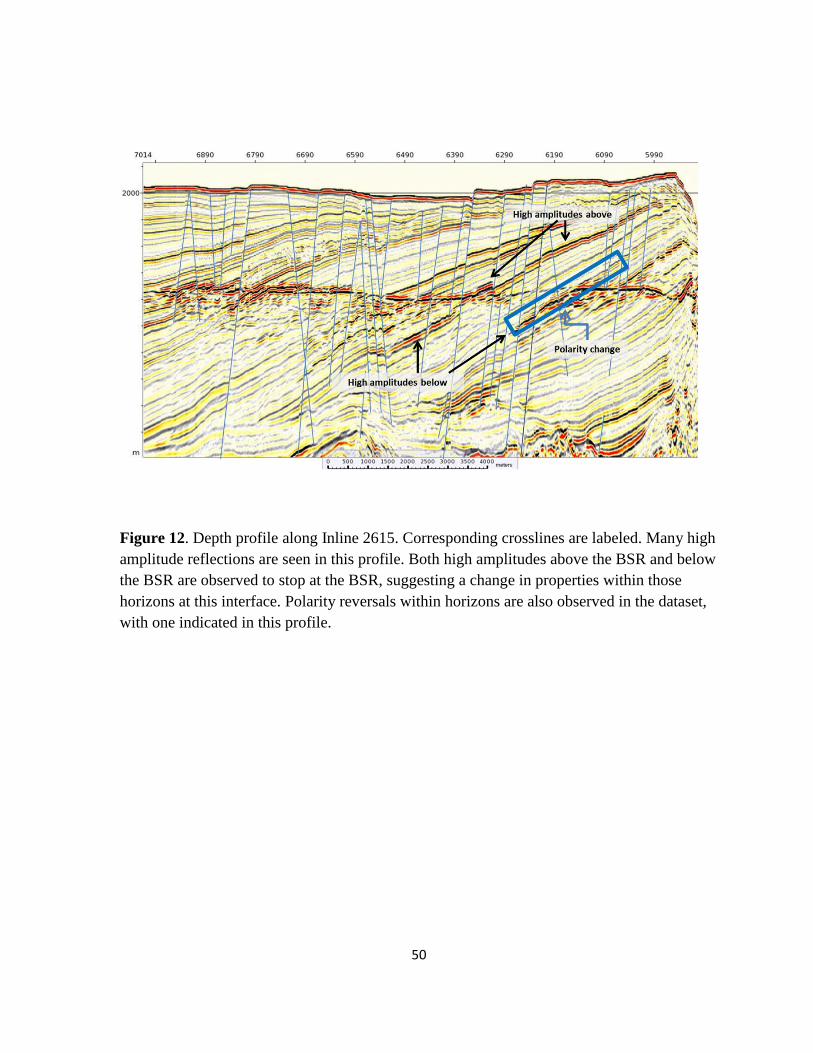
Figure 12. Depth profile along Inline 2615. Corresponding crosslines are labeled. Many high
amplitude reflections are seen in this profile. Both high amplitudes above the BSR and below
the BSR are observed to stop at the BSR, suggesting a change in properties within those
horizons at this interface. Polarity reversals within horizons are also observed in the dataset,
with one indicated in this profile.
Page 58
51
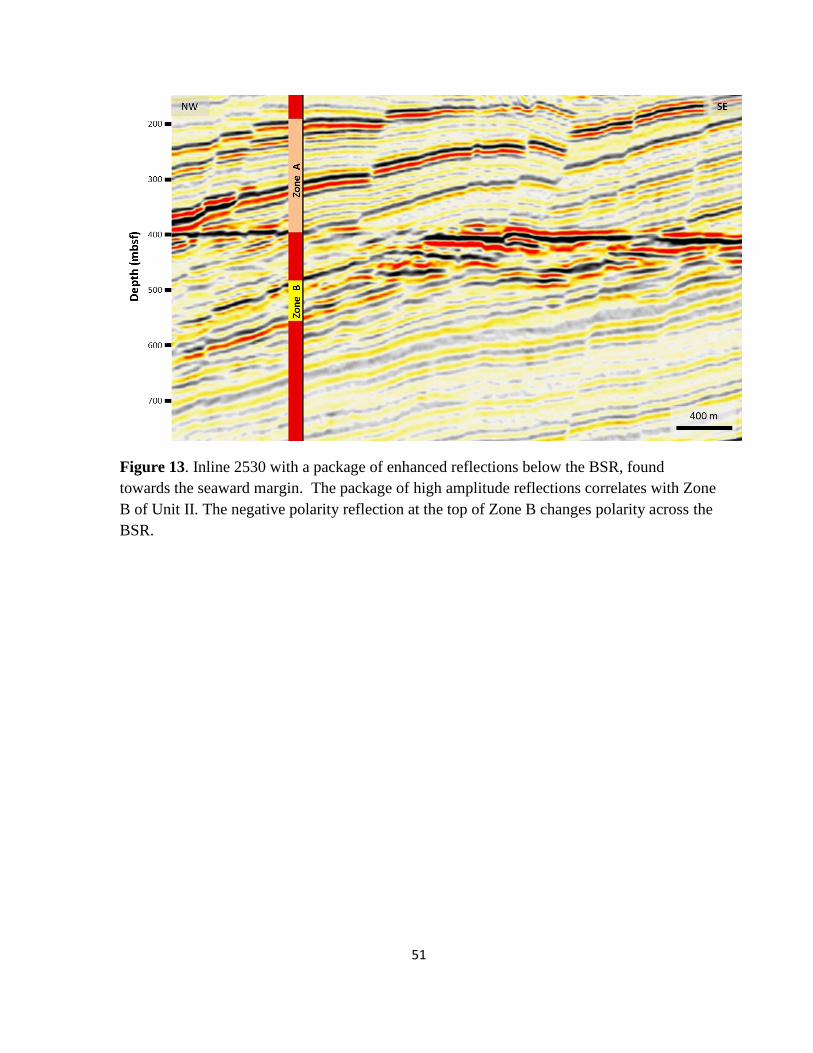
Figure 13. Inline 2530 with a package of enhanced reflections below the BSR, found
towards the seaward margin. The package of high amplitude reflections correlates with Zone
B of Unit II. The negative polarity reflection at the top of Zone B changes polarity across the
BSR.
Page 59
52
Figure 14. Seismic inline showing interaction between faults, package of chaotic high
amplitude reflectors, a channel, and the BSR. The channel is indicated by the green curve and
displays high amplitudes between the bottom of the channel and the BSR. Red arrows
indicate changes in the amplitude of a stratigraphic horizon across the fault. Purple arrows
indicate locations where faults affect the amplitude of the BSR directly.
Page 60
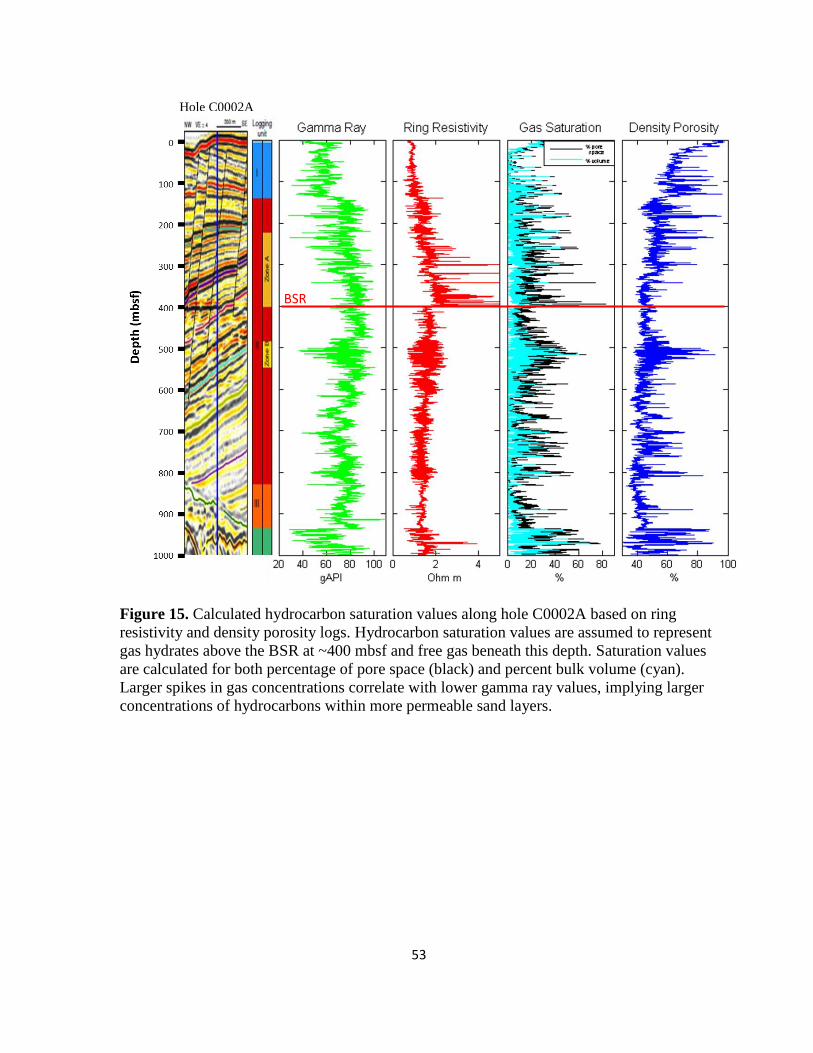
53
Figure 15. Calculated hydrocarbon saturation values along hole C0002A based on ring
resistivity and density porosity logs. Hydrocarbon saturation values are assumed to represent
gas hydrates above the BSR at ~400 mbsf and free gas beneath this depth. Saturation values
are calculated for both percentage of pore space (black) and percent bulk volume (cyan).
Larger spikes in gas concentrations correlate with lower gamma ray values, implying larger
concentrations of hydrocarbons within more permeable sand layers.
Hole C0002A
BSR
Page 61
54
Figure 16. Comparison of gamma ray values, resistivity, and gas hydrate concentration from
the seafloor to 420 meters below the seafloor (mbsf) along hole C0002A. The BSR is seen at
~400 mbsf and corresponds to drops in resistivity and gas hydrate concentration. Large
spikes in resistivity correlate with spikes in gas hydrate concentration as well as low gamma
ray values. indicating larger concentration of gas hydrate within sandy layers. Resistivity
spikes correlate with similar excursions in gas hydrates in pore space, whereas smaller spikes
are seen in percent volume.
Hole C0002A
BSR
Page 62
55
Figure 17. BSR amplitude map in southern portion of basin within the 3-D survey (Fig. 1)
created by extracting the largest negative value of the BSR within a 6 meter window of the
picks with 3 m above the pick and 3 meters below. The highest amplitudes are shown in red
whereas the lowest amplitudes are shown in blue. Contours on this map are the structure
contours of the BSR. The BSR appears banded, suggestive of different concentrations of gas
between the intersecting sedimentary layers. High amplitudes in the BSR are most
concentrated at the edge of the basin, particularly within the structural high. The magenta
colored star indicates the location of Hole C0002A.
Hole C0002A
Page 63
56
Figure 18. Inline 2530 showing the projection of BSR amplitudes to Hole C0002A and the
corresponding calculated BSR amplitude log. Amplitude was extracted from the BSR along
this Inline using the largest negative values found within a vertical window of 6 meters of the
BSR pick. The BSR amplitude values were then projected to Hole C0002A using control
points and interpolation between those points. Control points were created by logging a
number of horizons with their locations at intersections with the BSR and the borehole. The
large stars indicate such control points with the BSR, while the smaller stars indicate
corresponding control points where the same horizon intersects with borehole. Black arrows
show the direction these BSR amplitudes were projected to.
Page 64
57
Figure 19. Comparison of the amplitude of the BSR with gamma ray values and resistivity
values along hole C0002A from 100 to 700 meters below seafloor (mbsf). Higher negative
amplitudes correlate with lower gamma ray values, indicating larger hydrocarbon values (and
therefore greater amplitude values) are present in sandy units.
Hole C0002A
Page 65
58
REFERENCES
Andreassen, K., Hart, P.E., MacKay, M., 1997. Amplitude versus offset modeling of the
bottom simulating reflection associated with submarine gas hydrates. Marine
Geology 137, 25-30.
Archie, G.E., 1942. The electrical resistivity log as an aid in determining some reservoir
characteristics. J. Petrol. Technol. 5, 1 –8.
Archie, G.E., 1947. Electrical resistivity—an aid in core analysis interpretation. AAPG Bull.,
31, 350–366.
Ashi, J., Lallemant, S., Masago, H., and the Expedition 315 Scientists, 2009. Expedition 315
summary. In Kinoshita, M., Tobin, H., Ashi, J., Kimura, G., Lallemant, S., Screaton,
E.J., Curewitz, D., Masago, H., Moe, K.T., and the Expedition 314/315/316
Scientists, Proc. IODP, 314/315/316: Washington, DC (Integrated Ocean Drilling
Program Management International, Inc.).
doi:10.2204/iodp.proc.314315316.121.2009
Ashi, J., Tokuyama, H., Taira, A., 2002. Distribution of methane hydrate BSRs and its implication
for the prism growth in the Nankai Trough, Marine Geology, 187, 177-191.
Baba, K., Yamada, Y., 2004. BSR's and associated reflections as an indicator of gas hydrate and
free gas accumulation: an example of accretionary prism and forearc basin system along
the Nankai Trough, off central Japan. Resource Geology 54 (1) 11–24.
Bahk,J.-J., Uma, I.-K., Holland, M., 2011. Core lithologies and their constraints on gas-hydrate
occurrence in the East Sea, offshore Korea: Results from the site UBGH1-9, Marine and
Page 66
59
Petroleum Geology 28, 1943-1952.
Bangs, N.L., Hornbach, M.J., Moore, G.F., Park, J.O., 2010. Massive methane release triggered by
seafloor erosion offshore southwestern Japan. Geology 38(11) 1019-1022.
Bangs, N.L., Musgrave, R.J., Tre´hu, A.M., 2005. Upward shifts in the southern Hydrate Ridge gas
hydrate stability zone following postglacial warming, offshore Oregon, Journal of
Geophysical Research 110, B03102, doi:10.1029/2004JB003293
Berndt, C., Bunz, S., Clayton, T., Mienert, J., Saunders, M., 2004. Seismic character of bottom-
simulating-reflectors: examples from the mid Norwegian margin. Marine and Petroleum
Geology 21 (6), 723–733.
Brown, H.E., Holbrook, W.S., Hornbach, M.J., Nealon, J., 2006. Slide structure and role of gas
hydrate at the northern boundary of the Storegga Slide, offshore Norway. Marine Geology
229, 179-186.
Collett, T.S. and Lee, M.W., 2012. Well Log Characterization of Natural Gas-Hydrates.
Petrophysics 53(5), 348-367.
Collett, T.S., Johnson, A.H., Knapp, C.C., Boswell, R., 2009. Extended abstract - Natural gas
hydrates: A review, in Collett, T.S., Johnson, A., Knapp, C., Boswell, R., eds., Natural gas
hydrates-Energy resource potential and associated geologic hazards: AAPG Memoir 89, p.
1-4.
Collett, T.S. and Lee, M.W., 2012. Well Log Characterization of Natural Gas-Hydrates.
Petrophysics 54 (5), 348-367.
Colwell, F., Matsumoto, R., Reed, D., 2004. A review of the gas hydrates, geology, and biology of
Page 67
60
Nankai Trough. Chemical Geology 205, 391-404.
DeMets, C., Gordon, R. G., Argus, D. F., 2010. Geologically current plate motions. Geophysical
Journal International, 181(1), 1-80. doi:10.1111/j.1365-246X.2009.04491.x
Doan, M.-L., Conin, M., Henry, P., Wiersberg, T., Boutt, D., Buchs, D., Saffer, D., McNeill, L.C.,
Cukur, D. Lin, W., 2011. Quantification of free gas in the Kumano fore‐arc basin detected
from borehole physical properties: IODP NanTroSEIZE drilling Site C0009,
Geochemistry, Geophysics, Geosystems, 12, Q0AD06, doi:10.1029/2010GC003284.
Domenico, S.N., 1976. Effects of brine-gas mixture on velocity in an unconsolidated sand
reservoir. Geophysics, 42, 882-895.
Expedition 314 Scientists, 2009a. Expedition 314 Methods. In Kinoshita, M., Tobin, H., Ashi, J.,
Kimua, G., Lallemant, S., Screaton, E.J., Curewitz, D., Masago, H., Moe, K.T., and the
Expedition 314/315/316 Scientists, Proceedings of the Integrated Ocean Drilling
Program, 314/315/316: Washington, D.C., Integrated Ocean Drilling Program
Management International, Inc., doi: 10.2204/iodp.proc.314315316.111.2009.
Expedition 314 Scientists, 2009b. Expedition 314 Site C0002. In Kinoshita, M., Tobin, H., Ashi,
J., Kimua, G., Lallemant, S., Screaton, E.J., Curewitz, D., Masago, H., Moe, K.T., and the
Expedition 314/315/316 Scientists, Proceedings of the Integrated Ocean Drilling
Program, 314/315/316: Washington, D.C., Integrated Ocean Drilling Program
Management International, Inc., doi: 10.2204/iodp.proc.314315316.111.2009.
Expedition 315 Scientists, 2009. Expedition 315 Site C0002. In Kinoshita, M., Tobin, H., Ashi, J.,
Kimura, G., Lallemant, S., Screaton, E.J., Curewitz, D., Masago, H., Moe, K.T., and the
Expedition 314/315/316 Scientists, Proc. IODP, 314/315/316: Washington, DC
Page 68
61
(Integrated Ocean Drilling Program Management International, Inc.).
doi:10.2204/iodp.proc.314315316.124.2009
Expedition 319 Scientists, 2010. Expedition 319 summary. In Saffer, D., McNeill, L., Byrne, T.,
Araki, E., Toczko, S., Eguchi, N., Takahashi, K., and the Expedition 319 Scientists, Proc.
IODP, 319: Tokyo (Integrated Ocean Drilling Program Management International, Inc.).
doi:10.2204/iodp.proc.319.101.2010
Foucher, J.-P., H. Nouze´, and P. Henry (2002), Observation and tentative interpretation of a
double BSR on the Nankai slope, Marine Geology, 187, 161–175.
Golmshtok, A.Y., Soloviev, V.A., 2006. Some remarks on the thermal nature of the double BSR.
Marine Geology 229, 187-198.
Gulick, S.P.S., Bangs, N.L.B., Moore, G.F., Ashi, J., Martin, K.M., Sawyer, D.S., Tobin, H.J.,
Kuramoto, S., and Taira, A., 2010, Rapid forearc basin uplift and megasplay fault
development from 3D seismic images of Nankai Margin off Kii Peninsula, Japan: Earth
Planet. Sci. Lett., v. 300, p. 55-62, doi:10.1016/j.epsl.2010.09.034.
Heki, K., 2007. Secular, transient, and seasonal crustal movements in Japan from a dense GPS
array: implication for plate dynamics in convergent boundaries. In Dixon, T.H., and Moore,
J.C. (Eds.), The Seismogenic Zone of Subduction Thrust Faults: New York (Columbia
Univ. Press), 512–539.
Hustoft, S., Mienert, J., Bünz, S., Nouzé, H., 2007. Highresolution 3D- seismic data indicate
focussed £uid migration pathways above polygonal fault systems of the Mid-Norwegian
Margin. Marine Geology, 245, 89-106.
Page 69
62
Hutchinson, D., Shelander, D., Latham, T., McConnell, D., Ruppel, C., Jones, E., Shedd, B., Hunt,
J., Frye, M., Boswell, R., Rose, K., Dugan, B., Wood, W., 2008. Site selection for
DOE/JIP drilling in the northern Gulf of Mexico: Proceedings of the 6th
International
Conference on Gas Hydrates (ICGH 2008), Vancouver, British Columbia, Canada.
Japan Oil, Gas and Metals National Corporation (2013). Gas Production from Methane Hydrate
Layers Confirmed [Press release]. Retrieved from
http://www.jogmec.go.jp/english/information/news_release/docs/2012/newsrelease_13031
2.pdf
Kvenvolden, K.A., 1993. Gas hydrates— geological perspective and global chance: Rev.
Geophys. 31 (2), 173–187, doi:10.1029/93RG00268.
Lu, H., Kawasaki, T., Ukita, T., Moudrakovski, I., Fujii, T., Noguchi, S., Shimada, T.,
Nakamizu, M., Ripmeester, J., Ratcliffe, C., 2011. Particle size effect on the
saturation of methane hydrate in sediments - Constrained from experimental results,
Marine and Petroleum Geology 28, 1801-1805.
Martin, V., Henry, P., Nouze´, H., Noble, M., Ashi, J., Pascal, G., 2004. Erosion and
sedimentation as processes controlling the BSR-derived heat flow on the Eastern
Nankai margin. Earth and Planetary Science Letters 222, 131– 144.
Moore, G., Kanagawa, K., Strasser, M., Dugan, B., Maeda, L., Toczko, S., and the
Expedition 338 Scientists, 2013. NanTroSEIZE Stage 3: NanTroSEIZE plate
boundary deep riser 2. IODP Prel. Rept., 338. doi:10.2204/iodp.pr.338.2013
Page 70
63
Moore, G.F., Bangs, N.L., Taira, A., Kuramoto, S., Pangborn, E., and Tobin, H.J., 2007.
Three-dimensional splay fault geometry and implications for tsunami generation.
Science, 318(5853):1128–1131. doi:10.1126/science.1147195
Moore, G.F., Park, J.-O., Bangs, N.L., Gulick, S.P., Tobin, H.J., Nakamura, Y., Saito, S.,
Tsuji, T., Yoro, T., Tanaka, H., Uraki, S., Kido, Y., Sanada, Y., Kuramoto, S., and
Taira, A., 2009, Structural and seismic stratigraphic framework of the NanTroSEIZE
Stage 1 transect. In Kinoshita, M., Tobin, H., Ashi, J., Kimura, G., Lallemant, S.,
Screaton, E.J., Curewitz, D., Masago, H., Moe, K.T., and the Expedition
314/315/316 Scientists, Proc. IODP, 314-315-316: College Station, TX (Integrated
Ocean Drilling Program Management International, Inc.).
doi:10.2204/iodp.proc.314315316.102.2009
Nakanishi, A., Takahashi, N., Park, J.-O., Miura, S., Kodaira, S., Kaneda, Y., Hirata, N.,
Iwasaki, T., and Nakamura, M., 2002. Crustal structure across the coseismic rupture
zone of the 1944 Tonankai earthquake, the central Nankai Trough seismogenic zone.
J. Geophys. Res., 107(B1):2007. doi:10.1029/2001JB000424
Noguchi, S., Shimoda, N., Takano, O., Oikawa, N., Inamori, T., Saeki, T., Fujii, T., 2011. 3-
D internal architecture of methane hydrate-bearing turbidite channels in the eastern
Nankai Trogh, Japan. Marine and Petroleum Geology 28, 1817-1828.
Obara, K., Hirose, H., Yamamizu, F., and Kasahara, K., 2004. Episodic slow slip events
accompanied by nonvolcanic tremors in southwest Japan subduction zone. Geophys.
Res. Lett., 31:L23602. doi:10.1029/2004GL020848
Page 71
64
Park, J.-O., Tsuru, T., Kodaira, S., Cummins, P.R., Kaneda, Y., 2002. Splay fault branching
along the Nankai subduction zone. Science, 297(5584):1157–1160.
doi:10.1126/science.1074111
Park, K.P., Bahk, J.J., Kwon, Y., Kim, G.Y., Riedel, M., Holland, M., Schultheiss, P., Rose,
K., Spring 2008. UBGH-1 Scientific Party, 2008. Korean national program
expedition confirms rich gas hydrate deposits in the Ulleung Basin, East Sea, U.S.
Department of Energy, Office of Fossil Energy, National Energy Technology
Laboratory. Methane Hydrate Newsletter, 6-9.
Paull, C.K., Ussler, W., Borowski, W.S., 1994. Sources of biogenic methane to form marine
gas hydrates: in-situ production or upward migration. In: Sloan, E.D. (Ed.),
International Conference on Natural Gas Hydrates. Annals of the New York
Academy of Sciences, vol. 715, pp. 392–409.
Pearson, C.F., Halleck, P.M., McGuire, P.L., Hermes, R., and Mathews, M., 1983. Natural
Gas Hydrate Deposit: A Review of in-situ Properties. Journal of Physical Chemistry
87 (4) 180-185.
Rider, M., 2002. The Geological Interpretation of Well Logs. 2nd
edition, Whittles Publishing
1999.
Riedel, M., Collet, T.S., Shankar, U., 2011. Documenting channel features associated with
gas hydrates in the Krishna-Godavari Basin, offshore India. Marine Geology 279, 1-
11.
Riedel, M., Long, P.E., Collett, T.S., 2006. Estimates of in situ gas hydrate concentration
from resistivity monitoring of gas hydrate bearing sediments during temperature
Page 72
65
equilibration. Marine Geology 227(3-4), 215-225,
doi:10.1016/j.margeo.2005.10.007.
Saffer, D., McNeill, L., Araki, E., Byrne, T., Eguchi, N., Toczko, S., Takahashi, K., and the
Expedition 319 Scientists, 2009. NanTroSEIZE Stage 2: NanTroSEIZE riser/riserless
observatory. IODP Prel. Rept., 319. doi:10.2204/iodp.pr.319.2009
Seno, T., Stein, S., and Gripp, A.E., 1993. A model for the motion of the Philippine Sea Plate
consistent with NUVEL-1 and geological data. J. Geophys. Res., 98(B10), 17941–
17948. doi:10.1029/93JB00782
Shankar, U., Riedel, M., 2010. Seismic and heat flow constraints from the gas hydrate system
in the Krishna-Godavari Basin, India. Marine Geology 276, 1-13.
Shankar, U., Riedel, M., 2011. Gas hydrate saturation in the Krishna-Godavari basin from P-
wave velocity and electrical resistivity logs. Marine and Petroleum Geology 28,
1768-1778.
Shipboard Scientific Party, 1996. Leg 164 introduction. In Paull, C.K., Matsumoto, R.,
Wallace, P.J., et al., Proc. ODP, Init. Repts., 164: College Station, TX (Ocean
Drilling Program), 5–12. doi:10.2973/odp.proc.ir.164.101.1996
Sloan, E.D., 1990. Clathrate Hydrates of Natural Gases. Marcel Dekker, Inc., New York, p.
641.
Taluker, A.R., Bialas, J., Klaeschen, D., Buerk, D., Brueckmann, W., Reston, T., Breitzke,
M., 2007. High-resolution, deep tow, multichannel seismic and sidescan sonar
survey of the submarine mounds and associated BSR off Nicaragua pacific margin.
Marine Geology 241, 33-43.
Page 73
66
Tobin, H., Kinoshita, M., Moe, K.T., and the Expedition 314 Scientists, 2009. Expedition
314 summary. In Kinoshita, M., Tobin, H., Ashi, J., Kimua, G., Lallemant, S.,
Screaton, E.J., Curewitz, D., Masago, H., Moe, K.T., and the Expedition
314/315/316 Scientists, Proceedings of the Integrated Ocean Drilling Program,
314/315/316: Washington, D.C., Integrated Ocean Drilling Program Management
International, Inc., doi: 10.2204/iodp.proc.314315316.111.2009.
Torres, M.E., Tréhu, A.M., Cespedes, N., Kastner, M., Wortmann, U.G., Kim, J.H., Long, P.,
Malinverno, A., Pohlman, J.W., Riedel, M., Collet, T., 2008. Methane hydrate
formation in turbidite sediments of northern Cascadia, IODP Expedition 311. Earth
Planet. Sci. Lett. 271, 170-180.
Tsuji, Y., Namikawa, T., Fujii, T., Hayashi, M., Kitamura, R., Nakamizu, M., Ohbi, K.,
Saeki, T., Yamamoto, K., Inamori, T., Oikawa, N., Shimizu, S., Kawasaki, M.,
Nagakubo, S., Matsushima, J., Ochiai, K., Okui, T, 2009. Extended abstract –
Methane-hydrate occurrence and distribution in the eastern Nankai Trough, Japan:
Findings of the Tokai-oki to Kumano-Nada methane-hydrate drilling program, in
Collet, T., Johnson, A., Knapp, C., Boswell, R., eds., Natural gas hydrates – Energy
resource potential and associated geologic hazards: AAPG Memoir 89, p. 9-12.
Yamano, M., Kinoshita, M., Goto, S., and Matsubayashi, O., 2003. Extremely high heat flow
anomaly in the middle part of the Nankai Trough. Phys. Chem. Earth, 28(9–11):487–
497. doi:10.1016/S1474-7065(03)00068-8
Yi, B.Y., Lee, G.H., Horozal, S., Yoo, D.G., Ryu, B.J., Kang, N.K., Lee, S.R., Kim, H.J.,
2011. Qualitative assessment of gas hydrate and gas concentrations from the AVO
Page 74
67
characteristics of the BSR in the Ulleung Basin, East Sea (Japan Sea). Marine and
Petroleum Geology 28, 1953-1966.