Fluorescence correlation spectroscopy1–4 (FCS) iswidely used for studying the diffusional and chemicalkinetics of fluorescent molecules and particles. It is arather useful method for measuring the size of sub-resolution particles in a biological environment. InFCS fluorescence is collected from an optically de-fined but physically open small excitation volume in-side the specimen. The optical definition is achievedthrough a confocal detection scheme. With FCS onestudies the temporal fluctuations of the fluorescence,which is proportional to the number fluctuation offluorophores inside the probe volume. The autocorre-lation of this fluctuation yields the characteristic timethat the fluorophore spends inside the excitation vol-ume while diffusing through it. This is defined by itsdiffusion constant, and in turn that yields its hydro-dynamic radius. It has been used for studying manychemical and biological processes including proteinkinetics,5 protein aggregation,6–8 diffusion of mole-cules on cell membranes,9–11 and flow characteriza-tion.12,13
The real power of FCS in biology comes from itscompatibility with living biological specimens. The
combination of FCS with a microscope, especially theconfocal microscope popularly known as fluorescencecorrelation microscopy (FCM),14,15 makes it evenmore powerful. While imaging reveals structureslarger than the resolution limit, FCS can measure thesize of diffusing fluorescent particles much smallerthan this limit.16
A simple approach for an FCM would be throughFCS with the signal collected by the detectors used forconfocal imaging (with the excitation beam held sta-tionary). However, FCM demands sensitivity to singlefluorophores, which the detectors used for imagingcannot deliver. In a confocal microscope the fluores-cence passes through a long optical path length, andseveral optics before it reaches the photomultipliertube (PMT) detectors of low-quantum-efficiency, whichreduces the overall sensitivity of the system. On theother hand, in a good FCS setup, (e.g., Sengupta etal.17) the path length and the number of optics are keptto a minimum, and single-photon-counting avalanchephotodiode detectors of high-quantum-efficiency areemployed, so that the entrance or the exit of a singlefluorophore into�from the probe volume can be de-tected. In high-sensitivity FCM instruments (e.g., incommercial instruments such as the Zeiss ConfoCor2�LSM 510 combi, Carl Zeiss, Germany), separatelaser-scanning confocal microscope and fluorescencecorrelation spectrometer units are used. In such sys-tems the FCS unit is prealigned to a fixed spot in theobject space whose coordinates are stored in the com-puter. When the user chooses a location in the confocalimage for FCS measurements, a high-resolution mo-torized specimen stage moves that location of the spec-
The authors are with the Tata Institute of Fundamental Re-search, Homi Bhabha Road, Colaba, Mumbai 400005 India (e-mailfor S. Maiti, [email protected]).
Received 12 July 2004; revised manuscript received 17 Decem-ber 2004; accepted 5 January 2005.
imen to this prealigned fixed location. In addition toincurring the expense of a high-resolution automatedstage, in this scheme one has to rely on the stability ofthe fixed FCS alignment, because there is no real-timeverification of where exactly the measurement wouldbe carried out.
We have developed a detection scheme that pro-vides a real-time readout of the exact location in theconfocal image where an FCS measurement is taken.This is achieved by adding a pinhole detector close tothe objective lens of the microscope in the nondes-canned space (i.e., the region between the galvano-metric mirrors and the objective lens where theoptical beams are moving in space during confocalimaging), as we describe below.
2. Method
A. Principle
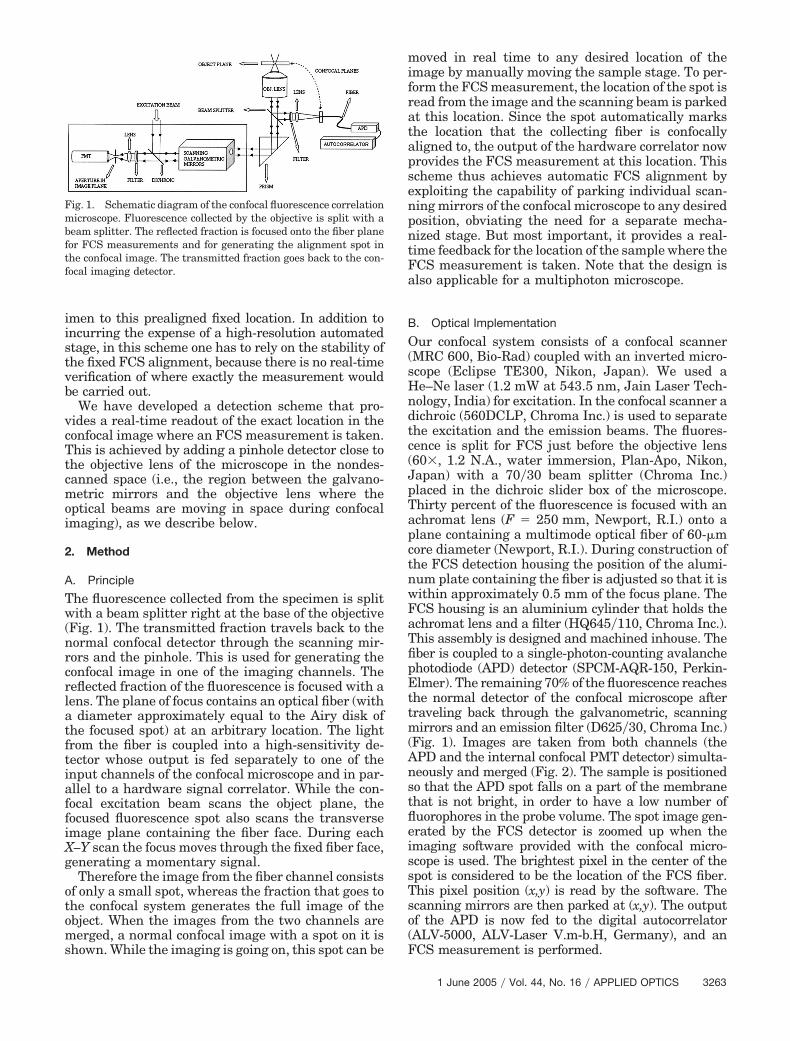
The fluorescence collected from the specimen is splitwith a beam splitter right at the base of the objective(Fig. 1). The transmitted fraction travels back to thenormal confocal detector through the scanning mir-rors and the pinhole. This is used for generating theconfocal image in one of the imaging channels. Thereflected fraction of the fluorescence is focused with alens. The plane of focus contains an optical fiber (witha diameter approximately equal to the Airy disk ofthe focused spot) at an arbitrary location. The lightfrom the fiber is coupled into a high-sensitivity de-tector whose output is fed separately to one of theinput channels of the confocal microscope and in par-allel to a hardware signal correlator. While the con-focal excitation beam scans the object plane, thefocused fluorescence spot also scans the transverseimage plane containing the fiber face. During eachX–Y scan the focus moves through the fixed fiber face,generating a momentary signal.
Therefore the image from the fiber channel consistsof only a small spot, whereas the fraction that goes tothe confocal system generates the full image of theobject. When the images from the two channels aremerged, a normal confocal image with a spot on it isshown. While the imaging is going on, this spot can be
moved in real time to any desired location of theimage by manually moving the sample stage. To per-form the FCS measurement, the location of the spot isread from the image and the scanning beam is parkedat this location. Since the spot automatically marksthe location that the collecting fiber is confocallyaligned to, the output of the hardware correlator nowprovides the FCS measurement at this location. Thisscheme thus achieves automatic FCS alignment byexploiting the capability of parking individual scan-ning mirrors of the confocal microscope to any desiredposition, obviating the need for a separate mecha-nized stage. But most important, it provides a real-time feedback for the location of the sample where theFCS measurement is taken. Note that the design isalso applicable for a multiphoton microscope.
B. Optical Implementation
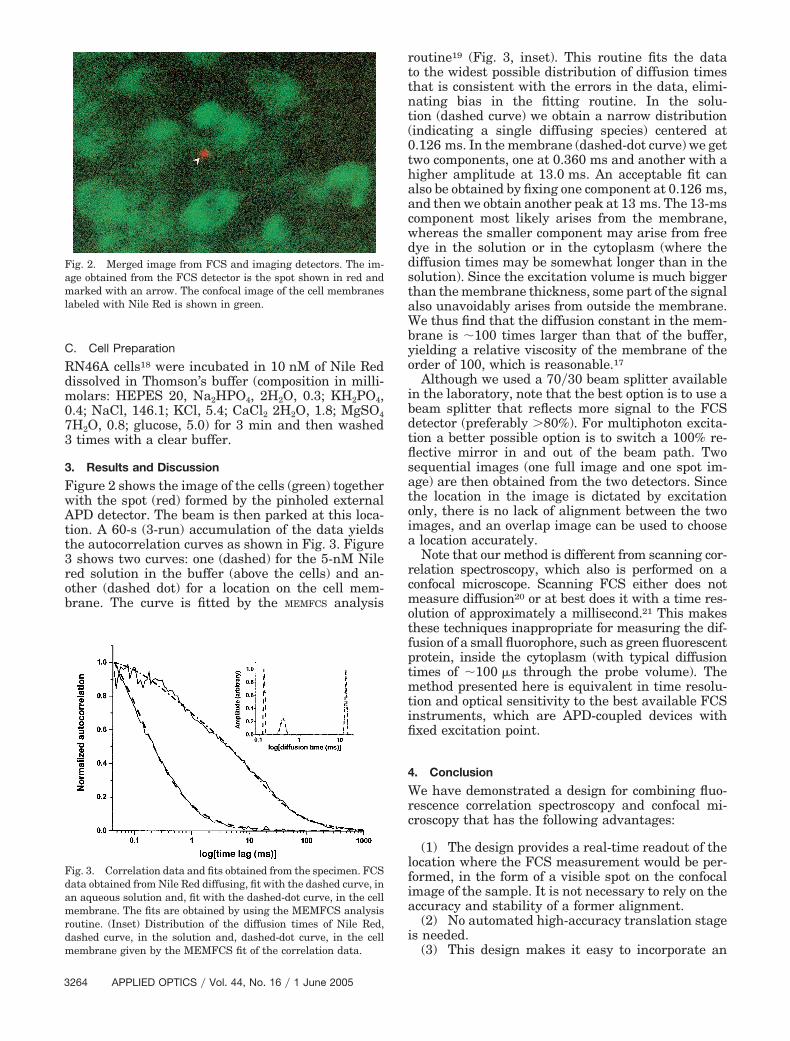
Our confocal system consists of a confocal scanner(MRC 600, Bio-Rad) coupled with an inverted micro-scope (Eclipse TE300, Nikon, Japan). We used aHe–Ne laser (1.2 mW at 543.5 nm, Jain Laser Tech-nology, India) for excitation. In the confocal scanner adichroic (560DCLP, Chroma Inc.) is used to separatethe excitation and the emission beams. The fluores-cence is split for FCS just before the objective lens(60�, 1.2 N.A., water immersion, Plan-Apo, Nikon,Japan) with a 70�30 beam splitter (Chroma Inc.)placed in the dichroic slider box of the microscope.Thirty percent of the fluorescence is focused with anachromat lens (F � 250 mm, Newport, R.I.) onto aplane containing a multimode optical fiber of 60-�mcore diameter (Newport, R.I.). During construction ofthe FCS detection housing the position of the alumi-num plate containing the fiber is adjusted so that it iswithin approximately 0.5 mm of the focus plane. TheFCS housing is an aluminium cylinder that holds theachromat lens and a filter (HQ645�110, Chroma Inc.).This assembly is designed and machined inhouse. Thefiber is coupled to a single-photon-counting avalanchephotodiode (APD) detector (SPCM-AQR-150, Perkin-Elmer). The remaining 70% of the fluorescence reachesthe normal detector of the confocal microscope aftertraveling back through the galvanometric, scanningmirrors and an emission filter (D625�30, Chroma Inc.)(Fig. 1). Images are taken from both channels (theAPD and the internal confocal PMT detector) simulta-neously and merged (Fig. 2). The sample is positionedso that the APD spot falls on a part of the membranethat is not bright, in order to have a low number offluorophores in the probe volume. The spot image gen-erated by the FCS detector is zoomed up when theimaging software provided with the confocal micro-scope is used. The brightest pixel in the center of thespot is considered to be the location of the FCS fiber.This pixel position (x,y) is read by the software. Thescanning mirrors are then parked at (x,y). The outputof the APD is now fed to the digital autocorrelator(ALV-5000, ALV-Laser V.m-b.H, Germany), and anFCS measurement is performed.
Fig. 1. Schematic diagram of the confocal fluorescence correlationmicroscope. Fluorescence collected by the objective is split with abeam splitter. The reflected fraction is focused onto the fiber planefor FCS measurements and for generating the alignment spot inthe confocal image. The transmitted fraction goes back to the con-focal imaging detector.
RN46A cells18 were incubated in 10 nM of Nile Reddissolved in Thomson’s buffer (composition in milli-molars: HEPES 20, Na2HPO4, 2H2O, 0.3; KH2PO4,0.4; NaCl, 146.1; KCl, 5.4; CaCl2 2H2O, 1.8; MgSO47H2O, 0.8; glucose, 5.0) for 3 min and then washed3 times with a clear buffer.
3. Results and Discussion
Figure 2 shows the image of the cells (green) togetherwith the spot (red) formed by the pinholed externalAPD detector. The beam is then parked at this loca-tion. A 60-s (3-run) accumulation of the data yieldsthe autocorrelation curves as shown in Fig. 3. Figure3 shows two curves: one (dashed) for the 5-nM Nilered solution in the buffer (above the cells) and an-other (dashed dot) for a location on the cell mem-brane. The curve is fitted by the MEMFCS analysis
routine19 (Fig. 3, inset). This routine fits the datato the widest possible distribution of diffusion timesthat is consistent with the errors in the data, elimi-nating bias in the fitting routine. In the solu-tion (dashed curve) we obtain a narrow distribution(indicating a single diffusing species) centered at0.126 ms. In the membrane (dashed-dot curve) we gettwo components, one at 0.360 ms and another with ahigher amplitude at 13.0 ms. An acceptable fit canalso be obtained by fixing one component at 0.126 ms,and then we obtain another peak at 13 ms. The 13-mscomponent most likely arises from the membrane,whereas the smaller component may arise from freedye in the solution or in the cytoplasm (where thediffusion times may be somewhat longer than in thesolution). Since the excitation volume is much biggerthan the membrane thickness, some part of the signalalso unavoidably arises from outside the membrane.We thus find that the diffusion constant in the mem-brane is �100 times larger than that of the buffer,yielding a relative viscosity of the membrane of theorder of 100, which is reasonable.17
Although we used a 70�30 beam splitter availablein the laboratory, note that the best option is to use abeam splitter that reflects more signal to the FCSdetector (preferably �80%). For multiphoton excita-tion a better possible option is to switch a 100% re-flective mirror in and out of the beam path. Twosequential images (one full image and one spot im-age) are then obtained from the two detectors. Sincethe location in the image is dictated by excitationonly, there is no lack of alignment between the twoimages, and an overlap image can be used to choosea location accurately.
Note that our method is different from scanning cor-relation spectroscopy, which also is performed on aconfocal microscope. Scanning FCS either does notmeasure diffusion20 or at best does it with a time res-olution of approximately a millisecond.21 This makesthese techniques inappropriate for measuring the dif-fusion of a small fluorophore, such as green fluorescentprotein, inside the cytoplasm (with typical diffusiontimes of �100 �s through the probe volume). Themethod presented here is equivalent in time resolu-tion and optical sensitivity to the best available FCSinstruments, which are APD-coupled devices withfixed excitation point.
4. Conclusion
We have demonstrated a design for combining fluo-rescence correlation spectroscopy and confocal mi-croscopy that has the following advantages:
(1) The design provides a real-time readout of thelocation where the FCS measurement would be per-formed, in the form of a visible spot on the confocalimage of the sample. It is not necessary to rely on theaccuracy and stability of a former alignment.
(2) No automated high-accuracy translation stageis needed.
(3) This design makes it easy to incorporate an
Fig. 2. Merged image from FCS and imaging detectors. The im-age obtained from the FCS detector is the spot shown in red andmarked with an arrow. The confocal image of the cell membraneslabeled with Nile Red is shown in green.
Fig. 3. Correlation data and fits obtained from the specimen. FCSdata obtained from Nile Red diffusing, fit with the dashed curve, inan aqueous solution and, fit with the dashed-dot curve, in the cellmembrane. The fits are obtained by using the MEMFCS analysisroutine. (Inset) Distribution of the diffusion times of Nile Red,dashed curve, in the solution and, dashed-dot curve, in the cellmembrane given by the MEMFCS fit of the correlation data.
automatically aligned FCS instrument in virtuallyany existing confocal microscope.
S. Maiti is a Wellcome Trust Overseas Senior Re-search Fellow in Biomedical Sciences in India (Ref.05995�Z�99�Z�HH�KO). J. Balaji, K. Garai, andS. K. Kaushalya are recipients of the Kanwal RekhiCareer Development Scholarship of the Tata Insti-tute of Fundamental Research. The RN46A cell linewas a gift from Mary Eaton.
References1. D. Magde, E. Elson, and W. W. Webb, “Thermodynamic fluc-
tuation in a reaction system — measurement by fluorescencecorrelation spectroscopy,” Phys. Rev. Lett. 29, 705–708(1972)
2. E. Elson and D. Magde, “Fluorescence correlation spectros-copy: I. Conceptual basics and theory,” Biopolymers 13, 1–27(1974).
3. D. Magde, E. Elson, and W. W. Webb, “Fluorescence correla-tion spectroscopy: II. An experimental realization,” Biopoly-mers 13, 29–61 (1974).
4. S. Maiti, U. Haupts, and W. W. Webb, “Fluorescence correla-tion spectroscopy: diagnostics for sparse molecules,” Proc.Natl. Acad. Sci. USA 94, 11753–11757 (1997).
5. U. Haupts, S. Maiti, P. Schwille, and W. W. Webb, “Dynamicsof fluorescence fluctuations in green fluorescenct protein ob-served by fluorescence correlation spectroscopy,” Proc. Natl.Acad. Sci. USA 95, 13573–13578 (1998).
6. A. G. Palmer and N. L. Thompson, “Molecular aggregationcharacterized by high order autocorelation in fluorescence cor-relation spectroscopy,” Biophys. J. 52, 257–270 (1987).
7. L. O. Tjernberg, A. Pramanik, S. Bjorling, P. Thyberg, J.Thyberg, C. Nordstedt, K. D. Berndt, L. Terenius, and R.Rigler, “Amyloid beta-peptide polymerization studied usingfluorescence correlation spectroscopy,” Chem. Biol. 6, 53–62(1999).
8. P. Sengupta, K. Garai, B. Sahoo, Y. Shi, D. J. Callaway, and S.Maiti, “The amyloid beta peptide [Abeta(1–40)] is thermody-namically soluble at physiological concentrations,” Biochemis-try 42, 10506–10513 (2003).
9. E. L. Elson, J. Schlessinger, D. E. Koppel, D. Axelrod, and
W. W. Webb, “Measurement of lateral transport on cell sur-faces,” Prog. Clin. Biol. Res. 9, 137–147 (1976).
10. P. Schwille, U. Haupts, S. Maiti, and W. W. Webb, “Moleculardynamics in living cells observed by fluorescence correlationspectroscopy with one- and two-photon excitation,” Biophys. J.77, 2251–2265 (1999).
11. P. Schwille, J. Korlach, and W. W. Webb, “Fluorescence corre-lation spectroscopy with single-molecule sensitivity on cell andmodel membranes,” Cytometry 36, 176–182 (1999).
12. D. Magde, W. W. Webb, and E. L. Elson, “Fluorescence corre-lation spectroscopy. III. Uniform translation and laminarflow,” Biopolymer 17, 361–376 (1978).
13. M. Brinkmeier and R. Rigler, “Flow analysis by means of flu-orescence correlation spectroscopy,” Exp. Tech. Phys. 41, 205–210 (1996).
14. R. Brock, M. A. Hink, and T. M. Jovin, “Fluorescence correla-tion microscopy of cells in the presence of autofluorescence,”Biophys. J. 75, 2547–2557 (1998).
15. R. Brock and T. M. Jovin, “Fluorescence correlation microscopy(FCM): fluorescence correlation spectroscopy (FCS) in cell bi-ology,” in Fluorescence Correlation Spectroscopy Theory andApplications. R. Rigler and E. S. Elson, eds. (Springer-Verlag,Berlin, 2001), p. 132–161.
16. E. L. Elson, “Fluorescence correlation spectroscopy measuresmolecular transport in cells,” Traffic 2, 789–796 (2001).
17. P. Sengupta, J. Balaji, and S. Maiti, “Measuring diffusion incell membranes by fluorescence correlation spectroscopy,”Methods 27, 374–387 (2002).
18. L. A. White, M. J. Eaton, M. C. Castro, K. J. Klose, M. Y.Globus, G. Shaw, and S. R. Whittemore, “Distinct regulatorypathways control neurofilament expression and neurotrans-mitter synthesis in immortalized serotonergic neurons,”J Neurosci. 14, 6744–6753 (1994).
19. P. Sengupta, K. Garai, J. Balaji, N. Periasamy, and S. Maiti,“Measuring size distribution in highly heterogeneous systemswith fluorescence correlation spectroscopy,” Biophys. J. 84,1977–1984 (2003).
20. N. O. Petersen, “Scanning fluorescence correlation spectros-copy. I. Theory and simulation of aggregation measurements,”Biophys. J. 49, 809–815 (1986).
21. D. E. Koppel, F. Morgan, A. E. Cowan, and J. H. Carson,“Scanning concentration correlation spectroscopy using theconfocal laser microscope,” Biophys. J. 66, 502–507 (1994).