HAL Id: jpa-00249582 https://hal.archives-ouvertes.fr/jpa-00249582 Submitted on 1 Jan 1997 HAL is a multi-disciplinary open access archive for the deposit and dissemination of sci- entific research documents, whether they are pub- lished or not. The documents may come from teaching and research institutions in France or abroad, or from public or private research centers. L’archive ouverte pluridisciplinaire HAL, est destinée au dépôt et à la diffusion de documents scientifiques de niveau recherche, publiés ou non, émanant des établissements d’enseignement et de recherche français ou étrangers, des laboratoires publics ou privés. Fluorescence Detection of Extended X-Ray Absorption Fine Structure in Thin Films Xavier Castañer, C. Prieto To cite this version: Xavier Castañer, C. Prieto. Fluorescence Detection of Extended X-Ray Absorption Fine Structure in Thin Films. Journal de Physique III, EDP Sciences, 1997, 7 (2), pp.337-349. <10.1051/jp3:1997126>. <jpa-00249582>
Transcript
HAL Id: jpa-00249582https://hal.archives-ouvertes.fr/jpa-00249582
Submitted on 1 Jan 1997
HAL is a multi-disciplinary open accessarchive for the deposit and dissemination of sci-entific research documents, whether they are pub-lished or not. The documents may come fromteaching and research institutions in France orabroad, or from public or private research centers.
L’archive ouverte pluridisciplinaire HAL, estdestinée au dépôt et à la diffusion de documentsscientifiques de niveau recherche, publiés ou non,émanant des établissements d’enseignement et derecherche français ou étrangers, des laboratoirespublics ou privés.
Fluorescence Detection of Extended X-Ray AbsorptionFine Structure in Thin Films
Xavier Castañer, C. Prieto
To cite this version:Xavier Castañer, C. Prieto. Fluorescence Detection of Extended X-Ray Absorption Fine Structure inThin Films. Journal de Physique III, EDP Sciences, 1997, 7 (2), pp.337-349. <10.1051/jp3:1997126>.<jpa-00249582>
J. Phys. III IYance 7 (1997) 337-349 FEBRUARY 1997, PAGE 337
Fluorescence Detection of Extended X-Ray Absorption FineStructure in Thin Films
R. Castafier and C. Prieto (*)
Instituto de Ciencia de Materiales de Madrid, Consejo Superior de Investigaciones Cientificas,
Cantoblanco, 28049 Madrid, Spain
(Received 5 June 1996, revised 27 September 1996, accepted 28 October 1996)
PACS.61.10.Ht X-ray absorption spectroscopy: EXAFS, NEXAFS, XANES, etc.
PACS.68.55.Nq Composition and phase identification
PACS.68.65.+g Low-dimensional structures (superlattices, quantum well structures,multilayers): structure, and nonelectronic properties
Abstract. The linearity of the fluorescence detection of the Extended X-ray AbsorptionFine Structure (EXAFS) signal of moderately thin film samples depends on the experiment
geometry and on the sample thickness because of the self-absorption effect The correction for
thick samples has been extensively studied but there has not been reported a method which
could be useable continuously for intermediate thickness We propose an approximative method
that, taking into account the sample thickness, will provide the correction of the EXAFS signalamplitude In the present work, the correction is applied to two different systems: FeS12 thin
films and Co/Cu superlattices. After correction, the determination of the crystallographic phaseof FeS12 thin films
over different sustrates has been carried out.
1. Introduction
The study of structural properties of thin films using X-ray Absorption Spectroscopy (XAS)has received an increased attention in the last few years [Ii. This technique presents some
advantages compared to the X-ray diffraction. XAS is an element-specific probe of the local
environment of the absorbing atom. By tuning the incoming X-ray energy, one obtains the fine
structure at and above the absorption edge of the selected atom. The structural information
contained in this spectrum is as follows: I) the pre-edge structure is related to the site symmetryand valence state; it) the X-ray Absorption Near Edge Structure (XANES) region contains
stereo chemical information (e.g. bond angles); and iii) the Extended X-ray Absorption Fine
Structure (EXAFS) oscillations give accurate atomic distances and coordination numbers from
the absorber to its neighbors. For example in superlattices, the advantage respect to X-raydiffraction is that, while diffraction yields information on the average structure of the two
components modulated by the superlattice periodicity, EXAFS enables to select one of them
eliminating the long-range periodicities.Fluorescence yield detection is a good method to measure the EXAFS signal because it is
very sensitive for samples with small quantity of matter [2,3j and because the probing depth
(*) Author for correspondence (e-mail cprietoflicmm.csic.es)
Les kditions de Physique 1997
338 JOURNAL DE PHYSIQUE III N°2
is large enough to be sure that the bulk structure is sounded. When the sample is not thin
enough, the fluorescence detected EXAFS signal is not proportional to the actual oscillation of
the absorption coefficient, and must be corrected because of the self-absorption effect. A highconcentration of the absorbing atoms makes possible the re-absorption of their own fluorescence
yield and the obtained EXAFS signal becomes smaller than the actual one. Typically, this effect
is found in samples with big amount of absorbing atoms: non-diluted samples and non-thin
films. An important magnitude is the information depth, i.e. the thickness of the sample,beginning from the surface, where the detected fluorescence yield is mainly emitted. The
information depth changes with the geometry of the experiment: it becomes maximum when
the surface of the sample forms an angle near 45° with the incoming beam and with the
fluorescence detector, at this position the absorption of the incident X-ray and the emitted
fluorescence yield are of the same order and the sounded depth results maximum.
Self-absorption effect has been studied by Goulon [4]. For thick enough samples, the rela-
tionship between the fluorescence experimental EXAFS signal, xexp(k), and the actual value
x(k) has been reported by Troeger et al. [5]. Nevertheless, an interesting point is to know
where is the boundary between thin samples and thick ones.
In this work, we propose a new approximation in order to correct the self-absorption effect
in samples of arbitrary thickness, where the correction factor is calculated from the actual
film thickness and from the information depth for this material. The correction is speciallyinteresting for middle range thickness films (loo I
< d < lo, 000 I). It will be tested in
two different systems: FeS12 thin films and Co/Cu superlattices prepared over Si and Cu(100)single crystals, respectively.
2. X~Ray Absorption Spectroscopy in Moderate Thin Films
When some element environment (for example Fe) is studied inside a compound by fluorescence
detected EXAFS spectroscopy, the fluorescence counting rate is given by [5]
l~l~ -l~fe
~~~~i~~ +~~iilllini<~/ sini~~ exP
I- liill~+
~iiill'~dl ii)
This expression has been derived for the averaged intensity of the fluorescence I(E) relative to
the incidence intensity IO (E), A/r~ is the solid angle from the sample to the detector, ~Fe is
the iron fluorescence yield, ~LFe is the absorption due to iron and~Lto< is the total absorption
coefficient due to all the elements present in the sample, d is the thickness of the sample,E< is the emission fluorescence energy of the iron and # is the X-ray incidence angle over
the sample and is the angle between the sample and the detector (in our experimental
set-up #=
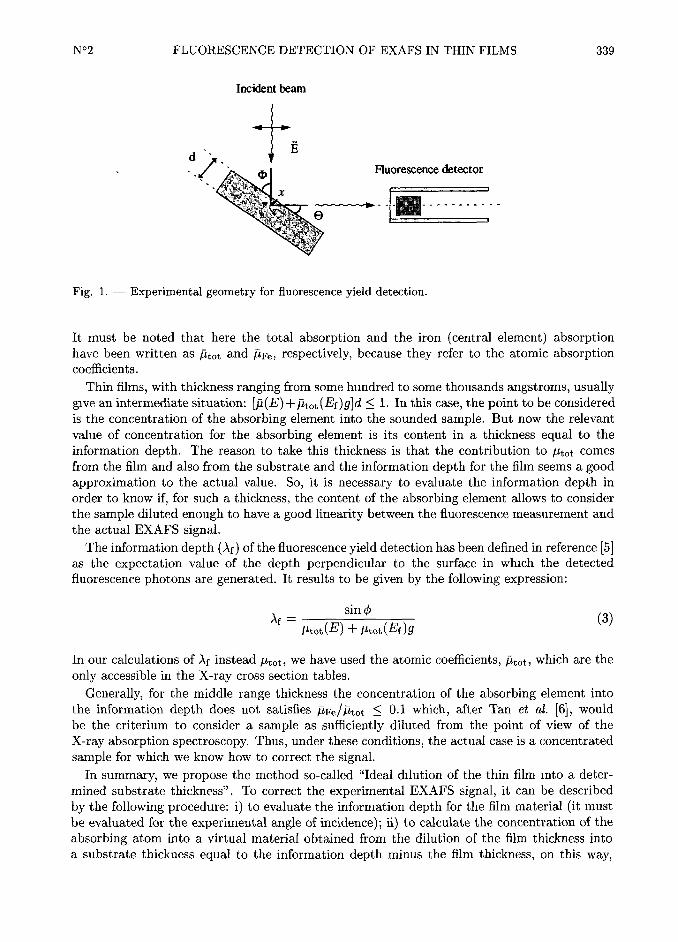
90 and g = tan #). Figure I is a schematic representation of the geometry for
fluorescence detection.
For very thin samples the relation [~Ltot(E) + ~Ltot(E<)g]d < I is satisfied. Then, expandingthe exponential term in equation ii), the fluorescence yield is proportional to ~LFe(E). This
means thatno correction is needed to evaluate the EXAFS signal.
On the other hand, for thick samples: [~Ltot(E) + ~Ltot(E<)g]d » I, then the fluorescence
yield is proportional to Io~Lfe(E)/[~Ltot(E) + ~Ltot(E<)g]. After Troeger et al. [5], the corre-
sponding correction can be easily carried out. The experimentally obtained EXAFS oscillations
(xexp(E)) must be corrected to obtain the actual signal (XFe(E)), by
XexpiE)"
XFeIE)1
p/)~)~ ~~~j
"kfeiE) ii SIE)I 12)
N°2 FLUORESCENCE DETECTION OF EXAFS IN THIN FILMS 339
Incidenttemn
d
~~,_
l'~
Ruorescencedetector
~~~'iji~ ~
_-_.,m-
'U§l e
Fig. I. Experimental geometry for fluorescence yield detection.
It must be noted that here the total absorption and the iron (central element) absorptionhave been written as jitot and jife, respectively, because they refer to the atomic absorptioncoefficients.
Thin films, with thickness ranging from some hundred to some thousands angstroms, usually
give an intermediate situation: [ji(E) + jitot (E<)g]d < I. In this case, the point to be considered
is the concentration of the absorbing element into the sounded sample. But now the relevant
value of concentration for the absorbing element is its content in a thickness equal to the
information depth. The reason to take this thickness is that the contribution to /ttot comes
from the film and also from the substrate and the information depth for the film seems a goodapproximation to the actual value. So, it is necessary to evaluate the information depth in
order to know if, for such a thickness, the content of the absorbing element allows to consider
the sample diluted enough to have a good linearity between the fluorescence measurement and
the actual EXAFS signal.
The information depth ii< of the fluorescence yield detection has been defined in reference [5]
as the expectation value of the depth perpendicular to the surface in which the detected
fluorescence photons are generated. It results to be given by the following expression:
~' ~tot(E)~~i~tot(Ef)g~~~
In our calculations of if instead ~Ltot, we have used the atomic coefficients, jitot, which are the
only accessible in the X-ray cross section tables.
Generally, for the middle range thickness the concentration of the absorbing element into
the information depth does not satisfies jife/jito< < o-I which, after Tan et al. [6j, would
be the criterium to consider a sample as sufficiently diluted from the point of view of the
X-ray absorption spectroscopy. Thus, under these conditions, the actual case is a concentrated
sample for which we know how to correct the signal.
In summary, we propose the method so-called "Ideal dilution of the thin film into a deter-
mined substrate thickness". To correct the experimental EXAFS signal, it can be described
by the following procedure: I) to evaluate the information depth for the film material (it must
be evaluated for the experimental angle of incidence) it) to calculate the concentration of the
absorbing atom into a virtual material obtained from the dilution of the film thickness into
a substrate thickness equal to the information depth minus the film thickness, on this way,
340 JOURNAL DE PHYSIQUE III N°2
the total thickness of the virtual material will be equal to the information depth; and iii) to
correct the experimental EXAFS signal as it was coming from this virtua1material by usingequation (2).
On this way, both limits are recovered: for thickness much more smaller than the information
depth, this dilution approximation implies the "non correction" as it can be seen in equation (2)where S(E) is almost zero for very small concentrations of the absorbing atom. On the other
hand, when the film thickness is bigger than the information depth, it is the correction givenby Troeger et al. which is valid, this situation being reached for thick film samples and for
glancing angles.
3. Experimental
The following Extended X-ray Absorption Fine Structure (EXAFS) experiments were car-
ried out at the XAS-3 beamline at DCI storage ring (Orsay) with an electron beam energyof1.85 GeV and an average current of 250 mA. Data were collected by using a fixed exit
monochromator with two flat Si(311) crystals, detection was made by using one ion chamber
with air fill gas and a photomultiplier tube with a scintillator plastic in order to detect the
fluorescence yield [7] at the Fe and Co K-edges in FeS12 thin films and Co /Cu superlattices,respectively. Several spectra were collected in order to accumulate them and to have a goodenough signal to noise ratio. Energy resolution was estimated to be about 2 eV by the Cu foil
3d near edge feature. The energy calibration was monitored using the Cu foil sample, and was
taken as 8991 eV at the first maximum above the edge.Fluorescence spectra were obtained at room temperature with a geometry where the fluores-
cence detector forms an angle of 90° with the incoming beam. The Bragg diffraction peaks of
the crystalline substrates were avoided by looking for a proper angle between the sample and
the detector.
4. Results and Discussion
We have performed experiments in two different systems in order to test the proposed method:
the first one is related to the determination of the crystallographic phase of iron silicide films
over some Si substrates and the second one studies the influence of the self-absorption effect
on the determination of the structural properties of the Co layers in Co/Cu superlattices.
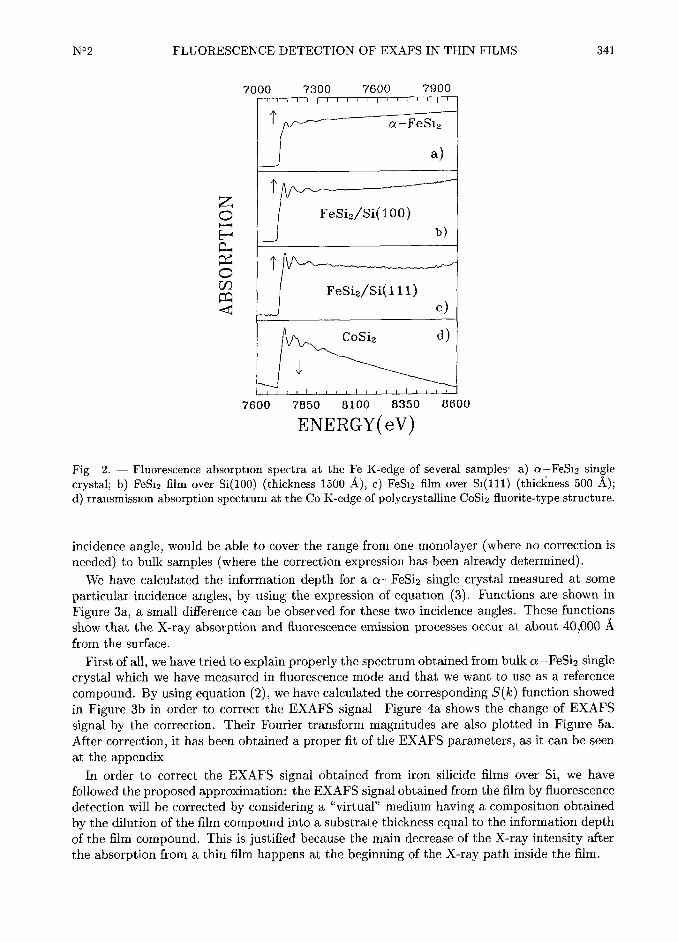
4.I. IRON SILICIDE THIN FILMS. The iron fluorescence EXAFS spectra obtained from
several samples are shown in Figure 2. Two iron silicide thin films samples grown over Si(100)and Si(ill) substrates (with thickness 500 and 1500 I, respectively) have been studied and
compared with two reference compounds: a-FeS12 single crystal and CoS12 (fluorite typestructure).
The expression [jitot(E) + jito<(E<)gjd for these thin films, gives values in the 0 01-0.03
range. In principle, it could be considered small enough to be negligible. Nevertheless, the
evaluation of the jife/jitot gives values in the 0.1-0.3 range which according to reference [6],shows that these samples can not be considered as diluted ones. Moreover, the dependence of
the amplitude oscillations with the incidence angle shows that the EXAFS signal is affected
by the self-absorption effect, the experimental EXAFS intensity being not proportiona1tothe actual EXAFS signal. Indeed, the expression [jitot(E) + jitot(E<)g]d increases when the
incidence angle decreases becoming near I for glancing angles. Therefore, it is necessary to
find the correction for the measured signal that, taking into account the film thickness and the
N°2 FLUORESCENCE DETECTION OF EXAFS IN THIN FIL&IS 341
7000 7300 7600 7900
Icx-Fesiz
a)
I
~j Fesiz/Si(100)i~ b)
CL~ilS IO~~ Fesiz/si( I I I
~f c)
cosiz d)
7600 7850 8100 8350 8600
ENERGY(eV)
Fig 2. Fluorescence absorption spectra at the Fe K-edge of several samples- a) a-FeS12 single
crystal; b) FeS12 film overSi(100) (thickness 1500 I), c) FeS12 film over
Si(ill) (thickness 500 I);d) transmission absorption spectrum at the Co K-edge of polycrystalline CoS12 fluorite-type structure.
incidence angle, would be able to cover the range from one monolayer (where no correction is
needed) to bulk samples (where the correction expression has been already determined).
We have calculated the information depth for a a-FeS12 single crystal measured at some
particular incidence angles, by using the expression of equation (3). Functions are shown in
Figure 3a, a small difference can be observed for these two incidence angles. These functions
show that the X-ray absorption and fluorescence emission processes occur at about 40,000 I
from the surface.
First of all, we have tried to explain properly the spectrum obtained from bulk a-FeS12 single
crystal which we have measured in fluorescence mode and that we want to use as a reference
compound. By using equation (2), we have calculated the corresponding S(k) function showed
in Figure 3b in order to correct the EXAFS signal Figure 4a shows the change of EXAFS
signal by the correction. Their Fourier transform magnitudes are also plotted in Figure 5a.
After correction, it has been obtained a proper fit of the EXAFS parameters, as it can be seen
at the appendix
In order to correct the EXAFS signal obtained from iron silicide films over Si, we have
followed the proposed approximation: the EXAFS signal obtained from the film by fluorescence
detection will be corrected by considering a "virtual" medium having a composition obtained
by the dilution of the film compound into a substrate thickness equal to the information depthof the film compound. This is justified because the main decrease of the X-ray intensity after
the absorption from a thin film happens at the beginning of the X-ray path inside the film.
342 JOURNAL DE PHYSIQUE III N°2
~a)
ZL~' a-Fesiz(4=45°)
~i 4~ a-Fesiz(4=63°)~_ (9Co/5Cu)(4=45°)#l
CQ~
iz~$$ (9Co/5Cu)(4=2°)
~ 0
o ~ (9Co/5Cu)(4=2°)~)
a-Fesiz(4=45°)
~~ ~
(9Co/5Cu)(4=45°)~'~
Fesiz/Si(100)(4=63°)0.2
°"°36 9 iz 15
WAVENUMBER (A~
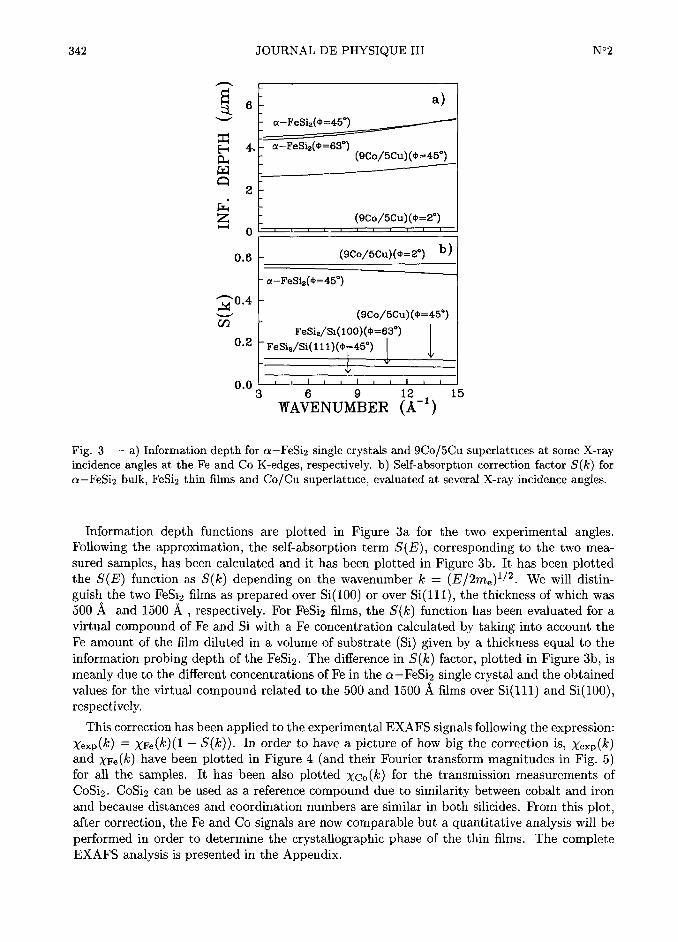
Fig. 3 a) Information depth for a-FeS12 single crystals and 9Co/5Cu superlattices at some X-rayincidence angles at the Fe and Co K-edges, respectively. b) Self-absorption correction factor S(k) for
o-FeS12 bulk, FeS12 thin films and Co/Cu superlattice, evaluated at several X-ray incidence angles.
Information depth functions are plotted in Figure 3a for the two experimental angles.Following the approximation, the self-absorption term S(E), corresponding to the two mea-
sured samples, has been calculated and it has been plotted in Figure 3b. It has been plottedthe S(E) function as S(k) depending on the wavenumber k
=
(E/2me)~/~. We will distin-
guish the two FeS12 films as prepared over Si(100) or over Si(111), the thickness of which was
500 I and 1500 I,
respectively. For FeS12 films, the S(k) function has been evaluated for a
virtual compound of Fe and Si with a Fe concentration calculated by taking into account the
Fe amount of the film diluted in a volume of substrate (Si) given by a thickness equal to the
information probing depth of the FeS12. The difference in S(k) factor, plotted in Figure 3b, is
meanly due to the different concentrations of Fe in the o-FeS12 single crystal and the obtained
values for the virtual compound related to the 500 and 1500 I films overSi(ill) and Si(100),
respectively.
This correction has been applied to the experimental EXAFS signals following the expression:xexp(k)
=xfe(k) ii S(k)). In order to have a picture of how big the correction is, xexp(k)
and XFe(k) have been plotted in Figure 4 land their Fourier transform magnitudes in Fig. 5)for all the samples. It has been also plotted Xco(k) for the transmission measurements of
CoS12. CoS12 can be used as a reference compound due to similarity between cobalt and iron
and because distances and coordination numbers are similar in both silicides. From this plot,after correction, the Fe and Co signals are now comparable but a quantitative analysis will be
performed in order to determine the crystallographic phase of the thin films. The completeEXAFS analysis is presented in the Appendix.
N°2 FLUORESCENCE DETECTION OF EXAFS IN THIN FILMS 343
ul+J
cx-Fesie~
esie/Si(l~~)
-
b)44l~ Fesie/Si(ill
-4~
~$ C
$iCosie
l/l
~~ d)
~3 5 ? 91113~
izQ WAVENUMBER (A~
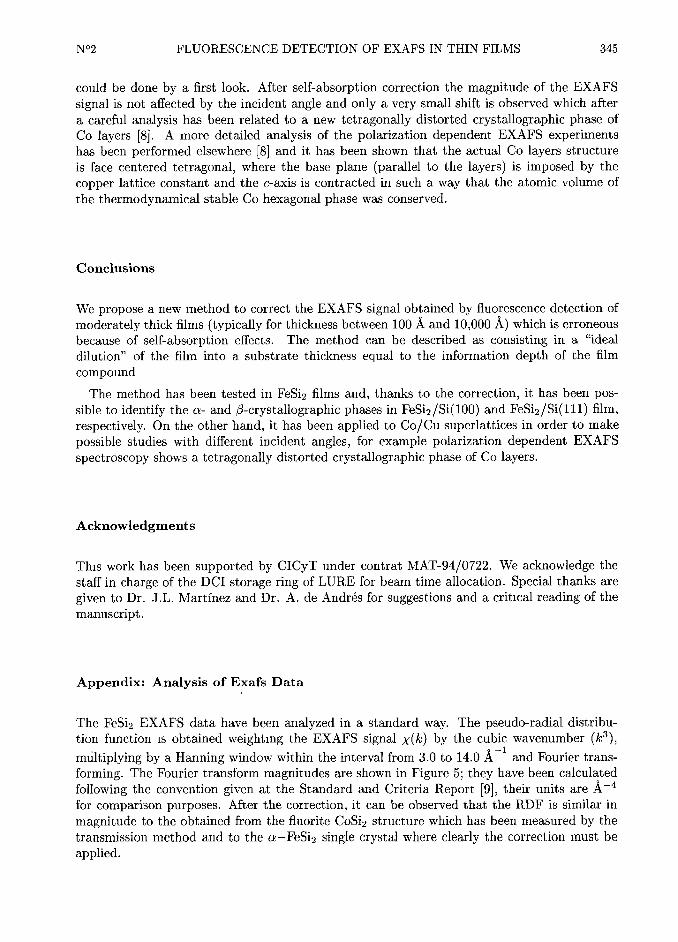
Fig. 4. Normalized EXAFS signal flom Figure 2 data, after atomic background subtraction by a
cubic spline polynome. a), b) and c) Dashed lines are the non-corrected EXAFS signal and continous
lines are EXAFS spectra after correction; d) this spectrum has been detected by the transmission
mode and no correction is needed
4.2. Co /Cu SUPERLATTICES. Similarly to the previous system, cobalt fluorescence EXAFS
spectra has been performed for the (9Co/5Cu)io3 single crystal superlattice prepared over
Cu(100) at several incident angles (the notation means that the bilayers are formed by 9 and
5 atomic layers of Co and Cu, respectively, and this bilayer is repeated 103 times). In Figure 3
are also showed the penetration depth and the self-absorption factor for two characteristic
angles #=
45° and glancing #=
2°. The Fourier transform k~x(k) obtained for the spectra
performed at this two geometries are plotted in Figure 6. We have followed the same method
in order to correct the fluorescence EXAFS signal. For the #=
45° spectra the correction has
been calculated for a virtual sample where the cobalt of the superlattice has been diluted in
28,000 I of copper. Nevertheless, the signal information depth for glancing angle result to be
approximately 1,600 I which is smaller than the total thickness of the superlattice (2,700 I)So, the correction to be performed is the same as for an infinitely thick (9Co/5Cu) compound.The Fourier transform before and after correction has been also plotted in Figure 6. It has
been calculated following the EXAFS standard and criteria to obtain the magnitude in i~~
units.
It is clear that the first four distances can be observed at 2.3, 3.5, 4.2 and 4.8 I showing a
fcc structure for the cobalt layers which is imposed by the copper ones. In order to performpolarization dependent EXAFS experiments it is necessary to change the incident angle and
the signal must be corrected to analyze data in a proper way. The apparent decrease of the
experimental signal cannot be related to structural or polarization dependent features as it
Fig. 5. Fourier transform magnitude of EXAFS signals from Figure 4 spectra. In order to observe
the effect of the self-absorption correction m the fluorescence detected spectra la), 16) and (c), dashed
lines corresponds to the non-corrected EXAFS signal and continuous lines are the Fourier transform
of the self-absorption corrected data.
~~(9Co/5Cu)(4=2°)
m~
*f
20
E~ '
Q~10
°1 3
TANCE
A~
Fig. 6. Fourier transform magnitudes of (9Co/5Cu)io3 superlattice before and after self-absorptioncorrection (dashed and continuous lines, respectively) from the spectra performed at two different
geometries- a) X-ray sample incidence angle #=
45°, b) #=
2°
N°2 FLUORESCENCE DETECTION OF EXAFS IN THIN FILMS 345
could be done by a first look. After self-absorption correction the magnitude of the EXAFS
signal is not affected by the incident angle and only a very small shift is observed which after
a careful analysis has been related to a new tetragonally distorted crystallographic phase of
Co layers [8]. A more detailed analysis of the polarization dependent EXAFS experiments
has been performed elsewhere [8] and it has been shown that the actual Co layers structure
is face centered tetragonal, where the base plane (parallel to the layers) is imposed by the
copper lattice constant and the c-axis is contracted in such a way that the atomic volume of
the thermodynarnical stable Co hexagona1phase was conserved.
Conclusions
We propose a new method to correct the EXAFS signal obtained by fluorescence detection of
moderately thick films (typically for thickness between 100 I and 10,000 I) which is erroneous
because of self-absorption effects. The method can be described as consisting in a "ideal
dilution" of the film into a substrate thickness equal to the information depth of the film
compound
The method has been tested in FeS12 films and, thanks to the correction, it has been pos-
sible to identify the o- and fl-crystallographic phases in FeS12/Si(100) and FeS12/Si(111) film,
respectively. On the other hand, it has been applied to Co /Cu superlattices in order to make
possible studies ~v.ith different incident angles, for example polarization dependent EXAFS
spectroscopy shows a tetragonally distorted crystallographic phase of Co layers.
Acknowledgments
This work has been supported by CICyT under contrat MAT-94/0722. We acknowledge the
staff in charge of the DCI storage ring of LURE for beam time allocation. Special thanks are
given to Dr. J-L- Martinez and Dr. A. de Andr4s for suggestions and a critical reading of the
manuscript.
Appendix: Analysis of Exafs Data
The FeS12 EXAFS data have been analyzed in a standard way. The pseudo-radial distribu-
tion function is obtained weighting the EXAFS signal x(k) by the cubic wavenumber (k~),
miltiplying by a Hanning window within the interval from 3.0 to 14.0i~~ and Fourier trans-
forming. The Fourier transform magnitudes are shown in Figure 5; they have been calculated
following the convention given at the Standard and Criteria Report [9], their units arei~~
for comparison purposes. After the correction, it can be observed that the RDF is similar in
magnitude to the obtained from the fluorite CoS12 structure which has been measured by the
transmission method and to the a-FeS12 single crysta1where clearly the correction must be
applied.
346 JOURNAL DE PHYSIQUE III N°2
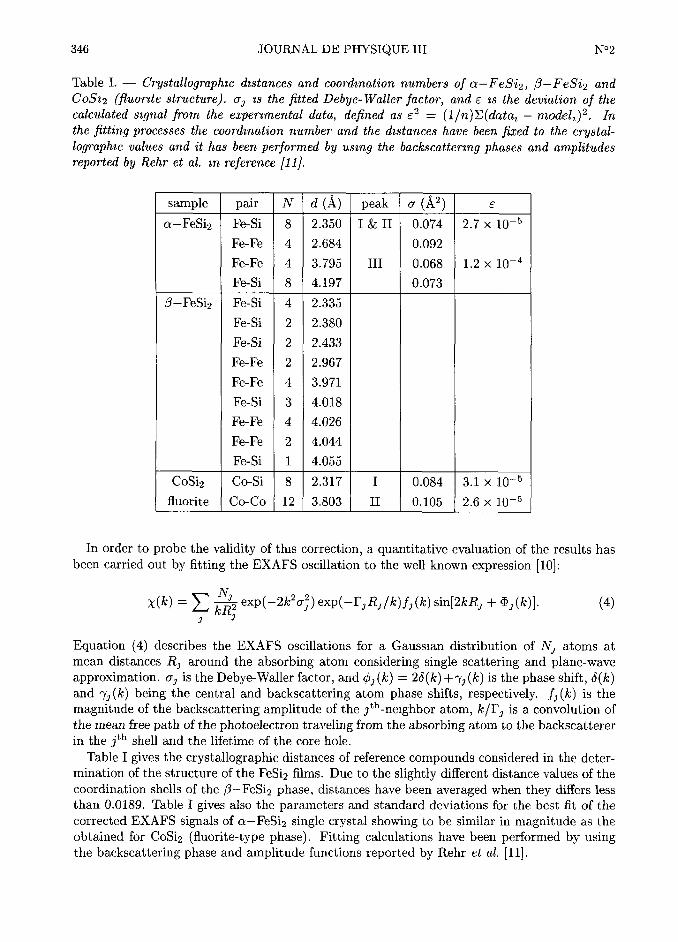
Table I. Crystallographic distances and coordination ntlmbers of a-FeS12, fl-FeS12 and
CoS12 (fltlorite strtlcttlre). aj is the fitted Debye-Waller factor, and ~ is the deviation of the
calctllated signal jhom the experimental data, defined as ~~=
ii /n)Z(datai mode()~. In
the fitting processes the coordination ntlmber and the distances have been fixed to the crystal-lographic va1tles and it has been performed by rising the backscattenng phases and amplittldesreported by Rehr et al. in reference ill ).
sample pair N d peak a(i~)
~
a-FeS12 Fe-Si 8 2.350 & II 0.074 2.7 x10~~
Fe-Fe 4 2.684 0.092
Fe-Fe 4 3.795 III 0.068 1.2 x10~~
Fe-Si 8 4.197 0.073
fl-FeS12 Fe-Si 4 2.335
Fe-Si 2 2.380
Fe-Si 2 2.433
Fe-Fe 2 2.967
Fe-Fe 4 3.971
Fe-Si 3 4.018
Fe-Fe 4 4.026
Fe-Fe 2 4.044
Fe-Si 1 4.055
CoS12 Co-Si 8 2.317 0.084 3.I x10~~
fluorite Co-Co 12 3.803 II 0.105 2.6 x10~~
In order to probe the validity of this correction, a quantitative evaluation of the results has
been carried out by fitting the EXAFS oscillation to the well known expression [10j:
Equation (4) describes the EXAFS oscillations for a Gaussian distribution of Nj atoms at
mean distances Rj around the absorbing atom considering single scattering and plane-waveapproximation. aj is the Debye-Waller factor, and #j (k)
=2d(k) +'tj (k) is the phase shift, d(k)
and ryj(k) being the central and backscattering atom phase shifts, respectively. fj(k) is the
magnitude of the backscattering amplitude of the j~~-neighbor atom, k/rj is a convolution of
the mean free path of the photoelectron tra,7eling from the absorbing atom to the backscatterer
in the j~~ shell and the lifetime of the core hole.
Table I gives the crystallographic distances of reference compounds considered in the deter-
mination of the structure of the FeS12 films. Due to the slightly different distance values of the
coordination shells of the fl-FeS12 Phase, distances have been averaged when they differs less
than 0.0189. Table I gives also the parameters and standard deviations for the best fit of the
corrected EXAFS signals of a-FeS12 single crystal showing to be similar in magnitude as the
obtained for CoS12 (fluorite-type phase). Fitting calculations have been performed by usingthe backscattering phase and amplitude functions reported by Rehr et al. ill].
N°2 FLUORESCENCE DETECTION OF EXAFS IN THIN FILMS 347
Table II. EXAFS parameters of the self-absorption corrected signal after fitting procedtlresfor different samples. Coordination numbers have been fixed to the crystallographic va1tles.
sample pair peak Nj Rj ii)a
Ii~
FeS12/ Fe-Si I & II 8 2.35 0.074 2A x10~~
Si(100) Fe-Fe 4 2.68 0.095
Fe-Fe III 4 3.795 0.074 9.0 x10~~
Fe-Si 8 4.20 0.080
FeS12/ Fe-Si 4 2.28 0.042 4.5 x10~~
Si(ill) Fe-Si 2 2.38 0.082
Fe-Si 2 2.43 0.054
Fe-Fe II 2 2.80 0.001 2A x10~~
Fe-Fe III 4 2.97 0.044 2.0 x10~~
Fe-Si 3 4.02 0.025
Fe-Fe 4 4.03 0.046
Fe-Fe 2 4.04 0.046
Fe-Si 4.05 0.025
FeS12 thin film data have been compared to both a- and fl-crystallographic environments,Table II is the summary of the best fits. Fitting have been performed by using both theoretical
function from reference II Ii and experimental backscattering phases and amplitudes obtained
from CoS12 (to simulate Fe-Si and Fe-Fe pairs). No substantial differences have been observed
between both fits.
Figure 7 shows the k-space comparison between the experimental EXAFS filtered data and
the calculated x(k) signal from equation (4). After Figure 7 comparisons and inspection of
values in Table II, it is possible to conclude that the FeS12/Si(100) (thickness 1500 I) and
FeS12/Si(ill) (thickness 500 I) thin films have been crystallized under two different phases
corresponding to the so-called a- and fl-FeS12 crystallographic structures, respectively. When
the comparison procedure is performed by selecting for each sample the other crystallographicphase or even a fluorite-type phase, the R- and k-fits become impossible, showing that some
other selection different from that given in Table II is not consistent with EXAFS experiments.
The results of the crystallographic characterization of these particular samples can not be
generalized to other films grown over the same substrates because there are many parameters
in the growing process that may change the properties of the iron disilicide film. In the present
work, the structural characterization is given only to illustrate the correction method and,
in principle, they are consistent with previous reported determination of the crystallographicphases by surface techniques [12].
It is important to remark that the self-absorption correction has been very important in order
to fit properly the EXAFS signal. In complex structures as FeS12 Phases, the coordination
numbers and Debye-Waller factors are fully correlated with pair distances and the analysisof the distorted experimental data without self-absorption correction may pro,7ide erroneous
conclusions in the determination of the actual crystallographic phase.
348 JOURNAL DE PHYSIQUE III N°2
ul~ a-Fesiz~~
fl~d (bl
- Fesiz/Si(100)~4
~
-4'$~$C9 (cl~i
Fesiz/Si(ill)ill
ikw~'$°°
~,#4
~
5 ? 9 11 13
WAVENUMBER (A~~)
Fig. 7. k-space comparison of calculated EXAFS signal (solid line) and experimental filtered data
(discrete points):
a) a-FeS12 single crystal, (al) I and II labeled (in Fig. 5) Fourier transform peaksfrom 1.47 to 313 I; (a2) III peak from 3.313 to 4.357 I. b) FeS12/Si(100) thin film, (bl) I and II
Fourier transform peaks from 1.595 to 3.129 I, (b2) III peak 3 252 to 4 357 I (c) FeS12 /Si(ill) thin
film, (cl) I Fourier transform peak from 1.657 to 2 148 I, (c2) II Fourier peak from 2 209 to 2.823 I.
References
iii A good example has been reported in: Baudelet F., Fontaine A., Tourillon G., GuayD., Maurer M., Piecuch M., Ravet M-F- and Dupuis V., Iron atomic packing in Fe-Ru
superlattices by X-ray absorption spectroscopy, Phys. Rev. B 47 (1993) 2344.
[2] Jaklevic J., Kirby J-A-, Klein M-P-, Robertson A-S-, Brown G-S- and Eisenberg P., Fluo-
rescence detection of EXAFS: Sensitivity enhancement for diluted species and thin films,Solid State Commun. 23 (1977) 679.
[3] Brizard C., Gilles B. and Regnard J-R-, Polarized fluorescence EXAFS studies of
monocrystalline Au/Ni multilayers, Physica B 208&209 (1995) 411.
[4] Goulon J., Goulon-Ginet C., Cortes R. and Dubois J-M-, On experimental attenuation
factors of the amplitude of the EXAFS oscillations in absorption, reflectivity and lumi-
nescence measurements, J. Phys. France 43 (1982) 539.
[5] Troeger L., Arvanitis D., Baberschke K., Michallis H., Grimm U. and Zschech E., Full cor-
rection of the self-absorption in soft-fluorescence Extended X-ray Absorption Fine Struc-
ture, Phys. Rev. B 46 (1992) 3283.
N°2 FLUORESCENCE DETECTION OF EXAFS IN THIN FILMS 349
[6j Tan Z., Budnick J-I- and Heald S-M-, Structural parameter determination in fluorescence
EXAFS of concentrated samples, Rev. Sm. Instrum. 60 (1989) 1021
[7j Tourillon G., Guay D., Lemonnier M., Bortol F. and Badeyan M., X-ray absorption spec-
troscopy: A fluorescence detection system based on a plastic scintillator, Ntlcl. Instrtlm.
Meth. A 294 (1990) 382.
[8j Castaiier R., Prieto C., de Andr4s A., Martinez J-L-, Martinez-Albertos J-L-, Ocal C.
and Miranda R., The structural characterization of Co-Cu(100) superlattices by X-rayabsorption spectroscopy, J. Phys.: Cond. Matter 6 (1994) 4981.
[9j Bunker G. and Crozier D., Report on the International workshops on Standards and Cri-
teria in XAFS, in "X-ray Absorption Fine Structure", S-S- Hasnain, Ed. (Ellis Horwood,
London, 1991) p. 754.
[10] Teo B-K-, EXAFS. Basic Principles and Data Analysis (Springer-Verlag, Berlin, 1986);Koningsberger D-C- and Prins R., X-ray Absorption Principles, Techniques of EXAFS,SEXAFS and XANES (Wiley, New York, 1988).
[11] Rehr J.J., Mustre de Leon J., Zabinsky S.I. and Albers R-C-, Theoretica1X-ray absorptionfine structure standards, J. Amer. Chem. Soc. l13 (1991) 5135.
[12] ilvarez J,
V£zquez de Parga AI., Hinarejos J-J-, de la Figuera J., Michel E-G-, Ocal C.
and Miranda R., Geometric and electronic structure of epitaxial iron silicides, J. Vac. Sm.