Fluorescence Detection of Ovarian Cancer in the NuTu-19 Epithelial Ovarian Cancer Animal Model using Aminolaevulinic Acid hexylester Frank Lüdicke 1 , Tanja Gabrecht 2 , Norbert Lange 2 , Georges Wagnières 2 , Aldo Campana 1 and Attila Major 1 1 Department of Obstetrics and Gynecology, University Hospital, Geneva, Switzerland 2 Institute of Environmental Engineering, Swiss Federal Institute of Technology (EPFL), Lausanne, Switzerland
Transcript
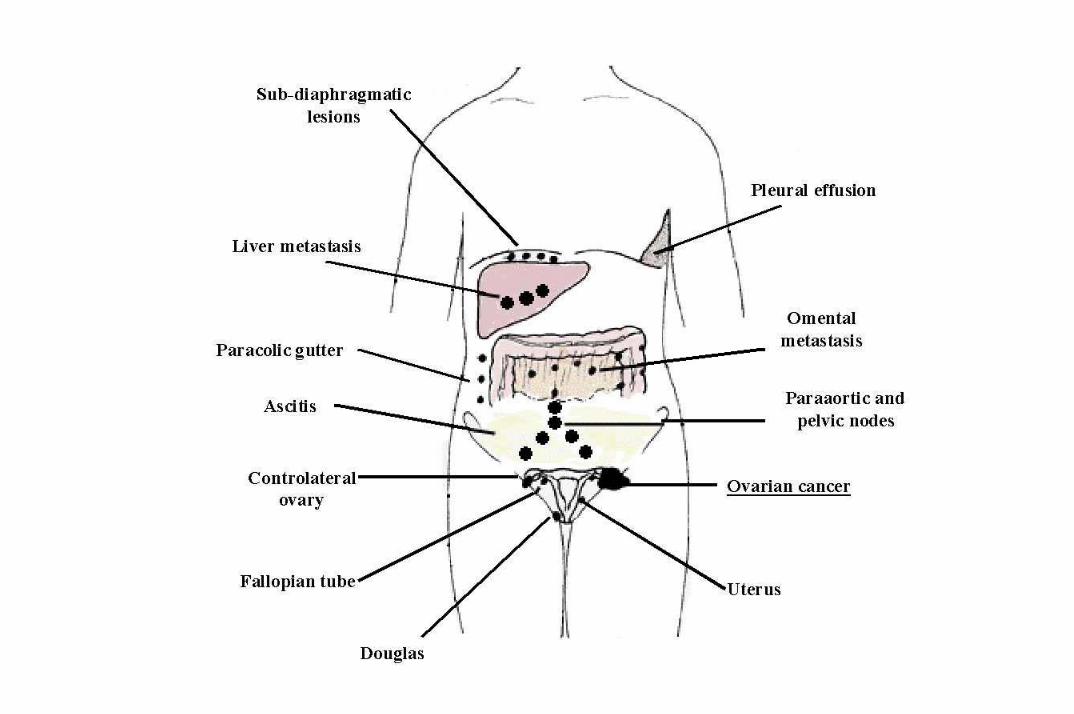
Fluorescence Detection of Ovarian Cancer in the NuTu-19 Epithelial Ovarian Cancer Animal Model using Aminolaevulinic Acid hexylester
Frank Lüdicke1, Tanja Gabrecht2, Norbert Lange2, Georges Wagnières2, Aldo Campana1 and Attila Major1
1Department of Obstetrics and Gynecology, University Hospital, Geneva, Switzerland2Institute of Environmental Engineering, Swiss Federal Institute of Technology (EPFL), Lausanne, Switzerland
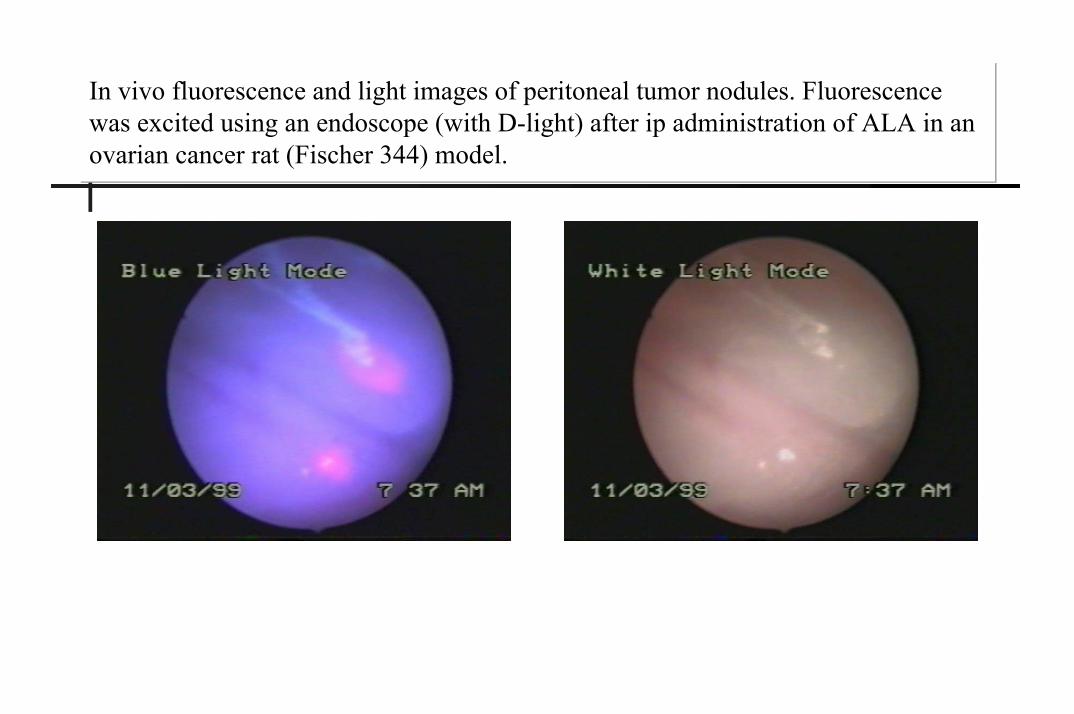
In vivo fluorescence and light images of peritoneal tumor nodules. Fluorescence was excited using an endoscope (with D-light) after ip administration of ALA in an ovarian cancer rat (Fischer 344) model.
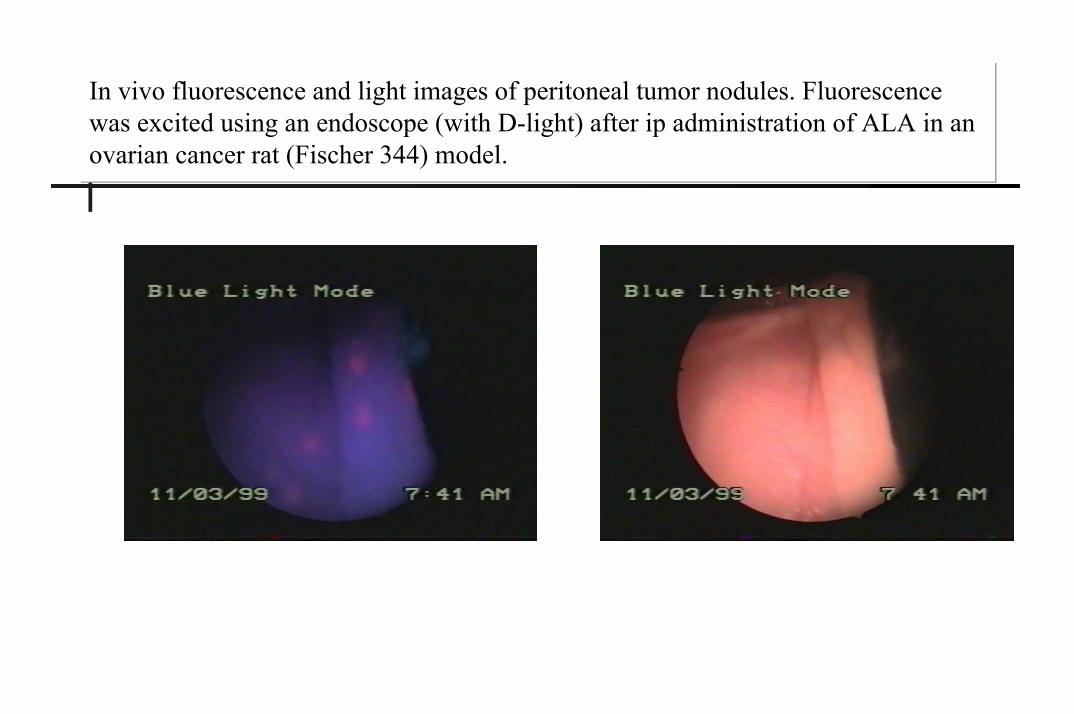
In vivo fluorescence and light images of peritoneal tumor nodules. Fluorescence was excited using an endoscope (with D-light) after ip administration of ALA in an ovarian cancer rat (Fischer 344) model.
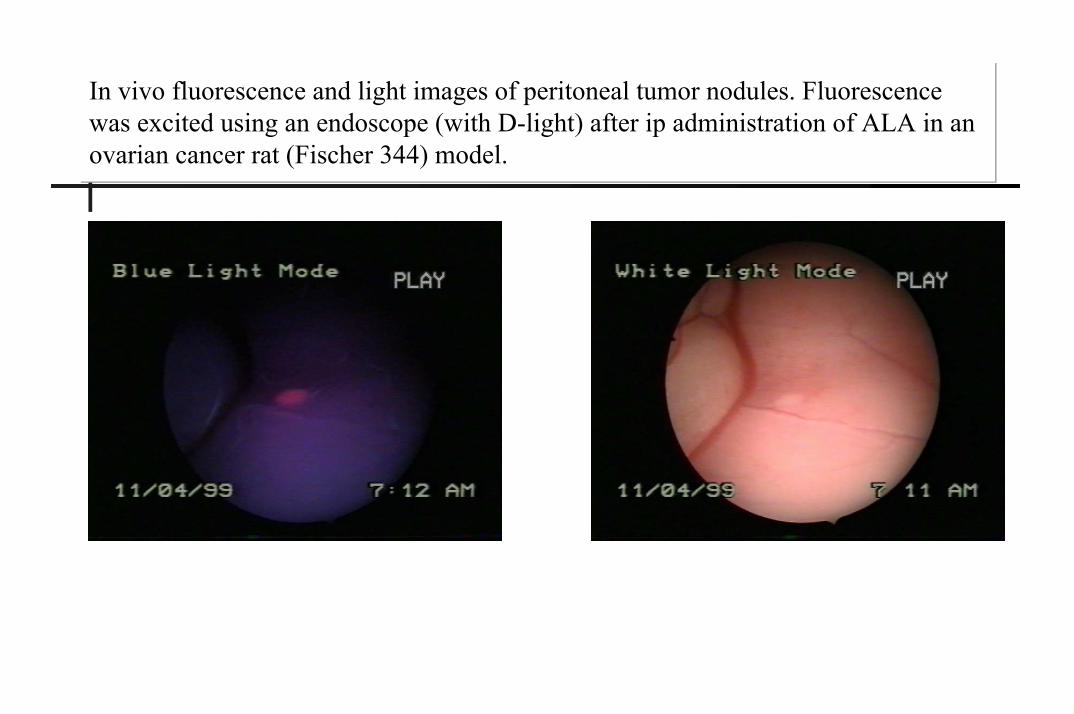
In vivo fluorescence and light images of peritoneal tumor nodules. Fluorescence was excited using an endoscope (with D-light) after ip administration of ALA in an ovarian cancer rat (Fischer 344) model.
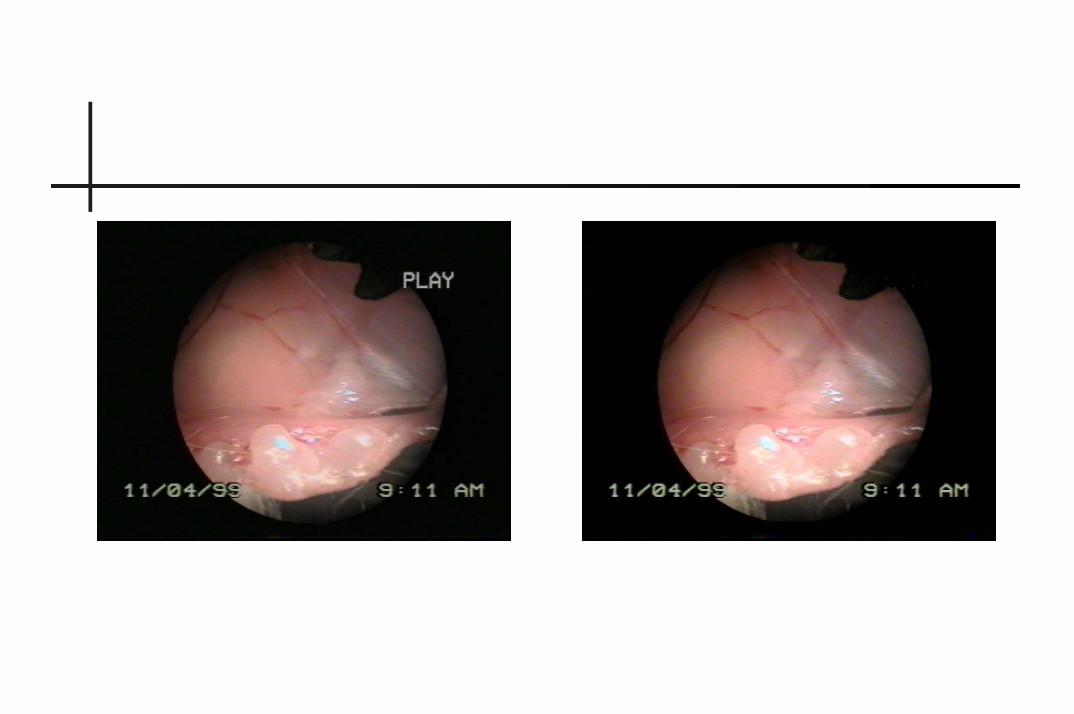
In vivo fluorescence and light images of peritoneal tumor nodules. Fluorescence was excited using an endoscope (with D-light) after ip administration of ALA in an ovarian cancer rat (Fischer 344) model.
In vivo fluorescence and light images of peritoneal tumor nodules. Fluorescence was excited using an endoscope (with D-light) after ip administration of ALA in an ovarian cancer rat (Fischer 344) model.
In vivo fluorescence and light images of peritoneal tumor nodules. Fluorescence was excited using an endoscope (with D-light) after ip administration of ALA in an ovarian cancer rat (Fischer 344) model.
In vivo fluorescence and light images of peritoneal tumor nodules. Fluorescence was excited using an endoscope (with D-light) after ip administration of ALA in an ovarian cancer rat (Fischer 344) model.
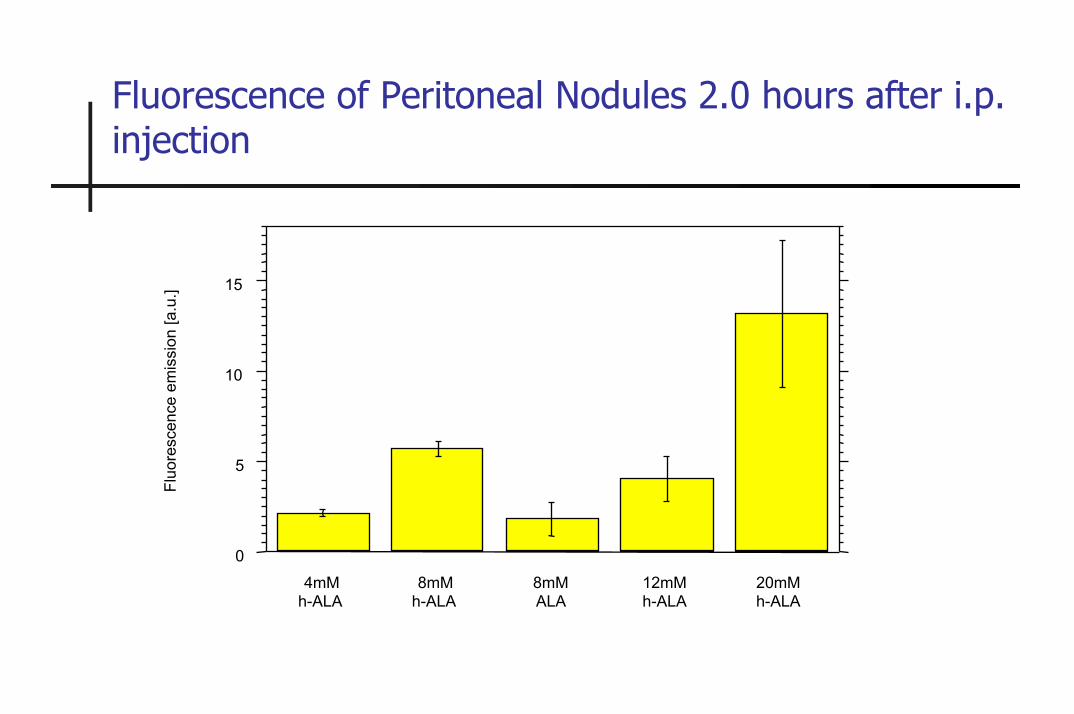
Fluorescence of Peritoneal Nodules 2.0 hours after i.p. injection
0
5
10
15
4mMh-ALA
8mMh-ALA
8mMALA
12mMh-ALA
20mMh-ALA
Fluo
resc
ence
em
issi
on[a
.u.]
Stage Description 5-year survival
Rate (%)
1. I Growth limited to the ovaries 61
Ia One ovary involved
no ascitis capsule intact
65
Ib Both ovaries involved 52
Ic Ascites present, or positive peritoneal washing, tumor
on the surface of the ovary
2. II Growth limited to pelvis 40
IIa Extension to the uterus and the tubes 60
IIb Extension to other pelvic tissues 38
IIc Like Ic
3. III Growth extending to abdominal cavity, including
IIIb Macroscopic abdominal implants, < 2 cm, negative nodes
IIIc Abdominal implants > 2 cm and/or positive nodes
4. IV Metastases to distant sites (positive pleural cytology,
parenchymal liver metastasis)
3
The 5-year survival rate of ovarian Cancer in Geneva
5-year cumulative lethality rate of gynecologic malignancies in Geneva
Interval Cervix uteri Corpus Uteri Ovary Other genitalorgans
Breast
0-1st 15.3% 16.3% 43.7% 28.0% 9.1%
0-2nd 27.3% 25.2% 59.9% 38.7% 16.1%
0-3th 33.3% 30.6% 67.8% 40.9% 23.7%
0-4th 38.2% 34.5% 71.1% 47.3% 30.2%
0-5th 42.3% 37.6% 72.2% 52.7% 35.1%
d a t a f r o m G e n e v a 1 9 7 0 - 1 9 9 4
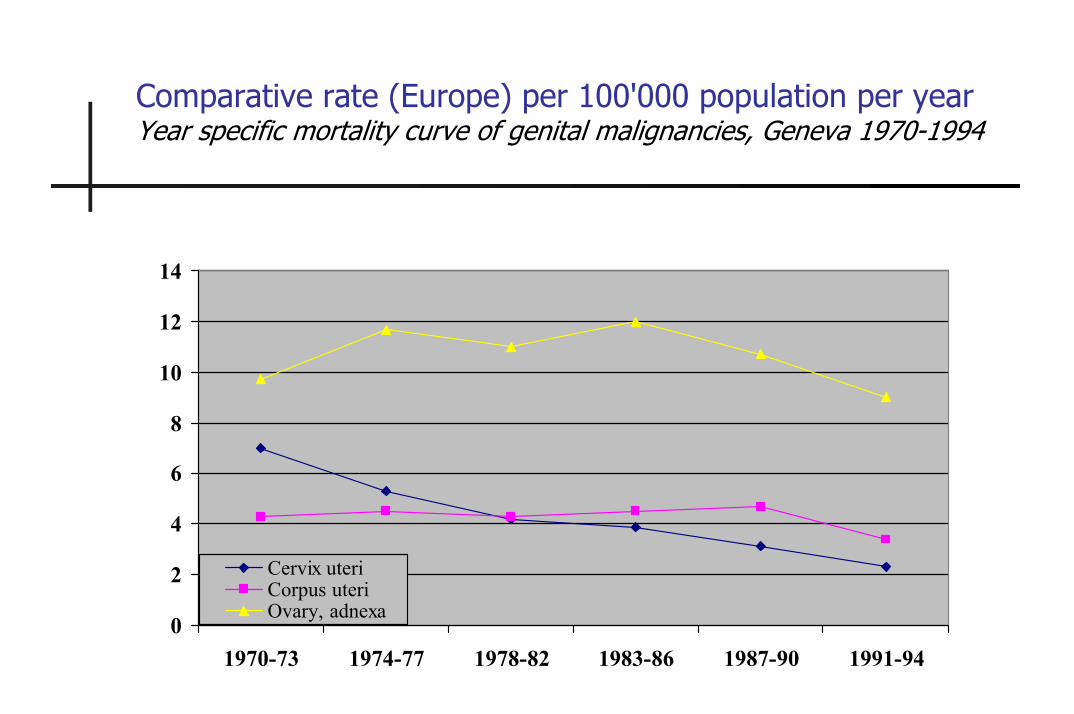
Comparative rate (Europe) per 100'000 population per yearYear specific mortality curve of genital malignancies, Geneva 1970-1994
0
2
4
6
8
10
12
14
1970-73 1974-77 1978-82 1983-86 1987-90 1991-94
Cervix uteriCorpus uteriOvary, adnexa
Pp IX Spectrum measured on Peritoneal Nodule
0
2
4
6
8
10
12
14
16
550 600 650 700 750
Measured DataCorrected Data
Fluo
resc
ence
em
issi
on [a
.u.]
Wavelength [nm]
Scattering and refraction of light
Rayleigh scattering
Mie scattering
Refraction
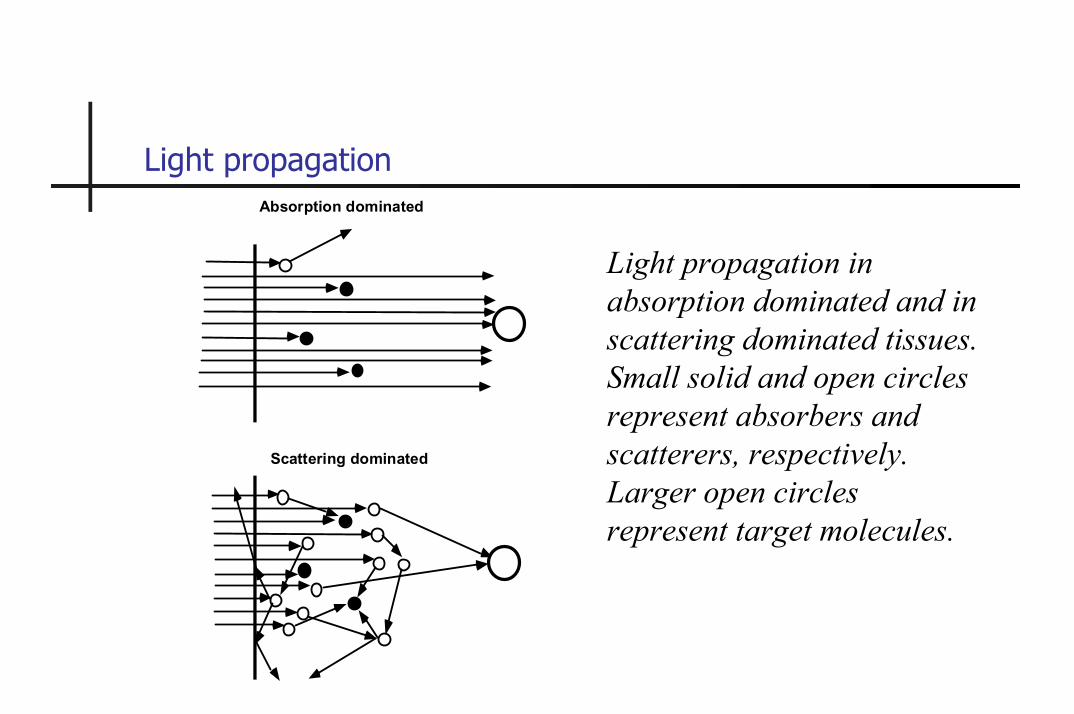
Light propagationAbsorption dominated
Scattering dominated
Light propagation in absorption dominated and in scattering dominated tissues. Small solid and open circles represent absorbers and scatterers, respectively. Larger open circles represent target molecules.
Absorption of water, melanin (broken line)and oxyhemoglobin (HbO2) (dotted line)
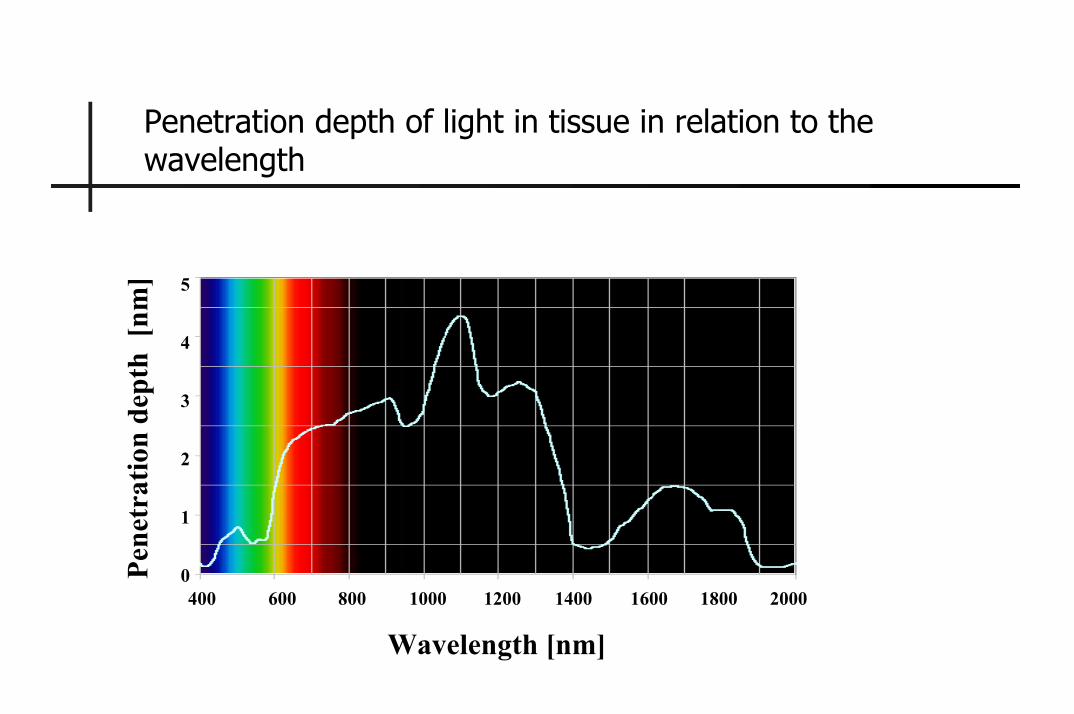
Penetration depth of light in tissue in relation to the wavelength
Wavelength [nm]
Pene
trat
ion
dept
h [n
m]
400 600 800 1000 1200 1400 1600 1800 2000
5
4
3
2
1
0
Excitation of photosensitizer and singlet oxygen generation
Singlet photosensitizer
Singlet photosensitizer
Triplet oxygen
Excited singlet photosensitizer Excited t riplet
photosensit izer Excited singlet oxygen
Opticallyforbidden Opt ically
forbidden
Opt icalexcitation
Fluorescence
Intersystem crossing Excitation of
singlet oxygen
Cytotoxic action
Target cell
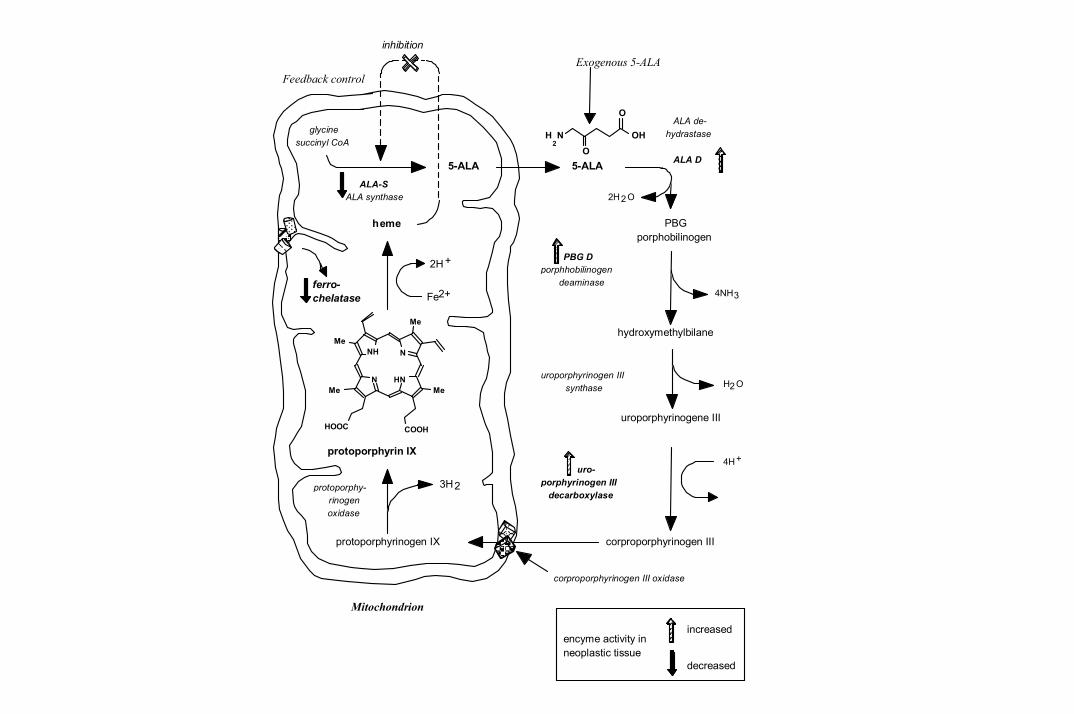
Chemical structure of 5-ALA and PpIX. Me represents methyl group
NHMe
Me
HOOC
N
Me
N
COOH
MeHN
glycinesuccinyl CoA
ALA-SALA synthase
5-ALA 5-ALA
PBGporphobilinogen
2H2 O
ALA de-hydrastase
ALA D
4NH3
hydroxymethylbilane
H2 O
uroporphyrinogene III
corproporphyrinogen III
4H+
protoporphyrinogen IX
protoporphyrin IX
3H2
heme
2H +
Fe2+
corproporphyrinogen III oxidase
protoporphy-rinogenoxidase
ferro-chelatase
inhibition
PBG Dporphhobilinogen
deaminase
uroporphyrinogen IIIsynthase
uro-porphyrinogen III
decarboxylase
encyme activity inneoplastic tissue
increased
decreased
OH
2N OH
O
NHMe
Me
HOOC
N
Me
N
COOH
MeHN
Exogenous 5-ALAFeedback control
Mitochondrion
Absorption (blue line) and fluorescence (pink line) spectrum of PpIX solved in DMSO. Values of absorption and fluorescence do not correspond to each
other
0
0.2
0.4
0.6
0.8
1
1.2
400 500 600 700 8000
0.2
0.4
0.6
0.8
1
1.2E
xcita
tion
[a.u
.]
Wavelength [nm]
Fluorescence [a.u.]
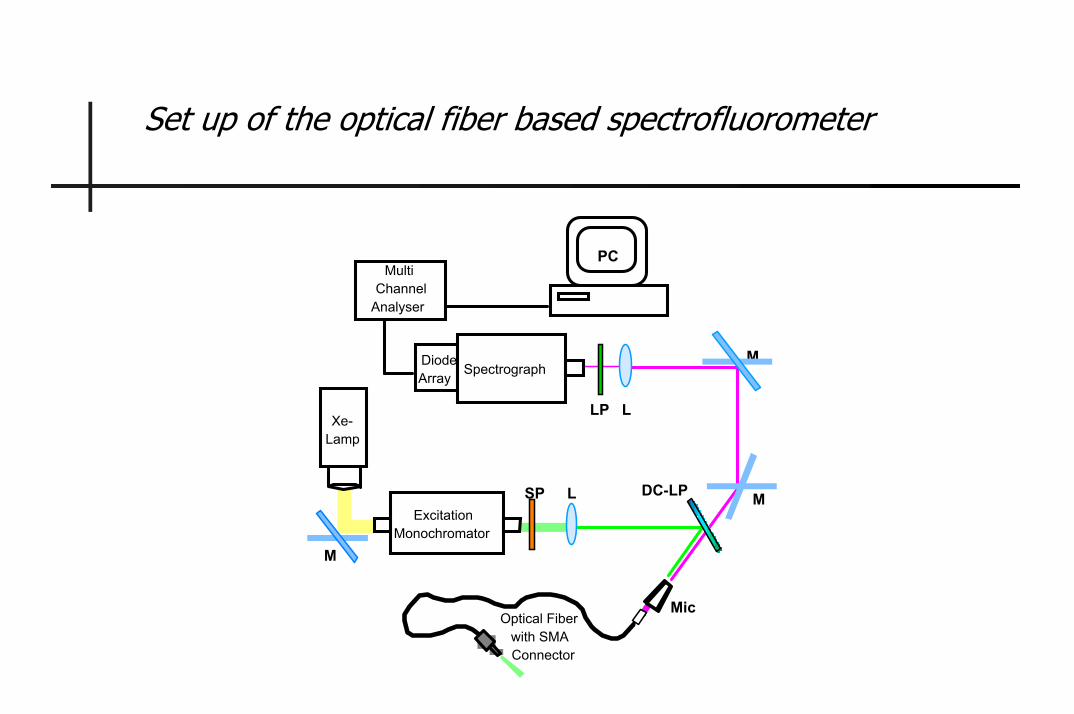
Set up of the optical fiber based spectrofluorometer
SP L
LLP
PC
Excitation Monochromator
Xe- Lamp
M
DC-LP M
M
MicOptical Fiber
with SMA Connector
Multi Channel
Analyser
SpectrographDiode Array
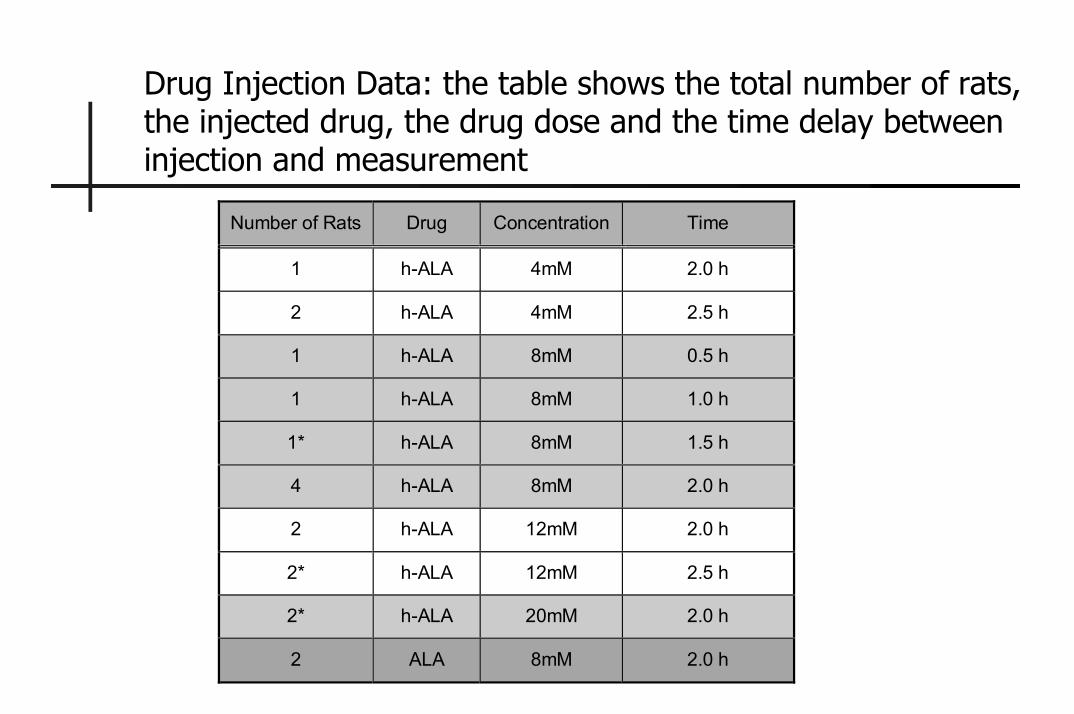
Drug Injection Data: the table shows the total number of rats, the injected drug, the drug dose and the time delay between injection and measurement
Number of Rats Drug Concentration Time
1 h-ALA 4mM 2.0 h
2 h-ALA 4mM 2.5 h
1 h-ALA 8mM 0.5 h
1 h-ALA 8mM 1.0 h
1* h-ALA 8mM 1.5 h
4 h-ALA 8mM 2.0 h
2 h-ALA 12mM 2.0 h
2* h-ALA 12mM 2.5 h
2* h-ALA 20mM 2.0 h
2 ALA 8mM 2.0 h
Reference signal
Optical fiber in measuring position on the omentum; the red fluorescing tissue at the “10-o’clock” position shows a part of the fluorescing intestine
D-Light Inspection
After spectrometric measurements the abdomen was inspected with the Storz D-Light system. The quantities and settlings of the metastases that could be observed in the white and blue light mode, respectively, were noted. Moreover pictures of the metastases in white light and blue light were recorded by the video system.
Fluorescence metastases in dependence on drug concentration
0
5
10
15
8 4 8 12 20
Fluo
resc
ence
[a.u
.]
ALADrug Concentration [mM]
n=4n=2
n=2
n=1
n=2
Fluorescence of peritoneal nodules in dependence on drug concentration 2 to 2.5 h after drug injection; if not noted otherwise values give concentration of h-ALA, n depicts the number of rats
0
2
4
6
8
10
12
8 4 8 12 20C
ontra
stDrug Concentration [mM]
ALA
n=2 n=3
n=4
n=2
n=1
0
5
10
15
8 4 8 12 20
Fluo
resc
ence
[a.u
.]
Drug Concentration [mM]ALA
n=2 n=3
n=4
n=2
n=1
Fluorescence emission of healthy (blue)
and nodular tissue (violet)
Physical contrast C of nodular to healthy tissue for different
concentrations of ALA and h-ALA
A
BBlue and white light mode images of peritoneal nodules taken 2.0 hours after i.p.injection of
8mM (A) and 20mM (B) h-ALA, respectively. The blue light image B shows clearly the
high red fluorescence of the healthy tissue that turned out to be difficult for detection of very
small nodules. On the other hand, fluorescence of the big nodule in picture B is higher than
in the nodules shown in picture A.
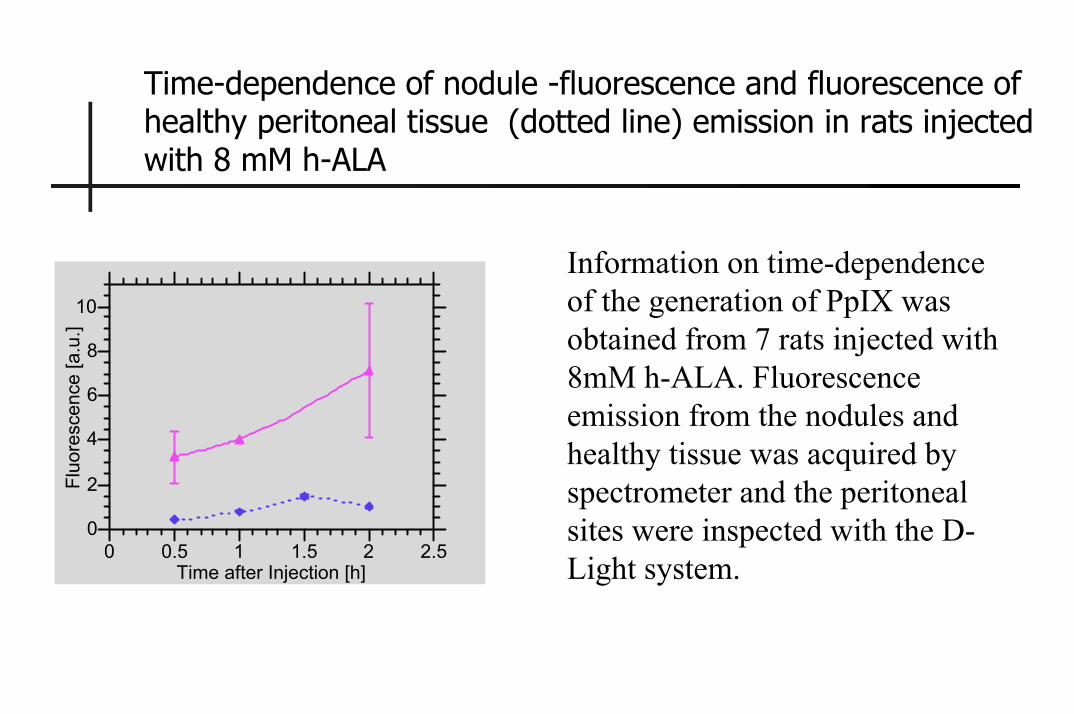
Time-dependence of nodule -fluorescence and fluorescence of healthy peritoneal tissue (dotted line) emission in rats injected with 8 mM h-ALA
Information on time-dependence of the generation of PpIX was obtained from 7 rats injected with 8mM h-ALA. Fluorescence emission from the nodules and healthy tissue was acquired by spectrometer and the peritoneal sites were inspected with the D-Light system.
0
2
4
6
8
10
0 0.5 1 1.5 2 2.5
Fluo
resc
ence
[a.u
.]
Time after Injection [h]
A
B
C
D
Blue and white light mode images of peritoneal nodules in rats sensitized with 8mM h-ALA taken at 0.5 (A), 1.0 (B) and 2.0 (C) hours after i.p. injection respectively. The increase of nodule fluorescence with time is apparent. Fluorescence achieved with ALA with a time delay of 2 h is comparable with that achieved with the same dose h-ALA after 0.5 h (D).
Concentration
[mM]
Time after inst. White light Bluelight Ratio
4 2.5 9 19 2.1
4 2.5 0 4 8
8 2.0 21 37 1.8
8 2.0 36 57 1.6
8 2.0 13 29 2.2
8 2.0 4 24 6
12 2.0 3 8 2.7
20 2.0 9 25 2.8
8 ALA 2.0 10 16 1.6
Numbers of metastases detected with white and blue light detection for different concentrations of h-ALA and ALA. The ratio of nodules detected in blue light to those detected with white light exceeds 1.6 for all drugs and all concentrations
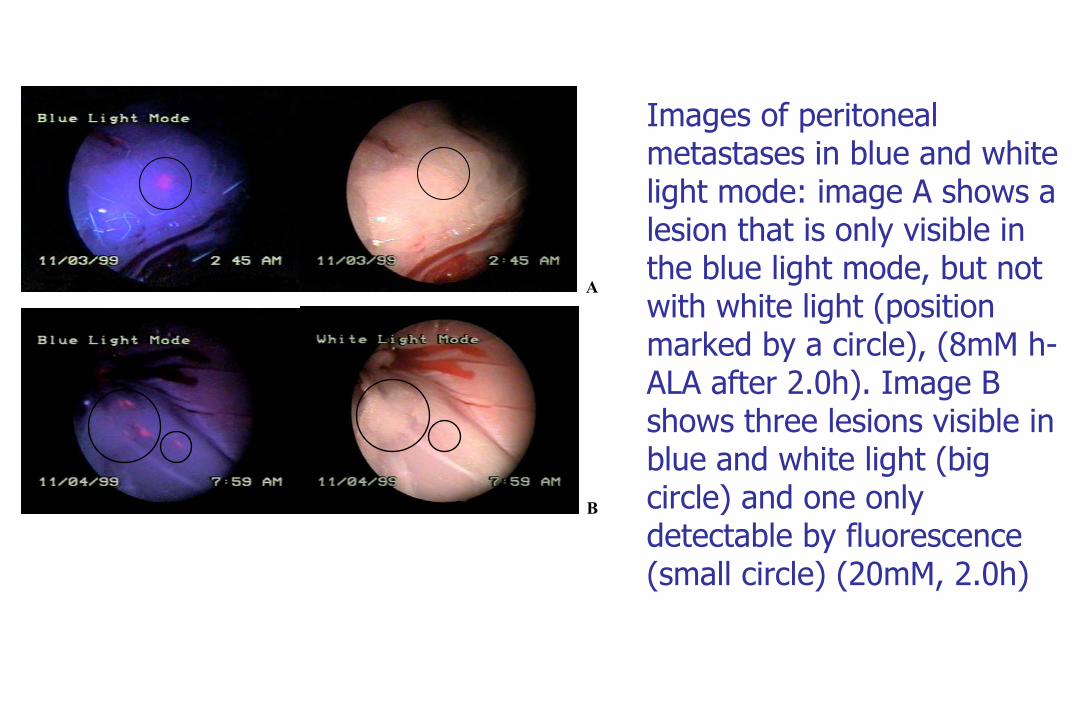
A
B
Images of peritoneal metastases in blue and white light mode: image A shows a lesion that is only visible in the blue light mode, but not with white light (position marked by a circle), (8mM h-ALA after 2.0h). Image B shows three lesions visible in blue and white light (big circle) and one only detectable by fluorescence (small circle) (20mM, 2.0h)
Small intestine
Blue and white light images of the small intestine. The
human intestine shows no native PpIX fluorescence that
was observed in the digestive organs of the rats.
Conclusion
The photosensitizer precursor Aminolaevulinic Acid hexylester (h-ALA) is suitable to detect micrometastases by means of photodiagnosis in the ovarian cancer animal model. Administered at the same dosage of 8 mmol and applied during the same time interval h-ALA results in higher PPIX fluorescence emission than its counterpart ALA. The clinical impact of these findings remain to be shown.
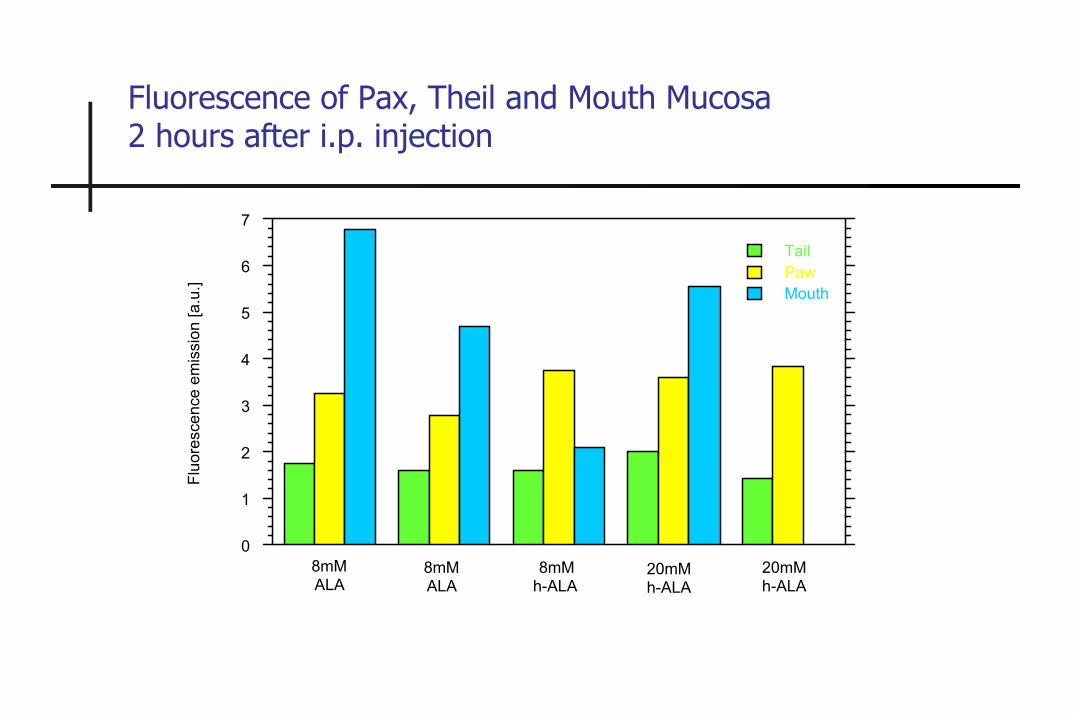
Fluorescence of Pax, Theil and Mouth Mucosa 2 hours after i.p. injection
0
1
2
3
4
5
6
7
8mMALA
8mMALA
8mMh-ALA
20mMh-ALA
20mMh-ALA
TailPawMouth
Fluo
resc
ence
em
issi
on [a
.u.]
Cervical cancer in situ tendancy in GenevaR
ate
per 1
0000
0
Year
Age
Tumor Registry of Geneva, May 1996
Block diagram of the Cancer Photodetection apparatus
VIDEOCOLORCAMERA
DUAL-VIEW INGATTACHEMENTOPTICAL
CHOPPER
FILTER
Xe LAMP
UTERUSOBJECTIVE
TUMOR
IMAGE GUIDE
OCULARCUBE BEAMSPLITTER
EYE
FUSED QUARTZFIBER
ACOUSTO-OPTICLIGHT MODULATORIRIS
PRISM 407-413 nmCW KRYPTON ION LASER (410 nm for HPD or PHOTOFRIN II)
DETECTIONOPTIC
REFLECTINGCHOPPER TIMING
CONTROLLER
BARRIERFILTER
CCD
CCD
REDFILTER
IMAGEINTENSIFIERGREEN FILTER
DICHROIC
A /D
CONVERTER
VIDEOMEMORY
D /ACONVERTER
OPERATOR(LOOKUP TABLES)
TV MONITOR
VIDEOOVERLAY
TUMOR
f1
f2
zoom
zoom
zoom
CW ARGON IO N LASER (488 nm for MAB – FLUORESCEIN)OR
f3
f3
mitochondrion
Glycine + Succinyl CoA
5-Aminolevulinic acid Ferrochelatasesynthetase (Feedback control) + Fe 2+
Prophobilinogen Prophobilinogen deaminasedeaminase + Uroporphyrinogen III cosynthase
Uroporphyrinogen I Uroporphyrinogen III Coproporphyrinogen III
Coproporphyrin I
Uroporphyrin I Coproporphyrin I Uroporphyrin III Coproporphyrin III
Cervicoscopy after topical ALA application
CIN lesion
CIN lesion
Cervix fluorescence under TDP(green-bleu)
Cervix white light examination
HE and Fluorescence microscopy
Fluorescence microscopy cross section of the cervix with low-grade
CIN lesionHE colored cross section of the
cervix with CIN lesion
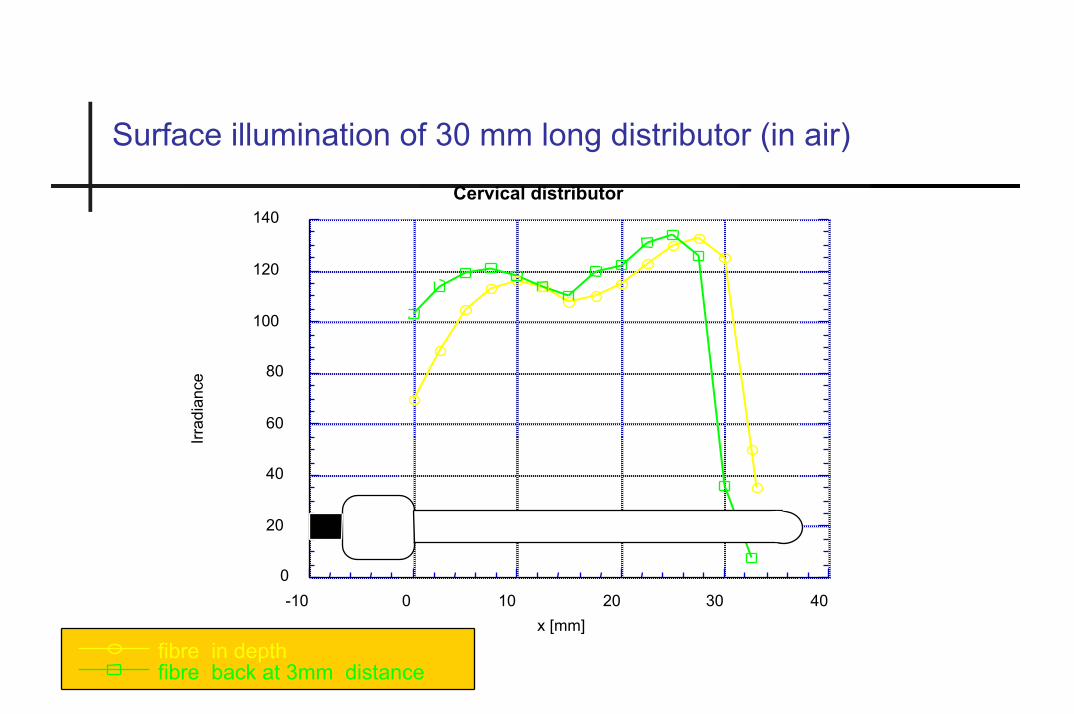
Surface illumination of 30 mm long distributor (in air)
0
20
40
60
80
100
120
140
-10 0 10 20 30 40
Cervical distributorIrr
adia
nce
x [mm]
fibre in depthfibre back at 3mm distance
Light distributor for PDT in the cervix
PolymerOptical Fiber Ø 1mm
Delrin
Stainless steel tubeFiber jacket
MirrorTeflon tube
200 mm 10 mm 23,33,or 43 mm
Ø 3.5 mm
Ø 10 mmØ 3.5 mm
Light diffuser
Instrumentation set-up for the fluorescence imaging tumor depth profiling
COMPUTER
WHEELequipped withthreeBANDPASSFILTERS
Xe LAMP
OBJECTIVE
CIN
OCULARCUBE BEAMSPLITTER
EYE
CCD
REDFILTER650-730nm
IMAGEINTENSIFIER
MONITOR
ZOOM
ENDOSCOPE
CervixTissue
MULTISPECTRAL
FLUORESCENCE SOURCEEXITATION LIGHT
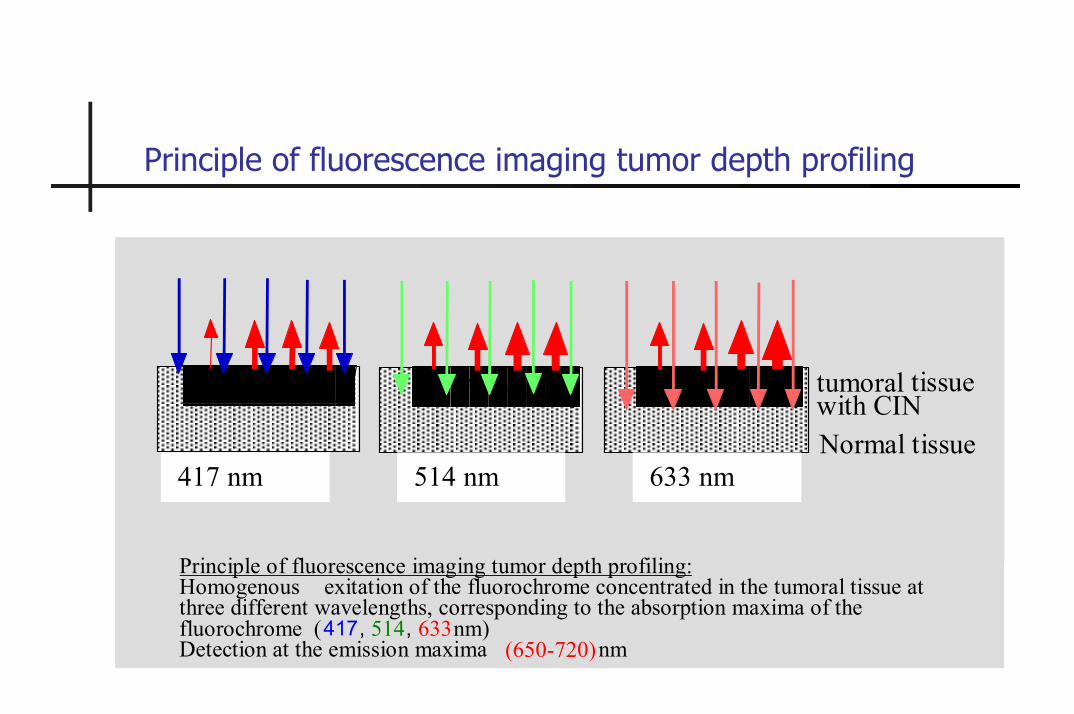
Principle of fluorescence imaging tumor depth profiling
Normal tissue
tumoral tissuewith CIN
417 nm 514 nm 633 nm
Principle of fluorescence imaging tumor depth profiling:Homogenous exitation of the fluorochrome concentrated in the tumoral tissue atthree different wavelengths, corresponding to the absorption maxima of thefluorochrome (417, 514, 633nm)Detection at the emission maxima (650-720)nm
5-Aminolevulinic acid and PPIX concentrations after oral administration (40 mg/kg b.w.). [Rick et al. 1997]
time after 5-ALA application [h]0 10 20 30 40 50 60
0.0
0.2
0.4
0.6
0.85-
ALA
con
cent
ratio
n [m
g/l]
0
2
4
6
8
10
12
PPIX5-ALA
PP
IX c
once
ntra
tion
[mg/
l]
Fluorescence intensity after oral administration of 5-aminolevulinic acid (40 mg/kg). [Rick et al. 1997]
time after 5-ALA application [h]0 10 20 30 40 50 60