enerally speaking, to plan a conservation interven-ion correctly it is necessary to perform a carefuliagnosis of the state of conservation of the artifact.1his requires knowledge of all the materials that areresent in the artifact, i.e., original materials �stoner wood, mortars or plasters, pigments and binders,tc.�, new formation materials derived from deterio-ation processes �inorganic salts, oxidized com-ounds, microorganisms�, and restoration materialshat have been applied to the surfaces throughout theenturies �inorganic and organic treatments�. Such
thorough investigation can usually be achievedhrough wide microdestructive sampling followed byxtensive laboratory analyses. Although it is effec-
D. Comelli, C. D’Andrea, G. Valentini, and R. [email protected]� are with the Dipartimento diisica, del Politecnico di Milano and the Istituto di Fontonica eanotechnologie del Consiglio Nazionale delle Ricerche, Piazzaeonardo da Vinci 32, I-20133, Milan, Italy. C. Colombo and L.oniolo are with the Istituto per la Conservazione e la Valorizza-ione dei Beni Culturali, Consiglio Nazionale delle Ricerche, Sezi-ne di Milano “Gino Bozza,” Politecnico di Milano, Piazza Leonardoa Vinci 32, I-20133, Milan, Italy.Received 28 April 2003; revised manuscript received 10 October
ive, this procedure has the drawback of relying onaterials removed from the artifact. It is particu-
arly undesirable for artworks of great artistic impor-ance or for large surfaces, such as mural paintings,hich require taking a great number of samples toield significant knowledge of the constituent mate-ials.
Even though limited microsampling is generallynavoidable, nondestructive analyses that can beerformed in situ give invaluable support to the di-gnostic process. For this reason, in recent years areat effort has been devoted to transforming labora-ory techniques into portable equipment for in situeasurements.2–8 Among the techniques that can
e applied in situ, vibrational spectroscopy,4,9 laser-nduced breakdown spectroscopy,7,10 and x-ray spec-roscopy2 constitute powerful tools for the preciseharacterization of materials that are present inorks of art. They provide information at molecularnd atomic levels; yet they are limited to analysis ofsingle point.Imaging methods are certainly more effective than
he methods just described for precise and quick in-estigation of complex and large artifacts. In par-icular, diffuse reflectance imaging is suitable mainlyor the analysis of pigments,7,8,11 whereas fluores-ence imaging is one of the most interesting tech-iques for the investigation of organic compounds.12
n fact, it is well known that many organic materials
how fluorescence emission after being excited by ul-raviolet radiation. Even if optical imaging tech-iques are easily applied and allow one to investigatewide area in a short time, extraction of diagnostic
nformation from reflectance or fluorescence imagess not straightforward. With respect to fluorescence,hich is the main topic of this study, the emission is
ypically due to a mixture of materials; furthermore,ts properties are often influenced by the molecularnvironment. Fluorescence spectroscopy alone can-ot provide an exhaustive identification of a sample,s the emission spectra are characterized by ratherroad peaks. Yet temporal characteristics, togetherith the intensity of the emission and its spectral
eatures, supply information that can assist in theiscrimination and identification of organic com-ounds that are present on a surface.As a general comment, it is worth noting that no
ne technique alone can solve the complex problemsncountered in cultural-heritage analysis, whereashe synergistic combination of in situ measurementsnd laboratory techniques allows one to gather thenformation required for a well-designed conserva-ion intervention.
At present, UV fluorescence examination duringonservation works is usually performed in situ withlow-pressure mercury lamp with a dark screen thatbsorbs visible light �Wood lamp�. The emitted UVadiation is relatively broadband. In fact, the wave-ength range is 340–380 nm. A simple visual in-pection of the emission allows one to discover theresence of fluorescent compounds on surfaces androvides only a rough discrimination between them,ased on the various colors of the emission. Thus itannot be considered a measurement procedure, andts effectiveness relies completely on the skill andxperience of the restorers. The photographic re-ording of fluorescence emission carried out with alm camera or, more recently, with a digital camera
s a step forward with respect to visual inspection.11,13
et it does not provide great improvement in thedentification and quantification of organic com-ounds. More-objective parameters, such as fluo-escence intensity, spectrum, and lifetime, and aell-designed laboratory analysis of microsamplesre really required for this purpose.Starting from these considerations, in this papere propose the application of a fluorescence-lifetime
maging �FLIM� system for the investigation of sur-aces of artistic interest.
In the past decade FLIM has been successfullypplied in several fields, including combustion anal-sis,14 fluorescence microscopy,15 medical diag-osis,16,17 and genetic investigations.18,19 FLIM isased on measurement of the temporal properties ofhe fluorescent emission in every point of a sample,hus permitting reconstruction of the lifetime mapf the region that is analyzed. FLIM combines thedvantages of time-resolved spectroscopy withhose of fluorescence imaging. In fact, the lifetimerovides effective discrimination among differentuorophores, whereas the imaging capability of the
LIM allows one to identify the locations of fluores-ent materials in the field of view.A FLIM apparatus that is capable of nanosecond
emporal resolution was originally developed in theaboratory for tumor detection16 at the Dipartimentoi Fisica del Politecnico di Milano and was recentlysed to analyze Renaissance frescoes. The appara-us was combined with a portable spectrometer toecord fluorescence spectra at points of interest. Inact, spectra provide complementary information toifetime measurements, thus enhancing the discrim-nation capability of the FLIM technique.
The information obtained with the FLIM system islso combined with measurements performed in theaboratory on microsamples taken from the painting.ptical microscopy, scanning-electron microscopyquipped with x-ray spectrometry, and Fourier-ransform infrared spectroscopy �FTIR� are applied.nalytical measurements give a synergistic effecthen they are performed together with FLIM mea-
urements: In fact, the precise chemical identifica-ion of the materials provided by analyticalechniques can be extrapolated to the whole exten-ion of the artwork because of use of the FLIM appa-atus, without the need for extensive sampling.
FLIM is intended mainly to give imaging capabil-ties to material investigations carried out throughaboratory measurements. When one is dealingith the large surfaces that are typical of wall paint-
ngs, many important advantages are obtained by usef FLIM: The need for microsampling is stronglyeduced, fluorescent spots or areas that correspond torganic contaminants or intentionally added treat-ents can be identified on the basis of fluorescenceeasurement only, and the restorers can direct their
ttention to fluorescent details. Furthermore,LIM can support monitoring activity, which is cru-ial to guaranteeing good control of the restorationrocedures.
. Materials and Methods
. Fluorescence Experimental Setup
he experimental setup is shown schematically inig. 1. The fluorescence imaging system used forhis study is similar to one already described by Cu-eddu et al.16 It is based on a time-gated intensifiedCD camera �ICCD225, Photek, St Leonards-on-Sea,ngland� that exhibits a minimum gate width of 10s. One acquires a sequence of images by activatinghe gate of the image detector at various delays withespect to excitation pulses. In this way the tempo-al behavior of the fluorescence emitted by each pixels recorded. Then, by applying a suitable fitting pro-edure, which is described in Subsection 2.B below,ne can construct a fluorescence-lifetime map of theeld of view.The UV �� � 337 nm� excitation light is provided bynitrogen laser �LN203C Laser Photonic, Orlando,
la.� that generates 1-ns long pulses, synchronousith the gated camera, at a repetition rate of 50 Hz
European video rate�. The excitation beam is cou-
poakpcSssi
�Nbfltsa5tlbepcecefiebtv�libt
g0lflttcseSM
B
IFospsa
btmeflpwtm
ra
fla
wdTro
FLscs
led to an optical silica fiber that has a core diameterf 600 �m and is delivered to the frescoes in a circularrea of �20-cm diameter. The typical irradiance isept below 3 �W�cm2 to prevent any damage to theiece of art. A homemade trigger circuit and a pre-ision delay generator �DG535, Stanford Researchystems, Sunnyvale, Calif.� permit the temporalampling of the emitted fluorescence. The wholeystem was assembled in a portable rack of approx-mate dimensions 60 cm � 60 cm � 70 cm.
A time-resolved optical multichannel analyzerOMA; EG&G Princeton Applied Research, Princeton,.J.� completes the experimental apparatus. It isased on a reflective diffraction grating that measuresuorescence spectra from 400 to 800 nm with a spec-ral resolution of 1 nm. The detector is an intensifiedilicon photodiode array that provides amplificationnd temporal gating. Three possible gate widths, i.e.,, 10, and 20 ns, can be used, which allow one to changehe temporal gate to increase the collected signal inow-light conditions. The excitation light is providedy a second nitrogen laser �VSL-337ND-S, Laser Sci-nce, Inc., Franklin, Mass.�. The laser beam is cou-led to a silica fiber bundle, which is put in gentleontact with the sample through a metallic spacer cov-red with a Teflon ring. The bundle is made from aentral fiber �diameter, 600 �m�, which delivers thexcitation light to an area 3-mm diameter, and from 20bers arranged in 2 circular rings, which collect themitted fluorescence. The spacer maintains the fi-ers at a suitable distance from the sample to optimizehe superposition of the excited area with the field ofiew of the collection fibers. Finally, a cutoff filterKodak Wratten #2E� is used to remove the excitationight that otherwise would lead to a second-order peakn the red region of the spectrum. A trigger unitased on a fast photodiode permits the synchroniza-ion of the detector with the laser pulses. A delay
enerator that is capable of delays from 0 to 100 ns in.5-ns steps completes the OMA apparatus. To ana-yze the kinetics of the emission, one acquires severaluorescence spectra after different delays with respecto the excitation pulses and processes them accordingo the algorithms described below. A PC automati-ally sets all the instrumental parameters through apecific software implemented within the Labwindowsnvironment �National Instruments, Austin, Tex.�.oftware for off-line analysis has been developed inatlab language �MathWorks, Natick, Mass.�.
. Data Analysis
n a typical measurement performed either with theLIM system or with the OMA, several time samplesf the fluorescence emission are acquired in the x, ypace or in the wavelength space, respectively. Theroblem of data analysis and curve fitting is much theame for the two systems and has been handled withunified approach.As was shown elsewhere,20 fluorescent systems can
e modeled with difficulty as monoexponential owingo the simultaneous presence of several fluorescingolecules in the same specimen. Nevertheless,
ven in the case of multiexponential behavior of theuorescence emission, a linear fit of acquired dataermits the reconstruction of an effective lifetime,hich is useful for discriminating among various ma-
erials or for finding the dominant component in aixture.20,21
Assuming a monoexponential behavior of the fluo-escent emission f that has an effective lifetime � andmplitude A:
f �t� � A exp�t���, (1)
uence H acquired in each element of the data arrays a function of delay d is given by
H�d� � C d
d�w
f �t�dt
� CA��exp�d�� � exp�
d � w� ��
� CA��1 � exp�w� ��exp�
d�� , (2)
here w is the gate width and C is a constant thatepends on the efficiency of the detection system.he effective lifetime � and the amplitude A can beeconstructed by a least-mean-square fit performedn N time samples, which leads to the equations
n the specific cases of FLIM and OMA measure-ents, both � and A are arrays that represent either
he spatial maps of the fluorescence lifetime and am-litude of the sample in the field of view of the gatedamera �two-dimensional arrays� or the wavelength-ependent fluorescence lifetime and amplitude in apecific spot of the sample pointed to by the fiberundle �one-dimensional arrays�.It is worth noting that the data sets acquired with
oth instruments could be also fitted with a biexpo-ential model. Nevertheless, the resultant FLIMaps or OMA plots would be much noisier as a result
f a nonlinear fit carried out on a few time samples.oreover, the biexponential model is still a rough
pproximation of the actual fluorescence decay, andhe analysis of two lifetime maps would lead to am-iguous interpretation. In fact, the contributions ofarious fluorophores will be combined in the twoaps, depending on the concentrations of the fluoro-
hores. The effective lifetime map reconstructed onhe basis of a monoexponential model, however,ields strong contrast for discrimination of differentompounds, as has been shown also by other researchroups.20 Finally, processing of a high-resolutionmage with linear fitting algorithms requires a feweconds. Therefore such algorithms would be alsouitable for real-time data processing.The outcome of the FLIM analysis is two arrays,
�x, y� and A�x, y�. The first reveals areas with dif-erent chemical compositions and the second givesnformation on the relative abundance of the fluores-ent materials in the field of view. Merging the twoaps creates a third one, named the HSV map.his map is based on the HSV �hue, saturation, andalue� color model.22 The luminance of each pixel isorrelated with the fluorescence amplitude, whereashe hue represents the lifetime of the pixel, with theaturation maintained constant at 0.8. In this wayhe HSV map allows one to easily associate the func-ional information provided by the lifetime �hue� tohe morphology of the analyzed region given by theuorescence amplitude �value�.With respect to spectral measurements,avelength-dependent fluorescence amplitude A���
imply represents the fluorescence spectrum of theample; it offers a means to identify an organic ma-erial, even though the typical broadness of fluores-ence spectra restricts its discrimination capability.ore interestingly, wavelength-dependent fluores-
ence lifetime ���� gives information on the heteroge-eity of the sample. In most the cases the sameecay time is recovered at any wavelength, indicatinghomogeneous material. In other cases, different
uorescence lifetimes in two regions of the spectrumutline the presence of a mixture of distinct sub-tances.A final critical analysis of this fitting procedure
hould be provided hereafter: a monoexponentialecay is enforced during the fitting of both delayedmages and spectral data, even in presence of mul-iexponential behavior of the fluorescence. As a con-equence, the effective lifetimes measured by the twonstruments differ because they depend on instru-
ental parameters �e.g., gate width and shape�. Ac-ually, we are not concerned with accuracy inbsolute-lifetime measurements, whereas we payore attention to the variation of effective lifetime asfunction of position for FLIM measurements or as a
unction of wavelength for OMA measurements.hat is most important in our measurements is the
eproducibility of the results, which depends mainlyn the time jitter of the instruments. Careful con-rol of the timing in our devices guarantees a tempo-al resolution of �0.2 ns for both the FLIM and theMA setups.
. Measurement Protocol
irst we analyze the painted surfaces with a Woodamp to easily find the regions where most fluorescent
aterials are present. In each of these regions aLIM measurement is performed; the typical area
maged by the intensified camera has a diameter of0 cm, even though, when necessary, smaller regionsre imaged. The gate of the image detector is set to00 ns, wide enough to maximize the signal-to-noiseatio of the acquired images. A further increase ofhe temporal window is useless, because the fluores-ence emission of typical organic materials, charac-erized by lifetime values of some nanoseconds, haslmost completely decayed after this time. A set of2 images is recorded that corresponds to delays of 0,, 3, 5, 8, 10, 12, 15, 20, 30, 40, and 50 ns with respecto excitation pulses.
From the reconstructed FLIM maps it is easy toocate the regions on the painted surfaces where or-anic compounds are present and it is possible toistinguish some regions that show similar charac-eristics. For each homogeneous region a time-esolved fluorescence spectrum is recorded and,henever possible, a microsample �2 mm � 3 mm� is
aken as well. The OMA gate is set to 5 ns, and theuorescence decay is sampled in 1-ns steps.Collected samples are studied in the laboratory
hrough an optical microscope �Leitz Ortholux�, acanning-electron microscope �JEOL 5910LV�, and aourier-transform infrared spectrometer �Nicoletexus�.
. Field Experiment
he mural paintings that were analyzed are locatedn the vault of a quite famous Renaissance church,he Collegiata of Castiglione Olona, near Varese, It-ly. The artwork, depicting events in the life of theirgin, was painted by Masolino da Panicale in theid-fifteenth century. In the twentieth century the
aintings were restored twice, and in 1972 they wereetached from the wall and transferred onto a canvasupported by a rigid glass-fiber substrate. The sur-ace is deeply damaged, with large areas of loss or
rd
marPoonav
it
5
TswcIAavtia
daatatflpaavi
ip��mnttaai
csTt
to
Frm
aising of painting layers, gypsum efflorescences, andeteriorated stucco joints.Consequently the fluorescence analysis was aimedainly at revealing surface decay phenomena as well
s the presence of residues of organic materials thatesulted from treatments carried out in the past.articular attention was also devoted to analysis ofrnamental elements such as gilded reliefs; a thor-ugh study, in situ and in the laboratory, of the tech-ique adopted by the artist for realizing the haloes ofngels and saints and other objects such as gifts andases was carried out.The fluorescence measurements allowed us to min-
mize the sampling and to characterize large areas ofhe painted surface, whose total extent is �50 m2.
. Results and Discussion
he first result refers to the analysis of the decaytate of the painted walls: we determined that thehole surface is permeated with a mixture of calcium
aseinate, gypsum, and poly�vinyl acetate� �PVA�.n Fig. 2 a picture of a damaged surface is shown.s the picture reveals, large areas of painted layersre lacking, and an oblique stucco joint is clearlyisible. In Figs. 3�a� and 3�b�, fluorescence ampli-ude and lifetime maps are shown. In Fig. 3�c� thenformation provided by the two maps is combined in
HSV map.From an analysis of these maps the presence of
ifferent regions in the field of view is evident. Thereas where some painting layers are still presentppear to be dark in the amplitude map, revealinghe inorganic nature of the pigments, which simplyct as absorbers of UV radiation. Areas from whichhe painting layer is lacking, however, show a stronguorescence that is due to the plaster. Actually,lasters are typically made from a mixture of limend sand, materials that are not supposed to showny fluorescence. Thus this unexpected emission re-eals the presence of an organic compound permeat-ng the painted surface.
More interestingly, the lifetime map allows one to
Fig. 2. Picture of a damaged painted surface.
dentify three different fluorescent compounds: thelaster, characterized by the shortest decay timenear 8 ns�; the oblique joint, with a longer lifetime9.7 ns�; and circular spots, not visible in white illu-ination, characterized by the longest lifetime �10.5s�. The shapes of these fluorescent spots, as well asheir positions along the joint, lead us to attributeheir presence to the activity of restorers, who prob-bly used nails to fix the panels to the rigid supportnd masked them with stucco made from organic andnorganic compounds.
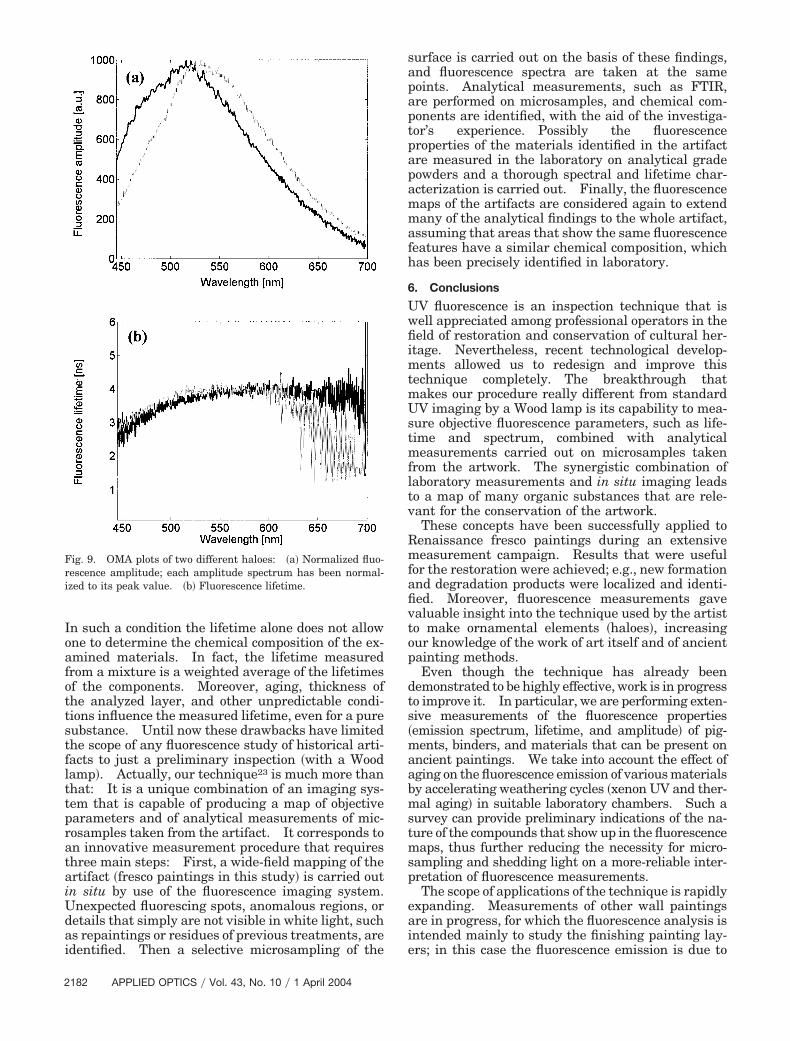
The OMA plots of the plaster and of a circular spotonfirm their different natures �Fig. 4�: The formerpectrum peaked at 460 nm and the latter at 550 nm.he lifetimes reconstructed with the OMA confirmhe indications provided by FLIM.
The identification of the materials that constitutehis portion of the artwork was made through FTIRn collected microsamples. Figure 5 shows the
ig. 3. FLIM analysis of the painted surface of Fig. 2: �a� fluo-escence amplitude map, �b� fluorescence lifetime map, �c� HSVap.
TIR spectra of a plaster sample as it is curve �a��nd after acid attack, which removes the inorganicraction curve �b��. Curve �b� reveals that the or-anic nature of the plaster is due to the presence ofalcium caseinate and PVA, whereas in curve �a� theresence of gypsum can easily be recognized. Gyp-um can be related to the sulfation process of thealcium carbonate, which is the binding phase in thelaster. Spectra of the joint and of circular spotseveal the same molecular composition, with a prev-lence of gypsum.It is worth noting that the nature of the analyzed
urface is quite complex. Vibrational spectroscopy,ven if it is capable of identifying the functionalroups or the molecules that constitute a complexixture, cannot easily determine their relative abun-
ance, which also changes from point to point. Thelaster, the circular spots, and the joint are maderom a mixture of the same organic and inorganic
aterials but in different proportions, which are notasily evaluated by FTIR. These differences are
ig. 4. OMA plots of the plaster and of a circular spot: �a� Nor-alized fluorescence amplitude; each amplitude spectrum has
een normalized to its peak value. �b� Fluorescence lifetime; theean lifetime in the spectral region of the emission peak is indi-
ell revealed by fluorescence measurements. In ouraboratory we tested three reference samples, of cal-ium caseinate, PVA, and gypsum, to evaluate theirelative abundance in the examined surface. In Fig.the fluorescence spectra of the samples are shown;
hey can be compared with those of plaster and cir-ular spots Fig. 4�a��. PVA and calcium caseinatehow similar emission spectra, peaked at 460 nm,nd lifetime values close to each other. Plaster isharacterized by similar fluorescence features, re-ealing that PVA and calcium caseinate constitute itsajor components. Good agreement is also evident
etween the fluorescence spectra of gypsum and cir-ular spots, indicating a prevalence of gypsum in thistucco mortar. The small deviation of the spectrumf circular spots toward longer wavelengths, with re-pect to gypsum, can be ascribed to the presence ofVA and calcium caseinate, as indicated by FTIR.inally, from laboratory measurements we cameack to the field experiment: The imaging capabil-
ig. 5. FTIR plaster spectra: �a� plaster fragment in a KBr pel-et calcite, gypsum, silicates, poly�vinyl acetate��; �b� insolubleesidue after 0.3 M of HCl has been applied to a diamond cellcalcium caseinate, poly�vinyl acetate��.
ig. 6. Normalized fluorescence spectra of the three samples,ypsum �G�, calcium caseinate �CC�, and poly�vinyl acetate� �PVA�.ach amplitude spectrum has been normalized to its peak value.
iai
atqatbcsvrlpsic
tsgfntoa
lcti
gmTntafla
E1samep
hutt
tweat
FflH
ty of FLIM allowed us to characterize and comparell the stucco joints that were present on the exam-ned surface.
Beyond the analysis of the paintings’ decay ourttention was addressed to the study of the ornamen-al details: haloes and gilded reliefs are generallyuite damaged, showing remnants of metal leavesnd large areas with residues of adhesive. Actually,he metal leaves were applied to the plaster surfacey use of adhesives called bole or mordant, whichonsisted of a mixture of oil and a drying agent. Atratigraphic analysis of some halo microsamples re-ealed that the decorations that we examined wereestored several times and that two different metaleaves were overlaid one upon the other. For exam-le, in Fig. 7 a picture of the Child Jesus’ head ishown. Some brilliant residues of a tin leaf are vis-ble in the halo. In Fig. 8 the reconstructed fluores-ence maps of the same character are displayed.
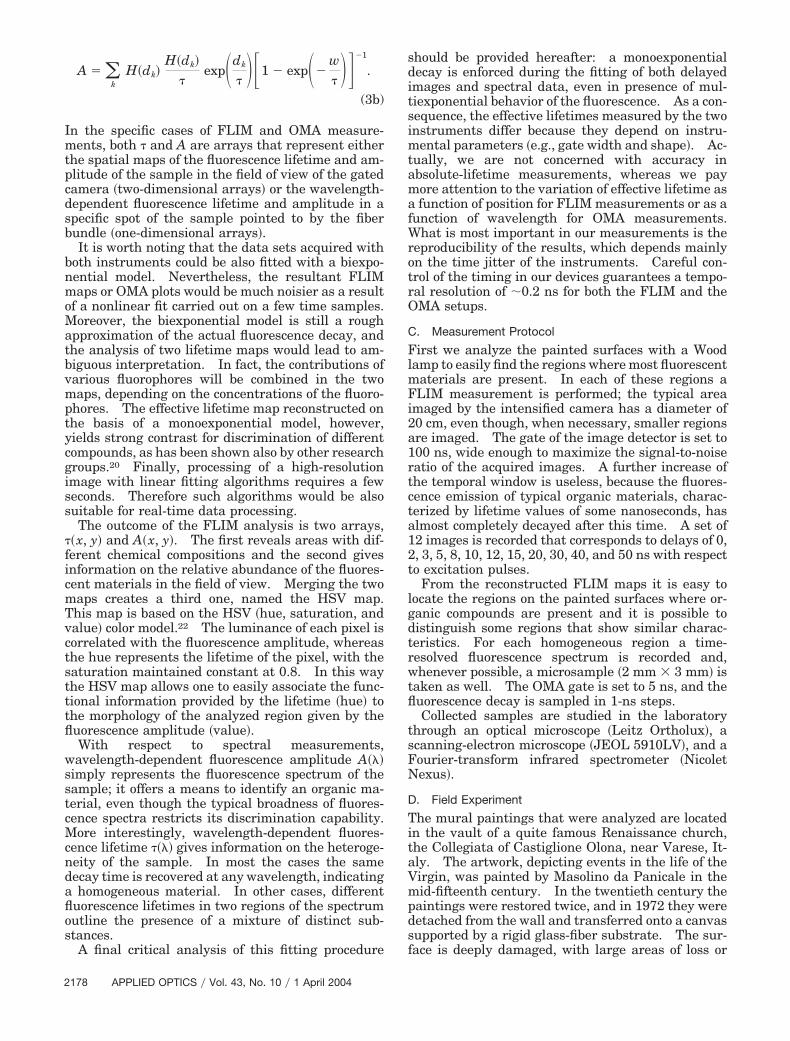
As can be observed from these maps, the regionhat corresponds to the halo is characterized by atrong fluorescence emission, which reveals its or-anic nature. Moreover, its lifetime ��6.2 ns� differsrom that of the surrounding painting layers ��7.0s�. Thus the fluorescence emission coming fromhis region is certainly due to the presence of anrganic adhesive used for the application of the goldnd tin leaves of the ornamental reliefs.The fluorescence spectra measured in different ha-
oes can be grouped in two sets, as shown in Fig. 9,haracterized by similar lifetimes. This indicateshat two different fluorescent materials are presentn the haloes of the fresco cycle.
To confirm this hypothesis we carried out a strati-raphic analysis of a halo sample with an opticalicroscope and a scanning-electron microscope.he analysis pointed out the complexity of these or-amental elements, as six different layers were iden-ified. In particular, two metallic leaves and theirdhesive layer were recognized. Thus the differentuorescence spectra can be related to the two organicdhesives, presumably made at different times.
Fig. 7. Picture of the Child Jesus’ halo.
ven though UV radiation cannot penetrate beyond00 �m, both adhesives contribute to the fluorescenceignal. In fact, in the halo of Fig. 7 two decay levelsre present simultaneously: regions where the firstetallic leaf was lost, exposing its adhesive, and ar-
as in which even the second metallic layer was de-ressed, revealing the underlying mordant.The fluorescence analyses carried out on most of
aloes that were present in the wall painting alloweds to establish that the same gilding technique andhe same restoration procedures were applied to allhe ornamental reliefs.
Some general considerations can be drawn fromhe examined surface. Fluorescence emission in art-orks typically comes from their organic fraction,ven though some fluorescent inorganic pigmentslso exist. Anyhow, the fluorescence emission is of-en due to a complex mixture of different compounds.
ig. 8. FLIM analysis of the painted surface of Fig. 7: �a�uorescence-amplitude map, �b� fluorescence-lifetime map, �c�SV map.
n such a condition the lifetime alone does not allowne to determine the chemical composition of the ex-mined materials. In fact, the lifetime measuredrom a mixture is a weighted average of the lifetimesf the components. Moreover, aging, thickness ofhe analyzed layer, and other unpredictable condi-ions influence the measured lifetime, even for a pureubstance. Until now these drawbacks have limitedhe scope of any fluorescence study of historical arti-acts to just a preliminary inspection �with a Woodamp�. Actually, our technique23 is much more thanhat: It is a unique combination of an imaging sys-em that is capable of producing a map of objectivearameters and of analytical measurements of mic-osamples taken from the artifact. It corresponds ton innovative measurement procedure that requireshree main steps: First, a wide-field mapping of thertifact �fresco paintings in this study� is carried outn situ by use of the fluorescence imaging system.nexpected fluorescing spots, anomalous regions, oretails that simply are not visible in white light, suchs repaintings or residues of previous treatments, aredentified. Then a selective microsampling of the
ig. 9. OMA plots of two different haloes: �a� Normalized fluo-escence amplitude; each amplitude spectrum has been normal-zed to its peak value. �b� Fluorescence lifetime.
urface is carried out on the basis of these findings,nd fluorescence spectra are taken at the sameoints. Analytical measurements, such as FTIR,re performed on microsamples, and chemical com-onents are identified, with the aid of the investiga-or’s experience. Possibly the fluorescenceroperties of the materials identified in the artifactre measured in the laboratory on analytical gradeowders and a thorough spectral and lifetime char-cterization is carried out. Finally, the fluorescenceaps of the artifacts are considered again to extendany of the analytical findings to the whole artifact,
ssuming that areas that show the same fluorescenceeatures have a similar chemical composition, whichas been precisely identified in laboratory.
. Conclusions
V fluorescence is an inspection technique that isell appreciated among professional operators in theeld of restoration and conservation of cultural her-
tage. Nevertheless, recent technological develop-ents allowed us to redesign and improve this
echnique completely. The breakthrough thatakes our procedure really different from standardV imaging by a Wood lamp is its capability to mea-
ure objective fluorescence parameters, such as life-ime and spectrum, combined with analyticaleasurements carried out on microsamples taken
rom the artwork. The synergistic combination ofaboratory measurements and in situ imaging leadso a map of many organic substances that are rele-ant for the conservation of the artwork.These concepts have been successfully applied to
enaissance fresco paintings during an extensiveeasurement campaign. Results that were useful
or the restoration were achieved; e.g., new formationnd degradation products were localized and identi-ed. Moreover, fluorescence measurements gavealuable insight into the technique used by the artisto make ornamental elements �haloes�, increasingur knowledge of the work of art itself and of ancientainting methods.Even though the technique has already been
emonstrated to be highly effective, work is in progresso improve it. In particular, we are performing exten-ive measurements of the fluorescence propertiesemission spectrum, lifetime, and amplitude� of pig-ents, binders, and materials that can be present on
ncient paintings. We take into account the effect ofging on the fluorescence emission of various materialsy accelerating weathering cycles �xenon UV and ther-al aging� in suitable laboratory chambers. Such a
urvey can provide preliminary indications of the na-ure of the compounds that show up in the fluorescenceaps, thus further reducing the necessity for micro-
ampling and shedding light on a more-reliable inter-retation of fluorescence measurements.The scope of applications of the technique is rapidly
xpanding. Measurements of other wall paintingsre in progress, for which the fluorescence analysis isntended mainly to study the finishing painting lay-rs; in this case the fluorescence emission is due to
tbabpbfio
R
1
1
1
1
1
1
1
1
1
1
2
2
2
2
he organic materials �e.g., oil and tempera� used asinders for pigments. The technique has also beenpplied to investigate organic contaminants of mar-le sculptures. Many other case studies, e.g., of oilaintings and ancient manuscripts, could possiblyenefit from fluorescence measurements, thus con-rming the great flexibility and ease of application ofptical techniques.
eferences1. N. S. Baer and R. Snethlage, Saving our Architectural Heri-
tage: the Conservation of Historic Stone Structures, report ofthe Dahlem workshop �Wiley, Berlin, 1997�.
2. C. Fiorini and A. Longoni, “Application of a new noncryogenicx-ray detector in portable instruments for archaeometric anal-yses,” Rev. Sci. Instrum. 69, 1523–1528 �1998�.
3. F. Pedersini, A. Sarti, and S. Tubaro, “Automatic monitoringand 3D reconstruction applied to cultural heritage,” J. Cult.Heritage 1, 301–313 �2000�.
4. M. Bacci, M. Fabbri, M. Picollo, and S. Porcinai, “Non-invasivefibre optic Fourier transform-infrared reflectance spectroscopyon painted layers,” Anal. Chim. Acta 446, 15–21 �2001�.
5. P. Castellani, E. Esposito, N. Paone, and E. P. Tomasini, “Non-invasive measurements of damage of frescoes paintings andicon by laser scanning vibrometer: experimental results onartificial samples and real works of art,” Measurements 28,33–45 �2000�.
6. P. Weibring, T. Johansson, H. Edner, S. Svanberg, B. Sundner,V. Raimondi, G. Cecchi, and L. Pantani, “Fluorescence lidarimaging of historical monuments,” Appl. Opt. 40, 6111–6120�2001�.
7. K. Melessanaki, V. Papadakis, C. Balas, and D. Anglos, “Laserinduced breakdown spectroscopy and hyper-spectral imaginganalysis of pigments on an illuminated manuscript,” Spectro-chim. Acta B 56, 2337–2346 �2001�.
8. C. Balas, V. Papadakis, N. Papadakis, A. Papadakis, E.Vazgiouraki, and G. Themelis, “A novel hyper-spectral imag-ing apparatus for the non-destructive analysis of objects ofartistic and historic value,” J. Cult. Heritage 4, 330s–337s�2003�.
9. F. Casadio and L. Toniolo, “The analysis of polychrome worksof art: 40 years of infrared spectroscopic investigations,” J.Cult. Heritage 2, 71–78 �2001�.
0. D. Anglos, “Laser-induced breakdown spectroscopy in art andarchaeology,” Appl. Spectrosc. 55, 186A–205A �2001�.
1. S. Daniilia, S. Sotiropoulou, D. Bikiaris, C. Salpistis, G. Kara-giannis, Y. Chryssoulakis, B. A. Price, and J. H. Carlson, “Pan-
selinos’ Byzantine wall paintings in the Protaton Church,Mount Athos, Greece: a technical examination,” J. Cult. Her-itage 1, 91–110 �2000�.
2. J. R. Lakowicz, Principles of Fluorescence Spectroscopy, 2nded. �Kluwer Academic, New York, 1999�.
3. S. Sotiropoulou and Y. Chryssoulakis, “An optimisation studyof colour measurements on digitised slides of painted works ofart,” J. Soc. Dyers Colour. 116, 23–31 �2000�.
4. T. Ni and L. A. Melton, “2-Dimensional gas-phasetemperature-measurements using fluorescence lifetime imag-ing,” Appl. Spectrosc. 50, 1112–1116 �1996�.
5. A. Periasamy, P. Wodnicki, X. F. Wang, S. Kwon, G. Gordon,and B. Herman, “Time-resolved fluorescence lifetime imagingmicroscopy using a picosecond pulsed tunable dye laser sys-tem,” Rev. Sci. Instrum. 67, 3722–3731 �1996�.
6. R. Cubeddu, A. Pifferi, A. Torricelli, G. Valentini, F. Rinaldi,and E. Sorbellini, “Fluorescence lifetime imaging: an appli-cation to the detection of skin tumors,” IEEE J. Sel. Top.Quantum Electron. 5, 923–929 �1999�.
7. P. J. Tadrous, J. Siegel, P. M. W. French, S. Shousha, E.Lalani, and G. W. H. Stamp, “Fluorescence lifetime imaging ofunstained tissues: early results in human breast cancer,”J. Pathol. 199, 309–317 �2003�.
8. G. Valentini, C. D’Andrea, D. Comelli, A. Pifferi, P. Taroni, A.Torricelli, R. Cubeddu, C. Battaglia, C. Consolandi, and G.Salani, “Time-resolved DNA-microarray reading by an inten-sified CCD for ultimate sensitivity,” Opt. Lett. 25, 1648–1650�2000�.
9. E. Waddell, Y. Wang, W. Stryiewski, S. McWhorter, A. C.Henry, D. Evans, R. L. McCarley, and S. A. Soper, “High-resolution near-infrared imaging of DNA microarrays withtime-resolved acquisition of fluorescence lifetimes,” Anal.Chem. 72, 5907–5917 �2000�.
0. K. C. B. Lee, J. Siegel, S. E. D. Webb, S. Leveque-Fort, M. J.Cole, R. Jones, K. Dowling, M. J. Lever, and P. M. W. French,“Application of the stretched exponential function to fluores-cence lifetime imaging,” Biophys. J. 81, 1265–1274 �2001�.
1. R. Cubeddu, D. Comelli, C. D’Andrea, P. Taroni, and G. Val-entini, “Time-resolved fluorescence imaging in biology andmedicine,” J. Phys. D 35, R61–R76 �2002�.
2. W. K. Pratt, Digital Image Processing �Wiley, New York, 1978�,pp. 32–33.
3. R. Cubeddu, G. Valentini, P. Taroni, D. Comelli, and L. To-niolo, “Analisi di opera d’arte mediante l’utilizzo della spet-troscopia di fluorescenza per immagini,” Italian PatentMI2002A001361 �20 June 2002�; PCT patent pending PCT�EP03�063433.