Page 1
UNIVERSIDADE DE LISBOA
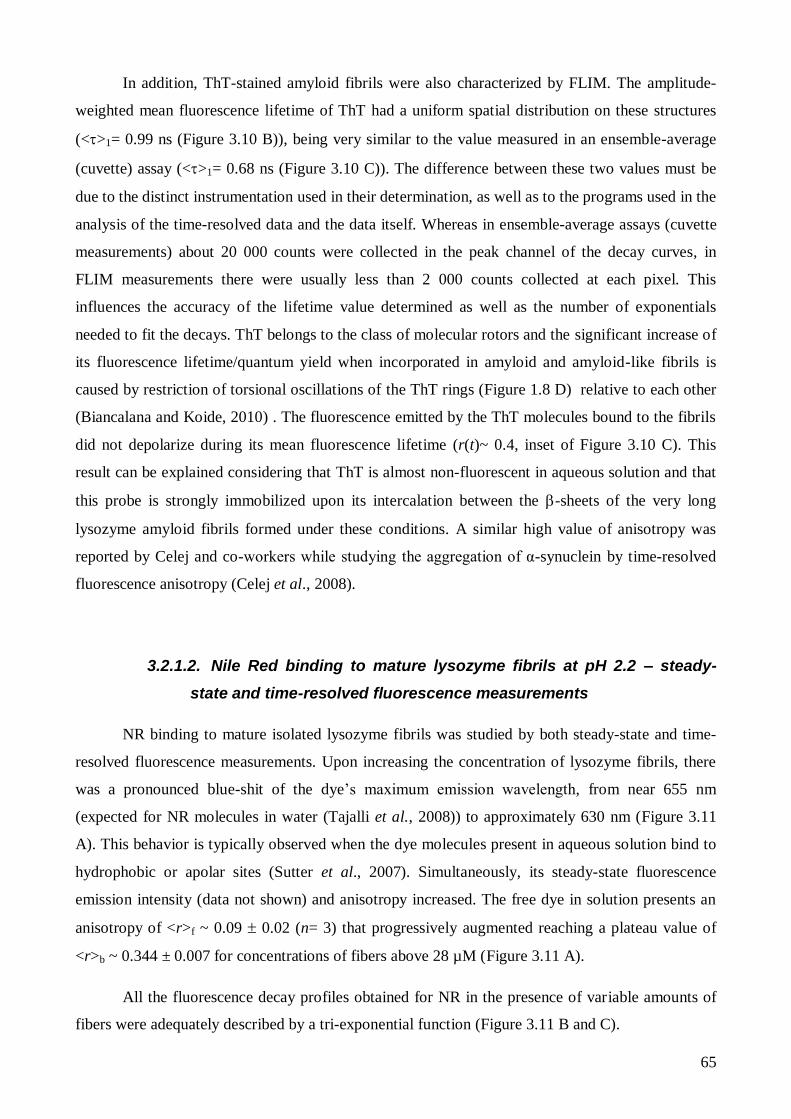
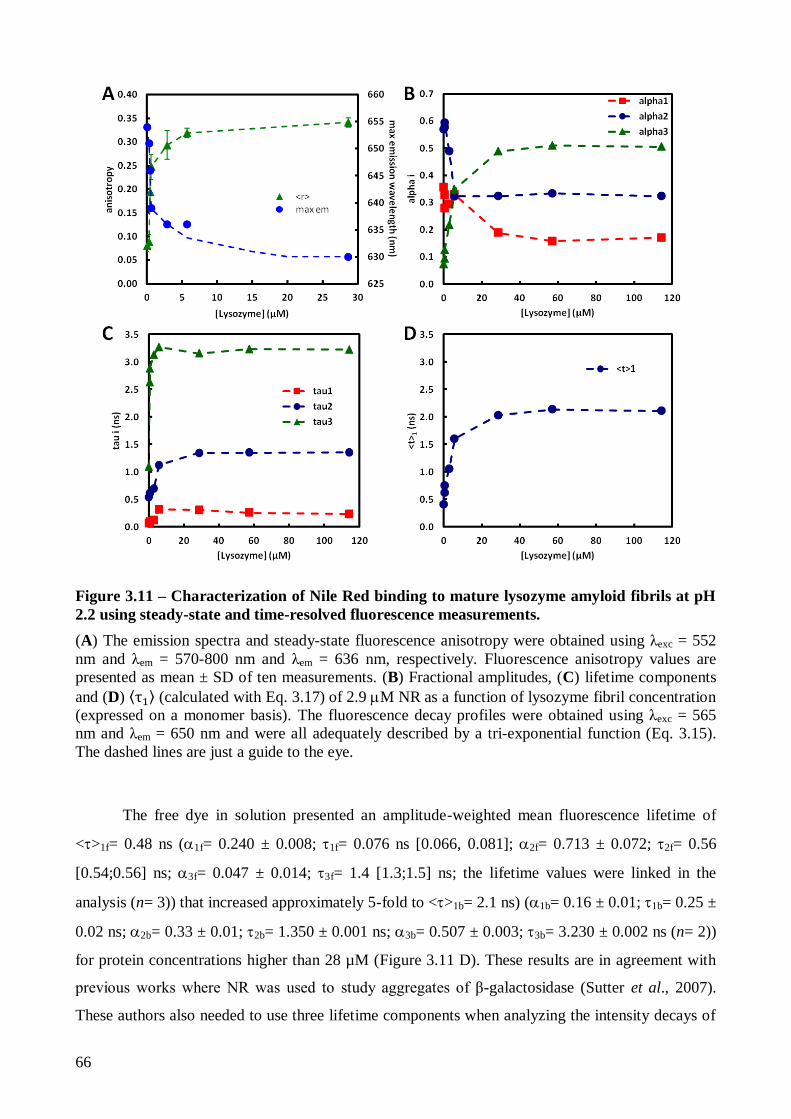
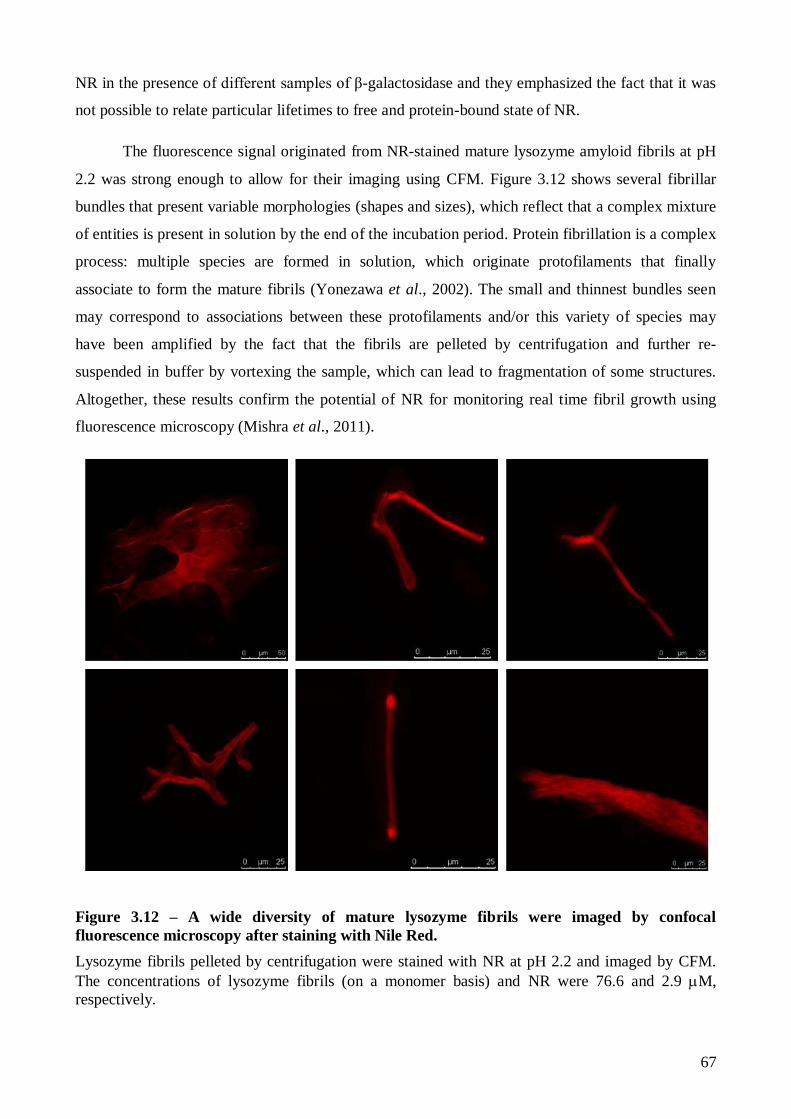
FACULDADE DE CIÊNCIAS
DEPARTAMENTO DE QUÍMICA E BIOQUÍMICA
Fluorescence Studies of Protein Aggregation Leading to
Amyloid Formation: The Role of Anionic Lipid
Membranes
Joana Catarina Ribeiro Ricardo
Dissertação de Tese de Mestrado
Mestrado em Bioquímica
Especialização em Bioquímica
2012
Page 3
UNIVERSIDADE DE LISBOA
FACULDADE DE CIÊNCIAS
DEPARTAMENTO DE QUÍMICA E BIOQUÍMICA
Fluorescence Studies of Protein Aggregation Leading to
Amyloid Formation: The Role of Anionic Lipid
Membranes
Joana Catarina Ribeiro Ricardo
Mestrado em Bioquímica
Especialização em Bioquímica
Dissertação de Tese de Mestrado orientada por
Professora Doutora Ana Coutinho
Lisboa
2012
Page 5
O difícil não é chegar aos grandes,
mas a si próprio.
Almada Negreiros
Page 7
v
Foreword
This dissertation describes the work performed under the supervision of Dr. Ana Coutinho
in the Biological Fluorescence group from Centro de Química-Física Molecular/ IN - Instituto de
Nanociência e Nanotecnologia, at Instituto Superior Técnico, from September 2011 to September
2012.
Joana Catarina Ribeiro Ricardo was the recipient of a research fellowship in the framework
of the project “Amyloidogenic Proteins: Role of Lipid-Protein Interaction in Amyloid-like Fibril
Formation” (project PTDC/QUI-BIQ/099947/2008), financed by Fundação para a Ciência e
Tecnologia from Ministério da Educação e Ciência.
Page 9
vii
Acknowledgments
I wish to thank Prof. Manuel Prieto for letting me be a part of the Biological Fluorescence
group and for all the knowledge he always has to offer, accompanied by his great humor, kindness
and coffees. I also want to show my gratitude to Ana Melo, for her help with daily tasks and with
the microscopy experiments, to Dr. Aleksander Fedorov for his help with the time-resolved
fluorescence measurements, to Prof. Mário Nuno Berberan Santos for providing the program to
analyze fluorescence anisotropy decays with the associative model and to Nuno Bernardes for
providing the conditions necessary to concentrate my samples.
Finally, I wish to thank all my colleagues of IN – Institute of Nanoscience and
Nanotechnology of Technical University of Lisbon and I want specially and mostly to thank Prof.
Ana Coutinho, my supervisor and an excellent professional, who was a real inspiration and gave
excellent tutorial and shared her knowledge with me.
I must thank my big family; my parents, Lurdes e Álvaro, who supported me and gave me
conditions to carry out my studies, to my sisters, Carla e Marta, for being there since I was a child,
that put up with me all along the way and to my bright brother’s in law, Flávio e Fernando. Also, to
my 6 noisy and lovely nices and nephews, João, Natacha, Rafael, Rodrigo, Carolina and Isaac that
always put a smile in my face, whether is with their lovely faces and expressions or with their funny
questions. Love you all.
Next to my oldest and newest friends. I owe a word to the oldest for never letting that
friendship feeling pass, even if we only get together twice a year. Especially, I thank Pedro, Rita
and Luís, for letting me know I can always, since I can remember, count on them. For the funniest
and greatest moments of the last almost 10 years. In addition, I’ve gained a number of friends
during my studies, with whom I spent good and bad moments and for whom I must show my
appreciation here. Especially, my “godmother” Maria João, and my “godchildren” Mário e Inês, I
thank you for making college an experience worth living.
And finally, a very special acknowledgment goes to André, who was the reason I got the
strength necessary to finish my course and who always encourages me to pursuit my dreams. To his
love, patience, care, companionship and everything else. I love you, this thesis is dedicated to you.
Page 11
ix
Resumo
Existem diversas doenças humanas, tais como a doença de Alzheimer, doença de Parkinson
ou a diabetes mellitus tipo II, em que ocorre a formação de depósitos proteicos intra- ou
extracelulares designados por fibras amilóide. Os processos que levam as proteínas a sofrer
alterações conformacionais que transformam o seu estado nativo num estado parcialmente
desnaturado que, posteriormente, conduz a processos irreversíveis de agregação são ainda pouco
conhecidos mas de elevado interesse para a comunidade científica. Alguns destes processos podem
ser semelhantes ao que ocorre com formulações proteicas desenvolvidas pela indústria farmacêutica
durante o seu armazenamento. Deste modo, é urgente esclarecer os mecanismos moleculares que
conduzem à agregação e formação de fibras pelas proteínas, assim como determinar a estrutura das
fibras amilóides e dos intermediários seus precursores, de modo a ser possível desenvolver
compostos eficazes para o tratamento destas doenças e para a preservação dos fármacos.
Actualmente pensa-se que a toxicidade associada a estas doenças provém não das fibras
amilóides maduras propriamente ditas mas sim dos seus precursores. Vários estudos recentes
apontam para o facto de estes intermediários serem capazes de interagir com as membranas
biológicas, o que pode levar à disrupção das mesmas. Com efeito, a capacidade que as membranas
lipídicas aniónicas têm em recrutar e induzir alterações conformacionais em diversos
péptidos/proteínas amiloidogénicas, que podem levar à formação de agregados com características
amilóides, tem sido um tópico de investigação importante nos últimos anos. Em 2004, Kinnunen e
colaboradores alargaram este conceito ao propor que as membranas contendo fosfolípidos acídicos
podem também desencadear a fibrilhação de várias proteínas não amiloidogénicas, tais como o
lisozima e a mioglobina. O lisozima da clara do ovo de galinha (HEWL) é um modelo ideal de uma
proteína não amiloidogénica para investigar esta hipótese já que tem sido largamente usado no
estudo dos mecanismos moleculares de agregação de proteínas/ formação de fibras in vitro.
O presente trabalho visou prosseguir o estudo iniciado no laboratório de acolhimento
relativamente ao mecanismo de fibrilhação do HEWL induzido pela sua interação com membranas
lipídicas aniónicas. De modo a ser possível aplicar uma grande variedade de técnicas centradas na
espectroscopia de fluorescência (medidas em estado estacionário e resolvidas no tempo, assim
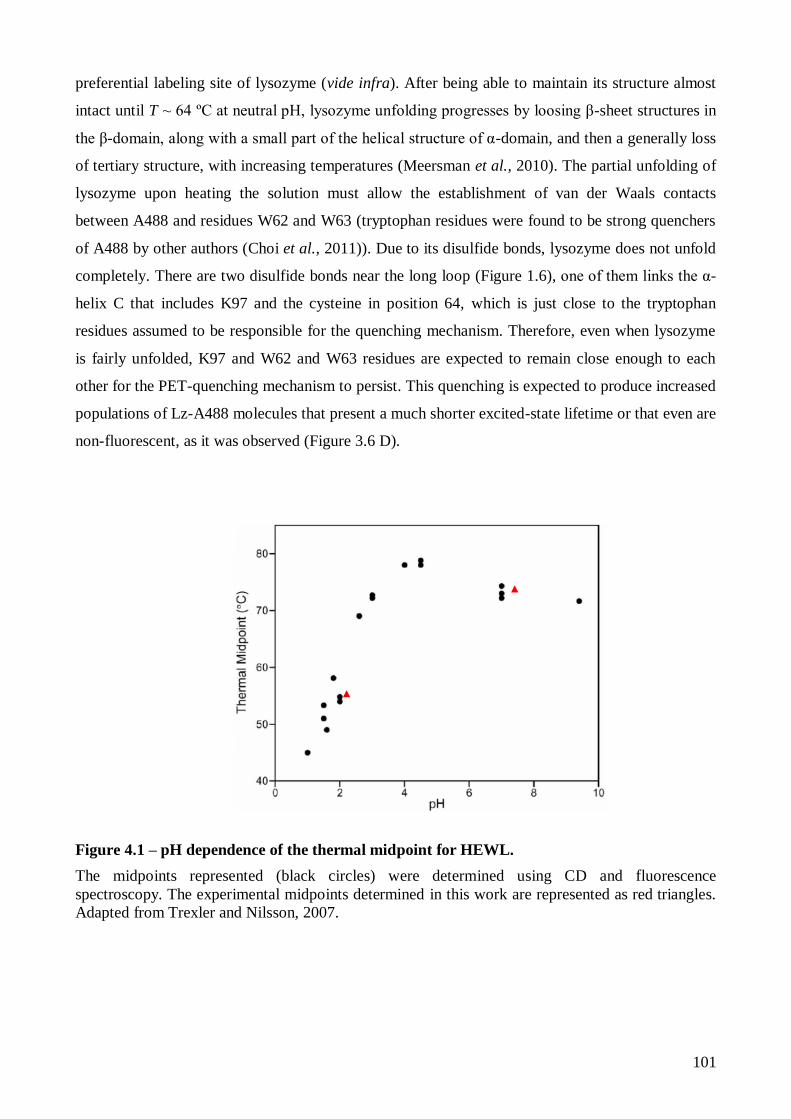
como a espectroscopia de correlação de fluorescência), a proteína foi derivatizada com uma sonda
fluorescente, o éster de succinamida do Alexa 488 (A488). Os estudos foram realizados com
sistemas modelo de membranas, vesículas unilamelares grandes (LUVs), preparadas com uma
Page 12
x
composição lipídica variável, nomeadamente incluindo diferentes percentagens de um fosfolípido
zwitteriónico e aniónico (1-palmitoil-2-oleoil-sn-glicero-3-fosfocolina (POPC) e 1-palmitoil-2-
oleoil-sn-glicero-3-fosfoserina (POPS)), respectivamente). Os estudos iniciais realizados
evidenciaram que as propriedades de emissão de fluorescência do HEWL derivatizado com A488
(Lz-A488) eram fortemente afectadas quando esta interactuava com lipossomas aniónicos. Tendo
por base as variações registadas nos valores dos comprimentos de onda máximos de emissão,
intensidade e tempos de vida de fluorescência, foi possível identificar três populações distintas de
Lz-A488 em interacção com as membranas, dependentes da razão lípido:proteína usada nos ensaios.
Atendendo aos resultados obtidos, sugeriu-se que as populações detectadas poderiam corresponder
a intermediários da via de fibrilhação do lisozima induzida pela sua interação com membranas
lipídicas aniónicas.
Tendo em conta que as conclusões anteriores são baseadas nas propriedades de emissão de
fluorescência do A488, tornou-se imperativo avaliar a capacidade deste fluoróforo em reportar
alterações conformacionais sofridas pelo lisozima quando sujeito a condições destabilizadoras.
Deste modo, o presente trabalho foi iniciado com a realização de estudos de desnaturação térmica
do Lz-A488 através da monitorização da variação das suas propriedades de emissão de fuorescência
com a temperatura. Os estudos foram realizados a pH 7.4 e 2.2 já que enquanto as interacções
lípido-proteína são habitualmente investigadas a pH neutro, os estudos de fibrlhação in vitro desta
proteína são frequentemente conduzidos a valores de pH acídicos. Após marcação covalente do
lisozima com o A488 e sua posterior purificação por cromatografia de exclusão molecular,
confirmou-se que a proteína modificada mantém a sua estrutura nativa à temperatura ambiente
através da comparação dos tempos de correlação rotacional obtidos a ambos os valores de pH. Os
ensaios de desnaturação térmica efectuados revelaram que o fluoróforo é um bom grupo repórter
das alterações conformacionais sofridas pelo lisozima devido à sua susceptibilidade em sofrer
extinção de fluorescência via um mecanismo de transferência de electrões foto-induzida. Os
resíduos W62 e W63 do lisozima são candidatos potenciais a actuarem como agentes de extinção de
fluorescência do fluróforo ligado covalentemente ao resíduo K97 já que se encontram localizados
numa região da proteína que tem sido descrita como sendo a primeira a sofrer alterações
conformacionais por aumento da temperatura. Os resultados obtidos mostraram ainda que a
derivatização da proteína não perturba o seu nível terciário de estrutura de um modo pronunciado
pois os valores obtidos para a temperatura de desnaturação térmica do Lz-A488 são concordantes
com dados da literatura obtidos por outras técnicas biofísicas.
O passo seguinte deste trabalho consistiu em estudar de que modo a fibrilhação in vitro do
lisozima afectava as propriedades emissivas do Lz-A488. Os ensaios foram efectuados a pH 2.2 e
Page 13
xi
57 ºC, sob condições quiescentes. Foram preparadas misturas de lisozima com proporções variáveis
de proteína marcada (razões molares de 1/2, 1/8, 1/40, 1/100 e 1/200 Lz-A488/lisozima,
concentração de proteína total 0.2 ou 1.0 mM). Em paralelo, foram realizados ensaios controlo da
cinética de fibrilhação do lisozima não derivatizado empregando-se as sondas tioflavina T (ThT) e
vermelho do Nilo (NR). De acordo com o esperado, as cinéticas apresentaram um comportamento
sigmóide característico de um mecanismo do tipo nucleação-polimerização, tendo-se determinado
um tempo de latência cerca de 2 dias mais longo para as amostras contendo menor concentração de
proteína total. A obtenção de fibras amilóide maduras que ligavam ThT e NR foi confirmada por
microscopia confocal de fluorescência (CFM) no final de ambas as cinéticas. Foi ainda determinado
que o NR apresenta uma afinidade moderada na sua ligação às fibras amilóide maduras de lisozima
(Kd~ 2.0 M) através da análise das medidas de anisotropia de fluorescência do NR resolvidas no
tempo de acordo com um modelo associativo.
Em todas as misturas Lz-A488/lisozima ensaiadas confirmou-se que o lisozima marcado era
incorporado nas fibras amilóides maduras através da realização de medidas de CFM. As medidas de
anisotropia em estado estacionário e resolvidas no tempo do Lz-A488 revelaram-se extremamente
informativas já que permitiram identificar as três fases das cinéticas de fibrilhação de todas as
misturas Lz-A488/lisozima, expecto a 1/2. Os tempos de duração das diferentes fases
correlacionaram-se bem com os indicados pelas sondas ThT e NR nos ensaios controlo. No caso da
mistura 1/2, a anisotropia em estado estacionário do Lz-A488 manteve-se praticamente constante ao
longo dos 14 dias de incubação da amostra, resultado este que foi atribuído à ocorrência de
migração de energia (homotransferência) entre as proteínas marcadas. Finalmente, os tempos de
vida de fluorescência menores medidos para o Lz-A488 incorporado nas fibras amilóides
preparadas a partir de amostras contendo proporções mais elevadas de Lz-A488/lisozima (1/2 e 1/8)
indicam que a presença de uma grande quantidade de proteína derivatizada na amostra inicial
perturba o empacotamento final do Lz-A488 nas fibras.
Por último, estudou-se a capacidade da sonda ThT em reportar a fibrilhação do lisozima na
presença de vesículas lipídicas aniónicas. Devido ao seu carácter catiónico, era expectável que esta
sonda se ligasse a membranas lipídicas carregadas negativamente, o que foi confirmado através da
realização de um estudo da sua partição para lipossomas de POPC contendo proporções variáveis de
POPS (10, 20 e 30 mol%) por medidas de fluorescência. Foram também realizados estudos de
ligação da sonda ao lisozima monomérico e a fibras amilóide pré-formadas pelo lisozima, na
presença e na ausência de vesículas lipídicas aniónicas, de modo a avaliar a competição daqueles
dois tipos de estruturas para a ligação da sonda. Os resultados obtidos mostraram que as vesículas
lipídicas aniónicas não eram capazes de induzir a formação extensiva de fibras amilóides por parte
Page 14
xii
do lisozima monomérico. A hipótese de se estabelecer uma interacção forte entre a sonda ThT e as
membranas aniónicas que impedisse a sua ligação a estruturas ricas em folhas foi eliminada
através da repetição dos ensaios anteriores com fibras de lisozima pré-formadas. Estes resultados
mostram que as variações detectadas, em estudos anteriores, nas propriedades de emissão de
fluorescência do Lz-A488 por incubação desta proteína derivatizada com vesículas lipídicas
aniónicas serão devidas a alterações na conformação/estado de oligomerização sofridas pelo Lz-
A488 sem que ocorra a formação extensiva de agregados com caracteríticas do tipo amilóide.
Palavras-chave
Lisozima; Alexa 488; microscopia e espectroscopia de fluorescência; formação de fibras amilóide;
interacção lípido-proteína; sistemas modelo de membranas
Page 15
xiii
Abstract
The ability of anionic lipid membranes to recruit and nucleate amyloid-like assemblies of
amyloidogenic proteins/peptides has been a major topic of research. In 2004, Kinnunen and
collaborators further extended this concept by proposing that acidic phospholipid-rich membranes
could trigger the fibrillation of non-amyloidogenic proteins. Hen egg-white lysozyme is an ideal
model non-amyloidogenic protein to investigate this hypothesis as it has been largely used to study
the molecular features of protein aggregation in solution.
Previous studies have shown that the fluorescence properties of Alexa488 fluorescently-
labeled lysozyme (Lz-A488) in interaction with anionic liposomes critically depended on the
protein surface coverage of the liposomes. To clarify the photophysical mechanism underlying
these results, thermal denaturation profiles of Lz-A488 were monitored at different pHs using
fluorescence spectroscopy. The Alexa488 fluorophore was found to be a sensitive reporter for
unfolding transitions of lysozyme due to its sensitivity to a photon-induced electron transfer-based
quenching mechanism.
The impact of lysozyme fibrillation on the fluorescence properties of Lz-A488 was also
studied using several Lz-A488/lysozyme mixing ratios (1/2, 1/8, 1/40, 1/100 and 1/200). Lz-A488
always formed mixed fibrils with the corresponding unlabeled protein after prolonged incubation at
pH 2.2 and 57 ºC. The characteristic stages of nucleation-polymerization kinetics could be clearly
identified by tracking the changes in Lz-A488 fluorescence anisotropy during its fibrillation kinetics
(mixtures 1/8 to 1/200). Time-resolved fluorescence anisotropy data showed the occurrence of
homotransfer between Lz-A488 molecules incorporated in the mixed mature fibrils produced from
the mixture 1/2. However, the mixing ratio used affected the final structure of the mixed fibrils
produced, as revealed by their mean fluorescence lifetimes.
Finally, competition binding assays of Thioflavin T and lysozyme/ mature lysozyme
amyloid fibrils and negatively-charged liposomes were used to show that anionic lipid membranes
do not trigger extensive amyloid-like fibril formation of lysozyme at variance with the literature.
Keywords
Hen egg while lysozyme, Alexa 488, fluorescence spectroscopy and microscopy, amyloid fibril
formation; lipid-protein interaction; model systems of membranes
Page 17
xv
Table of Contents
Foreword ....................................................................................................................................... v
Acknowledgments ....................................................................................................................... vii
Resumo ......................................................................................................................................... ix
Abstract ...................................................................................................................................... xiii
Table of Contents ........................................................................................................................ xv
Abbreviations ............................................................................................................................. xix
1. Introduction ........................................................................................................................... 1
1.1. Folding and misfolding of proteins .................................................................................... 3
1.2. Amyloidogenesis .............................................................................................................. 5
1.2.1. Amyloid diseases ....................................................................................................... 5
1.2.2. Structure of amyloid fibrils ........................................................................................ 8
1.2.3. Mechanisms of amyloid fibril formation .................................................................. 10
1.2.4. Biological membranes in amyloidogenesis ............................................................... 11
1.3. Lysozyme as a model protein .......................................................................................... 13
1.4. Some external fluorescent dyes commonly used to study protein stability and
aggregation… ............................................................................................................................ 17
1.5. Objectives and thesis organization .................................................................................. 23
2. Materials and Methods ........................................................................................................ 25
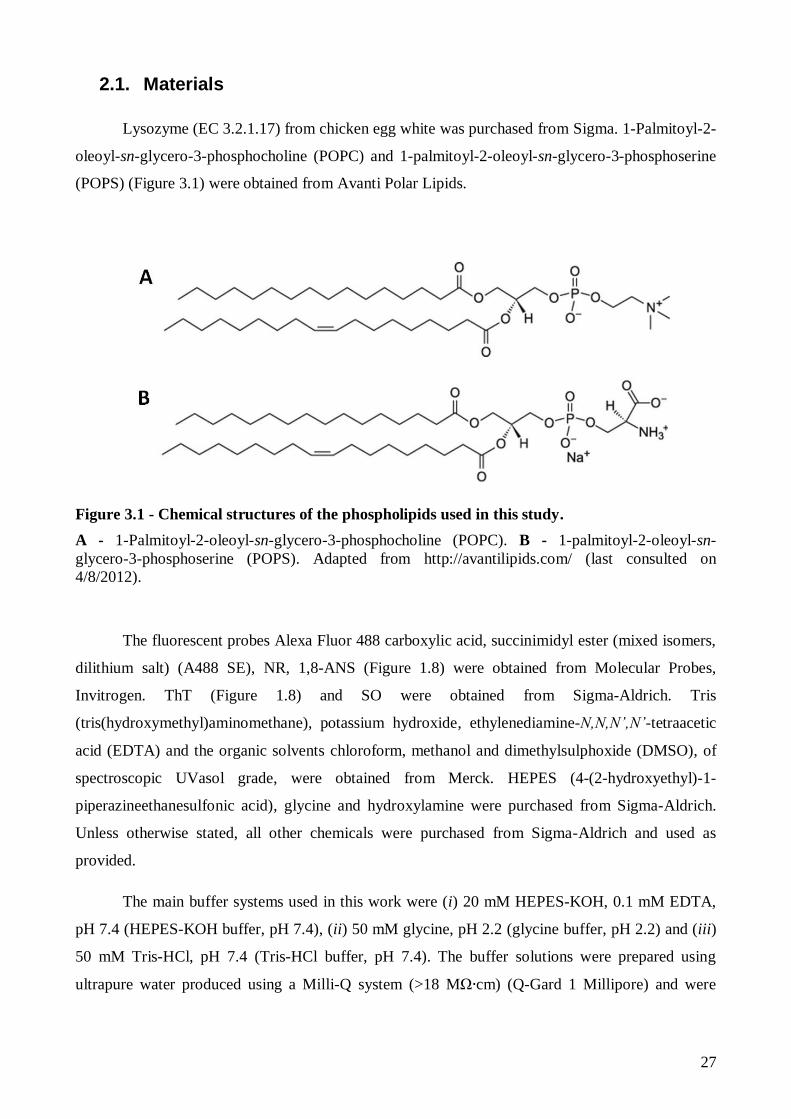
2.1. Materials ......................................................................................................................... 27
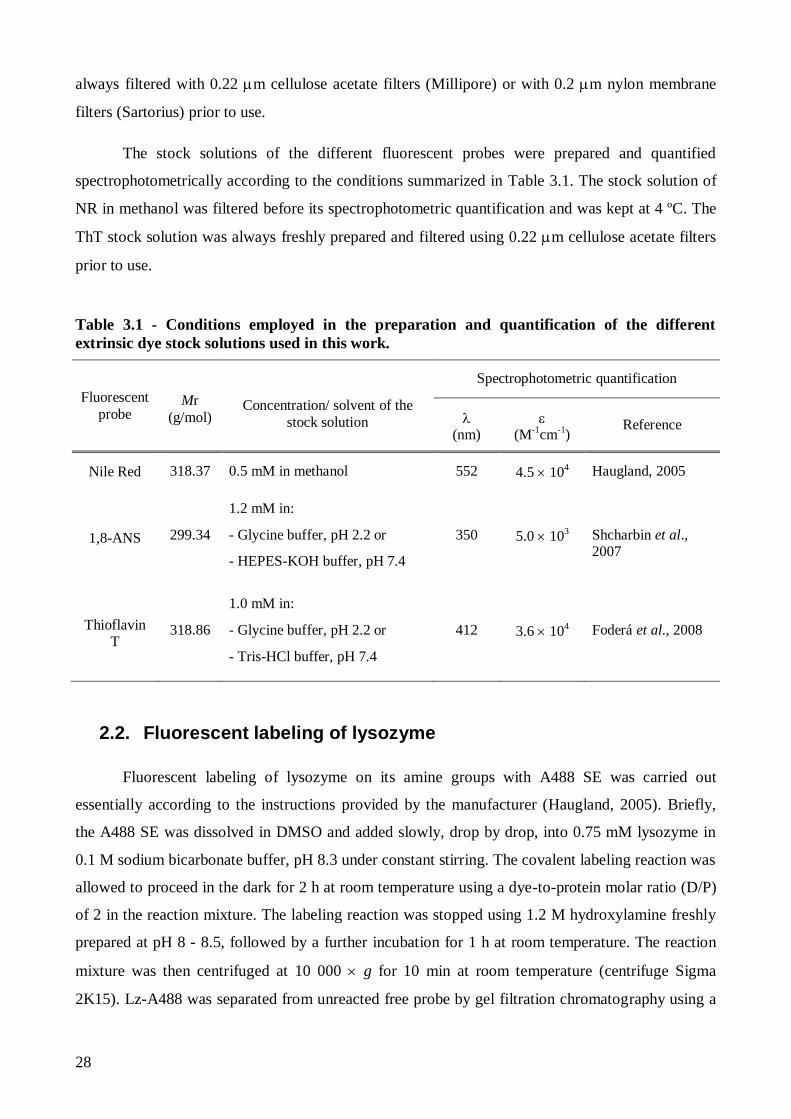
2.2. Fluorescent labeling of lysozyme .................................................................................... 28
2.3. Thermal denaturation of lysozyme and A488-fluorescently labeled lysozyme ................. 30
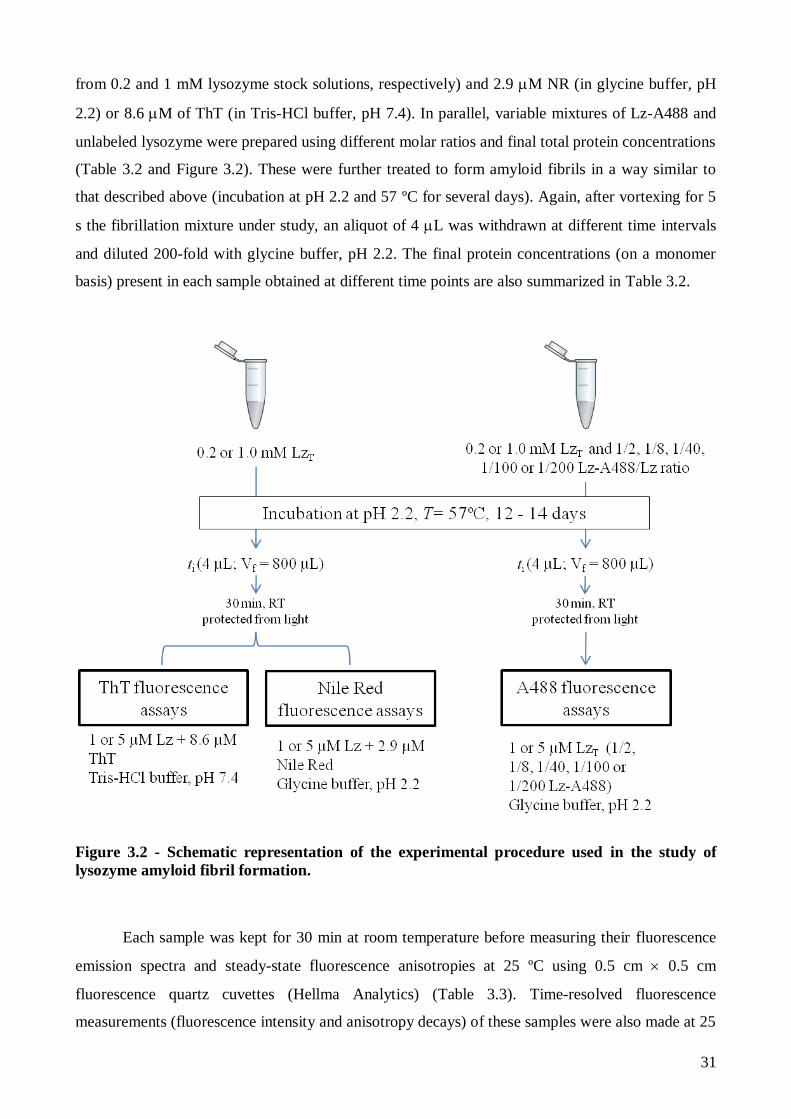
2.4. Kinetics of lysozyme amyloid fibril formation ................................................................ 30
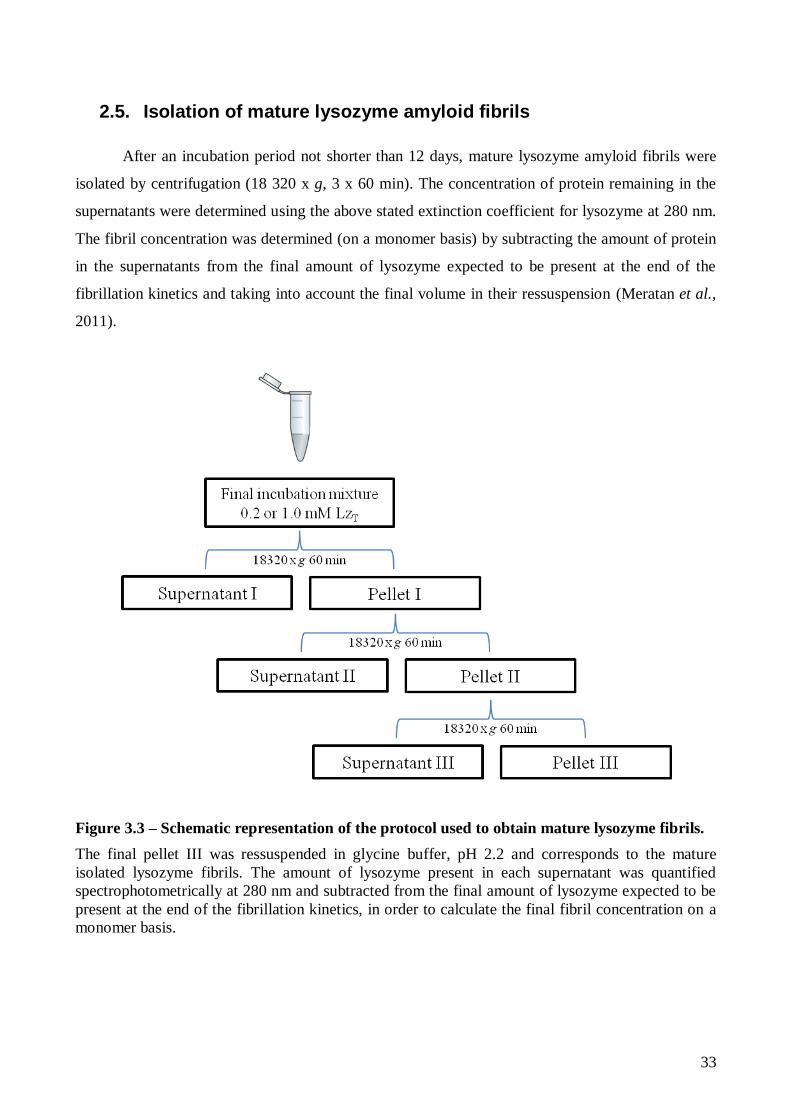
2.5. Isolation of mature lysozyme amyloid fibrils ................................................................... 33
2.5.1. Nile Red binding to mature lysozyme amyloid fibrils ............................................... 34
2.6. Interaction of lysozyme and mature lysozyme amyloid fibrils with anionic lipid
membranes ................................................................................................................................ 35
Page 18
xvi
2.6.1. Preparation of large unilamellar vesicles .................................................................. 35
2.6.2. Thioflavin T partition to anionic lipid membranes .................................................... 35
2.6.3. Competitive binding of Thioflavin T to mature lysozyme amyloid fibrils and anionic
lipid membranes..................................................................................................................... 37
2.7. Instrumentation ............................................................................................................... 37
2.7.1. UV-visible Spectroscopy ......................................................................................... 37
2.7.2. Fluorescence spectroscopy ....................................................................................... 37
2.7.2.1. Steady-state fluorescence measurements ........................................................... 37
2.7.2.2. Time-resolved fluorescence measurements ....................................................... 38
2.7.2.3. Confocal fluorescence microscopy .................................................................... 41
2.7.2.4. Fluorescence lifetime imaging microscopy ....................................................... 42
3. Results and Discussion ......................................................................................................... 45
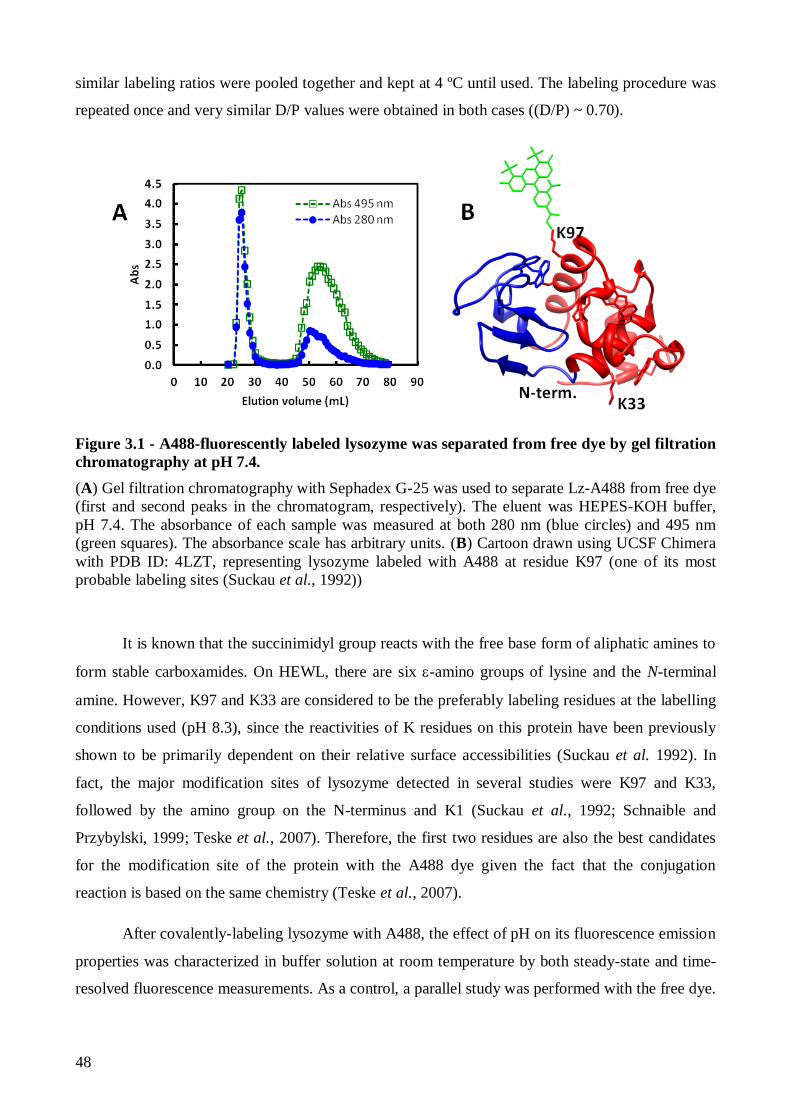
3.1. The effect of pH on Lz-A488 fluorescence properties and thermal stability ..................... 47
3.1.1. The fluorescence properties of native Lz-A488 are similar at pH 2.2 and 7.4 at room
temperature ............................................................................................................................ 47
3.1.2. Lysozyme is more thermally unstable at pH 2.2 than at pH 7.4 ................................ 55
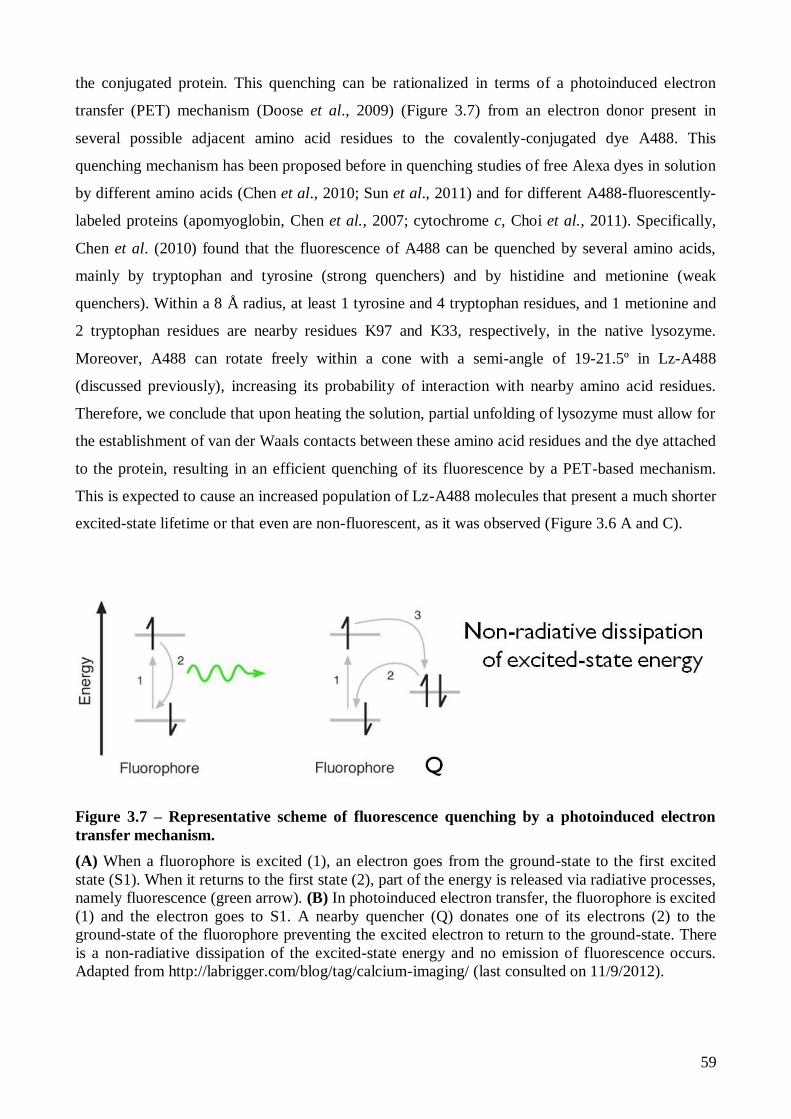
3.1.2.1. Thermal denaturation study of Lz-A488 at pH 7.4 ............................................ 56
3.1.2.2. pH strongly influences the thermal denaturation of Lz-A488 ............................. 60
3.1.2.3. Using 1,8-ANS and Sypro Orange to detect lysozyme thermal unfolding .......... 61
3.2. Lysozyme amyloid fibril formation at pH 2.2 and 57 ºC .................................................. 63
3.2.1. Nile Red has a moderate binding affinity to mature isolated lysozyme amyloid fibrils
at pH 2.2 ................................................................................................................................ 63
3.2.1.1. Preparation and detection of mature lysozyme fibrils using Thioflavin T .......... 63
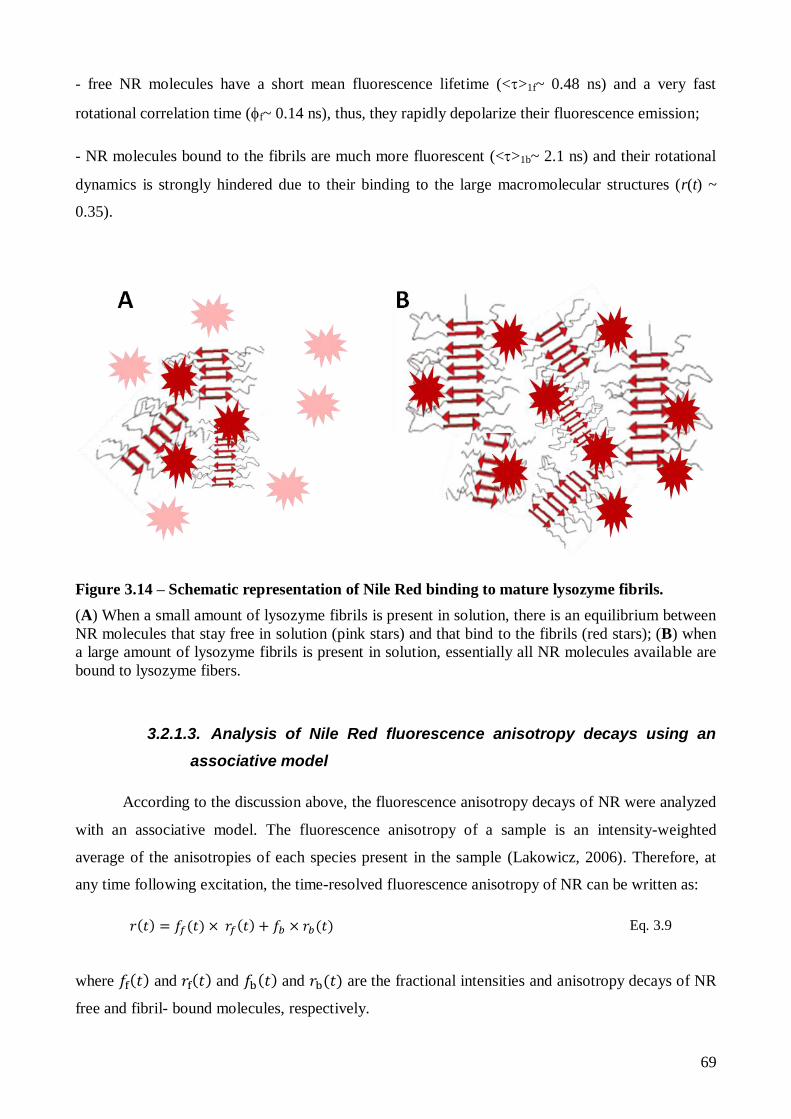
3.2.1.2. Nile Red binding to mature lysozyme fibrils at pH 2.2 – steady-state and time-
resolved fluorescence measurements .................................................................................. 65
3.2.1.3. Analysis of Nile Red fluorescence anisotropy decays using an associative
model…….......................................................................................................................... 69
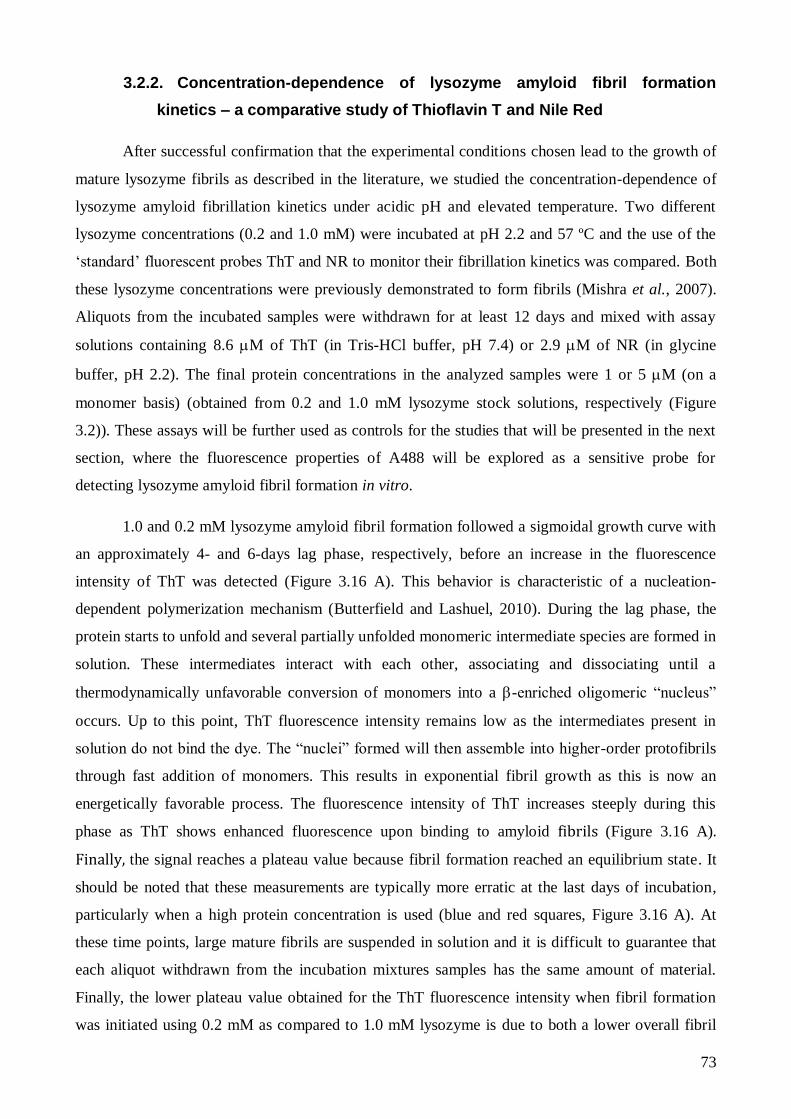
3.2.2. Concentration-dependence of lysozyme amyloid fibril formation kinetics – a
comparative study of Thioflavin T and Nile Red .................................................................... 73
Page 19
xvii
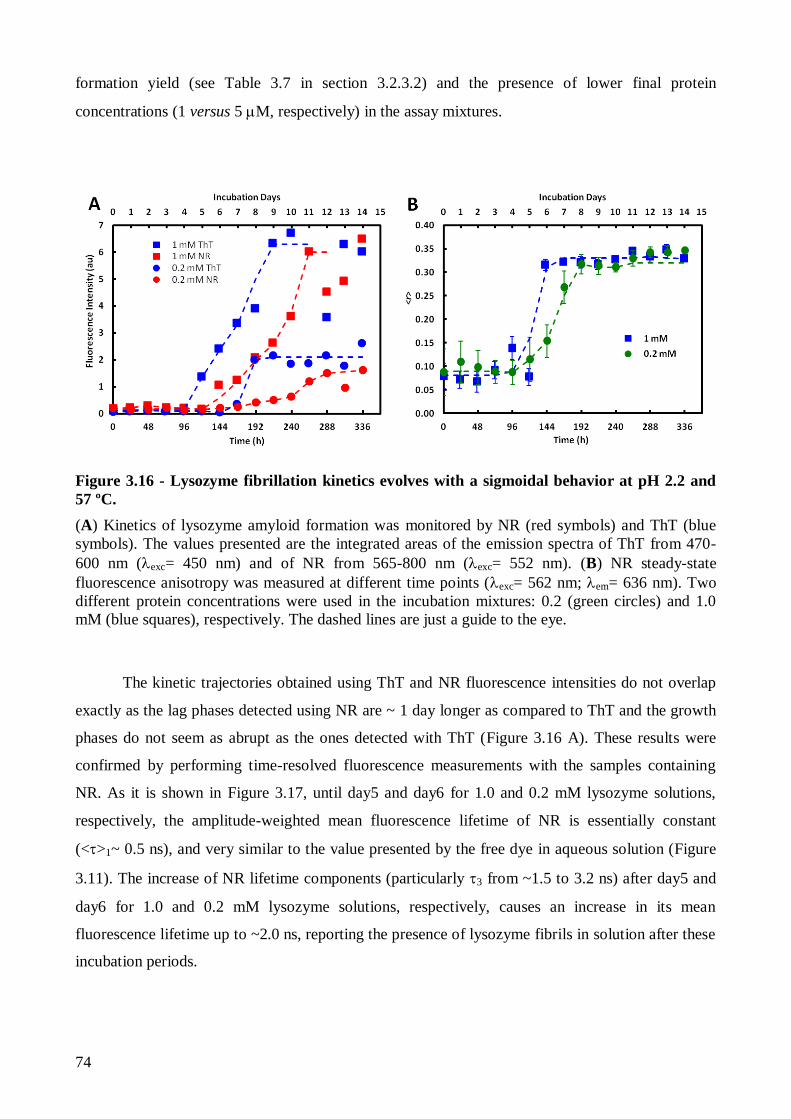
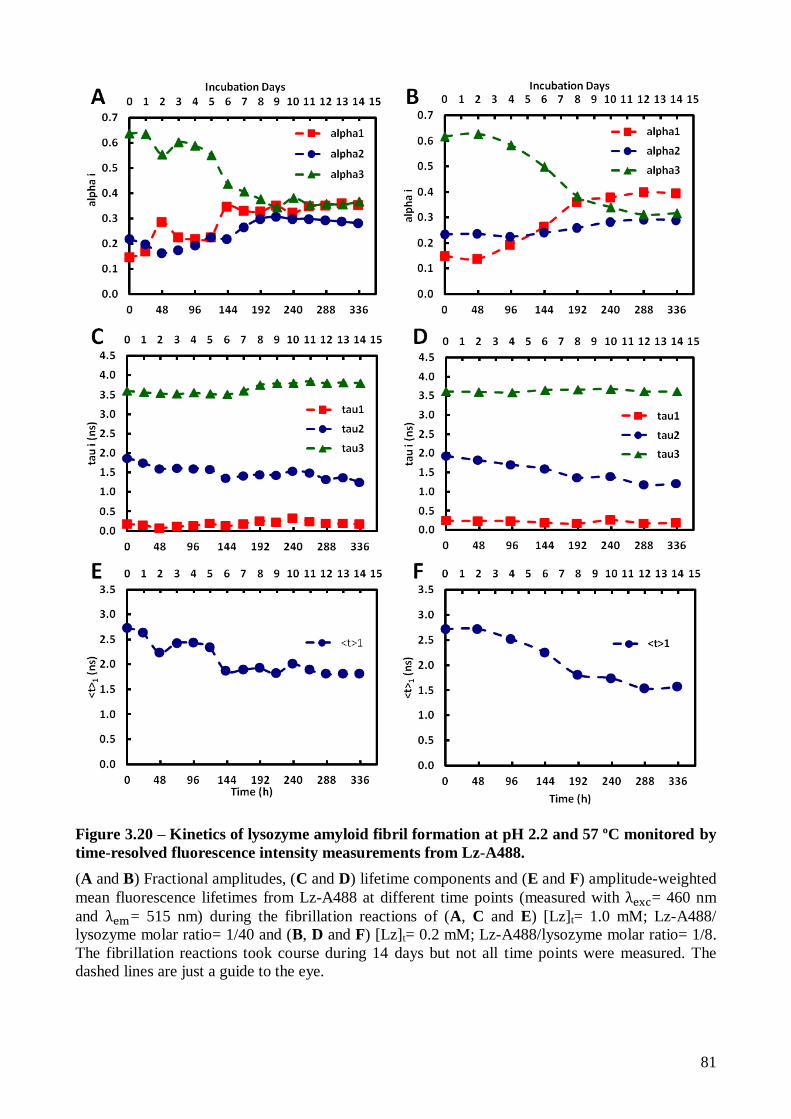
3.2.3. Monitoring lysozyme aggregation/fibrillation via A488 fluorescence ....................... 78
3.2.3.1. A488 is a versatile probe for detecting lysozyme amyloid fibril formation in
vitro……… ........................................................................................................................ 78
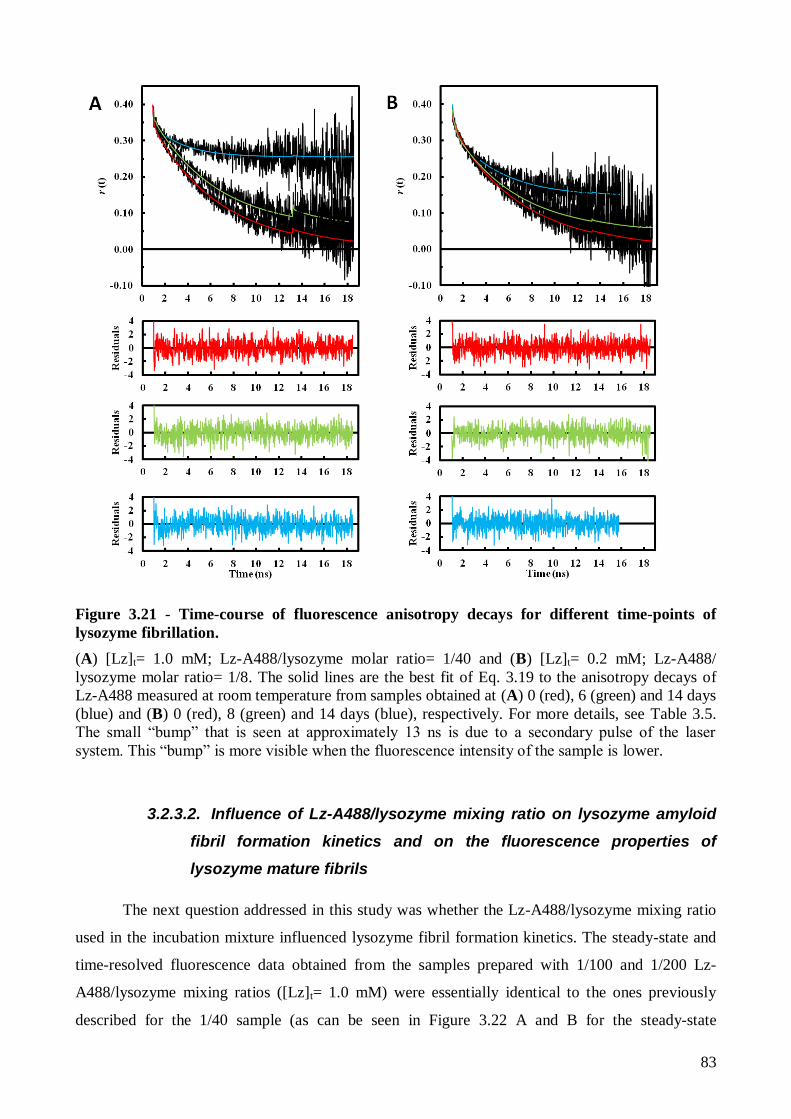
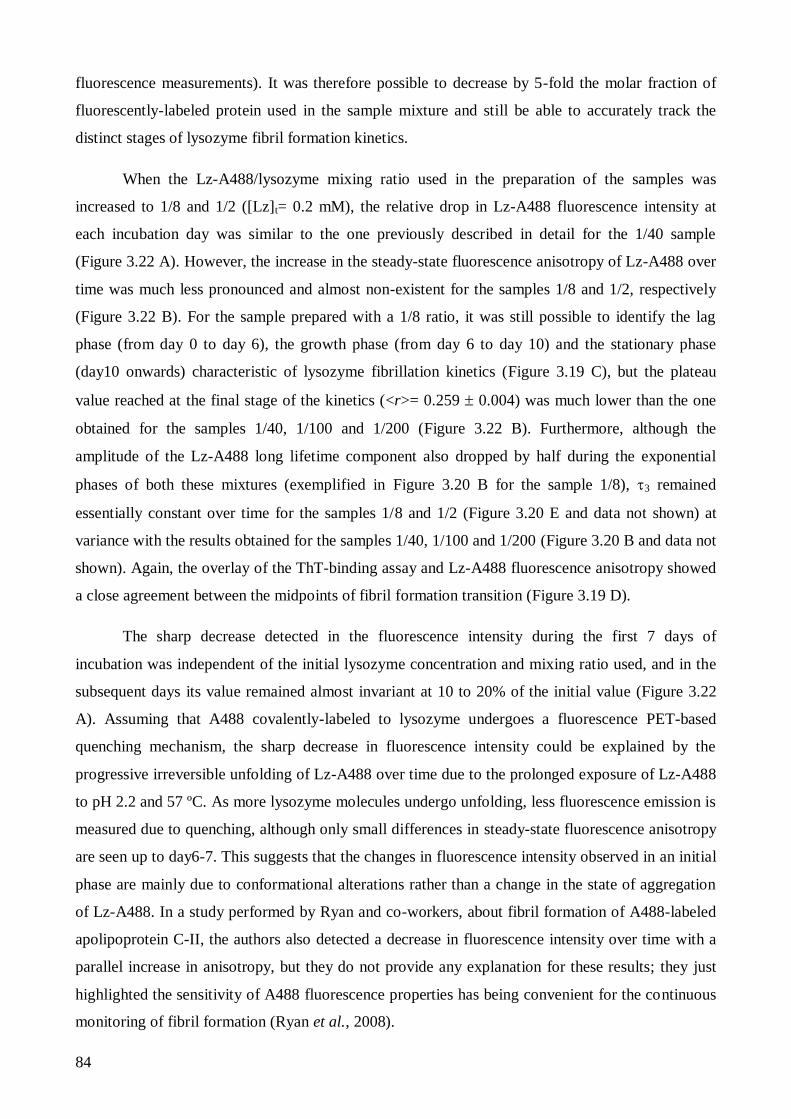
3.2.3.2. Influence of Lz-A488/lysozyme mixing ratio on lysozyme amyloid fibril
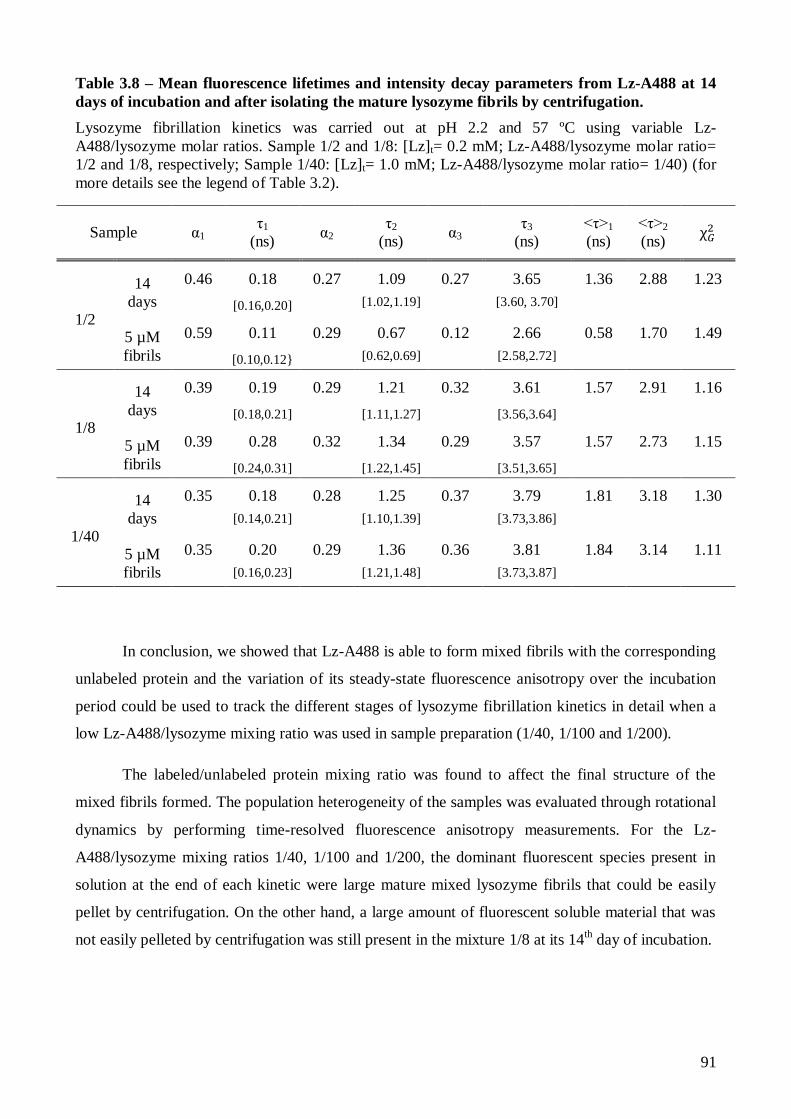
formation kinetics and on the fluorescence properties of lysozyme mature fibrils ............... 83
3.3. Lysozyme and Thioflavin T binding to anionic lipid membranes ..................................... 93
3.3.1. Thioflavin T partition to anionic lipid membranes is electrostatically-driven ............ 93
3.3.2. Lysozyme binding to anionic lipid membranes does not induce amyloid-like fibril
formation ............................................................................................................................... 94
4. Concluding remarks ............................................................................................................ 97
References ................................................................................................................................. 105
Page 21
xix
Abbreviations
The acronyms used are expanded on first usage and whenever seemed necessary to improve
clarity. For reasons of text economy very common acronyms, scientific or not (such as “RNA” or
“USA”), are not expanded nor described. Amino acid residues and sequences are indicated using
the one-letter code.
1,8-ANS - 1-anilinonaphthalene-8-sulfonic
acid
4LZT – PDB ID of the hen egg white
lysozyme protein structure file
A488 – Alexa Fluor 488
A488 SE – Alexa Fluor 488 carboxylic acid,
succinimidyl ester (mixed isomers,
dilithium salt)
au – arbitrary units
AFM – Atomic Force Microscopy
Aβ - amyloid-β peptide
CD – Circular Dichroism spectroscopy
CF – correction factor
CFM – Confocal Fluorescence Microscopy
Chol - cholesterol
CR – congo red
D/P – dye-to-protein molar ratio
DMSO – dimethylsulphoxide
EC – Enzyme Comission number
EDTA – ethylenediamine-N,N,N’,N’-
tetraacetic acid
FCS – Fluorescence Correlation Spectroscopy
FLIM - Fluorescence Lifetime Imaging
Microscopy
HEPES - 4-(2-hydroxyethyl)-1-
piperazineethanesulfonic acid
HEWL – hen egg white lysozyme
IAPP - islet amyloid polypeptide
IRF - instrument response function
LUV – large unilamellar vesicle
Lz – lysozyme
Lz-A488 - Alexa 488-fluorescently-labeled
lysozyme
NA – numerical aperture
NMR – Nuclear Magnetic Resonance
NR – nile red
PA - phosphatidic acid
PC - phosphatidylcholine
PDB (ID) – Protein Data Bank (identification)
PE - phosphatidylethanolamine
PET - photoinduced electron transfer
PG - phosphatidylglycerol
POPC – 1-palmitoyl-2-oleoyl-sn-glycero-3-
phosphocholine
POPS – 1-palmitoyl-2-oleoyl-sn-glycero-3-
phosphoserine
PS - phosphatidylserine
Page 22
xx
SCOP – structural classification of proteins
SD – standard deviation
SDS - sodium dodecyl sulfate
SM - sphingomyelin
SO – sypro orange
TCSPT - Time-Correlated Single-Photon
Timing technique
ThT – thioflavin T
TICT - twisted internal charge transfer
TPE - 2-photon excitation
TTR – transthyretin
UCSF – University of California, San
Francisco (San Francisco, California,
USA)
UV - ultraviolet
Page 25
3
1.1. Folding and misfolding of proteins
All proteins begin their existence on a ribossome as a linear sequence of amino acid
residues. Each polypeptide must fold during and following its synthesis to take up its native
conformation and acquire its function. It is believed that the information for proteins’ tertiary
structure is contained in its amino acid sequence, since each amino acid has a certain propensity to
take up a specific secondary structure, like α-helices and β-sheets (Nelson and Cox, 2008). Haber
and Anfinsen established in 1962 that the native state of a protein represents its minimum free
energy conformation (Haber and Anfinsen, 1962). This concept was revised in the 90’s when the
folding process of α-lytic protease was proposed to have evolved in a way that is not constrained by
the free-energy difference between the native and unfolded states but instead by the size of its
unfolding barrier (kinetic rather than thermodynamic control of the folding process) (Sohl et al.,
1998). Furthermore, it appears that many proteins are natively unfolded in their apo form, and such
intrinsically disordered proteins demonstrate that obtaining a functional, defined structure may be
dependent upon information outside the amino acid sequence (Hebda and Miranker, 2009).
Protein folding involves multiple pathways in cells and many proteins can only fold
correctly with the aid of other proteins (namely chaperones and some enzymes) (Nelson and Cox,
2008). This process cannot be completely random, since the conformational space accessible to a
polypeptide chain is astronomically large and proteins fold on a biologically relevant timescale
(Bartlett and Radford, 2009). Alternative explanations must be invoked to justify the speed of the
folding process, like viewing the folding process as hierarchical, with local secondary structures
formed first, guided by molecular interactions established between neighboring amino acid
residues, followed by the assemble of these secondary structures until the entire sequence is folded
(Bartlett and Radford, 2009). Other possibility is based on the assumption that folding is initiated by
a spontaneous collapse of the polypeptide into a ‘semi-compact’ state, mediated by hydrophobic
interactions among nonpolar residues. This state is referred to as a molten globule and is
characterized by having a high content of secondary structure but in which many amino acid side
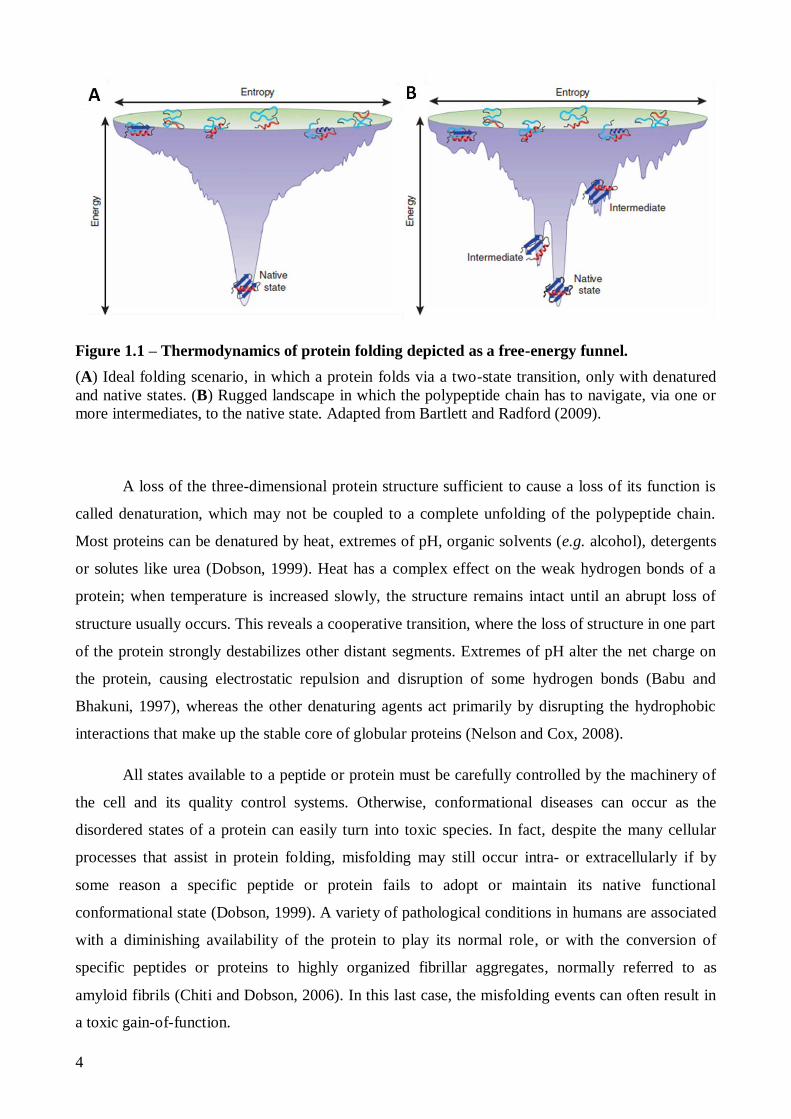
chains are still not properly packed (Nelson and Cox, 2008). Nowadays, the folding process is most
commonly viewed as a free-energy funnel (Figure 1.1), whereupon semi-stable folding
intermediates mark the way to the thermodynamically-stable native structure, guided by the
requirement of lowering the global free energy of the protein. As folding progresses, the entropy
associated to the different protein conformers decreases, as well as their free energy, and the
amount of protein in the native conformation increases in parallel (Bartlett and Radford, 2009).
Page 26
4
Figure 1.1 – Thermodynamics of protein folding depicted as a free-energy funnel.
(A) Ideal folding scenario, in which a protein folds via a two-state transition, only with denatured
and native states. (B) Rugged landscape in which the polypeptide chain has to navigate, via one or
more intermediates, to the native state. Adapted from Bartlett and Radford (2009).
A loss of the three-dimensional protein structure sufficient to cause a loss of its function is
called denaturation, which may not be coupled to a complete unfolding of the polypeptide chain.
Most proteins can be denatured by heat, extremes of pH, organic solvents (e.g. alcohol), detergents
or solutes like urea (Dobson, 1999). Heat has a complex effect on the weak hydrogen bonds of a
protein; when temperature is increased slowly, the structure remains intact until an abrupt loss of
structure usually occurs. This reveals a cooperative transition, where the loss of structure in one part
of the protein strongly destabilizes other distant segments. Extremes of pH alter the net charge on
the protein, causing electrostatic repulsion and disruption of some hydrogen bonds (Babu and
Bhakuni, 1997), whereas the other denaturing agents act primarily by disrupting the hydrophobic
interactions that make up the stable core of globular proteins (Nelson and Cox, 2008).
All states available to a peptide or protein must be carefully controlled by the machinery of
the cell and its quality control systems. Otherwise, conformational diseases can occur as the
disordered states of a protein can easily turn into toxic species. In fact, despite the many cellular
processes that assist in protein folding, misfolding may still occur intra- or extracellularly if by
some reason a specific peptide or protein fails to adopt or maintain its native functional
conformational state (Dobson, 1999). A variety of pathological conditions in humans are associated
with a diminishing availability of the protein to play its normal role, or with the conversion of
specific peptides or proteins to highly organized fibrillar aggregates, normally referred to as
amyloid fibrils (Chiti and Dobson, 2006). In this last case, the misfolding events can often result in
a toxic gain-of-function.
Page 27
5
1.2. Amyloidogenesis
1.2.1. Amyloid diseases
The term “amyloid” was first used by a german botanist in 1838, to describe a normal
amylaceous constituent of plants. In 1854, Virchow used it to describe corpora amylacea in the
brain, which he considered identical to starch (Kyle, 2001). Virchow developed the first methods
for the detection of amyloid in ex vivo material, by staining diseased organ samples with iodine-
sulphuric acid treatment (Biancalana and Koide, 2010). This and sodium-sulphuric acid treatment
were the first methods to identify extracellular amyloid deposits, followed by the use of
metachromatic stains, like methyl violet, which revealed much better than the previous tests. They
were eventually replaced by Congo Red (CR) as of 1922 (Kyle, 2001).
Afterwards, the concept of amyloid was expanded to designate diverse localized tissue
deposits with the same tinctorial and morphological properties and a similar homogeneous
appearance in light microscopy (Rochet and Lansbury Jr, 2000; Sipe et al., 2010). The term
“intracellular inclusions” has been suggested to describe the fibrils morphologically and structurally
related to the extracellular amyloid that are formed inside the cell, sometimes associated with
Parkinson’s and Alzheimer’s diseases, for example, like the Lewy bodies or the neurofibrillary
tangles, respectively (Chiti and Dobson, 2006; Sipe et al., 2010). So the term ‘amyloid’ is
nowadays expanded to include these intracellular fibrillar protein deposits. The definition has been
further extended to describe synthetic protein fibrils with some amyloid properties. In order to avoid
confusion, the Nomenclature Committee of the International Society of Amyloidosis has
recommended the use of ‘amyloid-like’ for synthetic fibrils, although this is not fully implemented
yet (Westermark et al., 2007). Current nomenclature has a list of 27 human and 9 animal fibril
proteins, together with a list of 8 inclusion bodies that exhibit some of the properties of amyloid
fibrils (Sipe et al., 2010).
Amyloidosis is by definition any pathological state associated with the formation of
extracellular amyloid deposits. This definition has been generalized to include some intracellular
inclusions that are associated with some diseases, as discussed above (Chiti and Dobson, 2006; Sipe
et al., 2010). A list with some examples of known diseases is given in Table 1.1. No curative
treatment is yet available for these amyloid diseases (Dumoulin et al., 2005; Groenning, 2010).
Page 28
6
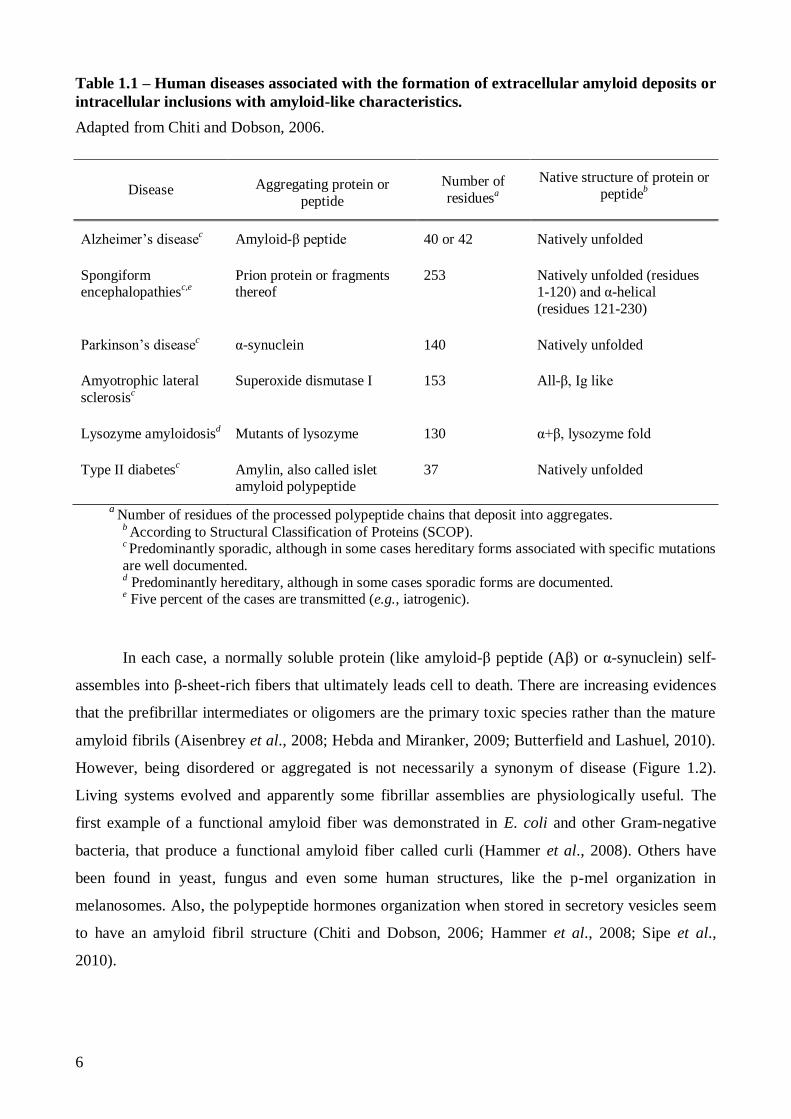
Table 1.1 – Human diseases associated with the formation of extracellular amyloid deposits or
intracellular inclusions with amyloid-like characteristics.
Adapted from Chiti and Dobson, 2006.
Disease Aggregating protein or
peptide
Number of
residuesa
Native structure of protein or peptide
b
Alzheimer’s diseasec Amyloid-β peptide 40 or 42 Natively unfolded
Spongiform encephalopathies
c,e
Prion protein or fragments thereof
253 Natively unfolded (residues 1-120) and α-helical
(residues 121-230)
Parkinson’s diseasec α-synuclein 140 Natively unfolded
Amyotrophic lateral
sclerosisc
Superoxide dismutase I 153 All-β, Ig like
Lysozyme amyloidosisd Mutants of lysozyme 130 α+β, lysozyme fold
Type II diabetesc Amylin, also called islet
amyloid polypeptide 37 Natively unfolded
a Number of residues of the processed polypeptide chains that deposit into aggregates.
b According to Structural Classification of Proteins (SCOP).
c Predominantly sporadic, although in some cases hereditary forms associated with specific mutations
are well documented. d Predominantly hereditary, although in some cases sporadic forms are documented.
e Five percent of the cases are transmitted (e.g., iatrogenic).
In each case, a normally soluble protein (like amyloid-β peptide (Aβ) or α-synuclein) self-
assembles into β-sheet-rich fibers that ultimately leads cell to death. There are increasing evidences
that the prefibrillar intermediates or oligomers are the primary toxic species rather than the mature
amyloid fibrils (Aisenbrey et al., 2008; Hebda and Miranker, 2009; Butterfield and Lashuel, 2010).
However, being disordered or aggregated is not necessarily a synonym of disease (Figure 1.2).
Living systems evolved and apparently some fibrillar assemblies are physiologically useful. The
first example of a functional amyloid fiber was demonstrated in E. coli and other Gram-negative
bacteria, that produce a functional amyloid fiber called curli (Hammer et al., 2008). Others have
been found in yeast, fungus and even some human structures, like the p-mel organization in
melanosomes. Also, the polypeptide hormones organization when stored in secretory vesicles seem
to have an amyloid fibril structure (Chiti and Dobson, 2006; Hammer et al., 2008; Sipe et al.,
2010).
Page 29
7
Figure 1.2 – Schematic representation of some of the many conformational states that can be
adopted by polypeptide chains.
Polypeptide chains start in an unfolded conformation that can evolve to multiple unfolded or folded
states. Not all the aggregated states should be denoted with a disease connotation. Even functional
fibers have already been discovered in living systems. Adapted from Chiti and Dobson, 2006.
Some properties of a few characteristic proteins responsible for causing conformational
diseases are briefly described next. This will give an insight into the variety of precursors already
identified as being causative agents of disease.
Aβ is derived by proteolytic processing from its precursor, β-amyloid precursor protein, and
exists as several species of distinct lengths; the most abundant, with 40 residues, is benign while the
less abundant variant, with 42 residues, aggregates much faster and is directly related to disease
Page 30
8
pathology (Winklhofer et al., 2008). Aβ was shown to accumulate near membranes with charged
lipids, which caused an accelerated misfolding into toxic aggregates (Aisenbrey et al., 2008).
The islet amyloid polypeptide (IAPP) can be found within a slender volume near the
membrane of insulin secretory granules (Knight et al., 2006). It is a 37-residue peptide hormone
normally processed and co-secreted with insulin by the β-cells of the islets of Langerhans (Knight
and Miranker, 2004). Amyloid formation by human IAPP in type II diabetes is associated with
death of insulin-producing pancreatic islet β-cells (Sparr et al., 2004).
α-synuclein is a small protein (14 kDa), abundant in various regions of the brain and highly
conserved. It has an overall low hydrophobicity, a large net charge and its function is not yet fully
elucidated (Munishkina et al., 2004). The protein is predominantly unstructured in solution, but it
can be divided in three sections: from residues 1-60 is the N-terminus which binds to membrane
surfaces and changes its conformation to α-helices; from residues 61-95 is the hydrophobic region
which has a high tendency to aggregate into β-sheet-rich amyloid fibrils; residues 96-140 comprise
the acidic C-terminus that is unstructured and negatively charged (Thirunavukkuarasu et al., 2008).
1.2.2. Structure of amyloid fibrils
The amyloid precursors do not share a common size, sequence or secondary structure but
they form mature amyloid fibrils that present a similar highly organized structure and mechanisms
of toxicity (Yonezawa et al., 2002; Chiti and Dobson, 2006). Transmission electron microscopy,
atomic force microscopy (AFM), X-ray fiber diffraction, circular dichroism (CD), and more
recently solid-state nuclear magnetic resonance (NMR) and single crystal X-ray diffraction analysis
(Nilsson, 2009) as well as computational energy minimization procedures and simulations (Smith et
al., 1998; Meersman et al., 2010) all contributed to gather structural information about amyloid
fibrils. CR birefringence, which can be complemented by CD and Fourier transform infra red
spectroscopy, are used to verify β-sheet content (Mishra et al., 2007).
Some common features are accepted to be part of amyloid fibers in general, such as the
cross-β X-ray fiber diffraction pattern. Usually they are composed of bundles of 2-6 protofilaments,
composed of a core of β-sheets, each with about 2-5 nm in diameter (Munishkina et al., 2004).
Depending on the precursor, the β-strands of these sheets can be connected by short loops, or
significant portions of the precursor protein may reside outside the fiber core (Hebda and Miranker,
2009). They are usually twisted, unbranched and vary in width. Normally, each filament is
displayed in a way that the polypeptide chain forms β-strands that are perpendicular to the long axis
Page 31
9
of the fibril while the backbone hydrogen bonds are parallel to the axis (Figure 1.3) (Rochet and
Lansbury Jr, 2000; Dumoulin et al., 2005; Groenning, 2010; Biancalana and Koide, 2010). These
structures are protease resistant and some molecular probes can bind to intermediates and mature
amyloid fibrils, such as the classical markers Thioflavin T (ThT) and CR (Ryan et al., 2008).
Figure 1.3 – Alignment of polypeptide chains in amyloid fibrils.
(A) Schematic representation of a twisted fibril with the polypeptide chains as blue arrows, which
are perpendicular to the long axis of the fibril. (B) Hydrogen bonds formed between polypeptide
chains when displayed parallel or anti-parallel to each other (see the black arrows above the atoms).
Adapted from Groenning, 2010 and Biancalana and Koide, 2010.
Using mildly denaturing conditions, the fibrils produced in vitro from amyloidogenic
proteins or peptides are closely similar to the ones isolated from patients. As an example, the Aβ or
the prion protein (Mishra et al., 2011) and α-synuclein (Celej et al., 2008) form fibrils at
physiological conditions (such as neutral pH and 37 ºC) but normally require shaking of the
solution. Fibrils will adopt the structure that is of lowest free energy and/or the most kinetically
accessible (Chiti and Dobson, 2006) and even before molecular structures of amyloid fibrils started
to emerge, the idea that there was a significant morphological variation between fibrils formed by
the same peptide or protein had already been accepted. These variations may be linked to different
arrangements in the position and orientation of the proteins within the fibrils. The deposits found in
patients that suffer from any of the amyloid diseases are not only composed by these specific
proteins, which normally forms the core of the deposit, but also by other proteins, such as collagen,
apolipoprotein E and serum amyloid P component, as well as metal ions or glycosaminoglycans
(Kyle, 2001; Chiti and Dobson, 2006; Ryan et al., 2008).
The predisposition to form ordered aggregates is not just associated with disease-causing
proteins but to almost any protein when subjected to the appropriate conditions, which are very
similar to the ones described above for inducing protein denaturation. A recent study investigated
the propensity of 38 different proteins, non disease-related, to form amyloid fibrils, and concluded
Page 32
10
that 28 of them formed in fact fibril structures under acidic conditions in the presence of alcohols
(Aso et al., 2007).
1.2.3. Mechanisms of amyloid fibril formation
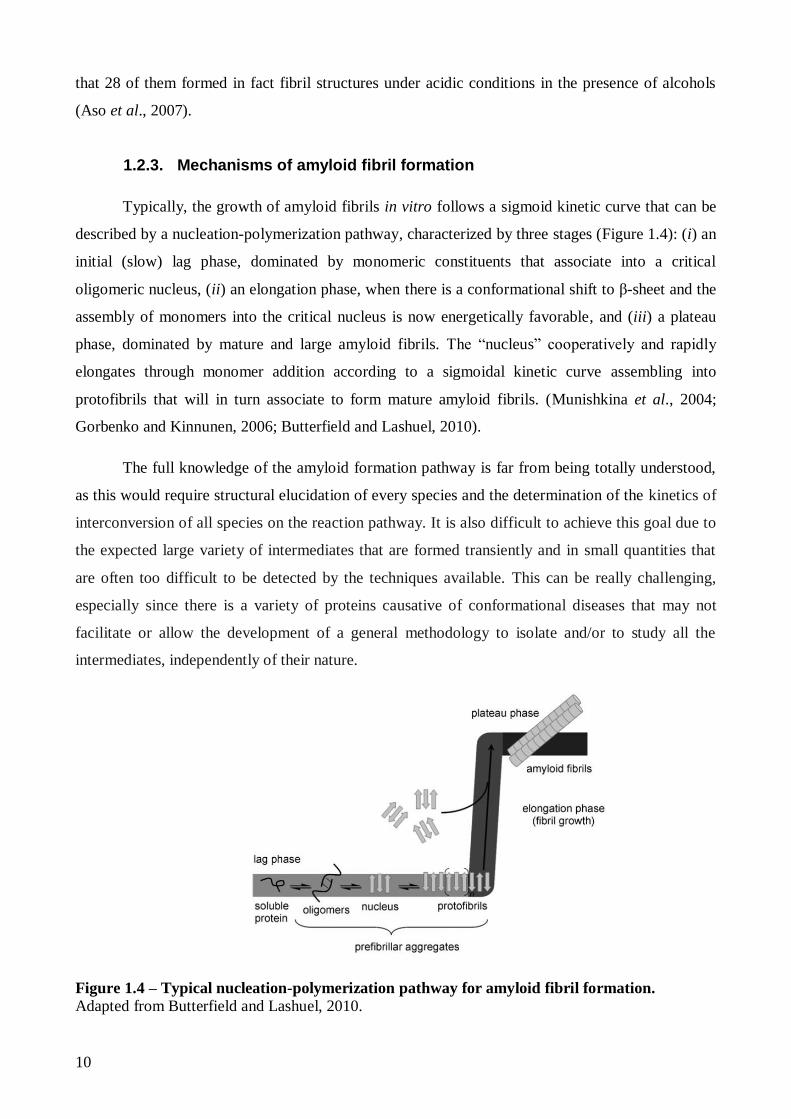
Typically, the growth of amyloid fibrils in vitro follows a sigmoid kinetic curve that can be
described by a nucleation-polymerization pathway, characterized by three stages (Figure 1.4): (i) an
initial (slow) lag phase, dominated by monomeric constituents that associate into a critical
oligomeric nucleus, (ii) an elongation phase, when there is a conformational shift to β-sheet and the
assembly of monomers into the critical nucleus is now energetically favorable, and (iii) a plateau
phase, dominated by mature and large amyloid fibrils. The “nucleus” cooperatively and rapidly
elongates through monomer addition according to a sigmoidal kinetic curve assembling into
protofibrils that will in turn associate to form mature amyloid fibrils. (Munishkina et al., 2004;
Gorbenko and Kinnunen, 2006; Butterfield and Lashuel, 2010).
The full knowledge of the amyloid formation pathway is far from being totally understood,
as this would require structural elucidation of every species and the determination of the kinetics of
interconversion of all species on the reaction pathway. It is also difficult to achieve this goal due to
the expected large variety of intermediates that are formed transiently and in small quantities that
are often too difficult to be detected by the techniques available. This can be really challenging,
especially since there is a variety of proteins causative of conformational diseases that may not
facilitate or allow the development of a general methodology to isolate and/or to study all the
intermediates, independently of their nature.
Figure 1.4 – Typical nucleation-polymerization pathway for amyloid fibril formation.
Adapted from Butterfield and Lashuel, 2010.
Page 33
11
1.2.4. Biological membranes in amyloidogenesis
Toxicity for living cells is a consequence of the accumulation of the intermediates and
amyloid fibrils in amyloidosis. Most recently, it became apparent that the unfolded, metastable
intermediates, which exist transiently in the protein aggregation/folding pathways, are the likely
origins of pathological behavior (Kinnunen, 2009), probably because they interact with biological
membranes. To date, over 10 amyloid systems have been demonstrated to act on biological
membranes (Lashuel and Lansbury, 2006) and some are resumed in Table 1.2 (Gorbenko and
Kinnunen, 2006).
Table 1.2 – Involvement of membranes in fibril formation by amyloidogenic proteins and
peptides.
Cholesterol (Chol), phosphatidic acid (PA), phosphatidylcholine (PC) phosphatidylethanolamine
(PE), phosphatidylglycerol (PG), phosphatidylserine (PS), sphingomyelin (SM). Adapted from
Gorbenko and Kinnunen, 2006.
Disease Aggregating protein or peptide
Membrane system Reference
Alzheimer’s
disease
Aβ Total brain lipid bilayers Yip et al., 2001
PC/PG vesicles Bokvist et al., 2004
Tau PS vesicles Chirita et al., 2003
Spongiform
encephalopathies
Prion protein PG, PC, PC/Chol/SM vesicles Kazlauskaite et al., 2003
Parkinson’s
disease
α-synuclein PA/PC, PG/PC, PS/PC, PG/PE
vesicles
Zhu et al., 2003
Systemic
amyloidosis
Lysozyme PC/PS, PC/PG vesicles Zhao et al., 2004
Type II diabetes IAPP PG/PC vesicles, liposomes
from pancreas lipids
Knight and Miranker, 2004
PC, PS/PC vesicles, rat insulinoma tumor cells
Sparr et al., 2004
The cytotoxicity of the intermediates has been related to the permeabilization and/or
disruption of membrane integrity and leakiness of cell membranes, allowing uncontrolled flow of
ions into the cell (particularly Ca2+
). Sparr and co-workers showed with human IAPP that, in the
presence of lipid membranes, the protein aggregates and extracts lipids from the membranes. The
extraction of lipids is directly coupled to the process of amyloid formation and to the
Page 34
12
permeabilization of the lipid membrane (Sparr et al., 2004). In 2005, Quist and co-workers showed
that a group of amyloid molecules, namely Aβ(1-40), α-synuclein, IAPP and others, undergo
conformational changes in the presence of reconstituted bilayer membranes. They form
morphologically compatible ion-channel-like structures, different among them due to the
heterogeneity of the peptides, and induce ion-channel activity. These ion channels would destabilize
the cell ionic homeostasis and hence induce cell pathophysiology and degeneration in amyloid
diseases (Quist et al., 2005). Mitochondrial membranes could also be directly affected by the
protofibrils. The influx of Ca2+
may be sufficient to trigger the permeability transition of the
mitochondrial membrane, which leads to the generation of reactive oxygen species and the releasing
of cytochrome c, which activates apoptotic signals that lead cells to death (Quist et al., 2005;
Kinnunen, 2009; Hebda and Miranker, 2009).
The nucleation phase of amyloid fibril formation is thermodynamically unfavorable and
membranes have been shown to catalyze this process (Hebda and Miranker, 2009). The principal
factors responsible for the enhanced formation of fibrils when amyloidogenic proteins/peptides
interact with membranes appear to be (i) stabilization by membranes of partially folded and flexible
aggregation-prone protein confirmations, (ii) increase, in a restricted volume, of the local
concentration of the protein in the membrane, which in turn favors the interactions among proteins,
(iii) promotion of particular disposition of the aggregating species relative to a lipid-water interface,
(iv) variation in the depth of bilayer penetration that affects the nucleation propensity of the protein
associated with the membrane and (v) the possibility of membranes to serve as templates for protein
aggregation (Gorbenko and Kinnunen, 2006; Aisenbrey et al., 2008; Hebda and Miranker, 2009).
Changes in the physicochemical properties of lipid bilayer associated with pathological processes or
aging may increase the binding of proteins to membranes, setting off amyloidogenesis in vivo
(Gorbenko and Kinnunen, 2006).
The lipidic composition of membranes influence their hydrophobicity, lipid lateral packing
density and the net surface charge of the lipid bilayer, largely affecting the interaction between
peptides/proteins and the membranes, ultimately shaping all the processes above described.
Particularly, negatively-charged phospholipids have been implicated in the enhancement of amyloid
fibril formation by amyloidogenic proteins and peptides, although mixtures of other phospholipids
(PC and PE) with Chol or SM with Chol have also been seen to promote this formation (Gorbenko
and Kinnunen 2006; Kinnunen 2009) (Table 1.2).
More recently, Kinnunen and collaborators proposed that negatively-charged liposomes
trigger the formation of amyloid-like assemblies by non-amyloidogenic proteins, like lysozyme,
Page 35
13
insulin, myoglobin, transthyretin (TTR), cytocrome c, among others, under physiological conditions
(Zhao et al., 2004). Although presenting different sizes, structures, localizations and functions in
cells, all these proteins have cationic residues or cationic amino acid clusters. In this study, the
authors used a low lipid/ protein ratio and the buffer solution had a low ionic strength (20 mM
HEPES, 0.1 mM EDTA, pH 7.4 buffer); the identification of the fibers consisted on visualizing
them by phase contrast microscopy (the authors claim that the fibers became visible after one
minute of incubation between the proteins and 1-stearoyl-2-oleoyl-sn-glycero-3-
phosphocholine/brainPS (8:2 molar ratio) liposomes) and by staining the fibers with CR and with
ThT. Since no fibers were seen in the presence of PC only, it appears evident that the presence of
negatively charged phospholipids is fundamental in the process of formation of fibers. These
investigators proposed that the binding to acidic phospholipids neutralizes the cationic charge in the
proteins, facilitating protein-protein interactions (that no longer repulse each other), which in turn
promotes protein polymerization and enhances protein fibril formation (Zhao et al., 2004). Other
studies concerning non-amyloidogenic proteins were later published; some endorse the observations
for certain proteins, like lysozyme (Gorbenko et al., 2007; Gorbenko and Trusova, 2011) or
cytochrome c (Alakoskela et al., 2006), while others have shown that other non-amyloidogenic
peptides/proteins, like endostatin (Zhao et al., 2005) and temporins B and L (Mahalka and
Kinnunen, 2009) also have this ability to form amyloid-like fibrils in the presence of lipids.
1.3. Lysozyme as a model protein
Lysozyme (EC 3.2.1.17), is the enzyme responsible for the cleavage of the glycosidic
linkage β (1-4) between N-acetylglucosamine and N-acetylmuramic acid in peptidoglycan, the
major component of cellular wall in Gram positive bacteria, leading to bacteria death.
Lysozyme amyloid formation has received a considerable attention since in 1993, Pepys and
co-workers identified in human lysozyme point mutations associated with hereditary systemic
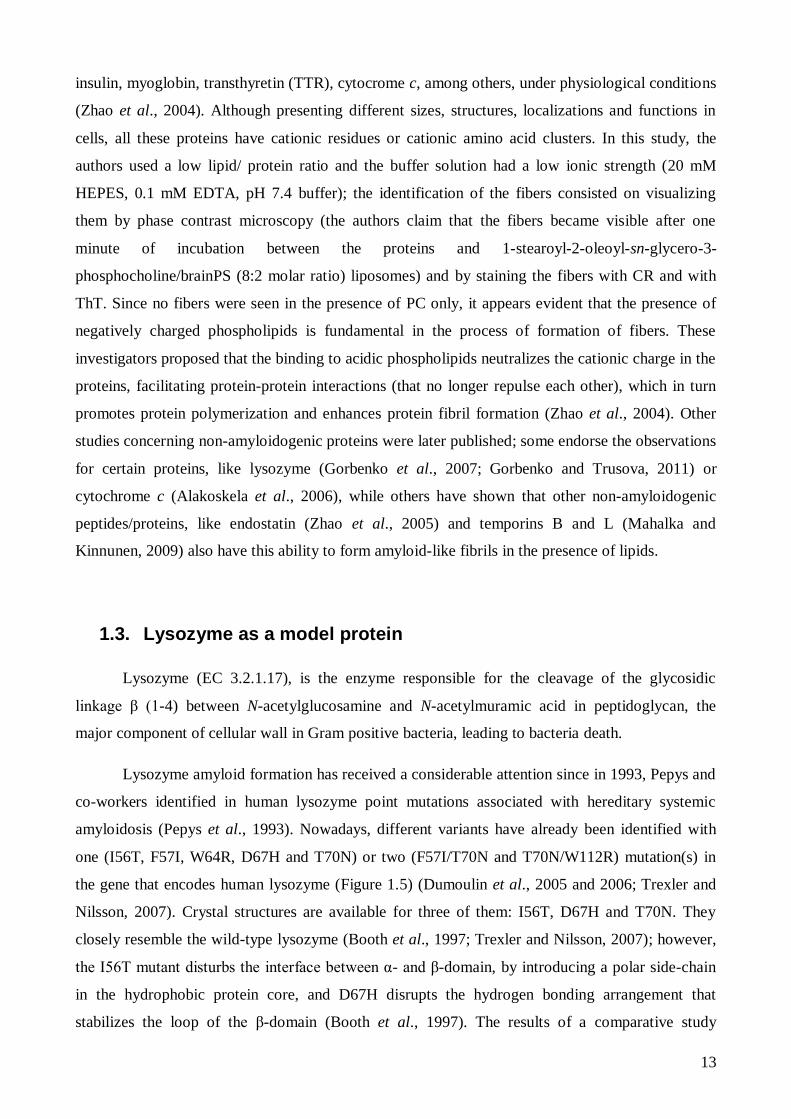
amyloidosis (Pepys et al., 1993). Nowadays, different variants have already been identified with
one (I56T, F57I, W64R, D67H and T70N) or two (F57I/T70N and T70N/W112R) mutation(s) in
the gene that encodes human lysozyme (Figure 1.5) (Dumoulin et al., 2005 and 2006; Trexler and
Nilsson, 2007). Crystal structures are available for three of them: I56T, D67H and T70N. They
closely resemble the wild-type lysozyme (Booth et al., 1997; Trexler and Nilsson, 2007); however,
the I56T mutant disturbs the interface between α- and β-domain, by introducing a polar side-chain
in the hydrophobic protein core, and D67H disrupts the hydrogen bonding arrangement that
stabilizes the loop of the β-domain (Booth et al., 1997). The results of a comparative study
Page 36
14
performed by Dumoulin and co-workers with I56T and D67H mutants suggested that these
lysozyme variants have the capacity to form transiently closely similar intermediate species (under
physiologically relevant conditions). The two mutations cause a very similar decrease of stability
and global cooperativity, despite their different locations and different effects on the native state of
the protein, which appears to be the origin of the in vivo amyloidogenicity of these two variants of
human lysozyme (Dumoulin et al., 2005).
Figure 1.5 – Ribbon diagram of the structure of human wild-type lysozyme showing the
locations of the known natural mutations.
The six mutations give rise to seven amyloidogenic variants shown in blue and one non-
amyloidogenic variant shown in black. The single point mutant W112R has not yet been detected.
Dissulfide bonds are shown in red and the four α-helices in the α-domain are labeled A through D.
Adapted from Dumoulin et al., 2006.
In 2006, amyloid fibrils formed by human lysozyme at low pH were digested by pepsin and
the resulting protease-resistant protein core was identified by mass spectrometry analysis (Frare et
al., 2006). The data showed that: (i) amyloid formation does not require the participation of the
entire lysozyme chain, (ii) the segment of the protein that appears to form the most stable
region of the amyloid core structure, 32–108, includes the β-sheet and helix C of the native
protein, and corresponds to the region (approximately residues 31–104) that was previously
found to be prone to unfold locally in human lysozyme and its pathogenic variants (I56T and
D67H) and (iii) that partial unfolding of the native structure of lysozyme is a crucial factor in
its conversion to amyloid structure.
Hen egg white lysozyme (HEWL) has been widely used as a model system for protein
folding/misfolding studies because it’s inexpensive, small, globular and monomeric protein that has
Page 37
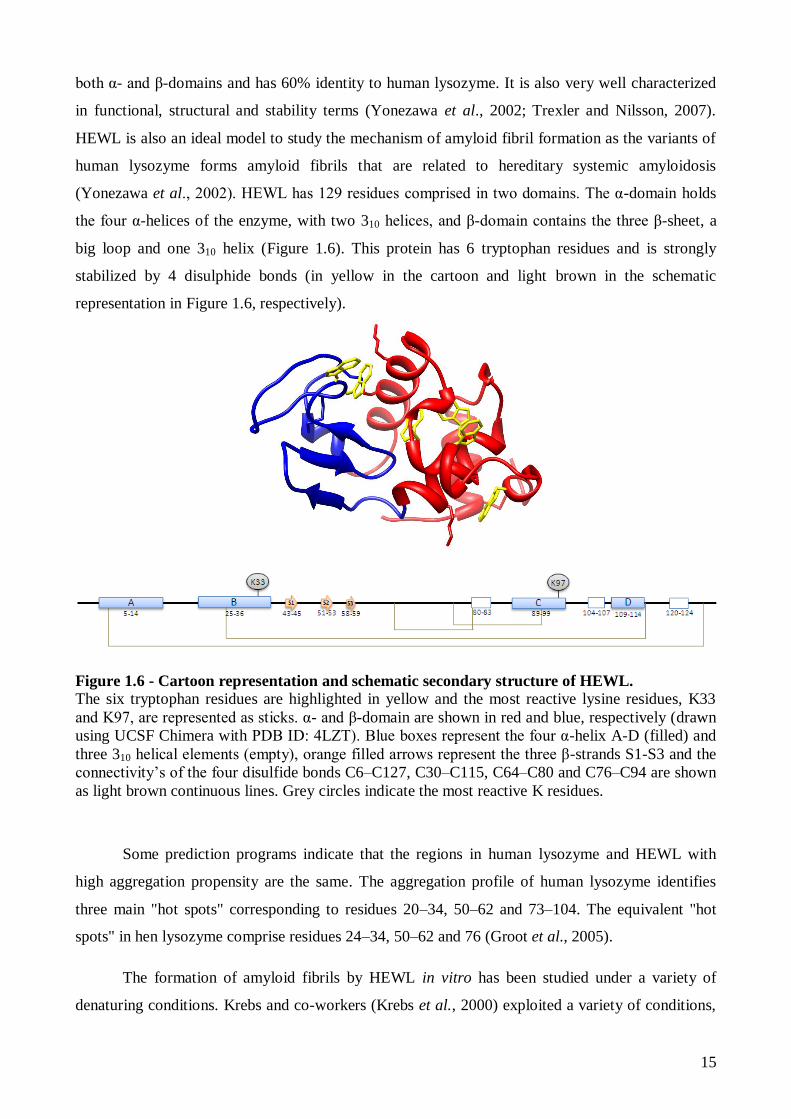
15
both α- and β-domains and has 60% identity to human lysozyme. It is also very well characterized
in functional, structural and stability terms (Yonezawa et al., 2002; Trexler and Nilsson, 2007).
HEWL is also an ideal model to study the mechanism of amyloid fibril formation as the variants of
human lysozyme forms amyloid fibrils that are related to hereditary systemic amyloidosis
(Yonezawa et al., 2002). HEWL has 129 residues comprised in two domains. The α-domain holds
the four α-helices of the enzyme, with two 310 helices, and β-domain contains the three β-sheet, a
big loop and one 310 helix (Figure 1.6). This protein has 6 tryptophan residues and is strongly
stabilized by 4 disulphide bonds (in yellow in the cartoon and light brown in the schematic
representation in Figure 1.6, respectively).
Figure 1.6 - Cartoon representation and schematic secondary structure of HEWL. The six tryptophan residues are highlighted in yellow and the most reactive lysine residues, K33
and K97, are represented as sticks. α- and β-domain are shown in red and blue, respectively (drawn
using UCSF Chimera with PDB ID: 4LZT). Blue boxes represent the four α-helix A-D (filled) and
three 310 helical elements (empty), orange filled arrows represent the three β-strands S1-S3 and the
connectivity’s of the four disulfide bonds C6–C127, C30–C115, C64–C80 and C76–C94 are shown
as light brown continuous lines. Grey circles indicate the most reactive K residues.
Some prediction programs indicate that the regions in human lysozyme and HEWL with
high aggregation propensity are the same. The aggregation profile of human lysozyme identifies
three main "hot spots" corresponding to residues 20–34, 50–62 and 73–104. The equivalent "hot
spots" in hen lysozyme comprise residues 24–34, 50–62 and 76 (Groot et al., 2005).
The formation of amyloid fibrils by HEWL in vitro has been studied under a variety of
denaturing conditions. Krebs and co-workers (Krebs et al., 2000) exploited a variety of conditions,
Page 38
16
in particular elevated temperatures, including incubation at 37 ºC and 65 ºC, rapid heating and
cooling followed by incubation at 37 ºC, and incubation at low pH (pH 2.0 and 4.0) and neutral pH
(pH 7.4) following the addition of organic solvents such as trifuoroethanol. The use of high
concentrations of protein, high temperatures and acidic conditions with (Wang et al., 2009;
Morshedi et al., 2010) and without stirring (Frare et al., 2004; Mishra et al., 2007; Hill et al., 2009;
Meratan et al., 2011) have been frequently reported. Concentrated alcohol solutions have also been
investigated (Yonezawa et al., 2002; Holley et al., 2008) as well as studies with the fully reduced
lysozyme (Cao et al., 2004). These conditions were found to favor the formation of partially
unfolded species that will interact with each other and eventually form amyloid-like fibrils. Partial
denaturation of lysozyme appears to be a necessary pre-condition for fibril assembly (Uversky and
Fink, 2004); if not, lysozyme monomers have a repulsive effect among them due to the high protein
net charge (Hill et al., 2011).
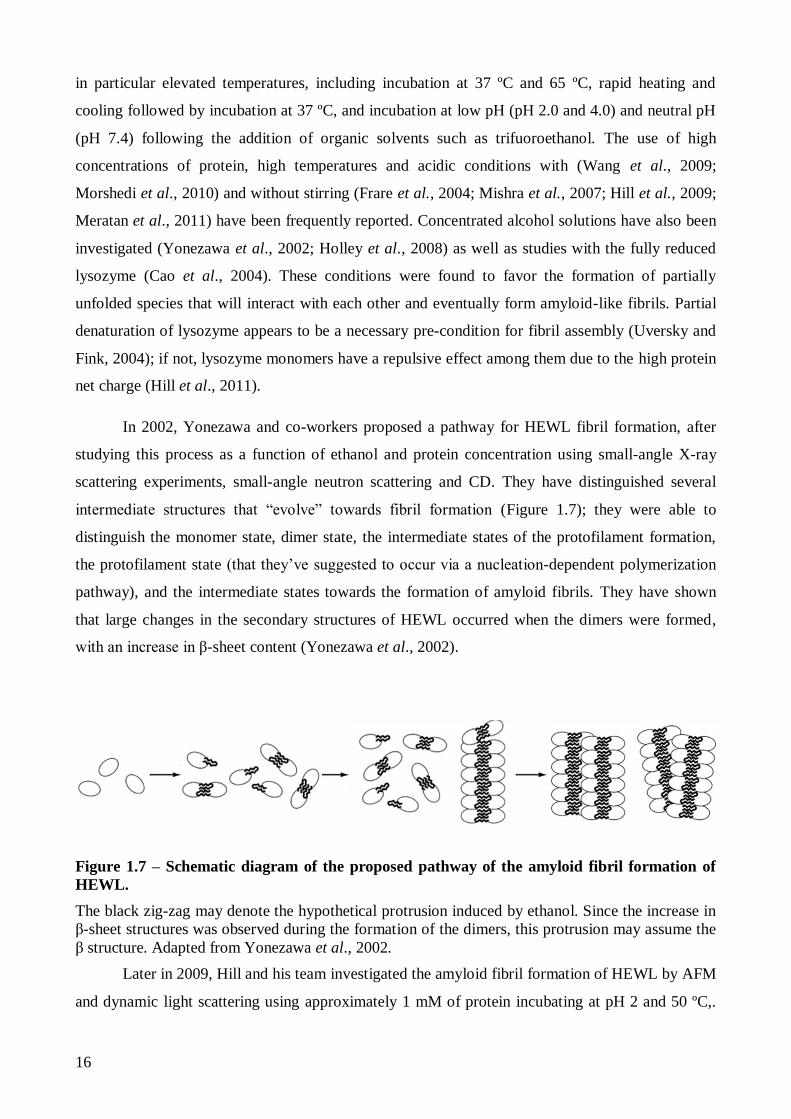
In 2002, Yonezawa and co-workers proposed a pathway for HEWL fibril formation, after
studying this process as a function of ethanol and protein concentration using small-angle X-ray
scattering experiments, small-angle neutron scattering and CD. They have distinguished several
intermediate structures that “evolve” towards fibril formation (Figure 1.7); they were able to
distinguish the monomer state, dimer state, the intermediate states of the protofilament formation,
the protofilament state (that they’ve suggested to occur via a nucleation-dependent polymerization
pathway), and the intermediate states towards the formation of amyloid fibrils. They have shown
that large changes in the secondary structures of HEWL occurred when the dimers were formed,
with an increase in β-sheet content (Yonezawa et al., 2002).
Figure 1.7 – Schematic diagram of the proposed pathway of the amyloid fibril formation of
HEWL.
The black zig-zag may denote the hypothetical protrusion induced by ethanol. Since the increase in
β-sheet structures was observed during the formation of the dimers, this protrusion may assume the
β structure. Adapted from Yonezawa et al., 2002.
Later in 2009, Hill and his team investigated the amyloid fibril formation of HEWL by AFM
and dynamic light scattering using approximately 1 mM of protein incubating at pH 2 and 50 ºC,.
Page 39
17
They proposed that the amyloid fibril assembly of lysozyme follows a strict hierarchical
aggregation pathway, with amyloid monomers, oligomers, and protofibrils forming on-pathway
intermediates for assembly into successively more complex structures (Hill et al., 2009). A more
recent study showed that HEWL assembles into amyloid fibers up to salt concentrations (NaCl) <
350 mM; above this concentration, there is disordered protein precipitation. It was also shown that
within low salt concentrations (< 150 mM NaCl) a monomeric assembly prevails involving the
nucleation of two filament populations of different length; here, each fibril is composed of three
monomeric filaments, and no oligomeric intermediates are detected. With intermediate salt
concentrations (150 mM > [NaCl] > 350 mM), oligomeric intermediates are the “building blocks”
of fibrils; the assemble of two oligomeric filaments constitutes a fiber (Hill et al., 2011). This
indeed suggests that there can be a significant morphological variation between fibrils formed by
the same peptide or protein, depending on the fibril formation conditions.
Although the human lysozyme and HEWL share only 60 % identity, by understanding the
fibril formation pathways of HEWL, including the intermediates involved, a major step forward in
the comprehension of amyloid fibril formation would be taken. This information could not only
help develop small therapeutic molecules to treat hereditary systemic amyloidosis but would also
help unravel the pathways of other disease-causing proteins. For example, it has been stated that the
relative sizes and appearance of lysozyme protofibrils and double-stranded fibrils, upon incubation
of HEWL in acidic pH and high temperature, share similarities with the morphologies seen in Aβ 1-
40 fibrils (Hill et al., 2009).
1.4. Some external fluorescent dyes commonly used to study
protein stability and aggregation
Whereas the study of native proteins and thermodynamically stable states is usually feasible
since it is possible to produce relatively large amounts of these material, it is harder to apply the
common used structural techniques to characterize protein aggregates and amyloid fibrils, since the
intermediates formed and the final mature aggregates/ amyloid fibrils are normally formed in small
quantities and are structurally diverse (Lindgren and Hammarströn, 2010). Fluorescence
spectroscopy has proved to be very insightful and complementary to more powerful techniques like
NMR, electron paramagnetic ressonance and computational approaches to tackle these problems. In
fact, fluorescence spectroscopy is one of the most powerful methods to study protein folding,
dynamics and interactions. It has also been applied to study membrane structure as well has protein-
lipid interactions.
Page 40
18
Fluorescence has several advantages that make it an appealing method to use. Almost all
proteins have intrinsic fluorophores, which allow the study of local and global changes in the
protein conformation upon varying its environment. When proteins are not intrinsically fluorescent
or when individual residues cannot be easily followed, it is possible to label proteins with extrinsic
fluorophores by chemical modification and mutagenesis. An external probe is likely to have a
similar behavior for many proteins and its optimal wavelengths are less likely to be protein-
dependent (Munishkina and Fink, 2007; Matulis et al., 2005). Fluorescence spectroscopy has low
sample requirements (pM-nM), quick assay times (Mishra et al., 2011) and normally a high signal-
to-noise ratio; it is also possible to perform ensemble-average measurements (e.g. in a cuvette),
follow a single-molecule (fluorescence correlation spectroscopy (FCS)) and do imaging (in a
microscope) that gives us spatial information about the sample under study. The fluorescence
emission lifetime is usually within the nanosecond range which is convenient to study fast protein
conformational changes (Munishkina and Fink, 2007).
In addition to intrinsic fluorophores, a variety of compounds have been developed to
function as extrinsic fluorescent dyes. They can be applied in different fields of protein analysis
such as characterization of conformational variants or folding intermediates, measurements of
surface hydrophobicity and detection of aggregates or fibrils (Hawe et al., 2008). Valuable
information about protein structure, unfolding and aggregation can come from the usage of extrinsic
fluorescent dyes as they are highly sensitive and versatile tools for protein characterization.
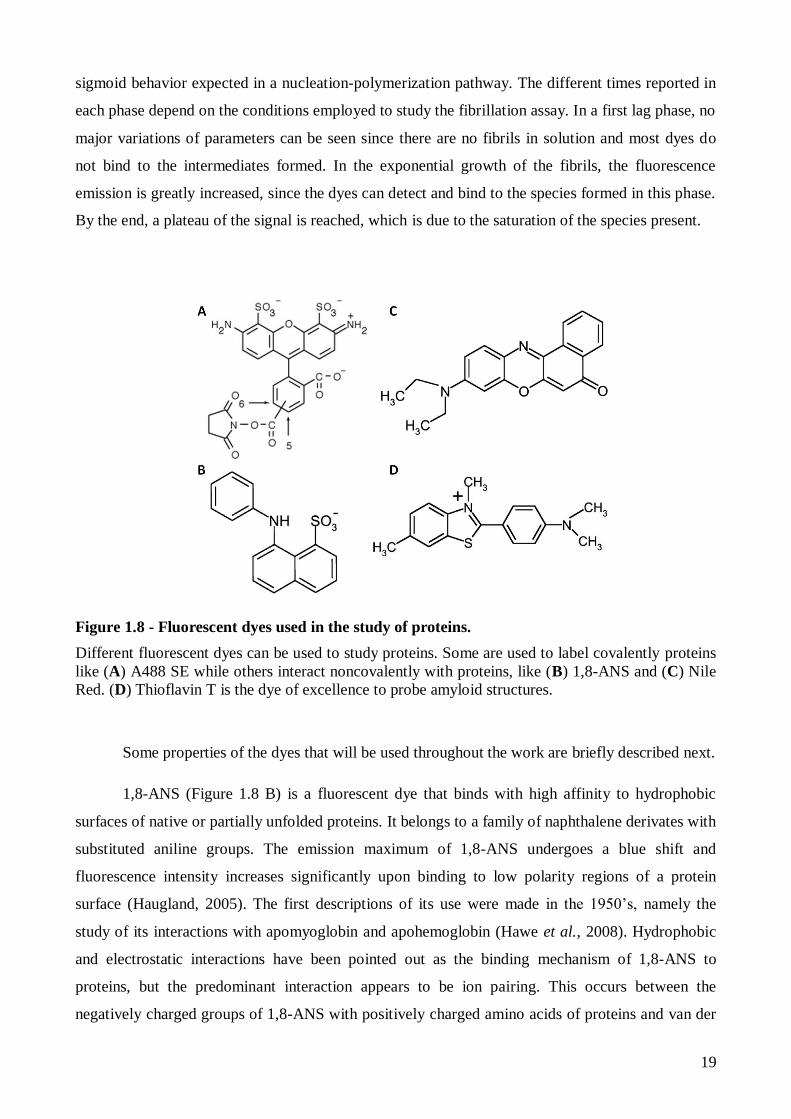
Fluorescent dyes can be covalently attached to proteins, e.g. via the ε-amino group of lysine or the
α-amino group of the N-terminus (eg: Alexa Fluor 488 carboxylic acid, succinimidyl ester (A488
SE) Figure 1.8 A) or the thiol group of cysteine, or interact noncovalently with proteins, e.g. via
hydrophobic or electrostatic interactions (for example 8-anilino-1-naphthalenesulfonic acid (1,8-
ANS) or Nile Red (NR), Figure 1.8 B and C, respectively).
Several different probes have been used to monitor the unfolding process of proteins and to
learn more about the intermediates formed, including NR, Sypro Orange (SO), dapoxyl sulfonic
acid, 4,40-dianilino-1,10-binaphthyl-5,50-disulfonic acid and 1,8-ANS (Sinisterra and Finerty,
2009). The basis for the use of extrinsic dyes for protein characterization comes from the fact that
the interaction of the dye with proteins will normally change the preferred relaxation pathway, for
example, from radiationless processes to fluorescence emission. Most dyes present low quantum
yields in solution that increases upon their binding to hydrophobic patches exposed by the
unfolding process or to fibrils (Hawe et al., 2008). Dyes are largely employed to follow fibrillation
kinetics assays due to their different characteristics depending on the medium inserted. The signal
reported when following their fluorescence emission resembles a sigmoid profile, which reflects the
Page 41
19
sigmoid behavior expected in a nucleation-polymerization pathway. The different times reported in
each phase depend on the conditions employed to study the fibrillation assay. In a first lag phase, no
major variations of parameters can be seen since there are no fibrils in solution and most dyes do
not bind to the intermediates formed. In the exponential growth of the fibrils, the fluorescence
emission is greatly increased, since the dyes can detect and bind to the species formed in this phase.
By the end, a plateau of the signal is reached, which is due to the saturation of the species present.
Figure 1.8 - Fluorescent dyes used in the study of proteins.
Different fluorescent dyes can be used to study proteins. Some are used to label covalently proteins
like (A) A488 SE while others interact noncovalently with proteins, like (B) 1,8-ANS and (C) Nile
Red. (D) Thioflavin T is the dye of excellence to probe amyloid structures.
Some properties of the dyes that will be used throughout the work are briefly described next.
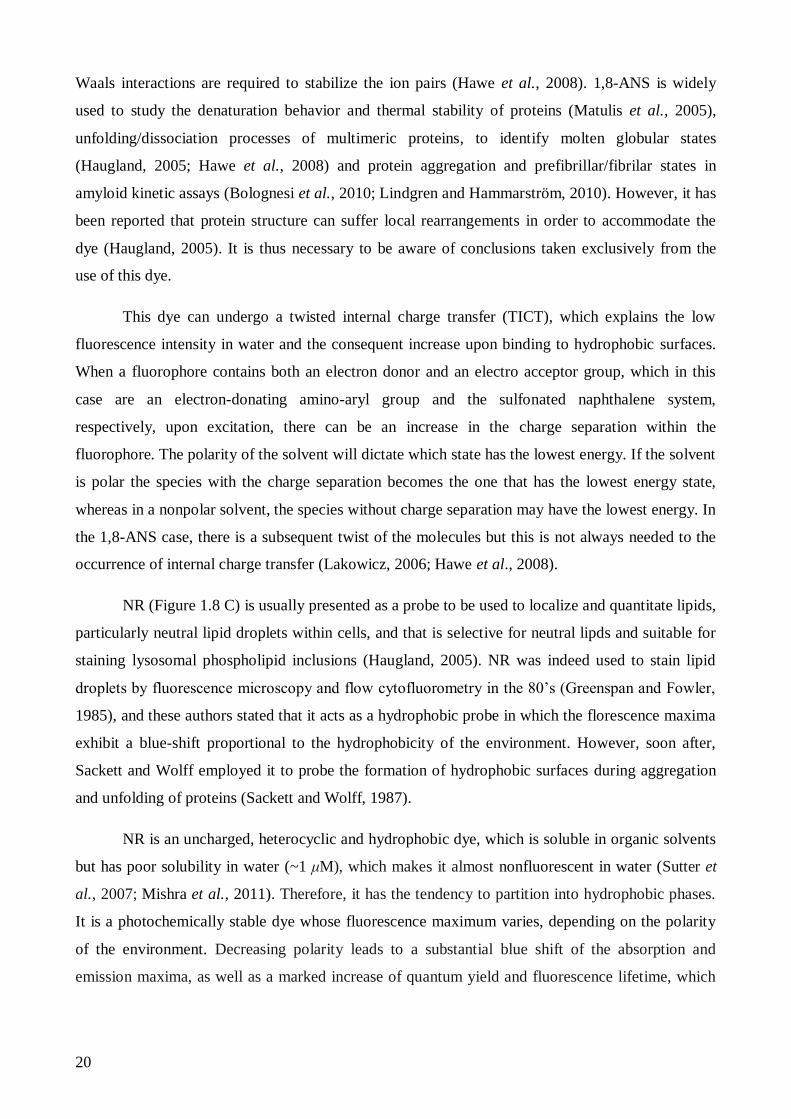
1,8-ANS (Figure 1.8 B) is a fluorescent dye that binds with high affinity to hydrophobic
surfaces of native or partially unfolded proteins. It belongs to a family of naphthalene derivates with
substituted aniline groups. The emission maximum of 1,8-ANS undergoes a blue shift and
fluorescence intensity increases significantly upon binding to low polarity regions of a protein
surface (Haugland, 2005). The first descriptions of its use were made in the 1950’s, namely the
study of its interactions with apomyoglobin and apohemoglobin (Hawe et al., 2008). Hydrophobic
and electrostatic interactions have been pointed out as the binding mechanism of 1,8-ANS to
proteins, but the predominant interaction appears to be ion pairing. This occurs between the
negatively charged groups of 1,8-ANS with positively charged amino acids of proteins and van der
Page 42
20
Waals interactions are required to stabilize the ion pairs (Hawe et al., 2008). 1,8-ANS is widely
used to study the denaturation behavior and thermal stability of proteins (Matulis et al., 2005),
unfolding/dissociation processes of multimeric proteins, to identify molten globular states
(Haugland, 2005; Hawe et al., 2008) and protein aggregation and prefibrillar/fibrilar states in
amyloid kinetic assays (Bolognesi et al., 2010; Lindgren and Hammarström, 2010). However, it has
been reported that protein structure can suffer local rearrangements in order to accommodate the
dye (Haugland, 2005). It is thus necessary to be aware of conclusions taken exclusively from the
use of this dye.
This dye can undergo a twisted internal charge transfer (TICT), which explains the low
fluorescence intensity in water and the consequent increase upon binding to hydrophobic surfaces.
When a fluorophore contains both an electron donor and an electro acceptor group, which in this
case are an electron-donating amino-aryl group and the sulfonated naphthalene system,
respectively, upon excitation, there can be an increase in the charge separation within the
fluorophore. The polarity of the solvent will dictate which state has the lowest energy. If the solvent
is polar the species with the charge separation becomes the one that has the lowest energy state,
whereas in a nonpolar solvent, the species without charge separation may have the lowest energy. In
the 1,8-ANS case, there is a subsequent twist of the molecules but this is not always needed to the
occurrence of internal charge transfer (Lakowicz, 2006; Hawe et al., 2008).
NR (Figure 1.8 C) is usually presented as a probe to be used to localize and quantitate lipids,
particularly neutral lipid droplets within cells, and that is selective for neutral lipds and suitable for
staining lysosomal phospholipid inclusions (Haugland, 2005). NR was indeed used to stain lipid
droplets by fluorescence microscopy and flow cytofluorometry in the 80’s (Greenspan and Fowler,
1985), and these authors stated that it acts as a hydrophobic probe in which the florescence maxima
exhibit a blue-shift proportional to the hydrophobicity of the environment. However, soon after,
Sackett and Wolff employed it to probe the formation of hydrophobic surfaces during aggregation
and unfolding of proteins (Sackett and Wolff, 1987).
NR is an uncharged, heterocyclic and hydrophobic dye, which is soluble in organic solvents
but has poor solubility in water (~1 μM), which makes it almost nonfluorescent in water (Sutter et
al., 2007; Mishra et al., 2011). Therefore, it has the tendency to partition into hydrophobic phases.
It is a photochemically stable dye whose fluorescence maximum varies, depending on the polarity
of the environment. Decreasing polarity leads to a substantial blue shift of the absorption and
emission maxima, as well as a marked increase of quantum yield and fluorescence lifetime, which
Page 43
21
is explained by TICT, similar to what is verified in 1,8-ANS. In NR, the electron transfer is from
the diethylamino group to the aromatic system (Hawe et al., 2008; Tajalli et al, 2008).
NR has been used to detect proteins in electrophoretic gels (Steinberg et al., 1996), for
monitoring aggregation of β-galactosidase (Sutter et al., 2007) and unfolding of bovine serum
albumin (Anand et al., 2011). Also, it has been demonstrated to be a versatile dye for detection and
characterization of amyloid fibrils grown in vitro from bovine insulin, HEWL, TTR, human Aβ1-42
and human prion protein 90-231 in neutral and acid pH. It was also shown to be sensitive to the
local structure of the proteins that surround the dye, since it presents different wavelength emission
maxima and apparent affinity for the different proteins (Mishra et al., 2011).
SO was initially design to detect and stain proteins, noncovalently, in electrophoretic gels, in
nanogram levels. It was presented as an alternative to silver, which also stained nucleic acids and
bacterial lipopolysaccharides, and to some other fluorescent probes which required covalent
labeling (Steinberg et al., 1996). It was then employed in high-throughput screening methods,
designed to analyze multiple samples with small amounts of material. These assays are based on the
increase in fluorescence intensity of the dye SO when bound to hydrophobic areas/regions of
thermally unfolded proteins (Lo et al., 2004, Hawe et al., 2008). Although its structure and molar
extinction coefficient are still not publically available (Layton and Hellinga, 2010), SO has been
successfully employed to identify optimum formulation conditions for crystallization and
purification of proteins, with respect to pH, buffer, excipients and ligands, and to collect thermal
denaturation data and characterize binding affinity constants by thermal shift (Lo et al., 2004; Hawe
et al., 2008; Sinisterra and Finerty, 2009; Layton and Hellinga, 2010). Probes like SO come to suit
the urge on developing a number of economical and straightforward techniques that allow protein
stabilities to be determined, as well as to identify small molecule compounds or inhibitors that
interact with the purified proteins. They might serve as starting points for drug/ligand discovery and
to improve protein purification and crystallization (Matulis et al., 2005; Sinisterra and Finerty,
2009; Layton and Hellinga, 2010).
The most used fluorescent probe to detect amyloid fibrils is ThT (Figure 1.8 D). This dye is
composed by two rings, a benzylamine and a benzathiole ring linked by a carbon bond (Stsiapura et
al., 2008; Kumar et al., 2008; Biancalana and Koide, 2010; Groenning, 2010). ThT was introduced
in 1959 by Vassar and Culling to stain amyloid fibrils in tissue sections/histology (Biancalana and
Koide, 2010). It was right away compared to CR as being far superior to demonstrate the presence
of amyloid. ThT displays an enhanced fluorescence emission when bound to fibrils and a shift in
the emission maximum from 445 to 482 nm (Groenning, 2010). The basis for this difference comes
Page 44
22
from the fact that ThT functions as a molecular rotor (Stsiapura et al., 2008); when the dye is in
aqueous solutions, the two rings rotate freely across the carbon bond that links them and this
rotation quenches the molecule excited state. When bound to structures that limit this rotation, the
fluorescence quantum yield increases since the loss of excitation by the non-radiative decay process
(rotation) is not available (Kumar et al., 2008; Biancalana and Koide, 2010; Groenning, 2010).
The enhanced fluorescence emission is the key element in the usage of this dye to follow
amyloid fibril formation. With the increase of structural models for amyloid fibrils, several groups
tried to rationalize the binding of ThT to such entities. It is widely accepted that amyloid fibrils
share a cross-β architecture and fibril-ThT interactions are explained via the binding of ThT
molecules aligned parallel to the long axis of the fiber (Figure 1.9).
Figure 1.9 – Model proposed to explain the binding of Thioflavin T to amyloid fibrils.
ThT molecules (purple arrow) aligned parallel to the long axis of the fiber, interacting with the
polypeptide chains. Adapted from Biancalana and Koide, 2010.
ThT does not affect fibrillation kinetics (or only to a limit extent) (Groenning, 2010).
Although considered to be specific for amyloid fibers, several reports show fluorescence
enhancement of ThT upon binding to native proteins (e.g. AchE), dimers, trimers, large aggregates
of β-lactoglobulin, early oligomers formed during the fibrillation of TTR or Aβ, DNA or sodium
dodecyl sulfate (SDS) (Kumar et al., 2008; Hawe et al., 2008). These observations highlight the
need to confirm if ThT binds to the initial material, if it is going to be used to follow fibrillation
kinetics. ThT fluorescence has already been proven to be pH-dependent, upon binding to fibrils of
insulin, lysozyme, TTR, human prion protein, and Aβ 1-42, with a 10-fold decrease in intensity
upon lowering the pH (Mishra et al., 2011). So different conditions, namely different pH, ionic
strength, ThT concentration and amyloid fibril origin (different proteins and different morphologys)
must be carefully compared (Groenning, 2010).
Page 45
23
1.5. Objectives and thesis organization
An important research line over the last couple of years at the host laboratory has been
trying to elucidate whether negatively-charged liposomes can, in fact, trigger the formation of
amyloid-like assemblies by non-amyloidogenic proteins under conditions close to physiological, as
first proposed by Kinnunen´s group (Zhao et al., 2004). In order to elucidate this question, HEWL
was chosen as a model non-amyloidogenic protein and its interaction with liposomes prepared with
a variable anionic lipid content was studied in great detail using mainly steady-state and time-
resolved fluorescence measurements. First, A488 SE was covalently conjugated to lysozyme (Lz-
A488) to study its partition behavior towards POPC large unilamellar vesicles (LUVs) containing
variable mol% of POPS using FCS. This study confirmed that lysozyme binding to negatively
charged liposomes is dominantly driven by electrostatic interactions (Melo et al., 2011). Secondly,
the variation of Lz-A488 fluorescence properties as a function of total lipid concentration allowed
identifying three consecutive stages in lysozyme interaction with acidic lipid vesicles. In this study,
it was shown that the critical parameter controlling the photophysical properties of Lz-A488 was the
surface coverage of the anionic liposomes by the conjugated protein (Melo et al., 2012).
The results obtained in these experiments, briefly described above, raised the important issue
whether the fluorescence properties of the fluorophore Alexa 488 are able to report conformational
transitions undergone by lysozyme. This question was first addressed here by monitoring the
thermal denaturation of Lz-A488 at both pH 2.2 and 7.4 using fluorescence spectroscopy (both
steady-state and time-resolved fluorescence measurements were made). The thermal unfolding of
lysozyme is a topic thoroughly studied in the literature, both experimentally and computationally
(Arnaudov and Vries, 2005; Lee et al., 2006; Meersman et al., 2010), providing an adequate
framework to compare and interpret the fluorescence data obtained in these thermal unfolding
studies.
The impact of lysozyme fibrillation on the fluorescence properties of Lz-A488 was also
studied by carrying out fibrillation assays at acidic pH and elevated temperature (pH 2.2. and 57
ºC), using two different lysozyme concentrations, namely 0.2 and 1.0 mM. These conditions have
already been shown to promote the misfolding and aggregation of lysozyme into amyloid-like
fibrils after incubation for some days under quiescent conditions (Frare et al., 2004; Mishra et al.,
2007; Hill et al., 2009; Meratan et al., 2011). In these studies, the ability of Lz-A488 to form mixed
fibrils with lysozyme was first evaluated by performing different fluorescence measurements (both
Page 46
24
steady-state and time-resolved fluorescence intensity and anisotropy measurements, and
fluorescence imaging). Then, the influence of Lz-A488/lysozyme mixing ratio (1/2, 1/8, 1/40, 1/100
and 1/200) on both the kinetics of lysozyme fibrillation and the structural properties presented by
the isolated mature mixed lysozyme fibrils were investigated. Controls assays were carried out in
parallel by monitoring lysozyme fibrillation using two amyloid-specific fluorescent probes, ThT
and NR. Some additional studies were also performed with NR to characterize its binding affinity to
mature isolated lysozyme fibrils using both steady-state and time-resolved fluorescence
measurements.
Finally, a fluorescence partition study of ThT towards POPC LUVs containing variable
mol% of POPS was carried out. In addition, the ability of ThT spectroscopic properties to detect
amyloid-like fibrils in the presence of anionic lipid membranes was addressed by performing
competition binding assays of ThT and lysozyme/ mature lysozyme amyloid fibrils and POPC
LUVs containing 20mol% of POPS.
Page 47
2. Materials and Methods
Page 49
27
2.1. Materials
Lysozyme (EC 3.2.1.17) from chicken egg white was purchased from Sigma. 1-Palmitoyl-2-
oleoyl-sn-glycero-3-phosphocholine (POPC) and 1-palmitoyl-2-oleoyl-sn-glycero-3-phosphoserine
(POPS) (Figure 3.1) were obtained from Avanti Polar Lipids.
Figure 3.1 - Chemical structures of the phospholipids used in this study.
A - 1-Palmitoyl-2-oleoyl-sn-glycero-3-phosphocholine (POPC). B - 1-palmitoyl-2-oleoyl-sn-
glycero-3-phosphoserine (POPS). Adapted from http://avantilipids.com/ (last consulted on
4/8/2012).
The fluorescent probes Alexa Fluor 488 carboxylic acid, succinimidyl ester (mixed isomers,
dilithium salt) (A488 SE), NR, 1,8-ANS (Figure 1.8) were obtained from Molecular Probes,
Invitrogen. ThT (Figure 1.8) and SO were obtained from Sigma-Aldrich. Tris
(tris(hydroxymethyl)aminomethane), potassium hydroxide, ethylenediamine-N,N,N’,N’-tetraacetic
acid (EDTA) and the organic solvents chloroform, methanol and dimethylsulphoxide (DMSO), of
spectroscopic UVasol grade, were obtained from Merck. HEPES (4-(2-hydroxyethyl)-1-
piperazineethanesulfonic acid), glycine and hydroxylamine were purchased from Sigma-Aldrich.
Unless otherwise stated, all other chemicals were purchased from Sigma-Aldrich and used as
provided.
The main buffer systems used in this work were (i) 20 mM HEPES-KOH, 0.1 mM EDTA,
pH 7.4 (HEPES-KOH buffer, pH 7.4), (ii) 50 mM glycine, pH 2.2 (glycine buffer, pH 2.2) and (iii)
50 mM Tris-HCl, pH 7.4 (Tris-HCl buffer, pH 7.4). The buffer solutions were prepared using
ultrapure water produced using a Milli-Q system (>18 MΩ cm) (Q-Gard 1 Millipore) and were
Page 50
28
always filtered with 0.22 m cellulose acetate filters (Millipore) or with 0.2 m nylon membrane
filters (Sartorius) prior to use.
The stock solutions of the different fluorescent probes were prepared and quantified
spectrophotometrically according to the conditions summarized in Table 3.1. The stock solution of
NR in methanol was filtered before its spectrophotometric quantification and was kept at 4 ºC. The
ThT stock solution was always freshly prepared and filtered using 0.22 m cellulose acetate filters
prior to use.
Table 3.1 - Conditions employed in the preparation and quantification of the different
extrinsic dye stock solutions used in this work.
Fluorescent
probe Mr
(g/mol) Concentration/ solvent of the
stock solution
Spectrophotometric quantification
(nm)
(M
-1cm
-1)
Reference
Nile Red 318.37 0.5 mM in methanol 552 4.5 104 Haugland, 2005
1,8-ANS
299.34
1.2 mM in:
- Glycine buffer, pH 2.2 or
- HEPES-KOH buffer, pH 7.4
350
5.0 103
Shcharbin et al., 2007
Thioflavin T
318.86
1.0 mM in:
- Glycine buffer, pH 2.2 or
- Tris-HCl buffer, pH 7.4
412
3.6 104
Foderá et al., 2008
2.2. Fluorescent labeling of lysozyme
Fluorescent labeling of lysozyme on its amine groups with A488 SE was carried out
essentially according to the instructions provided by the manufacturer (Haugland, 2005). Briefly,
the A488 SE was dissolved in DMSO and added slowly, drop by drop, into 0.75 mM lysozyme in
0.1 M sodium bicarbonate buffer, pH 8.3 under constant stirring. The covalent labeling reaction was
allowed to proceed in the dark for 2 h at room temperature using a dye-to-protein molar ratio (D/P)
of 2 in the reaction mixture. The labeling reaction was stopped using 1.2 M hydroxylamine freshly
prepared at pH 8 - 8.5, followed by a further incubation for 1 h at room temperature. The reaction
mixture was then centrifuged at 10 000 g for 10 min at room temperature (centrifuge Sigma
2K15). Lz-A488 was separated from unreacted free probe by gel filtration chromatography using a
Page 51
29
Sephadex G-25 (Sigma) column (30.5 cm × 1.6 cm) equilibrated in HEPES-KOH buffer, pH 7.4.
Approximately 1 mL fractions were collected manually and characterized spectrophotometrically to
determine the labeling ratio of Lz-A488 present in each fraction. The concentrations of A488, ,
and protein, present in each sample, respectively, and its final labeling stoichiometry D/P were
calculated using the following equations (Brinkley, 1992; Haugland, 2005):
Eq. 3.1
Eq. 3.2
Eq. 3.3
Eq. 3.4
where and
are the molar absorption coefficient and absorbance of A488 at its
maximum absorption wavelength, λmax, respectively ( = 7.1 10
4 M
-1cm
-1 (Haugland, 2005)),
and
are the molar absorption coefficient of lysozyme and the absorbance of each
fraction at 280 nm, respectively ( = 37 680 M
-1cm
-1 (Pace et al., 1995)), and is a correction
factor that takes into account the contribution of the dye to the sample absorbance at 280 nm ( =
0.11 for A488; Haugland, 2005). The more concentrated Lz-A488 fractions that presented similar
labeling ratios were pooled together and kept at 4 ºC until used. The labeling procedure was
repeated once and very similar D/P values were obtained in each case ((D/P)1= 0.69 ± 0.04 (n= 3)
and (D/P)2= 0.71 ± 0.06 (n= 2), respectively).
Some experiments (lysozyme thermal denaturation and fibrillation studies (vide infra)) were
conducted at pH 2.2. Therefore, Lz-A488 was first dialyzed against glycine buffer, pH 2.2 at room
temperature using a mini dialysis kit from Amersham Biosciences (porous membrane cut-off of 8
kDa) to exchange the sample buffer. When necessary, Lz-A488 pooled fractions were concentrated
using Amicon® Ultra-15 filter units (cut-off 3 kDa (Millipore)) spun at 5 000 g and 4 ºC
(centrifuge Eppendorf 5804 R). The final Lz-A488 concentrations obtained after these procedures
Page 52
30
were always confirmed spectrophotometrically using the molar absorption coefficients presented
above.
2.3. Thermal denaturation of lysozyme and A488-fluorescently
labeled lysozyme
The thermal stability of Lz-A488 was studied by both steady-state and time-resolved
fluorescence measurements at both pH 2.2 and 7.4. Lz-A488 was diluted to 1 µM in glycine buffer,
pH 2.2 or HEPES-KOH buffer, pH 7.4, respectively. The samples were introduced in 1 cm 1 cm
fluorescence quartz cuvettes (Hellma Analytics) and their steady-state fluorescence emission
spectra were measured as a function of temperature using a spectrofluorimeter containing a Peltier-
controlled thermostated cell support. The cuvette temperature was scanned automatically between
20 and 90 ºC (± 0.2 ºC) with 1 ºC increments and allowing 3 minute equilibration at each
temperature. The samples were continuously stirred using small magnetic stirrer bars. Control
samples containing 0.68 µM of the free dye in each buffer were studied in parallel. The samples
were excited at 480 nm and their emission spectra were measured between 490 and 600 nm. The
fluorescence intensity decay was also measured as a function of temperature, using λexc= 340 nm
and λem= 515 nm. In addition, two different extrinsic probes, 1,8-ANS and SO, were used to detect
the thermally-induced lysozyme unfolding at each pH. In the first case, the thermal denaturation of
1 µM lysozyme in the presence of 20 µM of 1,8-ANS was followed at both pH 2.2 and 7.4; in the
second case, the thermal unfolding of 1 µM lysozyme in the presence of SO (5 concentration of
S5692 Sigma-Aldrich) was studied at pH 7.4. The 1,8-ANS containing samples were excited at 350
nm and their emission spectra were measured between 400 and 650 nm; the SO containing samples
were excited at 470 nm and their emission spectra were measured between 480 and 750 nm.
2.4. Kinetics of lysozyme amyloid fibril formation
Lysozyme amyloid fibril formation was initiated by incubating either 0.2 or 1.0 mM
lysozyme in glycine buffer, pH 2.2 at 57 ºC (Figure 3.2). Each stock solution of lysozyme was
previously centrifuged at 18 320 g for 90 min to ensure that no aggregates remained in solution.
At different time intervals, lysozyme stocks were mixed by vortexing for 5 s and an aliquot of 4 L
was withdrawn and mixed with either NR or ThT, to a final volume of 800 L. The final
concentrations in the analyzed samples were 1 or 5 M protein (on a monomer basis) (obtained
Page 53
31
from 0.2 and 1 mM lysozyme stock solutions, respectively) and 2.9 M NR (in glycine buffer, pH
2.2) or 8.6 M of ThT (in Tris-HCl buffer, pH 7.4). In parallel, variable mixtures of Lz-A488 and
unlabeled lysozyme were prepared using different molar ratios and final total protein concentrations
(Table 3.2 and Figure 3.2). These were further treated to form amyloid fibrils in a way similar to
that described above (incubation at pH 2.2 and 57 ºC for several days). Again, after vortexing for 5
s the fibrillation mixture under study, an aliquot of 4 L was withdrawn at different time intervals
and diluted 200-fold with glycine buffer, pH 2.2. The final protein concentrations (on a monomer
basis) present in each sample obtained at different time points are also summarized in Table 3.2.
Figure 3.2 - Schematic representation of the experimental procedure used in the study of
lysozyme amyloid fibril formation.
Each sample was kept for 30 min at room temperature before measuring their fluorescence
emission spectra and steady-state fluorescence anisotropies at 25 ºC using 0.5 cm 0.5 cm
fluorescence quartz cuvettes (Hellma Analytics) (Table 3.3). Time-resolved fluorescence
measurements (fluorescence intensity and anisotropy decays) of these samples were also made at 25
Page 54
32
ºC (Table 3.3). When necessary, the samples were kept at 4 ºC protected from light before doing
these measurements.
Table 3.2 - Total protein, labeled (Lz-A488) and unlabeled lysozyme (Lz) concentrations used
in the fibrillation kinetic assays performed at pH 2.2 and 57 ºC.
Variable molar ratios of labeled/unlabeled lysozyme were used during the incubation of lysozyme
mixtures in each fibrillation experiment. The final total protein and labeled lysozyme concentrations
present in each aliquot obtained at different time points are expressed on a monomer basis.
[Lz]T
(mM)
Incubation fibrillation mixture Analyzed sample
[Lz-A488]
(mM)
[Lz]
(mM)
Lz-A488/Lz
molar ratio
[Lz]total
(µM)
[Lz-A488]
(µM)
0.2 0.100 0.100 1/2
1 0.500
0.025 0.175 1/8 0.125
1.0
0.025 0.975 1/40
5
0.125
0.010 0.990 1/100 0.050
0.005 0.995 1/200 0.025
Table 3.3 - Excitation and emission wavelengths used in the steady-state and time-resolved
fluorescence measurements performed with each sample obtained at different time points
during the study of lysozyme fibrillation kinetics at pH 2.2 and 57 ºC.
Fluorescent
dye
Fluorescence emission
spectra
Steady-state anisotropy
measurements
Time-resolved fluorescence
measurements
exc
(nm) em
(nm)
exc
(nm) em
(nm)
exc
(nm) em
(nm)
Alexa 488 480 490 - 600 495 515 460
515
Thioflavin T 450 470 - 600 450 480 450 480
Nile Red 552 565 - 800 562 636 565 650
Page 55
33
2.5. Isolation of mature lysozyme amyloid fibrils
After an incubation period not shorter than 12 days, mature lysozyme amyloid fibrils were
isolated by centrifugation (18 320 x g, 3 x 60 min). The concentration of protein remaining in the
supernatants were determined using the above stated extinction coefficient for lysozyme at 280 nm.
The fibril concentration was determined (on a monomer basis) by subtracting the amount of protein
in the supernatants from the final amount of lysozyme expected to be present at the end of the
fibrillation kinetics and taking into account the final volume in their ressuspension (Meratan et al.,
2011).
Figure 3.3 – Schematic representation of the protocol used to obtain mature lysozyme fibrils.
The final pellet III was ressuspended in glycine buffer, pH 2.2 and corresponds to the mature
isolated lysozyme fibrils. The amount of lysozyme present in each supernatant was quantified
spectrophotometrically at 280 nm and subtracted from the final amount of lysozyme expected to be
present at the end of the fibrillation kinetics, in order to calculate the final fibril concentration on a
monomer basis.
Page 56
34
2.5.1. Nile Red binding to mature lysozyme amyloid fibrils
The changes in NR fluorescence properties upon its binding to lysozyme fibrils were used to
determine the equilibrium dissociation constant of the dye from amyloid fibrils in glycine buffer,
pH 2.2. The same concentration of NR (2.9 µM) was added to freshly and independently prepared
fibril samples, ranging from 0 to 115 µM total protein concentration (on a monomer basis). After an
incubation time of 30 min at room temperature, the steady-state and time-resolved fluorescence
measurements were performed as indicated in Table 3.3.
Considering that NR binding sites in amyloid fibrils are independent of each other, the
equilibrium dissociation constant of the dye from lysozyme amyloid fibrils, Kd, is determined as
follows (Celej et al., 2008):
Eq. 3.5
where and are the concentrations of Nile Red free and bound to the fibrils,
respectively, is the total lysozyme concentration (on a monomer basis) and (
represents the concentration of free binding sites. An unitary stoichiometry was considered in
describing the binding of the dye to the protein (NRf + P NRb) since it is difficult to implement
more sophisticated thermodynamic techniques to determine the number, nature and distribution of
dye-binding sites on the fibrils. Taking into account the mass balance equations:
Eq. 3.6
Eq. 3.7
and
Eq. 3.8
the following Eq. 3.9 is obtained:
Eq. 3.9
Page 57
35
The bound molar fraction of the dye, , was calculated by analyzing the fluorescence
anisotropy decays of NR obtained in the presence of increasing amounts of lysozyme fibrils
according to an associative model (see section 3.2.1.3). Eq. 3.9 was than fitted to the experimental
data of versus by a non-linear least-squares regression method using as the fitting
parameter.
2.6. Interaction of lysozyme and mature lysozyme amyloid fibrils
with anionic lipid membranes
2.6.1. Preparation of large unilamellar vesicles
LUVs containing POPC mixtures with 10, 20 or 30 mol% POPS were prepared by means of
the extrusion technique (Mayer et al., 1986). Stock solutions of POPC and POPS (with
approximately 18 mM) were prepared in chloroform and stored at -20ºC and the exact
concentrations of these solutions were determined using phosphate analysis (McClare, 1971).
Adequate volumes of each phospholipid stock solution were mixed in a round-bottom flask and a
thin lipid film was formed by drying the solvent out using a gentle N2 flow and then further
evaporated overnight under an oil pump vacuum. Phospholipid mixtures were hydrated with
HEPES-KOH buffer, pH 7.4 and repeatedly vortexed until all lipid was removed from the flask
wall. The lipid dispersions were equilibrated by freeze-thaw cycles using liquid nitrogen and a 50
ºC water bath. They were then extruded 31 times through polycarbonate membranes of 100-nm
pore size (Nucleopore) using a miniextruder device (Avanti Polar Lipids) with 1001RN syringes
(Hamilton). The resulting stock solution was stored at 4 ºC and the lipid vesicles were used within 2
days of preparation.
2.6.2. Thioflavin T partition to anionic lipid membranes
The increase in ThT quantum yield upon its partitioning to POPC LUVS prepared with
variable mol% of POPS (10, 20 and 30 mol%) was used to determine the dependence of its
membrane partition coefficient with the mol% of anionic phosphoslipid included in the lipid
vesicles. A stock solution of ThT in HEPES-KOH buffer, pH 7.4 was freshly prepared before the
assay and a constant concentration of 9 µM of ThT was added to LUVs suspensions prepared
Page 58
36
independently ranging from 0 to 6 mM total phospholipid concentration. After an incubation time
of 1 h at room temperature, the fluorescence emission spectra of ThT was measured between 465
and 700 nm using exc = 450 nm. Adequate controls (with the same concentrations of lipid but
without ThT) were also prepared in parallel and their fluorescence intensities were subtracted from
the corresponding sample.
The mole-fraction ThT partition coefficient, Kp, is an equilibrium constant described as:
Eq. 3.10
where and are the moles of water and lipid, and are the moles of ThT present in each
phase (i=W, aqueous phase; i=L, lipid phase). However, and like in most experimental conditions,
and (to avoid deviations from ideal behavior), the definition is
simplified to:
Eq. 3.11
The fluorescence intensity of ThT measured will be a sum of the fluorescence intensity of
the fraction of ThT present in water and in lipid:
Eq. 3.12
where and
are the limiting intensity of ThT in water and lipid, respectively, and and
are the molar fractions of ThT in water and lipid, respectively. Considering the mass balance
and the simplified formulation of the partition coefficient, Kp was
determined by fitting Eq. 3.13 to the experimental data obtained at each mol% of POPS by a non-
linear least-squares regression method using OriginPro 8 software:
Eq. 3.13
where I= - and Imax=
- , [L]ac is the accessible lipid concentration (half of the total
lipid concentration used in each sample) and [W] is the molar concentration of water (55.5 M at 25
Page 59
37
ºC, Santos et al., 2003). A multi-curve fit of the experimental data by Eq. 3.13 was performed by
linking Imax during the fitting of the three experimental data sets.
2.6.3. Competitive binding of Thioflavin T to mature lysozyme amyloid fibrils
and anionic lipid membranes
To evaluate the ability of ThT to detect amyloid fibrils in the presence of anionic lipid
membranes, competition binding assays of ThT and lysozyme/ mature lysozyme amyloid fibrils and
POPC LUVs containing 20 mol% of POPS to ThT were carried out at room temperature. Briefly,
lysozyme or pre-formed lysozyme fibrils, ranging from 0 to 6 µM total protein concentration (on a
monomer basis) were added to a fixed concentration of 0.86 mM POPC:POPS 80:20 LUVs. After 1
hour incubation of the LUV-protein mixtures at room temperature, 9 µM ThT was added to each
sample. The fluorescence emission intensity of ThT in each sample was then measured between 470
and 600 nm using exc = 450 nm after a further incubation period of 30 min. Control samples
containing the same concentrations of dye and protein but without lipids were also measured.
2.7. Instrumentation
2.7.1. UV-visible Spectroscopy
UV-visible absorption measurements were carried out at room temperature using a
Shimadzu MPC-3100 spectrophotometer (Shimadzu Scientific Instruments). Typically, the
absorption spectra were measured in 1 cm x 1 cm or 1 cm x 0.4 cm path length quartz cuvettes
(Hellma Analytics) using a bandwidth and sampling interval of 1 nm.
2.7.2. Fluorescence spectroscopy
2.7.2.1. Steady-state fluorescence measurements
Fluorescence measurements were usually performed in a right-angle geometry using 0.5 cm
0.5 cm width quartz cuvettes and an SLM-AMINCO 8100 spectrofluorometer (SLM Instruments
Inc.). This apparatus, which has double excitation and emission monochromators, is fitted with
automated rotating Glan-Thompson polarizers and was operated in “photon counting” mode. The
light source was a 450-watt Xe arc lamp and the reference was a Rhodamine B quantum counter
Page 60
38
solution. The sample temperature was controlled with a water circulating bath from Julabo (model
F25). The excitation and emission wavelengths employed in each experiment are described in their
respective section of Materials and Methods. Background intensities were always taken into
account and subtracted from the measured sample intensities.
The steady-state fluorescence anisotropy, , is defined by:
Eq. 3.14
and was obtained by measuring the vertically (parallel, IVV) and horizontally (perpendicular, IVH)
polarized components of the fluorescence emission with the excitation polarized vertically. G is an
instrumental factor (G = IHV/IHH) that corrects for bias in the transmissivity between vertically and
horizontally polarized components of the emission introduced by the detection system.
The thermal denaturation studies of lysozyme and Lz-A488 were performed in a HORIBA
Jobin Yvon Fluorolog-3-22 spectrofluorometer using 1 cm 1 cm width quartz cuvettes because
this apparatus is equipped with a FI-3751 thermoelectric temperature controller (Wavelength
Electronics) which allows programming temperature ramps and automatic data acquisition. This
apparatus, which has double excitation and emission monochromators, is fitted with automated
rotating Glan-Thompson polarizers and was operated in “photon counting” mode. The light source
was a 450-watt Xe lamp and the reference was a silicon diode. The excitation and emission
wavelengths employed in each experiment are described in their respective section of Materials and
Methods.
2.7.2.2. Time-resolved fluorescence measurements
Time-resolved fluorescence intensity measurements with picosecond resolution were
obtained by the time-correlated single-photon timing technique (TCSPT) (Lakowicz, 2006). In
some cases, the excitation source was a mode-locked Tsunami titanium:sapphire laser (Spectra
Physics) pumped by a Nd.YVO4 diode laser (model Milennia Xs from Spectra Physics). The exit
pulses of this laser present a temporal duration below 100 fs and a continuously tunable output
emission over a broad range of near IR wavelengths (λ= 700 – 1000 nm). Its repetition rate was
reduced from 80 to 4 MHz by a pulse selector (Angewand Physik and Electronik). Finally, an
excitation wavelength of 450 or 460 nm was obtained by frequency doubling using a second
harmonic generation system. For excitation at 565 nm, a cavity dumped (3.7 MHz repetition rate)
Page 61
39
dye laser of Rhodamine 6G (Coherent 701-2), synchronously pumped by a mode-locked Vanguard
2000-HM532, DPSS green laser (Spectra Physics) was used. Excitation at 340 nm was achieved by
frequency doubling this laser system.
The fluorescence intensity decays, Iexp
(t), were measured with an emission polarizer set at
the magic angle (54.7º) relative to the vertically polarized excitation beam. This condition is used to
avoid the effects of rotational diffusion and/or anisotropy on the intensity decay (Lakowicz, 2006).
The fluorescence was detected by a Hamamatsu R-2809U microchannel plate photomultiplier at the
desired wavelength that was selected using a Jobin-Yvon HR320 monochromator in combination
with an adequate cut-off filter to avoid interference from Rayleigh-scattered light. The instrument
response function (IRF) was recorded as excitation light scattered by a Ludox solution (silica,
colloidal water solution from Aldrich). The data were collected in a multichannel analyzer with a
time window of 1024 channels, at typically 4 - 20 ps/channel and up to 50 000 and 20 000 counts in
the peak channel of the IRF and decay curves, respectively. In some cases, the two components of
the fluorescence, polarized parallel, IVV(t)) and perpendicular, IVH(t) to the plane of polarization of
the excitation beam, were recorded sequentially by alternating the orientation of the emission
polarizer every 15, 30 or 60 s. For our setup system, the instrumental G factor is expected to be 1
because the polarized fluorescence light components were depolarized before the entrance slit of the
monochromator.
Data analysis
The fluorescence intensity decay curves, I(t), were described by a sum of discrete
exponential terms:
Eq. 3.15
where i and i are, respectively, the amplitude and the lifetime of the ith decay component of
fluorescence. Briefly, the kinetic parameters describing each curve (amplitudes, i and lifetimes, i)
were obtained by iteratively convoluting the empirical function above with the instrumental
response function, IRF(t)):
Eq. 3.16
Page 62
40
and fitting Icalc(t) to the experimental data, Iexp(t) using a non-linear least squares regression method.
The usual statistical criteria, namely a reduced value < 1.3 and a random distribution of weighted
residuals and autocorrelation plots, were used to evaluate the goodness of the fits (Lakowicz, 2006).
Sometimes, the fit was greatly improved by including an extra very short-lived lifetime component
(typically fixed at 5 ps) that allows taking into account the detection of any scattered excitation.
Data analysis was performed using the TRFA Data Processing Package version 1.4 (Scientific
Software Technologies Centre, Belarusian State University) which allows calculating automatically
the confidence interval corresponding to one standard deviation for each fitted parameter
(Lakowicz, 2006).
The amplitude-weighted and intensity-weighted mean fluorescence lifetimes, and ,
respectively, were calculated according to:
Eq. 3.17
Eq. 3.18
The anisotropy decay functions, r(t), were described by:
Eq. 3.19
where i and i are the initial anisotropy or normalized amplitude and the rotational correlation time
of the ith decay component of anisotropy, respectively, and r∞ is the residual anisotropy, containing
information about the restriction of the depolarizing processes. In most cases, the time-resolved
anisotropy decays were globally analysed using the TRFA Data Processing Package version 1.4
using a two-step procedure. First, the fluorescence decay parameters were obtained by iterative
convolution of Eq. 3.15 with the IRF and fitting to the experimental data calculated as:
Eq. 3.20
using a nonlinear least-squares regression methods as previously described. Then, the anisotropy
decay parameters were determined by simultaneous iterative convolution of and :
Page 63
41
Eq. 3.21
Eq. 3.22
with the IRF and globally fitting to the experimental parallel and perpendicular polarized
components of the fluorescence, and
, respectively (Lakowicz, 2006), after fixing
the fluorescence decay parameters to the values obtained after the first step.
The steady-state fluorescence anisotropy, <r>, was used to check the time-resolved data by
calculating a G factor according to Lakowicz (2006):
Eq. 3.23
As expected, the G factors obtained were always very close to 1. To further confirm the
adequacy of the fit, the steady-state fluorescence anisotropy was calculated using the parameters
obtained from the time-resolved analysis by separate integration of the numerator and denominator
of the following equation over time and compared with the experimental steady-state anisotropy
value obtained for each sample:
Eq. 3.24
An associative model was fitted to the fluorescence anisotropy decays obtained when
studying NR binding to lysozyme fibrils using homemade software that uses a nonlinear least-
squares reconvolution method based on the Marquardt algoritm (courtesy of Prof. Mário Nuno
Berberan Santos).
2.7.2.3. Confocal fluorescence microscopy
Page 64
42
Confocal fluorescence microscopy (CFM) of mature lysozyme amyloid fibrils were obtained
by placing an aliquot of samples containing A488 or pre-stained with ThT or NR on glass slides
(Thermo Fisher Scientific) with 22 x 30 mm cover slips (Thermo Fisher Scientific).
Spatial resolved fluorescence images of the mature fibrils were acquired using an
epifluorescence confocal microscope (Leica TCS SP5 from Leica Microsystems) and detected using
R9624 photomultiplier tubes (Microsystems). Excitation lines provided by an Ar laser were focused
into the sample by an apochromatic water immersion objective (HCX PL Apochromat 63, 1.2
numerical aperture (NA) (Zeiss)). The emission was detected after passing through a dichroic
mirror. A 111.4 µm diameter pinhole placed in front of the image plane blocked out-of-focus
signals. The 458 and 514 nm Ar laser lines were used to excite the samples containing mature
lysozyme fibrils stained with ThT and NR, respectively (the emission was collected between 470
and 600 nm and between 550 and 690 nm, respectively); the 488 nm Ar laser line was used to excite
lysozyme fibrils containing Lz-A488 at variable molar ratios and the emission was collected
between 510 and 600 nm.
2.7.2.4. Fluorescence lifetime imaging microscopy
Fluorescence lifetime imaging microscopy (FLIM) was performed using a Becker & Hickl
setup in combination with a Leica TCS SP5 inverted microscope (Leica Microsystems). 2-photon
excitation (TPE) pulses were generated by a Ti:Sapphire laser (Spectra-Physics Mai Tai BB, 710-
990 nm). Pulse trains of 80 MHz (100 fs pulse duration) were produced. The excitation light was
directly coupled into the microscope and focused into the sample using a water immersion objective
HCX PL Apochromat 63, NA 1.2. 780 nm TPE was used to excite ThT-stained amyloid fibrils;
the emitted light was discriminated from the excitation light by a dichroic beamsplitter (FF665-
Di01 (Semrock)) and a short pass dichroic filter (FF01-680/SP (Semrock)). The emission light from
the samples was further selected with a 470-500 nm band pass filter and recorded using a PMC-
100-4 cooled high speed PMT detection head for photon counting coupled to the X1-port of the
microscope. The emitted photons were processed by a Becker & Hickl SPC 830 module that
addresses simultaneously the xy location of the collected photons. Typically, images were collected
with a frame size of 64 64 pixels at a scan rate of 400 Hz per frame; the average count rate was
103-10
4 counts/s and 250 s of scanning time was used for image acquisition.
Complete fluorescence intensity decays were calculated using a binning of 1 (i.e. for each
nine pixels: one central pixel and the eight surrounding pixels in a square lattice) and a
Page 65
43
biexponential model was fitted by iterative re-convolution with the IRF using the SPCImage
software (Becker & Hickl). Typically, a threshold (i.e. minimum number of photons in the peak of
the fluorescence curve) of 150 was considered in the fitting procedure. The images were
pseudocolor-coded according to the amplitude-weighted mean lifetime (Eq. 3.17) of the pixels. In
case of the lifetime histogram, the frequency is intensity-weighted, i.e. pixels with higher total
number of counts have a stronger contribution to the histogram because they are statistically more
meaningful.
Page 67
3. Results and Discussion
Page 69
47
3.1. The effect of pH on Lz-A488 fluorescence properties and thermal
stability
Lysozyme is an intrinsically fluorescent protein with 6 tryptophan residues (W28, W62,
W63, W108, W111 and W123, Figure 1.6). However, 80% of its fluorescence is due to only 2 of
these residues (W62 and W108) and they both present a low quantum yield (Imoto et al., 1972).
Therefore, lysozyme has been previously covalently conjugated to A488 SE at the host laboratory
to increase the sensitivity of the fluorescence assays performed with this protein, in general, and to
be able to carry out FCS measurements, in particular (Melo et al., 2011). The A488 fluorophore
(Figure 1.8 A) was chosen because it presents several important and desirable properties, namely it
is water soluble, has a high photostability and quantum yield, is pH insensitive from pH 4-10
(Haugland, 2005) and has a high fundamental anisotropy (r0~ 0.38 (Rusinova et al., 2002)). As one
of the main goals of this study was to evaluate how well the fluorescence properties of A488 can
report conformational alterations undergone by Lz-A488, we started our work by performing
thermal denaturation studies of A488-fluorescently labeled lysozyme at both pH 2.2 and 7.4. These
two pH values were selected because whereas the protein-lipid interaction studies are most
commonly performed at a neutral pH (Zhao et al., 2004; Gorbenko et al., 2007), lysozyme
fibrillation kinetics is usually studied in vitro using an acidic pH/ elevated temperature and a high
protein concentration (Arnaudov and Vries, 2005; Mishra et al., 2007; Meratan et al., 2011). The
first step of this study was therefore to study the effect of pH on the photophysics of this
fluorophore and on the rotational dynamics of the fluorescently-labeled protein in solution at room
temperature.
3.1.1. The fluorescence properties of native Lz-A488 are similar at pH 2.2 and
7.4 at room temperature
Among the commonly used reagents to label amines, active esters, in which are included the
succinimidyl esters (e.g., A488 SE, Figure 1.8 A), are the preferred chemistry for conjugates as they
produce amide bonds as stable as peptide bonds (Banks and Paquette, 1995).
Lysozyme was covalently labeled with A488 SE at pH 8.3 and separated from unreacted
free probe by gel filtration chromatography as illustrated in Figure 3.1 A. The first peak of the
chromatogram corresponded to A488-fluorescently labeled lysozyme, while the free dye started to
elute after ~ 45 mL. Each collected fraction was characterized spectrophotometrically to determine
its dye and protein concentrations and the more concentrated Lz-A488 fractions that presented
Page 70
48
similar labeling ratios were pooled together and kept at 4 ºC until used. The labeling procedure was
repeated once and very similar D/P values were obtained in both cases ((D/P) ~ 0.70).
Figure 3.1 - A488-fluorescently labeled lysozyme was separated from free dye by gel filtration
chromatography at pH 7.4.
(A) Gel filtration chromatography with Sephadex G-25 was used to separate Lz-A488 from free dye
(first and second peaks in the chromatogram, respectively). The eluent was HEPES-KOH buffer,
pH 7.4. The absorbance of each sample was measured at both 280 nm (blue circles) and 495 nm
(green squares). The absorbance scale has arbitrary units. (B) Cartoon drawn using UCSF Chimera
with PDB ID: 4LZT, representing lysozyme labeled with A488 at residue K97 (one of its most
probable labeling sites (Suckau et al., 1992))
It is known that the succinimidyl group reacts with the free base form of aliphatic amines to
form stable carboxamides. On HEWL, there are six -amino groups of lysine and the N-terminal
amine. However, K97 and K33 are considered to be the preferably labeling residues at the labelling
conditions used (pH 8.3), since the reactivities of K residues on this protein have been previously
shown to be primarily dependent on their relative surface accessibilities (Suckau et al. 1992). In
fact, the major modification sites of lysozyme detected in several studies were K97 and K33,
followed by the amino group on the N-terminus and K1 (Suckau et al., 1992; Schnaible and
Przybylski, 1999; Teske et al., 2007). Therefore, the first two residues are also the best candidates
for the modification site of the protein with the A488 dye given the fact that the conjugation
reaction is based on the same chemistry (Teske et al., 2007).
After covalently-labeling lysozyme with A488, the effect of pH on its fluorescence emission
properties was characterized in buffer solution at room temperature by both steady-state and time-
resolved fluorescence measurements. As a control, a parallel study was performed with the free dye.
Page 71
49
The modification of lysozyme with the Alexa dye was confirmed by fluorescence
spectroscopy. A 2 nm red-shift was detected in the emission spectra of Lz-A488 as compared to the
free dye at each pH value studied (Table 3.1). In addition, the emission spectra obtained for both
Lz-A488 and A488 at pH 2.2 were red-shifted 5 nm as compared to the ones measured at pH 7.4
(Table 3.1). Nevertheless, the shape of the spectra remained essentially invariant. The maximum
excitation and emission wavelengths obtained for Lz-A488 were in agreement with the values
presented by other proteins conjugated to A488 (IgG antibody and Factor VIIa (Haugland, 2005;
Rusinova et al., 2002)), as for the free A488 dye (Rusinova et al., 2002; Choi et al., 2011).
Table 3.1 - Maximum excitation and emission wavelengths, and
, respectively, and
steady-state fluorescence anisotropies, <r>, measured for 1.25 M A488 and 2.6 and 2.1 M
Lz-A488 at pH 2.2 and 7.4, respectively.
Samples were measured in glycine buffer, pH 2.2 or HEPES-KOH buffer, pH 7.4 at room
temperature. All the spectra were measured at magic angle conditions. Anisotropy values are
presented as mean ± the standard deviation (SD) of ten measurements.
Sample pH
a
(nm)
b
(nm) <r>
c
A488
2.2 497 517 0.011
± 0.005
7.4 492 512 0.013
± 0.005
Lz-A488
2.2 497 519 0.214
± 0.006
7.4 493 514 0.200
± 0.006 a = 540 nm; excitation and emission bandwidths of 2 and 8 nm, respectively;
b = 480 nm; excitation and emission bandwidths of 2 and 8 nm, respectively;
c = 495 nm; = 515 nm; excitation and emission bandwidths of 2 and 4 nm, respectively;
The fluorescence intensity decays of free A488 dye were well described by a mono-
exponential function, presenting a lifetime of 4.0 ns at both pH studied (Table 3.2 and Figure 3.3).
These values are close to the ones previously described by the manufacturer (= 4.1 ns (Haugland,
2005)) and reported in the literature (= 4 ns and = 3.8 ± 0.1 ns, both at pH 7, described by Chen et
al., 2010 and Choi et al., 2011, respectively). In contrast, the fluorescence decay kinetics of the
A488 dye covalently attached to lysozyme was best fitted to a sum of three exponentials in buffer
Page 72
50
solution at pH 2.2 and 7.4 (Table 3.2 and Figure 3.3). At 25 ºC, the native Lz-A488 exhibited a
nearly mono-exponential fluorescence intensity decay with a main lifetime component of 3.6 – 3.7
ns (fractional amplitude ~ 0.6 – 0.7). The fractional amplitudes of the short- and intermediate-lived
species detected (1~ 0.1 – 0.2 ns and 2~ 1.7 - 2 ns) were about 0.1 – 0.2 and 0.2, respectively
(Table 3.2). In principle, the complex fluorescence decay could result from different lysozyme
molecules being labeled at distinct sites (ground-state heterogeneity) and/or due to local structural
fluctuations of the polypeptide backbone of the native enzyme.
Figure 3.2 - Fluorescence excitation and emission spectra of Lz-A488 and A488 at (A) pH 2.2
and (B) pH 7.4.
Lz-A488 and A488 spectra are represented green and blue, respectively. Emission and excitation
spectra are continuous and dotted lines, respectively. For additional details, see the legend of Table
3.1.
Finally, and in order to evaluate if Lz-A488 had partially unfolded at pH 2.2 as compared to
pH 7.4, its nanosecond rotational dynamics was also measured in buffer solution at both pH. Time-
resolved fluorescence anisotropy measurements provide information on both the amplitude of
motion, i, and the time scale, i, on which this motion occurs. As expected, the A488 fluorophore
rapidly depolarized its fluorescence emission to 0 at both pH values (Figure 3.4), presenting a fast
rotational correlation time of ~ 0.15 ns (Table 3.3) in agreement with its low molecular weight. This
behavior is responsible for the low steady-state fluorescence anisotropy measured for the free dye in
solution, <r>= 0.011 ± 0.005 (pH 2.2) and <r>= 0.013 ± 0.005 (pH 7.4) (Table 3.1).
Page 73
51
Table 3.2 - Mean fluorescence lifetimes and intensity decay parameters from 1.25 M A488
and 2.6 and 2.1 M Lz-A488 at pH 2.2 and 7.4.
The fluorescence emission kinetics were measured using = 460 nm and = 515 nm. αi ,
normalized amplitudes; τi, fluorescence lifetimes; <τ>1 and <τ>2, amplitude-weighted and intensity-
weighted mean fluorescence lifetimes, respectively. The goodness-of-fit was judged by the
value. Values in brackets are the errors of the recovered parameters estimated as the lower and
upper bound of the joint confidence interval calculated for a 67% probability level. For additional
details, see the legend of Table 3.1.
Sample pH α1 τ1
(ns) α2
τ2
(ns) α3
τ3
(ns)
<τ>1
(ns)
<τ>2
(ns)
A488
2.2 1.00 4.1 4.1 4.1 1.09
[4.1,4.1]
7.4 1.00 4.0 4.0 4.0 1.15
[4.0,4.0]
Lz-A488
2.2 0.24 0.11 0.20 1.7 0.56 3.6 2.9 3.4 1.15
[0.09,0.11] [1.5,1.8] [3.6,3.6]
7.4 0.10 0.19 0.24 2.0 0.66 3.7 2.9 3.4 1.12
[0.16,0.22] [1.7,2.1] [3.6,3.7]
On the other hand, two rotational correlation times were necessary to describe the anisotropy
decay of Lz-A488 in both buffer solutions (Figure 3.4 and Table 3.3). Since the long rotational
correlation time ( = 5.6 ns (Table 3.3)) was significantly longer than the short one ( ~ 0.1 – 0.2
ns (Table 3.3)), the total anisotropy can be interpreted as a product of two independent depolarizing
processes: the first one (fast) due to segmental, rapid restricted movements of the covalently linked
flurophore and the second one (slow) due to global rotation of the protein (Lakowicz, 2006; Pastor
et al., 2007):
Eq. 3.1
where
Eq. 3.2
and
Page 74
52
Eq. 3.3
Figure 3.3 – Fluorescence intensity decays from 1.25 M A488 and 2.1 M Lz-A488 at pH 7.4.
The red and blue lines are the best fits of Eq. 3.15 to the experimental data from Lz-A488 and free
A488 at pH 7.4, respectively. The fits obtained for pH 2.2 are very similar (not shown, see Table
3.2. for values). The green line is the instrumental response function, IRF(t), of the laser system. For
additional details, see the legend of Table 3.2.
Sseg is an order parameter that characterizes the restricted range of internal angular
fluctuations of the protein segment containing the covalently-bound dye (Figure 3.4 inset). It can be
calculated using Eq. 3.4, being the fractional anisotropies that decay with correlation times ,
which were empirically fitted to the decays (Pastor et al., 2007):
Eq. 3.4
Page 75
53
On the other hand, the short and long rotational correlation times obtained from the fit are
related to and by Eq. 3.5 and Eq. 3.6, respectively:
Eq. 3.5
Eq. 3.6
Figure 3.4 – Fluorescence anisotropy decays from 1.25 µM A488 and 2.1 µM Lz-A488 at pH
7.4.
The red and blue lines are the best fits of Eq. 3.19 to the experimental data from Lz-A488 and free
A488, respectively. For additional details, see the legend of Table 3.3. Inset: Local and global
rotational motions detected when a fluorophore is linked covalently to a protein assuming a
wobbling-in-cone model. is the cone semi-angle, the maximum rotation allowed for the
fluorophore. Adapted from Mukhopadhyay et al., 2006.
Page 76
54
Table 3.3 - Fluorescence anisotropy decay parameters from 1.25 M free A488 and 2.6 and
2.1 M Lz-A488 at pH 2.2 and 7.4, respectively.
The anisotropy decays were measured using = 460 nm and = 515 nm. βi, fractional
amplitudes; , rotational correlation time; r(0)= 1 + 2. <r>calc was calculated according to Eq.
3.24. For additional details, see the legend of Table 3.2.
Sample pH r(0) 1 1
(ns) 2
2
(ns) <r>calc
A488
2.2 0.36 0.36 0.15 1.16 0.013
[0.15,0.15]
7.4 0.36 0.36 0.15 1.04 0.013
[0.15,0.16]
Lz-A488
2.2 0.39 0.06 0.10 0.33 5.6 1.04 0.211
[0.06,---] [5.4,5.7]
7.4 0.39 0.07 0.16 0.31 5.6 1.22 0.200
[0.12, ---] [5.5,5.8]
Note that since , then can be pointed as the (Eq. 3.5). The value obtained
for = 5.6 ns (Table 3.3) can be compared with the theoretical prediction for the rotation of
native lysozyme considered as a rigid hydrated sphere according to Eq. 3.7 (Lakowicz, 2006):
Eq. 3.7
where is the solvent viscosity (1 cP), is the relative molecular mass of lysozyme (14 300), is
the ideal gas constant ( = 8.314 J K-1
mol-1
) , is the absolute temperature (T= 295 K), is the
partial specific volume of the protein and its hydration. Assuming 20% hydration and = 0.74
cm3/g, the correlation time for the overall lysozyme rotation is calculated to be 5.2 ns, which is in
close agreement to the experimental value ( = 5.6 ns (Table 3.3)) and indicates that the lysozyme
is properly folded at both pH values. This was expected since previous studies (using CD) indicated
that the secondary and tertiary structures of the native protein did not change significantly in acidic
solution up to pH 0.64 (Frare et al., 2004).
The segmental correlation time ( = 0.11 e 0.16 ns, pH 2.2. and 7.4, respectively)
reflects an average of the fast localized motions of the covalently-bound fluorescent dye. The range
of angular displacement of these motions can be derived from Sseg assuming a “wobbling-in-cone”
Page 77
55
model (Kinosita et al., 1977), in which a vector associated with the chromophore (in our case, the
transition dipole moment) is assumed to move freely within a cone with fixed semi-angle (Figure
3.4 inset). From this model, the semi-angle seg of the cone within which the segment containing the
covalently-attached dye freely rotates is given by (Czeslik et al., 2003):
Eq. 3.8
An angle of = 19.1º and 21.5º was obtained for the dye covalently-bound to lysozyme in buffer
at pH 2.2 and 7.4, respectively, suggesting that this segment experiences relatively little angular
displacement with respect to the protein as a whole during the fluorophore excited lifetime. The
constraints on the local motions of the dye are due to the short covalent linkage between the dye and
the macromolecule (Figure 1.8 A) and steric hindrances caused by the protein surface, as well as to
possible electrostatic interactions between the negatively charged dye and the protein. Altogether,
the overall tumbling motion of Lz-A488 in buffer solution dominates the depolarization of its
fluorescence emission, being responsible for its relatively large steady-state value measured at both
pH (<r>= 0.214 ± 0.006 (pH 2.2) and <r>= 0.200 ± 0.006 (pH 7.4) (Table 3.1)).
The apparent “zero-time” anisotropy, r(0) = 1 + 2 = 0.39 measured for Lz-A488 is close to
the value measured for A488 in a rigid environment (100% glycerol at -10 ºC ), r0= 0.376 0.003
(Rusinova et al., 2002), assuring that no very fast movements of the dye covalently-bound to the
native protein were missed in the anisotropy analysis.
Summarizing, lysozyme was successfully covalently tagged with A488. Its fluorescence
emission properties were found to be essentially identical in buffer solution at room temperature at
both pH 2.2 and 7.4. In addition, time-resolved fluorescence anisotropy decays indicated that the
protein is properly folded in both conditions and that the covalently-bound dye experiences a
restricted range of internal angular fluctuations during its excite-sate fluorescence lifetime.
3.1.2. Lysozyme is more thermally unstable at pH 2.2 than at pH 7.4
The next step of this work was to compare the thermal denaturation profiles of Lz-A488
obtained at pH 2.2 and 7.4 in order to evaluate the ability of the covalently-conjugated fluorophore
A488 to report conformational changes undergone by the fluorescently-labeled lysozyme under
known destabilizing conditions. In this section, the thermal denaturation data obtained for Lz-A488
Page 78
56
at both pH using fluorescence spectroscopy will be first described; complementary studies made
with lysozyme and the extrinsic dyes 1,8-ANS and SO will be presented next.
3.1.2.1. Thermal denaturation study of Lz-A488 at pH 7.4
The thermal stability of 1 µM Lz-A488 was measured by fluorescence spectroscopy. Upon
increasing the solution temperature at pH 7.4, the intensity of its steady-state fluorescence emission
spectra progressively decreased, gradually at the beginning and then steeper (Figure 3.5 A). From
20 to 90 ºC, there is an overall decrease in Lz-A488 fluorescence intensity of about 80%, whereas
the intensity of the 0.7 µM free probe decreases only ~20% within the same temperature range
(Figure 3.5 B). Simultaneously, the maximum emission wavelength of Lz-A488 and free A488
were essentially temperature-independent ( = (519 ± 1) nm for Lz-A488 and (514 ± 1) nm for
A488 (Figure 3.5 D)). Note that these values are slightly different from the previous ones presented
in Table 3.1 since the apparatus used to measure the spectra was different (see section 2.3).
Within the 20 - 60 ºC temperature interval the fluorescence emission intensities of both free
and conjugated dye decrease in parallel only 10%. Above 60 ºC, the tertiary structure of the enzyme
begins to unfold and a cooperative transition was observed for the labeled protein only (Figure 3.5
C). Assuming a two-state model, we retrieve a Tm of 73.5 ºC for Lz-A488 at pH 7.4, where Tm is
defined as the midpoint in a thermal ramp and represents the temperature where the free energy of
the native and non-native forms is equivalent (Matulis et al., 2005). Based on data obtained by other
authors by both experimental and computational methods (Meersman et al., 2010), the secondary
and tertiary structures of lysozyme at neutral pH are generally maintained within the interval of 20
and 64 ºC. This is in agreement with what was verified experimentally (Figure 3.5 C). The
unfolding then progresses first by loosing sheet structures in lysozyme β-domain, along with a small
part of the helical structure of α-domain, and then a generally loss of tertiary structure. The authors
also indicated that above 80 ºC lysozyme’s unfolding is irreversible. This observation can explain
why after reaching 90 ºC and cooling down the solution to 25 ºC, it was not possible to recover the
initial value of Lz-A488 fluorescence intensity (data not shown).
Page 79
57
Figure 3.5 - Thermal unfolding of Lz-A488 monitored by steady-state fluorescence
spectroscopy at pH 7.4.
Temperature dependence of the steady-state fluorescence emission spectra from (A) 1 µM Lz-A488
and (B) 0.7 µM free A488 dye at pH 7.4. The emission spectra were measured using = 480 nm.
Variations of (C) the normalized maximum fluorescence intensities to their values at 20 ºC and (D)
of the maximum emission wavelengths of Lz-A488 (closed circles) and free A488 (open circles)
with the temperature.
At pH 7.4, all the fluorescence decay profiles of Lz-A488 obtained at different temperatures
were adequately described by a tri-exponential function (Figure 3.6). At 25 ºC, the native Lz-A488
exhibited an intensity decay with a main lifetime component of 3= 3.6 ns and a short- and
intermediate-lived species of 1~ 0.25 ns and 2~ 2 ns with fractional amplitudes of 69%, 7% and
24%, respectively (Figure 3.6 A and B). The long and intermediate fluorescence lifetimes of Lz-
A488 decreased almost linearly with the temperature, whereas the short fluorescence lifetime was
essentially temperature-insensitive (Figure 3.6 B). Figure 3.6 A further shows that until reaching the
temperature when Lz-A488 starts to unfold (T~ 60 ºC), the long-lived fluorescent lifetime is the
major component of its fluorescence decay. Above this temperature, the populations of both 1 and
2 are significantly enhanced until reaching plateau values of 34% and 40% at 90 ºC, respectively.
Page 80
58
As a result of both these changes, the amplitude-weighted mean fluorescence lifetime of Lz-A488
decreased from 3.0 to approximately 1.4 ns upon heating the solution from 25 to 90 ºC (Figure 3.6
C). As for the free dye, its fluorescence lifetime decreased from approximately 4.0 to 3.6 ns within
the same temperature interval (Figure 3.6 C) due to an increasing contribution with the temperature
of the non-radiative processes involved in A488 returning from its excited sate to the ground-state.
Figure 3.6 - Thermal unfolding of Lz-A488 monitored by time-resolved fluorescence
spectroscopy at pH 7.4.
The fluorescence emission kinetics were measured using = 340 nm and = 515 nm.
Temperature dependence of the (A) fractional amplitudes and (B) lifetime components obtained for
1 µM Lz-A488 at pH 7.4. Variations of (C) the amplitude-weighted mean fluorescence lifetimes
and (D) the normalized fluorescence intensities (blue circles) and amplitude-weighted mean
fluorescence lifetimes (green triangles) of 1 µM Lz-A488 and 0.7 µM free A488 with the
temperature. The dashed lines are just a guide to the eye.
The observation above that the long-lived fluorescence lifetime of Lz-A488 was the
dominant component of its fluorescence intensity decay only when the enzyme retained a natively-
structured conformation is consistent with a temperature-dependent quenching mechanism affecting
Page 81
59
the conjugated protein. This quenching can be rationalized in terms of a photoinduced electron
transfer (PET) mechanism (Doose et al., 2009) (Figure 3.7) from an electron donor present in
several possible adjacent amino acid residues to the covalently-conjugated dye A488. This
quenching mechanism has been proposed before in quenching studies of free Alexa dyes in solution
by different amino acids (Chen et al., 2010; Sun et al., 2011) and for different A488-fluorescently-
labeled proteins (apomyoglobin, Chen et al., 2007; cytochrome c, Choi et al., 2011). Specifically,
Chen et al. (2010) found that the fluorescence of A488 can be quenched by several amino acids,
mainly by tryptophan and tyrosine (strong quenchers) and by histidine and metionine (weak
quenchers). Within a 8 Å radius, at least 1 tyrosine and 4 tryptophan residues, and 1 metionine and
2 tryptophan residues are nearby residues K97 and K33, respectively, in the native lysozyme.
Moreover, A488 can rotate freely within a cone with a semi-angle of 19-21.5º in Lz-A488
(discussed previously), increasing its probability of interaction with nearby amino acid residues.
Therefore, we conclude that upon heating the solution, partial unfolding of lysozyme must allow for
the establishment of van der Waals contacts between these amino acid residues and the dye attached
to the protein, resulting in an efficient quenching of its fluorescence by a PET-based mechanism.
This is expected to cause an increased population of Lz-A488 molecules that present a much shorter
excited-state lifetime or that even are non-fluorescent, as it was observed (Figure 3.6 A and C).
Figure 3.7 – Representative scheme of fluorescence quenching by a photoinduced electron
transfer mechanism.
(A) When a fluorophore is excited (1), an electron goes from the ground-state to the first excited
state (S1). When it returns to the first state (2), part of the energy is released via radiative processes,
namely fluorescence (green arrow). (B) In photoinduced electron transfer, the fluorophore is excited
(1) and the electron goes to S1. A nearby quencher (Q) donates one of its electrons (2) to the
ground-state of the fluorophore preventing the excited electron to return to the ground-state. There
is a non-radiative dissipation of the excited-state energy and no emission of fluorescence occurs.
Adapted from http://labrigger.com/blog/tag/calcium-imaging/ (last consulted on 11/9/2012).
Page 82
60
3.1.2.2. pH strongly influences the thermal denaturation of Lz-A488
Both the steady-state and time-resolved fluorescence measurements made for Lz-A488 and
A488 as a function of temperature were repeated at pH 2.2 (Figure 3.8 A). The fluorescence
properties of Lz-A488 at this pH presented a very similar behavior in general to the one described
above for pH 7.4. The main difference detected was that the thermal denaturation profile obtained
for Lz-A488 at pH 2.2 was almost 20 ºC-shifted to lower temperatures relatively to the ones
measured at pH 7.4 (Figure 3.8 B). In fact, a much lower Tm of 55 ºC was measured for Lz-A488 at
this acidic pH as compared to pH 7.4. This result is in agreement with the literature (for HEWL at
pH 2, Tm = 54.8 ºC (Arnaudov and Vries, 2005) and at pH 7, Tm = 75 ºC (Lee et al., 2006)) and
confirms the strong destabilization of lysozyme at low pH probably due to electrostatic repulsions
between the accumulated positive charges in the enzyme. For pH values below 4.0, Machuqueiro
and Baptista (2008) have already detected a destabilization of lysozyme secondary structure, being
its β-domain the less stable. It should be noted, however, that this structural perturbation of Lz-
A488 at acidic pH does not affect its rotational dynamics significantly at room temperature as it was
discussed above.
Figure 3.8 - Thermal unfolding of Lz-A488 is influenced by pH.
(A) Variation of the normalized fluorescence intensities and amplitude-weighted mean fluorescence
lifetimes of 1 µM Lz-A488 and 0.7 µM free A488 with the temperature at pH 2.2. The dashed lines
are just a guide to the eye. (B) Comparison of the thermal denaturation profiles obtained for Lz-
A488 at pH 2.2 and 7.4. For more details, see the legend of Figure 3.6.
Page 83
61
3.1.2.3. Using 1,8-ANS and Sypro Orange to detect lysozyme thermal
unfolding
Finally, the extrinsic dyes 1,8-ANS and SO were used in independent control assays to
confirm the alterations undergone by the tertiary structure of lysozyme upon heating the solution at
both pH 2.2 and 7.4. Both these probes are commonly used to collect protein thermal denaturation
data because they bind to organized hydrophobic clusters on proteins that become widely accessible
to the solvent when proteins unfold, increasing their fluorescence quantum yields (Hawe et al.,
2008; Layton and Hellinga, 2010).
At pH 7.4, the fluorescence intensity of 5x SO in the presence of 1 µM of lysozyme did not
vary significantly with the temperature within the interval 20 – 60 ºC. For temperatures higher than
60 ºC, the fluorescence intensity of the probe progressively increased, peaking at 74 ºC, close to the
Tm value determined above for Lz-A488 at this pH (Figure 3.9 A). Concomitantly, the maximum
emission wavelength of SO shifted from approximately 630 nm to ~ 620 nm for temperatures
higher than 65 ºC (data not shown). SO could not be used at pH 2.2 due to alterations registered in
its absorption spectra at this pH and since its structure is not publically available, it was decided to
employ 1,8-ANS to monitor the thermal unfolding of lysozyme at this pH instead. As it is shown in
Figure 3.9 B, the fluorescence intensity of this probe in the presence of 1 µM of lysozyme increased
almost two-fold when the temperature was varied between 45 and 65 ºC at pH 2.2, reporting the
formation of partially unfolded conformations of lysozyme (molten globules) with a high amount of
hydrophobic area exposed to the solvent within this temperature range. At pH 2.2 1,8-ANS
presented a blue shift from 540 nm (until 40 ºC) to 524 nm after the denaturation of lysozyme. At
pH 7.4 this was not observed and the maximum emission wavelength of this dye remained between
513 and 516 nm at all temperatures (data not shown). At pH 7.4, 1,8-ANS binding to lysozyme was
much less effective, probably due to the establishment of less strong electrostatic interactions
between the anionic probe and the cationic protein at this pH.
The fluorescence intensity of the dyes increases on protein unfolding because they present a
higher quantum yield when bound to hydrophobic regions that are normally exposed upon protein
unfolding (Lo et al., 2004). Unfolded intermediates may have sizable nonpolar patches on their
surface, namely hydrophobic residues that were buried in the native protein, which lead to
hydrophobic interactions between protein and dye (Munishkina et al., 2004). However, after
reaching the peak (Figure 3.9), the fluorescence intensity of the dyes starts to decrease. Some
explanations have been put forward in the literature to explain this behavior: Munishkina and co-
workers suggest that these organized hydrophobic patches are absent in the fully unfolded state
Page 84
62
(Munishkina et al., 2004); in Lo work, the authors state that there is aggregation of the denatured
protein–dye complexes (Lo et al., 2004); particularly for SO, in Layton and Hellinga work is
explained that the decrease in the fluorescence intensity has been attributed primarily to protein
aggregation and irreversible interaction of the dye with the denatured protein. However, further
observations discredited these hypotheses and this behavior was attributed to intrinsic properties of
the dye photophysics, consistent with the temperature dependence of SO fluorescence in low-
dieletric solvents (Layton and Hellinga, 2010).
Figure 3.9 - Thermal unfolding of lysozyme monitored by Sypro-Orange (at pH 7.4) and 1,8-
ANS (at pH 7.4 and 2.2).
Variation with the temperature of the normalized fluorescence intensities of (A) 5x concentrated SO
at pH 7.4 (green squares) and (B) 20 µM of 1,8-ANS in the presence of 1 µM of lysozyme at both
pH 2.2 (open green squares) and 7.4 (closed green circles). The fluorescence intensities presented
are from different emission wavelengths: 620 nm for SO, 530 and 515 nm for 1,8-ANS at pH 2.2
and 7.4, respectively. Fluorescence data obtained for 1 µM Lz-A488 in the same conditions are also
plotted (blue symbols, see the legend of Figure 3.8 for further details). Dashed vertical lines indicate
the Tm values determined for Lz-A488 at pH 2.2 (dark grey, Tm= 55 ºC) and pH 7.4 (light grey, Tm=
73.5 ºC).
In conclusion, in this section we showed that A488 can be used as a sensitive reporter for
unfolding transitions of lysozyme due to its sensitivity to a PET-based quenching mechanism. The
partial unfolding of lysozyme probably allows van der Waals contacts between the fluorophore
molecule and nearby amino acids residues, previously shown to quench free Alexa 488 (Chen et al.,
2010; Sun et al., 2011).
Page 85
63
3.2. Lysozyme amyloid fibril formation at pH 2.2 and 57 ºC
3.2.1. Nile Red has a moderate binding affinity to mature isolated lysozyme
amyloid fibrils at pH 2.2
Traditionally, ThT is the fluorophore of choice to easily monitor amyloid fibril processes in
vitro (Groenning, 2010; Biancalana and Koide, 2010). It is a cationic fluorophore (Figure 1.8 D)
that is known to have a very low quantum yield in water solutions and in the presence of native and
denatured proteins and their amorphous aggregates, but to form a highly fluorescent complex with
amyloid and amyloid-like fibrils (Groenning, 2010; Biancalana and Koide, 2010). However, poor
binding of ThT to amyloid aggregates and fibrils at pHs under 3 is described in the literature, since
it is a charged molecule and its binding properties are different at acidic and neutral pH (Lindgren et
al., 2005; Mishra, et al., 2007 and 2011). NR is an uncharged aromatic dye (Figure 1.8 C) that has
been used earlier as an alternative red fluorescent probe for monitoring amyloid formation at acidic
pH (Mishra et al., 2011). In this section, we first confirm the preparation of mature lysozyme fibrils
grown at pH 2.2 and 57 ºC under quiescent conditions by their fluorescence detection with ThT at
pH 7.4. We then present the steady-state and time-resolved fluorescence measurements made to
study NR binding to mature lysozyme fibrils at pH 2.2 that further validate its use as a versatile
amyloidotropic dye for detection and characterization of amyloid fibrils grown in vitro from
HEWL.
3.2.1.1. Preparation and detection of mature lysozyme fibrils using
Thioflavin T
The conditions chosen to carry out lysozyme fibrillation assays in vitro were acidic pH (pH=
2.2) and elevated temperature (T= 57 ºC). These conditions closely match the Tm previously
established for lysozyme at this pH (Tm~ 55 ºC, Arnaudov and Vries, 2005 (Figure 3.8)) and have
been used earlier (Meratan et al., 2011). At this pH and temperature, lysozyme is submitted to
denaturing conditions that will promote its unfolding. Consequently, the unfolded intermediates
formed will interact with each other, eventually originating lysozyme fibrils at long incubation
times. After an incubation period of 12 days at pH 2.2 and 57 ºC under quiescent conditions, mature
lysozyme fibrils were isolated by three consecutive centrifugation steps (Figure 3.3) and quantified
spectrophotometrically at 280 nm as previously described in section 2.5. To confirm that lysozyme
fibrillation was effective under the experimental conditions used, mature isolated lysozyme amyloid
fibrils were stained with ThT at pH 7.4 and examined by CFM. Fibril clusters up to several
Page 86
64
micrometers in length were easily visualized in the samples prepared as it is exemplified in Figure
3.10 A.
Figure 3.10 – Mature isolated lysozyme fibrils investigated with Thioflavin T.
Mature lysozyme fibrils pelleted by centrifugation were stained with ThT at pH 7.4 and imaged by
(A) CFM and (B) FLIM. Ensemble-averaged (cuvette) measurements were also made. (C)
Fluorescence intensity decay of ThT stained fibrils. The best fit to the experimental data was
obtained using three exponentials: 1= 0.44; 1= 0.13 ns; 2= 0.36; 2= 0.67 ns; 3= 0.20; 3= 1.89
ns; 2= 1.23; <>1= 0.68 ns). Inset: ThT fluorescence anisotropy decay measured for the same
sample. The concentrations of lysozyme fibrils (on a monomer basis) and ThT were 73.4 and 8.6
M, respectively.
Page 87
65
In addition, ThT-stained amyloid fibrils were also characterized by FLIM. The amplitude-
weighted mean fluorescence lifetime of ThT had a uniform spatial distribution on these structures
(<>1= 0.99 ns (Figure 3.10 B)), being very similar to the value measured in an ensemble-average
(cuvette) assay (<>1= 0.68 ns (Figure 3.10 C)). The difference between these two values must be
due to the distinct instrumentation used in their determination, as well as to the programs used in the
analysis of the time-resolved data and the data itself. Whereas in ensemble-average assays (cuvette
measurements) about 20 000 counts were collected in the peak channel of the decay curves, in
FLIM measurements there were usually less than 2 000 counts collected at each pixel. This
influences the accuracy of the lifetime value determined as well as the number of exponentials
needed to fit the decays. ThT belongs to the class of molecular rotors and the significant increase of
its fluorescence lifetime/quantum yield when incorporated in amyloid and amyloid-like fibrils is
caused by restriction of torsional oscillations of the ThT rings (Figure 1.8 D) relative to each other
(Biancalana and Koide, 2010) . The fluorescence emitted by the ThT molecules bound to the fibrils
did not depolarize during its mean fluorescence lifetime (r(t)~ 0.4, inset of Figure 3.10 C). This
result can be explained considering that ThT is almost non-fluorescent in aqueous solution and that
this probe is strongly immobilized upon its intercalation between the -sheets of the very long
lysozyme amyloid fibrils formed under these conditions. A similar high value of anisotropy was
reported by Celej and co-workers while studying the aggregation of α-synuclein by time-resolved
fluorescence anisotropy (Celej et al., 2008).
3.2.1.2. Nile Red binding to mature lysozyme fibrils at pH 2.2 – steady-
state and time-resolved fluorescence measurements
NR binding to mature isolated lysozyme fibrils was studied by both steady-state and time-
resolved fluorescence measurements. Upon increasing the concentration of lysozyme fibrils, there
was a pronounced blue-shit of the dye’s maximum emission wavelength, from near 655 nm
(expected for NR molecules in water (Tajalli et al., 2008)) to approximately 630 nm (Figure 3.11
A). This behavior is typically observed when the dye molecules present in aqueous solution bind to
hydrophobic or apolar sites (Sutter et al., 2007). Simultaneously, its steady-state fluorescence
emission intensity (data not shown) and anisotropy increased. The free dye in solution presents an
anisotropy of <r>f ~ 0.09 0.02 (n= 3) that progressively augmented reaching a plateau value of
<r>b ~ 0.344 ± 0.007 for concentrations of fibers above 28 µM (Figure 3.11 A).
All the fluorescence decay profiles obtained for NR in the presence of variable amounts of
fibers were adequately described by a tri-exponential function (Figure 3.11 B and C).
Page 88
66
Figure 3.11 – Characterization of Nile Red binding to mature lysozyme amyloid fibrils at pH
2.2 using steady-state and time-resolved fluorescence measurements.
(A) The emission spectra and steady-state fluorescence anisotropy were obtained using λexc = 552
nm and λem = 570-800 nm and λem = 636 nm, respectively. Fluorescence anisotropy values are
presented as mean ± SD of ten measurements. (B) Fractional amplitudes, (C) lifetime components
and (D) (calculated with Eq. 3.17) of 2.9 M NR as a function of lysozyme fibril concentration
(expressed on a monomer basis). The fluorescence decay profiles were obtained using λexc = 565
nm and λem = 650 nm and were all adequately described by a tri-exponential function (Eq. 3.15).
The dashed lines are just a guide to the eye.
The free dye in solution presented an amplitude-weighted mean fluorescence lifetime of
<>1f= 0.48 ns (1f= 0.240 ± 0.008; 1f= 0.076 ns [0.066, 0.081]; 2f= 0.713 ± 0.072; 2f= 0.56
[0.54;0.56] ns; 3f= 0.047 ± 0.014; 3f= 1.4 [1.3;1.5] ns; the lifetime values were linked in the
analysis (n= 3)) that increased approximately 5-fold to <>1b= 2.1 ns) (1b= 0.16 ± 0.01; 1b= 0.25 ±
0.02 ns; 2b= 0.33 ± 0.01; 2b= 1.350 ± 0.001 ns; 3b= 0.507 ± 0.003; 3b= 3.230 ± 0.002 ns (n= 2))
for protein concentrations higher than 28 µM (Figure 3.11 D). These results are in agreement with
previous works where NR was used to study aggregates of β-galactosidase (Sutter et al., 2007).
These authors also needed to use three lifetime components when analyzing the intensity decays of
Page 89
67
NR in the presence of different samples of β-galactosidase and they emphasized the fact that it was
not possible to relate particular lifetimes to free and protein-bound state of NR.
The fluorescence signal originated from NR-stained mature lysozyme amyloid fibrils at pH
2.2 was strong enough to allow for their imaging using CFM. Figure 3.12 shows several fibrillar
bundles that present variable morphologies (shapes and sizes), which reflect that a complex mixture
of entities is present in solution by the end of the incubation period. Protein fibrillation is a complex
process: multiple species are formed in solution, which originate protofilaments that finally
associate to form the mature fibrils (Yonezawa et al., 2002). The small and thinnest bundles seen
may correspond to associations between these protofilaments and/or this variety of species may
have been amplified by the fact that the fibrils are pelleted by centrifugation and further re-
suspended in buffer by vortexing the sample, which can lead to fragmentation of some structures.
Altogether, these results confirm the potential of NR for monitoring real time fibril growth using
fluorescence microscopy (Mishra et al., 2011).
Figure 3.12 – A wide diversity of mature lysozyme fibrils were imaged by confocal
fluorescence microscopy after staining with Nile Red.
Lysozyme fibrils pelleted by centrifugation were stained with NR at pH 2.2 and imaged by CFM.
The concentrations of lysozyme fibrils (on a monomer basis) and NR were 76.6 and 2.9 M,
respectively.
Page 90
68
Finally, NR binding to mature lysozyme fibrils was also studied quantitatively by time-
resolved fluorescence anisotropy measurements. The time-resolved anisotropy of the free dye in
solution decayed mono-exponentially with a rotation correlation time of ~ 0.14 ns, rapidly
depolarizing its fluorescence emission to 0 (Figure 3.13 and Table 3.4). For lysozyme fibril
concentrations above 0.43 M, the anisotropy of NR was essentially constant over time (r(t) ~ 0.35)
and for the intermediate fibril concentrations studied its anisotropy decays presented a “dip-and-
rise” behavior (Figure 3.13).
Figure 3.13 - Fluorescence anisotropy decays of 2.9 M Nile Red in the presence of increasing
concentrations of mature lysozyme fibrils at pH 2.2.
The fluorescence anisotropy decays were fitted according to an associative model (see the text and
Table 3.4 for more details). The analyses were performed using a nonlinear least-squares
reconvolution method based on the Marquardt algorithm implemented on Microsoft Office ® Excel
1997-2003 (courtesy of Prof. Mário Nuno Berberan Santos).
The curious behavior observed can be explained by admitting that NR is present in each
sample in equilibrium between two different environments (free in solution and bound to the fibrils)
that confer very different fluorescent and rotational properties to the fluorescent dye (Figure 3.14):
Page 91
69
- free NR molecules have a short mean fluorescence lifetime (<>1f~ 0.48 ns) and a very fast
rotational correlation time (f~ 0.14 ns), thus, they rapidly depolarize their fluorescence emission;
- NR molecules bound to the fibrils are much more fluorescent (<>1b~ 2.1 ns) and their rotational
dynamics is strongly hindered due to their binding to the large macromolecular structures (r(t) ~
0.35).
Figure 3.14 – Schematic representation of Nile Red binding to mature lysozyme fibrils.
(A) When a small amount of lysozyme fibrils is present in solution, there is an equilibrium between
NR molecules that stay free in solution (pink stars) and that bind to the fibrils (red stars); (B) when
a large amount of lysozyme fibrils is present in solution, essentially all NR molecules available are
bound to lysozyme fibers.
3.2.1.3. Analysis of Nile Red fluorescence anisotropy decays using an
associative model
According to the discussion above, the fluorescence anisotropy decays of NR were analyzed
with an associative model. The fluorescence anisotropy of a sample is an intensity-weighted
average of the anisotropies of each species present in the sample (Lakowicz, 2006). Therefore, at
any time following excitation, the time-resolved fluorescence anisotropy of NR can be written as:
Eq. 3.9
where and and and are the fractional intensities and anisotropy decays of NR
free and fibril- bound molecules, respectively.
Page 92
70
These parameters can be calculated from the following equations:
Eq. 3.10
and
Eq.3.11
where and are the free- and bound molar fractions of NR in solution , and and are
their respective fluorescence intensities. The rotational dynamics of the free dye in solution was
described by a single fast rotational correlation time, :
Eq. 3.12
whereas the bound molecules were admitted to be essentially immobile on the time scale used in the
time-resolved fluorescence measurements:
Eq. 3.13
Both the fluorescence intensity decays from the free, and bound, , NR molecules
were considered to be well described by a sum of three exponentials:
Eq. 3.14
and
Eq. 3.15
Eq. 3.9 shows that since NR free has a shorter mean fluorescence lifetime than the bound
molecules, its fractional contribution to the intensity decay of the sample decreases more rapidly
with time than the emission from the NR bound molecules. At longer times, the fluorescence
emission from the sample becomes dominated by the bound NR molecules with its larger
Page 93
71
anisotropy. Therefore, at some point, the value of starts to increase, giving rise to the “dip-and-
rise” behavior described earlier (Figure 3.13).
Eq. 3.9 was fitted to the experimental r(t) data by a nonlinear least squares regression
method using ( (Eq. 3.10), and (Eq. 3.12) and r (Eq. 3.13) as fitting
parameters. The functions describing the intensity decays were fixed to the values obtained for the
free dye in solution and in the presence of a saturating concentration of fibrils (values presented in
section 3.2.1.2). The experimental NR time-resolved anisotropy data was adequately described by
this associative model as it is shown in Figure 3.13. Table 3.4 summarizes the results obtained from
the fits; the results obtained are self-consistent as the mean values retrieved for f and r were f=
(0.181 ± 0.037) ns for the first 6 fibril concentrations studied and r= 0.347 ± 0.007 for the last 7
anisotropy decays, validating the associative model used in data analysis.
Table 3.4 - Analysis of NR fluorescence anisotropy decays obtained at pH 2.2 in the presence
of increasing concentrations of mature lysozyme fibrils according to an associative model.
Anisotropy decays were measured using = 565 nm and = 650 nm. The concentrations of
lysozyme fibrils are expressed on a monomer basis and the concentration of NR was fixed to 2.9
M in each assay.
[Fibrils]
(M)
(ns) r
0 0 0.344 ±
0.007 0.142 ±
0.005 - 0.65
0.29 0.135 0.292 ±
0.006 0.239 ±
0.008 0.099 ±
0.002 0.89
0.43 0.152 0.321 ±
0.021 0.212 ±
0.021 0.341 ±
0.002 0.88
0.57 0.188 0.310 ±
0.011 0.171 ±
0.012 0.356 ±
0.001 0.84
2.9 0.374 0.303 ±
0.018 0.170 ±
0.024 0.355 ±
0.001 0.82
5.7 0.660 0.4 a
0.151 ±
0.058 0.346 ±
0.001 0.79
29 0.957 0.4 a
0.2 a 0.341 ±
0.001 0.97
57 0.995 0.4 a 0.2
a
0.339 ±
0.001 0.96
114 0.995 0.4 a 0.2
a
0.353 ±
0.001 0.97
a this value was fixed during the analysis.
Page 94
72
The plotting of the NR bound fraction, , as a function of total protein concentration
defines a saturation curve and can be used to determine the affinity of NR binding to the amyloid
lysozyme fibrils at pH 2.2, by fitting Eq. 3.9 to the experimental data. Using a non-linear least-
squares regression method, Kd= (2.0 ± 0.4) M was obtained (Figure 3.15).
To decrease the error associated to these measurements, it is necessary to exploit more
protein concentrations, especially within the range of 0 to 20 µM of mature lysozyme fibrils.
Despite the error, it is possible to conclude that NR presents a moderate binding affinity to
lysozyme amyloid fibrils in aqueous solution at pH 2.2.
Figure 3.15 – Determination of Nile Red binding affinity to mature lysozyme fibrils at pH 2.2.
Eq. 3.9 was fitted to the data of NR bound molar fraction as a function of lysozyme fibril
concentration (solid line: Kd= (2.0 ± 0.4) M). Lysozyme fibril concentrations are expressed on a
monomer basis. The concentration of NR used was 2.9 M (for more details see Table 3.4).
In conclusion, after confirming the formation of mature lysozyme fibrils under the
conditions used in this study (acidic pH and elevated temperature) by CFM, the ability of NR to be
used as fluorescent reporter of amyloid fibril formation was further explored. The steady-state
fluorescence anisotropy of NR was found to be a very reliable parameter to detect the presence of
lysozyme fibrils in solution. Furthermore, the analysis of the time-resolved fluorescence anisotropy
decays of NR according to an associative model, which were obtained in the presence of increasing
concentrations of lysozyme fibrils, allowed the determination of its binding affinity (Kd= (2.0 ± 0.4)
M) to the mature isolated lysozyme amyloid fibrils at pH 2.2.
0.0
0.2
0.4
0.6
0.8
1.0
0 20 40 60 80 100 120
x N
R b
ou
nd
[Lysozyme] (µM)
Page 95
73
3.2.2. Concentration-dependence of lysozyme amyloid fibril formation
kinetics – a comparative study of Thioflavin T and Nile Red
After successful confirmation that the experimental conditions chosen lead to the growth of
mature lysozyme fibrils as described in the literature, we studied the concentration-dependence of
lysozyme amyloid fibrillation kinetics under acidic pH and elevated temperature. Two different
lysozyme concentrations (0.2 and 1.0 mM) were incubated at pH 2.2 and 57 ºC and the use of the
‘standard’ fluorescent probes ThT and NR to monitor their fibrillation kinetics was compared. Both
these lysozyme concentrations were previously demonstrated to form fibrils (Mishra et al., 2007).
Aliquots from the incubated samples were withdrawn for at least 12 days and mixed with assay
solutions containing 8.6 M of ThT (in Tris-HCl buffer, pH 7.4) or 2.9 M of NR (in glycine
buffer, pH 2.2). The final protein concentrations in the analyzed samples were 1 or 5 M (on a
monomer basis) (obtained from 0.2 and 1.0 mM lysozyme stock solutions, respectively (Figure
3.2)). These assays will be further used as controls for the studies that will be presented in the next
section, where the fluorescence properties of A488 will be explored as a sensitive probe for
detecting lysozyme amyloid fibril formation in vitro.
1.0 and 0.2 mM lysozyme amyloid fibril formation followed a sigmoidal growth curve with
an approximately 4- and 6-days lag phase, respectively, before an increase in the fluorescence
intensity of ThT was detected (Figure 3.16 A). This behavior is characteristic of a nucleation-
dependent polymerization mechanism (Butterfield and Lashuel, 2010). During the lag phase, the
protein starts to unfold and several partially unfolded monomeric intermediate species are formed in
solution. These intermediates interact with each other, associating and dissociating until a
thermodynamically unfavorable conversion of monomers into a -enriched oligomeric “nucleus”
occurs. Up to this point, ThT fluorescence intensity remains low as the intermediates present in
solution do not bind the dye. The “nuclei” formed will then assemble into higher-order protofibrils
through fast addition of monomers. This results in exponential fibril growth as this is now an
energetically favorable process. The fluorescence intensity of ThT increases steeply during this
phase as ThT shows enhanced fluorescence upon binding to amyloid fibrils (Figure 3.16 A).
Finally, the signal reaches a plateau value because fibril formation reached an equilibrium state. It
should be noted that these measurements are typically more erratic at the last days of incubation,
particularly when a high protein concentration is used (blue and red squares, Figure 3.16 A). At
these time points, large mature fibrils are suspended in solution and it is difficult to guarantee that
each aliquot withdrawn from the incubation mixtures samples has the same amount of material.
Finally, the lower plateau value obtained for the ThT fluorescence intensity when fibril formation
was initiated using 0.2 mM as compared to 1.0 mM lysozyme is due to both a lower overall fibril
Page 96
74
formation yield (see Table 3.7 in section 3.2.3.2) and the presence of lower final protein
concentrations (1 versus 5 M, respectively) in the assay mixtures.
Figure 3.16 - Lysozyme fibrillation kinetics evolves with a sigmoidal behavior at pH 2.2 and
57 ºC.
(A) Kinetics of lysozyme amyloid formation was monitored by NR (red symbols) and ThT (blue
symbols). The values presented are the integrated areas of the emission spectra of ThT from 470-
600 nm (exc= 450 nm) and of NR from 565-800 nm (exc= 552 nm). (B) NR steady-state
fluorescence anisotropy was measured at different time points (exc= 562 nm; em= 636 nm). Two
different protein concentrations were used in the incubation mixtures: 0.2 (green circles) and 1.0
mM (blue squares), respectively. The dashed lines are just a guide to the eye.
The kinetic trajectories obtained using ThT and NR fluorescence intensities do not overlap
exactly as the lag phases detected using NR are ~ 1 day longer as compared to ThT and the growth
phases do not seem as abrupt as the ones detected with ThT (Figure 3.16 A). These results were
confirmed by performing time-resolved fluorescence measurements with the samples containing
NR. As it is shown in Figure 3.17, until day5 and day6 for 1.0 and 0.2 mM lysozyme solutions,
respectively, the amplitude-weighted mean fluorescence lifetime of NR is essentially constant
(<>1~ 0.5 ns), and very similar to the value presented by the free dye in aqueous solution (Figure
3.11). The increase of NR lifetime components (particularly 3 from ~1.5 to 3.2 ns) after day5 and
day6 for 1.0 and 0.2 mM lysozyme solutions, respectively, causes an increase in its mean
fluorescence lifetime up to ~2.0 ns, reporting the presence of lysozyme fibrils in solution after these
incubation periods.
Page 97
75
Figure 3.17 – Kinetics of lysozyme amyloid fibril formation (pH 2.2 and 57 ºC) monitored by
time-resolved fluorescence intensity measurements with 2.9 µM of Nile Red.
(A and B) fractional amplitudes, (C and D) lifetime components and (E and F) amplitude-weighted
mean fluorescence lifetime of 2.9 M NR at different time points during the fibrillation reactions of
(A, C and E) 1.0 and (B, D and F) 0.2 mM lysozyme. The dashed lines are just a guide to the eye.
The fibrillation took course for 14 days, although not all the time-points were investigated.
Page 98
76
To complement these results, steady-state and time-resolved fluorescence anisotropy
measurements of Nile Red-containing samples were also performed. During the lag phases of
lysozyme kinetics, the steady-state anisotropy of NR presented a low value, identical to the one
measured for the free dye in solution (<r>= 0.09 0.02 (n= 3)) (Figure 3.11 A). The NR anisotropy
decay measured at these early times depolarized rapidly in solution to 0, as it is exemplified in
Figure 3.18 A for t0/ 0.2 mM lysozyme. At longer incubation times, the characteristic “dip-and-
rise” behavior discussed earlier was detected in the fluorescence anisotropy decays of NR
(exemplified in Figure 3.18 A for t6 and t7/ 0.2 mM lysozyme). Simultaneously, the steady-state
anisotropy of NR in these samples increased until reaching plateau values of <r>~ 0.33 ± 0.01
(Figure 3.16 B).
The fluorescence anisotropy decays of NR obtained at different time points were analyzed
with the associative model described above (section 3.2.1.3). Again, this simple model could
adequately describe the experimental data obtained during the fibrillation kinetics of lysozyme and
the values recovered from the fittings for the fast rotational correlation time presented by the free
dye ( 0.15 ± 0.04 ns (day 6-14; n= 4) and 0.17 ± 0.03 ns (day 6-10; n= 6) for 0.2 and 1.0
mM lysozyme, respectively) and for the limiting anisotropies of the samples (r∞ = 0.34 ± 0.05 (day
6-14; n= 4) and r∞ = 0.31 ± 0.01 (day 6-10; n= 6) for 0.2 and 1.0 mM lysozyme, respectively) are in
good agreement with the ones recovered in the previous experiments carried out with mature
isolated lysozyme fibrils (Table 3.4). In addition, the values recovered for the molar fractions of NR
bound to lysozyme fibrils produced in the course of its fibrillation clearly show again that the
kinetics is 1-2 days slower for 0.2 mM as compared to 1.0 mM lysozyme at acidic pH and elevated
temperature.
In conclusion, the amyloid fibril formation of lysozyme was successfully followed with both
standard probes ThT and NR. Again, the steady-state fluorescence anisotropy of NR was confirmed
to be a very sensitive parameter that can be used in detecting the presence of lysozyme fibrils in
solution. Altogether, the fluorescence results obtained for NR clearly confirm that this dye binds
poorly or does not bind at all to native lysozyme at pH 2.2 or to any of the intermediates that are
formed during the lag phase of lysozyme fibrillation kinetics. This suggests that these intermediates
do not display nonpolar binding pockets that are able to accommodate this hydrophobic dye.
Furthermore, a 5-fold decrease in the concentration of lysozyme used in the fibrillation assay
carried out under quiescent conditions (from 1.0 to 0.2 mM) was found to increase the lag phase of
its sigmoidal kinetics by approximately 2 days.
Page 99
77
Figure 3.18 - Kinetics of lysozyme amyloid fibril formation monitored by time-resolved
fluorescence anisotropy measurements of 2.9 µM of Nile Red.
(A) The anisotropy decays of NR were measured using = 565 nm and = 650 nm at day 0
(t0), day 6 (t6), day 7 (t7) and day 14 (t14) during the fibrillation reaction of 0.2 mM lysozyme at
pH 2.2 and 57 ºC. The anisotropy decays were fitted according to an associative model (Eq. 3.9,
solid lines) (see the text and the legend of Figure 3.13 for more details). (B) Dependence of NR
bound molar fraction to amyloid lysozyme fibrils with the incubation time of the protein samples:
0.2 mM (triangles) and 1.0 mM lysozyme (circles), recovered from the previous analysis The
fibrillation reactions took course during 14 days, although not all time-points were measured.
Page 100
78
3.2.3. Monitoring lysozyme aggregation/fibrillation via A488 fluorescence
After establishing that the fluorophore A488 is a sensitive probe for detecting unfolding
transitions of Lz-A488 with temperature, our study proceeded to evaluate (i) the ability of this
fluorescently-labeled protein to form mixed fibrils with lysozyme, and (ii) the influence of the Lz-
A488/lysozyme mixing ratio used in the incubation mixture on both the kinetics of lysozyme
fibrillation and the structural characteristics presented by the isolated mature lysozyme fibrils.
Several mixing ratios of Lz-A488/lysozyme were investigated in these studies: 1/2 and 1/8
([Lz]t= 0.2 mM), 1/40, 1/100 and 1/200 ([Lz]t= 1.0 mM). The highest Lz-A488/lysozyme mixing
ratios (1/2 and 1/8) were studied using a lower total lysozyme concentration in the incubation
mixtures ([Lz]t= 0.2 mM) due to difficulties in concentrating the stock solution of Lz-A488 by
ultrafiltration using the Amicon® Ultra-15 filter devices. The flow rate in ultra filtration is affected
by numerous factors, namely the sample concentration and its chemical nature, the starting volume,
membrane type, temperature, relative centrifugal force and centrifuge rotor angle. Even when using
longer centrifugation times than the values suggested in Amicon® Ultra-15 user guide, we were not
able to concentrate the stock solution as much as we wanted. A low sample recovery in the
concentrate due to adsorptive losses may also have occurred (Amicon® Ultra-15 user guide).
As it was shown in the control assays presented in the previous section, the main
consequences of using a lower protein concentration were the extension of lysozyme fibrillation lag
phase by 1 – 2 days and the production of a lower amount of lysozyme fibrils at the end of the
fibrillation reactions (see section 3.2.3.2).
3.2.3.1. A488 is a versatile probe for detecting lysozyme amyloid fibril
formation in vitro
The results obtained for Lz-A488/lysozyme= 1/40 will be presented first in detail as an
example. Aliquots from the incubated sample ([Lz]t= 1.0 mM) were withdrawn during 14 days and
the fluorescence properties of Lz-A488 were used to monitor lysozyme fibrillation kinetics. Both
the steady-state fluorescence emission spectra and anisotropy of Lz-A488 from samples obtained at
different time points (Figure 3.2) were measured at room temperature. Figure 3.19 A shows that the
integrated area of the fluorescence emission spectra of Lz-A488 decreased sharply during the first 7
days of sample incubation, until reaching a plateau with a signal that was ~10-15 % of its initial
value at time 0. Concomitantly, the emission spectra of Lz-A488 did not undergo any spectral shifts
(data not shown).
Page 101
79
Figure 3.19 - Kinetics of lysozyme amyloid fibril formation at pH 2.2 and 57 ºC monitored by
steady-state fluorescence measurements from Lz-A488.
(A and C) Normalized fluorescence intensities, to their values at 0 hours of incubation (squares) and
steady-state fluorescence anisotropies (circles) of Lz-A488 as a function of incubation time during
lysozyme fibrillation: (A and B) [Lz]t= 1.0 mM; Lz-A488/lysozyme molar ratio= 1/40 and (C and
D) [Lz]t= 0.2 mM; Lz-A488/lysozyme molar ratio= 1/8. The fluorescence intensities are the
integrated areas of the emission spectra of Lz-A488 using λexc = 480 nm and λem = 490-600 nm. In
(B) and (D) the time course of ThT steady-state fluorescence intensity during lysozyme fibrillation
kinetics is also plotted for comparison. For more details see the legend of Figure 3.16. The dashed
lines are just a guide to the eye.
On the other hand, the variation of the steady-state fluorescence anisotropy of Lz-A488 as a
function of its incubation time allowed to clearly identify 3 stages during lysozyme fibrillation
kinetics (Figure 3.19 A): (i) during the first 5 days, the anisotropy rose gradually from 0.22 to 0.24,
(ii) after day5, the anisotropy increased sharply from 0.24 up to 0.32 at day9 and finally, (iii) after
day9 its value remained constant over time (<r>= 0.316 0.002). This behavior is again consistent
with a nucleation-dependent polymerization mechanism presented by lysozyme during its
fibrillation (Butterfield and Lashuel, 2010). Stages 1, 2 and 3 must then correspond to the lag phase,
Page 102
80
exponential growth and stationary phases of the kinetics, respectively. Indeed, the overlay of ThT-
binding assay intensity and Lz-A488 fluorescence anisotropy showed a close agreement between
the midpoints of fiber formation transitions (Figure 3.19 B). These results support the conclusion
that Lz-A488 is able to form mixed fibrils with the corresponding unlabeled protein and that
fluorescence anisotropy of Lz-A488 is a very good reporter parameter of lysozyme amyloid fibril
formation kinetics in vitro.
The fluorescence intensity decay kinetics of Lz-A488 from samples obtained at different
time points were also measured at room temperature. All the fluorescence decay profiles of Lz-
A488 were adequately described by a tri-exponential function (Figure 3.20). The normalized
amplitude of the Lz-A488 long lifetime component (3) dropped by half during the exponential
phase of this kinetics (Figure 3.20 A); simultaneously, 3 presented an increase from 3= 3.55 0.04
(day0-day7) to 3= 3.80 0.03 (as of day8). This indicates that Lz-A488 is probably being rigidly
locked in a partially-unfolded and quenched conformation in the fibrils formed (Figure 3.20 C).
Finally, the anisotropy decay kinetics of Lz-A488 from samples obtained at each incubation
time were also measured at room temperature to complement the steady-state anisotropy data, as it
is illustrated in Figure 3.21 A for days 0, 6 and 14. The parameters recovered from the analyses are
summarized in Table 3.5. The most striking result was the need to include a non-zero limiting
anisotropy, r, in Eq. 3.19 in order to be able to get a good fit of this equation to the experimental
data of r(t) for incubation times longer than 4-5 days (Table 3.5). This result clearly shows that Lz-
A488 is being progressively incorporated into large lysozyme assemblies (protofibrils and fibrils)
that are unable to depolarize the fluorescence emission from Lz-A488 during the time window
defined by its excited-state lifetime.
Page 103
81
Figure 3.20 – Kinetics of lysozyme amyloid fibril formation at pH 2.2 and 57 ºC monitored by
time-resolved fluorescence intensity measurements from Lz-A488.
(A and B) Fractional amplitudes, (C and D) lifetime components and (E and F) amplitude-weighted
mean fluorescence lifetimes from Lz-A488 at different time points (measured with = 460 nm
and = 515 nm) during the fibrillation reactions of (A, C and E) [Lz]t= 1.0 mM; Lz-A488/
lysozyme molar ratio= 1/40 and (B, D and F) [Lz]t= 0.2 mM; Lz-A488/lysozyme molar ratio= 1/8.
The fibrillation reactions took course during 14 days but not all time points were measured. The
dashed lines are just a guide to the eye.
Page 104
82
Table 3.5 – Fluorescence anisotropy decay parameters from Lz-A488 at different time points
during lysozyme fibrillation kinetics carried out at pH 2.2 and 57 ºC with [Lz]t= 1.0 mM; Lz-
A488/lysozyme molar ratio= 1/40.
The steady-state and time-resolved anisotropy decays were measured using = 495 nm and =
460 nm, respectively, and = 515 nm. βi, fractional amplitudes; , rotational correlation times;
r, limiting anisotropy; r(0)= 1 + 2 + r. The goodness-of-fit was judge by the
value. <r>cal
was calculated according to Eq. 3.24. <r>exp are presented as mean ± SD of ten
measurements.Values in brackets are the errors of the recovered parameters estimated as the lower
and upper bound of the joint confidence interval calculated for a 67% probability level.
Incubation
days β1
1 β2
2 r∞ r(0)
<r>cal <r>exp (ns) (ns)
0 0.06 0.09 0.34 5.9 - 0.40 1.18 0.220 0.218
[0.05, -]
[5.8,6.1]
± 0.004
1 0.06 0.08 0.34 6.0 - 0.40 1.19 0.224 0.219
[0.05, - ]
[5.8,6.1]
± 0.005
2 0.05 0.14 0.34 6.1 - 0.40 1.18 0.228 0.225
[0.12,0.21]
[6.0,6.4]
± 0.004
3 0.05 0.18 0.35 6.3 - 0.40 1.11 0.231 0.230
[0.12,0.21]
[6.1,6.4]
± 0.007
4 0.06 0.08 0.34 5.6 0.01 0.41 1.16 0.230 0.230
[0.06,-]
[5.4,6.3] [0.00,0.02]
± 0.006
5 0.04 0.28 0.34 6.3 0.02 0.39 1.07 0.245 0.236
[0.07,0.49]
[5.7,7.0] [0.00,0.03]
± 0.006
6 0.05 0.04 0.30 5.6 0.06 0.41 1.26 0.253 0.261
[0.02, -]
[5.5,6.1] [0.04,0.06]
± 0.012
7 0.06 0.08 0.23 5.5 0.12 0.41 1.28 0.273 0.278
[0.06,0.14]
[5.2,5.6] [0.12,0.12]
± 0.016
8 0.05 0.07 0.13 4.0 0.22 0.40 1.07 0.301 0.304
[0.05,0.12]
[3.6,4.9] [0.21,0.23]
± 0.003
9 0.06 0.08 0.09 3.4 0.25 0.41 1.14 0.308 0.316
[0.06,0.13]
[2.8,4.5] [0.24,0.26]
± 0.011
10 0.03 0.11 0.08 3.0 0.29 0.40 1.15 0.328 0.316
[0.03,0.16]
[2.6, 6.0] [0.26,0.29]
± 0.010
11 0.05 0.09 0.09 3.7 0.26 0.41 1.12 0.312 0.317
[0.06, -]
[3.1,5.1] [0.24,0.27]
± 0.014
12 0.05 0.06 0.08 2.7 0.27 0.41 1.12 0.315 0.320
[0.04, -]
[2.4,3.4] [0.26,0.28]
± 0.011
13 0.06 0.12 0.08 3.0 0.27 0.41 1.15 0.310 0.314
[0.05, -]
[2.3,4.7] [0.26,0.27]
± 0.013
14 0.06 0.03 0.09 2.7 0.26 0.40 1.14 0.298 0.316
[0.01, -] [2.4,4.6] [0.24,0.26] ± 0.016
Page 105
83
Figure 3.21 - Time-course of fluorescence anisotropy decays for different time-points of
lysozyme fibrillation.
(A) [Lz]t= 1.0 mM; Lz-A488/lysozyme molar ratio= 1/40 and (B) [Lz]t= 0.2 mM; Lz-A488/
lysozyme molar ratio= 1/8. The solid lines are the best fit of Eq. 3.19 to the anisotropy decays of
Lz-A488 measured at room temperature from samples obtained at (A) 0 (red), 6 (green) and 14 days
(blue) and (B) 0 (red), 8 (green) and 14 days (blue), respectively. For more details, see Table 3.5.
The small “bump” that is seen at approximately 13 ns is due to a secondary pulse of the laser
system. This “bump” is more visible when the fluorescence intensity of the sample is lower.
3.2.3.2. Influence of Lz-A488/lysozyme mixing ratio on lysozyme amyloid
fibril formation kinetics and on the fluorescence properties of
lysozyme mature fibrils
The next question addressed in this study was whether the Lz-A488/lysozyme mixing ratio
used in the incubation mixture influenced lysozyme fibril formation kinetics. The steady-state and
time-resolved fluorescence data obtained from the samples prepared with 1/100 and 1/200 Lz-
A488/lysozyme mixing ratios ([Lz]t= 1.0 mM) were essentially identical to the ones previously
described for the 1/40 sample (as can be seen in Figure 3.22 A and B for the steady-state
Page 106
84
fluorescence measurements). It was therefore possible to decrease by 5-fold the molar fraction of
fluorescently-labeled protein used in the sample mixture and still be able to accurately track the
distinct stages of lysozyme fibril formation kinetics.
When the Lz-A488/lysozyme mixing ratio used in the preparation of the samples was
increased to 1/8 and 1/2 ([Lz]t= 0.2 mM), the relative drop in Lz-A488 fluorescence intensity at
each incubation day was similar to the one previously described in detail for the 1/40 sample
(Figure 3.22 A). However, the increase in the steady-state fluorescence anisotropy of Lz-A488 over
time was much less pronounced and almost non-existent for the samples 1/8 and 1/2, respectively
(Figure 3.22 B). For the sample prepared with a 1/8 ratio, it was still possible to identify the lag
phase (from day 0 to day 6), the growth phase (from day 6 to day 10) and the stationary phase
(day10 onwards) characteristic of lysozyme fibrillation kinetics (Figure 3.19 C), but the plateau
value reached at the final stage of the kinetics (<r>= 0.259 0.004) was much lower than the one
obtained for the samples 1/40, 1/100 and 1/200 (Figure 3.22 B). Furthermore, although the
amplitude of the Lz-A488 long lifetime component also dropped by half during the exponential
phases of both these mixtures (exemplified in Figure 3.20 B for the sample 1/8), 3 remained
essentially constant over time for the samples 1/8 and 1/2 (Figure 3.20 E and data not shown) at
variance with the results obtained for the samples 1/40, 1/100 and 1/200 (Figure 3.20 B and data not
shown). Again, the overlay of the ThT-binding assay and Lz-A488 fluorescence anisotropy showed
a close agreement between the midpoints of fibril formation transition (Figure 3.19 D).
The sharp decrease detected in the fluorescence intensity during the first 7 days of
incubation was independent of the initial lysozyme concentration and mixing ratio used, and in the
subsequent days its value remained almost invariant at 10 to 20% of the initial value (Figure 3.22
A). Assuming that A488 covalently-labeled to lysozyme undergoes a fluorescence PET-based
quenching mechanism, the sharp decrease in fluorescence intensity could be explained by the
progressive irreversible unfolding of Lz-A488 over time due to the prolonged exposure of Lz-A488
to pH 2.2 and 57 ºC. As more lysozyme molecules undergo unfolding, less fluorescence emission is
measured due to quenching, although only small differences in steady-state fluorescence anisotropy
are seen up to day6-7. This suggests that the changes in fluorescence intensity observed in an initial
phase are mainly due to conformational alterations rather than a change in the state of aggregation
of Lz-A488. In a study performed by Ryan and co-workers, about fibril formation of A488-labeled
apolipoprotein C-II, the authors also detected a decrease in fluorescence intensity over time with a
parallel increase in anisotropy, but they do not provide any explanation for these results; they just
highlighted the sensitivity of A488 fluorescence properties has being convenient for the continuous
monitoring of fibril formation (Ryan et al., 2008).
Page 107
85
Figure 3.22 – Influence of Lz-A488/lysozyme mixing ratio on lysozyme fibrillation kinetics at
pH 2.2 and 57 ºC.
(A) Relative fluorescence intensities, (B) steady-state fluorescence anisotropies and (C) limiting
anisotropies from Lz-A488 as a function of incubation time during lysozyme fibrillation. Red
circles and green triangles are the results for [Lz]t= 0.2 mM with Lz-A488/lysozyme molar ratio=
1/2 and 1/8, respectively. Blue squares, orange diamonds and black crosses are the results for [Lz]t=
1.0 mM; Lz-A488/lysozyme molar ratio= 1/40, 1/100 and 1/200 respectively. The error bars in (C)
correspond to the lower and upper bound of the joint confidence intervals calculated for r at 67%
probability level.
The steady-state anisotropy results described above raised the possibility that lysozyme fibril
formation could be hampered in samples 1/2 and 1/8 due to the very high labeled/unlabeled mixing
ratios used. To clarify if lysozyme fibrils were indeed being formed, NR was added to the aliquots
taken from the incubation mixtures 1/8 and 1/2 at day11, and the steady-state fluorescence
anisotropy of this dye was measured. The values obtained (<r>= 0.320 0.017 and <r>= 0.291
0.022 in each case, respectively) confirmed the presence of lysozyme amyloid fibrils in these
samples.
Page 108
86
Several alternative hypotheses can be put forward to explain the steady-state fluorescence
anisotropy data presented above for the mixtures 1/2 and 1/8, namely:
(i) lysozyme fibrils produced in these samples are not fluorescent (i.e. lysozyme amyloid fibrils
formed in these samples contain exclusively the unlabeled protein). This scenario could occur if the
addition of a monomeric fluorescently-labeled lysozyme molecule to the critical “nuclei” prevented
its further growth to protofibrils, and ultimately lysozyme fibrils. The increase detected in the
steady-state fluorescence anisotropy of these samples would then have to be due to the formation of
small oligomeric fluorescent species in solution;
(ii) mixed fluorescent lysozyme amyloid fibrils are formed in these samples but in much smaller
amounts;
(iii) the occurrence of homotransfer (energy migration) between the Lz-A488 molecules
incorporated in the mixed fibrils at a high density alters the kinetics of its emission anisotropy
(Bader et al., 2011).
It should be noted that the last two hypotheses are not necessarily mutually exclusive.
The first hypothesis was discarded by performing CFM studies of mature lysozyme fibrils
isolated from the protein samples 1/2 and 1/8 by centrifugation. As it is shown in Figure 3.23,
lysozyme amyloid fibrils could be imaged by CFM using the experimental settings adequate for
A488 and NR fluorescence emission detection (Figure 3.23). Furthermore, the analysis of the Lz-
A488 anisotropy decays from samples obtained at each incubation time already indicated the
progressive formation of large fluorescent entities in solution as the inclusion of a non-zero residual
anisotropy in the fitting equation to r(t) was again required for incubation times longer than 4 and 8
days in order to be able to adequately describe the experimental data obtained for the 1/8 (Figure
3.21 B, Figure 3.22 C and Table 3.6) and 1/2 (Figure 3.22 C) incubation mixtures, respectively. In
fact, as it is illustrated in Figure 3.22 C, the three stages of lysozyme fibrillation can be clearly
identified by plotting r as a function of sample incubation time for the incubation mixture 1/40 and
less pronounced with 1/8. It should be noted, however, that the values recovered for r from these
analysis for the mixtures 1/8 and 1/2 were much lower as compared to the incubation mixture 1/40
as it is shown in Figure 3.22 C.
Page 109
87
Figure 3.23 - Mature lysozyme fibrils isolated from the protein samples 1/2 and 1/8.
Mature mixed lysozyme fibrils were pelleted by centrifugation at the end of the incubation of
mixtures prepared with Lz-A488/lysozyme molar ratios: (A and B) 1/2 and (C and D) 1/8. The
fibrils were visualized with A488 (A and C) or stained with NR (B and D).
The second hypothesis was tested by comparing the final total amount of fibrils produced in
mixed versus pure lysozyme fibrillation mixtures. After an incubation period of 12 – 14 days at pH
2.2 and 57 ºC under quiescent conditions, mature lysozyme fibrils were isolated by three
consecutive centrifugation steps (Figure 3.3) and quantified spectrophotometrically at 280 nm as
previously described in section 2.5. The final yields of lysozyme fibril formation are presented on
Table 3.7. The yield represents the amount of lysozyme (on a monomer basis) that was included in
the fibrils relatively to the initial amount preset in each sample. Several incubations of 1 mM of
lysozyme were performed and an average yield of η= (45 ± 9) % (n= 9) was calculated. A similar
value was obtained for the mixed samples, η= (42 ± 10) % (n= 4), excluding the molar ratio 1/2,
which had an average yield of 27 %. This value was slightly lower than the rest. For 0.2 mM
lysozyme, 4 incubations were performed and a yield of η= (16 ± 4) % (n= 4) was calculated, which
is clearly lower than the rest. Although the results have a large variability, the control results
obtained for 0.2 mM lysozyme show a clear difference from the results obtained with 1.0 mM
indicating a lower fibril formation yield for 0.2 mM as compared to 1.0 mM lysozyme. For the
mixed samples it is difficult to explain whether the fibrillation is hampered or favored by the
Page 110
88
presence of labeled molecules of lysozyme, due to the discrepancies in the results obtained. It is
necessary to carry out more experiments to clarify this point.
Table 3.6 - Fluorescence anisotropy decay parameters from Lz-A488 at different time points
during lysozyme fibrillation kinetics carried out at pH 2.2 and 57 ºC with [Lz]t= 0.2 mM; Lz-
A488/ lysozyme molar ratio= 1/8.
For more details, see the legend of Table 3.5.
Incubation
days β1
1 β2
2 r∞ r(0)
<r>cal <r>exp (ns) (ns)
0 0.04 0.49 0.33 6.2 - 0.37 1.16 0.222 0.213
[0.19,0.65]
[5.9,6.3]
± 0.006
2 0.05 0.27 0.34 6.2 - 0.39 1.10 0.228 0.227
[0.23,0.41]
[6.1,6.3]
± 0.008
4 0.05 0.11 0.34 5.9 0.01 0.40 1.14 0.232 0.225
[0.09,0.20]
[5.7,6.1] [0.01,-]
± 0.008
6 0.04 0.13 0.32 5.2 0.03 0.40 1.08 0.233 0.229
[0.08, -]
[5.0,6.0] [0.00,0.04]
± 0.012
8 0.06 0.15 0.28 5.6 0.04 0.38 1.25 0.235 0.240
[0.07,-]
[5.0,7.0] [0.02,0.06]
± 0.003
10 0.07 0.13 0.23 4.7 0.10 0.40 1.16 0.247 0.260
[0.09,-]
[4.1, 6.6] [0.07,0.11]
± 0.010
12 0.07 0.09 0.19 3.7 0.14 0.40 1.23 0.251 0.261
[0.07,0.13]
[3.4,4.0] [0.13,0.14]
± 0.011
14 0.08 0.19 0.18 4.2 0.14 0.40 1.14 0.260 0.264
[0.15,0.31] [3.8,5.1] [0.13,0.15] ± 0.011
Finally, the fluorescence intensity and anisotropy decays measured for the isolated mature
lysozyme amyloid fibrils prepared by centrifugation were also compared to the ones obtained from
the aliquots withdrawn from the samples after 14 days of incubation (samples t14) (Table 3.8, Table
3.9 and Figure 3.24). The rationale beyond this approach was to reduce the sample heterogeneity by
eliminating the soluble material from the samples by centrifugation (mainly, monomeric unfolded
lysozyme molecules as well as small oligomeric intermediates/ protofibrils). If the dominant
fluorescent species present at the end of lysozyme incubation were large mature lysozyme fibrils
than one would expect to obtain very similar anisotropy decays for both samples (t14 and isolated
Page 111
89
fibrils). This was the case found for the sample 1/40 (Figure 3.24 C) as its limiting anisotropies
were 0.26 and 0.29 for the t14 samples and isolated mature fibrils, respectively (Table 3.9). The
emission decay kinetics was also identical for both samples (Table 3.8).
Table 3.7 - Fibril formation yields in pure versus mixed lysozyme fibrillation mixtures after 12
– 14 days of incubation at pH 2.2 and 57 ºC under quiescent conditions.
Lysozyme fibrillation kinetics in the mixed mixtures was carried out using variable Lz-
A488/lysozyme molar ratios: 1/2, 1/8, 1/40, 1/100 and 1/200, respectively. The calculations of
lysozyme amounts were made on a monomer basis.
[Lz]total
(mM) Sample
n Final yield
(%)
0.2
Lz 4 16 ± 4
1/2 1 27
1/8 1 38
1.0
Lz 9 45 ± 9
1/40 1 40
1/100 1 56
1/200 1 33
On the other hand, if there was a large amount of fluorescent material at t14 that could
not be pelleted by centrifugation, than one would expect the anisotropy decays from the t14 sample
to be much faster than the one’s obtained for the isolated fibrils. The mixture 1/8 conformed to this
scenario as it is shown in Figure 3.24 B. In this case, the residual anisotropies measured for the t14
sample and isolated mature fibrils were 0.14 and 0.28, respectively (Table 3.9). The additional
observation that the anisotropy decays obtained for the mature isolated fibrils isolated from samples
1/8 and 1/40 were very similar (Figure 3.24 B and C, and Table 3.9) further indicates that the mixed
mature lysozyme fibrils produced in these samples at the end of the incubation time presented very
similar sizes, although they were produced in lower amounts in the mixture 1/8.
The anisotropy decays of Lz-A488 measured for the sample 1/2 at t14 and after isolating the
mature lysozyme fibrils were totally distinct from the previous ones (Figure 3.24 A). The limiting
anisotropy of the sample t14 was very low (r= 0.04 (Table 3.9)). Furthermore, the anisotropy
decay of the isolated fibrils was much faster than the ones presented by the samples 1/8 and 1/40
(Figure 3.24), with a limiting anisotropy of only 0.12 (Table 3.9). In addition, the relative
contribution of the fast rotational correlation time to the decay was much more important in this
Page 112
90
case as compared to the other mixtures studied (29% compared to 17 and 12% for the samples 1/8
and 1/40, respectively). Both these results can be rationalized on the basis of a very efficient energy
migration (homotransfer) process between the Lz-A488 molecules incorporated in the mixed fibrils,
causing a very efficient depolarization of the fluorescence emission of the sample. In fact, the A488
fluorophore has a very small Stokes shift and therefore when two of these molecules are separated
by a short distance, resonance energy transfer may occur between them (Lakowicz, 2006; van Ham
et al., 2010). It should also be noted that the amplitude-weighted mean fluorescence lifetime of the
mature isolated fibrils prepared form the sample 1/2 was much shorter than the values obtained for
the samples 1/8 and 1/40 (<>1= 0.6 ns versus 1.6 and 1.8 ns, respectively (Table 3.8)). This result
further suggests that the final conformation/packing of Lz-A488 in the mature lysozyme fibrils
isolated from the sample prepared with a very high labeled/unlabeled protein ratio is different from
the other cases.
Figure 3.24 – Comparison between the fluorescence anisotropy decays obtained for the
sample incubated for 14 days at pH 2.2 and 57 ºC (red) and 5 µM isolated mixed fibrils (blue).
The fluorescence anisotropy decays of Lz-A488 were measured at room temperature. The Lz-
A488/lysozyme molar ratio used in the incubation mixture was (A) 1/2, (B) 1/8 and (C) 1/40. The
total lysozyme concentration in the incubation mixtures were (A and B) 0.2 mM and (C) 1.0 mM.
The solid lines are the best fits of Eq. 3.19 to the experimental data. For more details, see Table 3.5.
Page 113
91
Table 3.8 – Mean fluorescence lifetimes and intensity decay parameters from Lz-A488 at 14
days of incubation and after isolating the mature lysozyme fibrils by centrifugation.
Lysozyme fibrillation kinetics was carried out at pH 2.2 and 57 ºC using variable Lz-
A488/lysozyme molar ratios. Sample 1/2 and 1/8: [Lz]t= 0.2 mM; Lz-A488/lysozyme molar ratio=
1/2 and 1/8, respectively; Sample 1/40: [Lz]t= 1.0 mM; Lz-A488/lysozyme molar ratio= 1/40) (for
more details see the legend of Table 3.2).
Sample α1 τ1
(ns) α2
τ2
(ns) α3
τ3
(ns)
<τ>1
(ns)
<τ>2
(ns)
1/2
14
days
0.46 0.18 0.27 1.09 0.27 3.65 1.36 2.88 1.23
[0.16,0.20] [1.02,1.19] [3.60, 3.70]
5 µM
fibrils
0.59 0.11 0.29 0.67 0.12 2.66 0.58 1.70 1.49
[0.10,0.12} [0.62,0.69] [2.58,2.72]
1/8
14
days
0.39 0.19 0.29 1.21 0.32 3.61 1.57 2.91 1.16
[0.18,0.21] [1.11,1.27] [3.56,3.64]
5 µM
fibrils
0.39 0.28 0.32 1.34 0.29 3.57 1.57 2.73 1.15
[0.24,0.31] [1.22,1.45] [3.51,3.65]
1/40
14
days
0.35 0.18 0.28 1.25 0.37 3.79 1.81 3.18 1.30
[0.14,0.21] [1.10,1.39] [3.73,3.86]
5 µM
fibrils
0.35 0.20 0.29 1.36 0.36 3.81 1.84 3.14 1.11
[0.16,0.23] [1.21,1.48] [3.73,3.87]
In conclusion, we showed that Lz-A488 is able to form mixed fibrils with the corresponding
unlabeled protein and the variation of its steady-state fluorescence anisotropy over the incubation
period could be used to track the different stages of lysozyme fibrillation kinetics in detail when a
low Lz-A488/lysozyme mixing ratio was used in sample preparation (1/40, 1/100 and 1/200).
The labeled/unlabeled protein mixing ratio was found to affect the final structure of the
mixed fibrils formed. The population heterogeneity of the samples was evaluated through rotational
dynamics by performing time-resolved fluorescence anisotropy measurements. For the Lz-
A488/lysozyme mixing ratios 1/40, 1/100 and 1/200, the dominant fluorescent species present in
solution at the end of each kinetic were large mature mixed lysozyme fibrils that could be easily
pellet by centrifugation. On the other hand, a large amount of fluorescent soluble material that was
not easily pelleted by centrifugation was still present in the mixture 1/8 at its 14th day of incubation.
Page 114
92
Table 3.9 - Fluorescence anisotropy decay parameters from Lz-A488 at 14 days of incubation
and after isolating the mature lysozyme fibrils by centrifugation.
For more details see the legend of Table 3.5 and Table 3.8.
Sample β1 1
β2 2
r∞ r(0) <r>cal <r>exp
(ns) (ns)
1/2
14
days
0.09 0.04 0.28 3.78 0.04 0.40 1.22 0.207 0.223
[0.03,0.07]
[3.62,4.01] [0.03,0.04]
± 0.011
5 µM
fibrils
0.12 0.01 0.17 3.71 0.12 0.40 1.15 0.241 0.246
[0.01,0.02]
[2.80,4.21] [0.11,0.15]
± 0.004
1/8
14
days
0.08 0.19 0.18 4.21 0.14 0.40 1.14 0.260 0.264
[0.15,0.31]
[3.82,5.13] [0.13,0.15]
± 0.011
5 µM
fibrils
0.07 0.04 0.06 2.17 0.28 0.40 1.15 0.308 0.246
[0.03,-]
[1.84,3.29] [0.28,-]
± 0.004
1/40
14
days
0.06 0.03 0.09 2.73 0.26 0.38 1.14 0.298 0.316
[0.02,-]
[2.44,4.63] [0.24,0.26]
± 0.016
5 µM
fibrils
0.05 0.05 0.06 2.71 0.29 0.40 1.24 0.325 0.318
[0.03,0.09] [2.29,2.98] [0.29,0.30]
± 0.010
The fluorescence intensity decays obtained for the mixed mature lysozyme fibrils isolated
from the samples 1/40, 1/100 and 1/200 indicate that Lz-A488 must be rigidly locked in a partially-
unfolded and quenched conformation in the highly ordered fibrillar structures produced at the end
of the incubation time (presenting a characteristic long lifetime component of 3.8 ns (Figure 3.20
C)). The conformation/packing of the fluorescently-labeled protein in the isolated mixed fibrils
prepared from the sample 1/2 must be quite different from the previous cases as its amplitude-
weighted mean fluorescence lifetime was much shorter in this case (Table 3.8).
Lastly, the time-resolved fluorescence anisotropy data also showed the occurrence of
significant energy migration (homotransfer) between Lz-A488 molecules incorporated in the mixed
mature fibrils formed only when the highest Lz-A488/lysozyme mixing ratio of 1/2 was used in
sample preparation.
Page 115
93
3.3. Lysozyme and Thioflavin T binding to anionic lipid membranes
One of the main goals of the undergoing research at the host laboratory is the clarification of
the putative role of anionic lipid membranes in triggering amyloid-like fibril formation by several
non-amyloidogenic proteins under physiological conditions. In fact, although several studies
reported that the presence of negatively charged phospholipids is sufficient to induce rapid
formation of fibers by a variety of non-amyloidogenic proteins, including lysozyme (Zhao et al.,
2004 and 2005; Alakoskela et al., 2006; Gorbenko et al., 2007), undisputable spectroscopic
evidences for this effect are still missing in the literature.
ThT is a cationic probe (Figure 1.8 D) that is widely used to detect the formation of amyloid
fibrils in solution (Biancalana and Koide, 2010; Groenning, 2010; Mishra et al., 2011). However, as
already mentioned in the Introduction, several studies show fluorescence enhancement of ThT upon
binding to anionic macromolecules like DNA or SDS micelles (Kumar et al., 2008; Hawe et al.,
2008). These observations immediately raised the question whether this cationic probe is still
selective to these amyloid-like assemblies when negatively charged phospholipids are present in
solution. It was therefore important to first characterize ThT partition towards POPC LUVs
containing variable mol% of POPS. Then, competition binding assays of ThT and lysozyme/mature
lysozyme fibrils and POPC LUVs containing 20 mol% of POPS were performed to evaluate the
ability of ThT spectroscopic properties to detect amyloid-like fibrils in the presence of anionic lipid
membranes. These experiments also allowed to test whether the co-incubation of lysozyme and
anionic liposomes in a low ionic strength buffer at pH 7.4.was sufficient to drive amyloid-like fibril
formation of lysozyme.
3.3.1. Thioflavin T partition to anionic lipid membranes is electrostatically-
driven
ThT partition towards POPC LUVs containing variable mol% of POPS (10, 20 and
30mol%) was studied by fluorescence spectroscopy by monitoring the increase in the fluorescence
intensity of 9 M of ThT upon changing the total lipid concentration in solution from 0 to 6 mM.
As it is shown in Figure 3.25 A the relative change in the fluorescence intensity of the dye, I, with
the phospholipid concentration in each sample was increasingly more pronounced as the acidic
phospholipid content of the lipid vesicles used in the assay was raised. Figure 3.25 A was fitted to
the data by linking Imax between the three partition curves (Imax= 3.99 0.07). ln Kp was found to
Page 116
94
vary linearly with the mol% of POPS used in the preparation of the liposomes (Figure 3.25 B),
confirming that this interaction is predominantly electrostatically-driven.
Figure 3.25 - Thioflavin T partition to anionic lipid membranes is electrostatically-driven.
(A) A multi-curve fit of the experimental results obtained with different mol% of POPS by Eq. 3.13
was performed by linking Imax during the fitting of the three experimental data sets (10 mol% in
red (Kp= (3.2 0.2) x 104); 20 mol% in green (Kp= (8.4 0.4) x 10
4); 30 mol% in blue (Kp= (1.9
0.1) x 105); Imax= 3.99 0.07). (B) ln(Kp) was linearly dependent on the mol% of POPS used in
the preparation of the liposomes.
3.3.2. Lysozyme binding to anionic lipid membranes does not induce
amyloid-like fibril formation
To evaluate the ability of ThT to detect amyloid fibrils in the presence of anionic lipid
membranes, competition binding assays of ThT and lysozyme/ mature lysozyme amyloid fibrils and
POPC LUVs containing 20mol% of POPS to ThT were carried out at room temperature. Lysozyme
or pre-formed lysozyme fibrils, ranging from 0 to 6 µM total protein concentration (on a monomer
basis) were added to a fixed concentration of 0.86 mM POPC:POPS 80:20 LUVs. After 1 hour
incubation of the LUV-protein mixtures at room temperature, 9 µM ThT was added to each sample
and the fluorescence emission intensity of ThT in each sample was measured after a further
incubation period of 30 minutes.
The ThT fluorescence signal was very low and independent of the native lysozyme
concentration in solution (Figure 3.26, open green triangles). Although it has already been reported
that ThT binds to some native proteins, like mentioned before, it appears that this does not happen
with HEWL. The pre-incubation of 0.86 mM POPC:POPS 80:20 LUVs with native lysozyme only
Page 117
95
shifted the ThT fluorescence signal of the samples vertically (Figure 3.26, closed green triangles).
This result suggests that the increase detected in the dye´s fluorescence intensity is due to its
binding to the anionic lipid vesicles and that these liposomes were not able to induce significant
amyloid-like fibril formation of lysozyme under these experimental conditions. The alternative
hypothesis that ThT partition towards the lipid vesicles might be preventing its binding to the
amyloid-like fibrils was ruled out by repeating the experiments above but this time using mature
lysozyme fibrils instead of native lysozyme. In this case, the fluorescence intensity of ThT
increased approximately linearly with the concentration of pre-formed lysozyme fibrils added to the
solution (Figure 3.26, open red squares); again, the data shifted vertically upon the inclusion of 0.86
mM POC:POPS 80:20 LUVs in the pre-incubation mixtures (Figure 3.26, closed red squares). This
result shows that the extra increase in ThT fluorescence intensity is due to the binding of the dye to
the LUVs, i.e. the partition of the dye to the lipid vesicles is not strong enough to preclude its
binding to the lysozyme amyloid fibrils. This simple assay suggests that the presence of anionic
lipid membranes does not induce extensive amyloid-like fibril formation of lysozyme, which
contradicts other authors (Zhao et al., 2004) and reinforces the recommendation to always perform
the adequate control assays if ThT is used to follow the fibrillation kinetics of a protein.
Figure 3.26 - Competition binding assays of Thioflavin T and lysozyme/ mature lysozyme
amyloid fibrils and POPC LUVs containing 20 mol% of POPS.
Lysozyme (Lz, green triangles) or pre-formed lysozyme fibrils (Fibrils, red squares), ranging from 0
to 6 µM total protein concentration (on a monomer basis) were added (closed symbols) or not (open
symbols) to a fixed concentration of 0.86 mM POPC:POPS 80:20 LUVs. After 1 h of incubation, 9
µM of ThT was added to each sample and its fluorescence emission intensity was measured after a
further incubation period of 30 min, with = 450 nm and = 470-600 nm.
Page 119
4. Concluding remarks
Page 121
99
Despite the many processes that assist protein folding in a cellular environment, misfolding
can still arise, if by some reason a specific peptide or protein fails to adopt or maintain its native
functional conformational state (Hebda and Miranker, 2009). There is a variety of human diseases
associated with alterations in the normal and native structure and function of proteins. In some
cases, misfolding can lead to a toxic gain-of-function as a conversion of specific peptides or
proteins to highly organized fibrillar aggregates, normally referred to as amyloid fibrils, can occur
(Chiti and Dobson, 2006). In the past few years more attention has been focused on the
intermediates that precede the formation of amyloid fibrils than on the fibrils themselves, since they
have been implicated as the source of toxicity associated with amyloidosis. Moreover, these
intermediates appear to interact with biological membranes, promoting the disruption of the
membrane integrity, and causing an imbalance in the cell homeostasis, which activates apoptotic
signals that lead to cell death (Quist et al., 2005; Kinnunen, 2009; Hebda and Miranker, 2009).
In 2004, Kinnunen and his collaborators proposed that negatively-charged liposomes can
trigger the formation of amyloid-like assemblies by non-amyloidogenic proteins under essentially
physiological conditions (Zhao et al., 2004). Later on, further results endorsed this observation
(Zhao et al., 2005; Alakoskela et al., 2006; Gorbenko et al., 2007; Mahalka and Kinnunen, 2009;
Gorbenko and Trusova, 2011) but no undisputable structural evidence has been presented yet in the
literature to support this proposal. An important ongoing research line at the host laboratory is
aimed at elucidating the factors that govern the formation of these protein-membrane
supramolecular complexes first described by Kinnunen´s group by using HEWL as a model non-
amyloidogenic protein. By understanding the fibril formation pathways of model proteins and the
intermediates involved upon their interaction with lipid membranes, a major step forward in the
comprehension of amyloid fibril formation would be taken and the information would certainly help
unravel the pathways of disease-causing proteins.
Lysozyme has been previously covalently conjugated to A488 SE to carry out fluorescence-
based measurements at the host laboratory. First, FCS was used to study the partition behavior of
Lz-A488 towards POPC LUVs containing variable mol% of POPS, confirming that lysozyme
binding to negatively charged liposomes is dominantly driven by electrostatic interactions (Melo et
al., 2011). Secondly, the variation of Lz-A488 fluorescence properties as a function of total lipid
concentration allowed identifying three consecutive stages in lysozyme interaction with acidic lipid
vesicles. It was also shown that the critical parameter controlling the emissive properties of Lz-
A488 was the surface coverage of the anionic liposomes by the conjugated protein (Melo et al.,
2012). To clarify the photophysical mechanism underlying these fluorescence changes and to
confirm that they were indeed reporting conformational transitions undergone by lysozyme, the
Page 122
100
work developed in this thesis started by monitoring the thermal denaturation profiles of Lz-A488 at
both pH 2.2 and 7.4 using fluorescence spectroscopy (both steady-state and time-resolved
fluorescence measurements were made). The neutral pH 7.4 was investigated since it is the pH most
used in protein-lipid interaction studies (Zhao et al., 2004; Gorbenko et al., 2007), which we wanted
to further explore; the acidic pH 2.2 was studied because it is often employed in lysozyme
fibrillation assays (Mishra et al., 2007; Meratan et al., 2011). The fluorescence properties of Lz-
A488 were first characterized at room temperature at both pH values because A488 is reported to be
a pH-insensitive dye from pH 4-10 (Haugland, 2005) but pH 2.2 is out of this range. A 5-nm red-
shift was detected in the emission spectra of both the free dye and Lz-A488 at pH 2.2 as compared
to 7.4 (Table 3.1), pointing out that the ionization state of the fluorophore must have changed in the
more acidic buffer. On the other hand, the time-resolved fluorescence anisotropy decays indicated
that the protein is properly folded in both conditions since the global rotational correlation time
obtained for Lz-A488 were very similar at both pHs ( = 5.6 ns (Table 3.3)). Furthermore, the
covalently-bound dye was found to experience a restricted range of internal angular fluctuations
during its excite-sate fluorescence lifetime, with an angle of = 19.1º and 21.5º in buffer pH 2.2
and 7.4, respectively.
The next step of this work was to evaluate the ability of the covalently-conjugated
fluorophore A488 to report conformational changes undergone by Lz-A488 under known
destabilizing conditions. The fluorescence emission of Lz-A488 underwent a temperature-
dependent quenching process at both pH values that enabled tracking its thermally-induced
unfolding. In fact, the melting temperatures, Tm, determined for Lz-A488 at pH 2.2 and 7.4 from
these studies were 55 ºC and 73.5 ºC, respectively, very close to data from the literature obtained
using different biophysical techniques (Figure 4.1) (Arnaudov and Vries, 2005; Lee et al., 2006;
Trexler and Nilsson, 2007). These results confirm that the covalent modification of the enzyme with
A488 did not perturb its tertiary structure appreciably and suggest that the predominant labeling site
of A488 in the enzyme experiences the early unfolding events of its tertiary structure in order to be
able to report a Tm so close to the published values.
Lz-A488 was proposed to be sensitive to a PET-based quenching mechanism (Figure 3.7),
by electron donor(s) present in several possible adjacent amino acid residues close to the dye
attached to the protein. Particular good candidates for temperature-dependent quenchers of A488
fluorescence in Lz-A488 are residues W62 and W63 located on the long loop in lysozyme’s
domain as temperature-induced lysozyme unfolding is described to begin in this region. Both these
residues are close to K97 residue in the native protein (Figure 1.6) which is expected to be the
Page 123
101
preferential labeling site of lysozyme (vide infra). After being able to maintain its structure almost
intact until T ~ 64 ºC at neutral pH, lysozyme unfolding progresses by loosing β-sheet structures in
the β-domain, along with a small part of the helical structure of α-domain, and then a generally loss
of tertiary structure, with increasing temperatures (Meersman et al., 2010). The partial unfolding of
lysozyme upon heating the solution must allow the establishment of van der Waals contacts
between A488 and residues W62 and W63 (tryptophan residues were found to be strong quenchers
of A488 by other authors (Choi et al., 2011)). Due to its disulfide bonds, lysozyme does not unfold
completely. There are two disulfide bonds near the long loop (Figure 1.6), one of them links the α-
helix C that includes K97 and the cysteine in position 64, which is just close to the tryptophan
residues assumed to be responsible for the quenching mechanism. Therefore, even when lysozyme
is fairly unfolded, K97 and W62 and W63 residues are expected to remain close enough to each
other for the PET-quenching mechanism to persist. This quenching is expected to produce increased
populations of Lz-A488 molecules that present a much shorter excited-state lifetime or that even are
non-fluorescent, as it was observed (Figure 3.6 D).
Figure 4.1 – pH dependence of the thermal midpoint for HEWL.
The midpoints represented (black circles) were determined using CD and fluorescence
spectroscopy. The experimental midpoints determined in this work are represented as red triangles.
Adapted from Trexler and Nilsson, 2007.
Page 124
102
The work then proceeded towards monitoring the evolution of Lz-A488 fluorescence
properties when subjected to known amyloid fibril formation conditions, namely acidic pH (pH
2.2), elevated temperature (T= 57 ºC) and high protein concentration (0.2 or 1.0 mM total
concentration of lysozyme) under quiescent conditions. Several mixing ratios of Lz-A488/ total
lysozyme were investigated in this work: for [Lz]t= 0.2 mM, 1/2 and 1/8 ratios were studied, and
with [Lz]t= 1.0 mM, 1/40, 1/100 and 1/200 ratios were investigated. Control assays with 0.2 and 1.0
mM unlabeled lysozyme were also carried out under the same fibrillation conditions by employing
the amyloid-specific dyes ThT and NR to follow amyloid fibril formation. The main consequences
of decreasing by 5-fold the concentration of lysozyme used in these assays was the extension of
lysozyme fibrillation lag phase by 1 – 2 days (from 4 to 6 days (Figure 3.16)) and the production of
a lower amount of lysozyme fibrils at the end of the fibrillation reactions (Table 3.7).
The fluorescence anisotropy of NR proved to be a very sensitive parameter to detect the
presence of lysozyme fibrils in solution, given the fact that time-resolved anisotropy measurements
confirmed that this dye does not bind or binds poorly to the intermediates formed during the lag
phase of lysozyme fibrillation kinetics (Figure 3.16). These results suggest that these intermediates
do not display nonpolar binding pockets that are able to accommodate this hydrophobic dye. A
moderate binding affinity of NR to mature lysozyme fibrils at pH 2.2 was also determined by fitting
an associative model to the time-resolved anisotropy data obtained for this dye (Kd= (2.0 ± 0.4) M
(Figure 3.15)).
CFM confirmed that Lz-A488 was able to form mixed fibrils with the corresponding
unlabeled protein for all Lz-A488/lysozyme mixing ratios tested. The aggregation of lysozyme
mixtures 1/40, 1/100 and 1/200 exhibited essentially the same assembly kinetics as unlabeled
lysozyme (Figure 3.19 A and B and data not shown). The steady-state fluorescence anisotropy of
Lz-A488 proved to be a particularly informative parameter because it could be used to discriminate
the different stages of lysozyme fibrillation kinetics for the samples 1/8, 1/40, 1/100 and 1/200: lag,
growth and plateau phases, respectively (Figure 3.22 B). The beginning and duration of the
different stages correlated well with the ones presented by the unlabeled lysozyme and that were
detected using the standard ThT probe (Figure 3.19 B and D).
Altogether these results strongly suggest that lysozyme is indeed preferentially
fluorescently-labeled at residue K97 and not K33 as only the first amino acid residue is present on
the lysozyme fragments that are incorporated into the mature fibrils. In fact, the fibrillation
mechanism of lysozyme under experimental conditions similar to the ones used in this work is
extensively characterized in the literature. In 2004, Frare and co-workers showed that HEWL fibrils
Page 125
103
obtained from the incubation of a 1.0 mM solution of protein at pH 2.0 and 65 ºC for 10 days were
composed of protein fragments encompassing residues 49–100/101 and 53–100/101, derived from
the partial acid-mediated cleavage of Asp-containing peptide bonds (Frare et al., 2004). To gain
further insights into the aggregation properties of HEWL, the authors produced lysozyme fragments
by limited proteolysis and found that only fragment 57–107 readily formed amyloid fibrils under
the solution conditions used. This is likely to represent a key region responsible for triggering the
aggregation process of the entire protein (Frare et al., 2004) and correlates well with the previously
described fragment 32–108 that was found to be highly amyloidogenic in human lysozyme (Frare et
al., 2006). Later in 2007, a study of HEWL fibril formation at pH 1.6 and 65 ºC reached similar
conclusions, as the intact full-length protein was never found to dominate the composition of the
amyloid fibrils. The authors mention that mature amyloid fibrils are composed mainly by the
fragments 49/53-101; the non-amyloidogenic parts of the nicked protein (1-48/102-129) are cleaved
from the fibrils. By adding mature amyloid fibrils during the amyloid formation process, the rate of
formation was accelerated efficiently, while adding the full-length lysozyme at the end of the lag
phase slowed the rate of the growth phase (Mishra et al., 2007).
The labeled/unlabeled protein mixing ratio was found to affect the structural properties of
the mature fibrils (Figure 3.22). The sample heterogeneity at the end of the kinetics was evaluated
by performing time-resolved fluorescence anisotropy measurements. For the low Lz-
A488/lysozyme mixing ratios studied (mixtures 1/40, 1/100 and 1/200), the dominant fluorescent
species present in solution by the end of the incubation time (14 days) were large mature mixed
lysozyme fibrils easily pelleted by centrifugation. A large amount of fluorescent soluble material
was still present in the mixture 1/8 at its 14th
day of incubation, as can be concluded by comparing
the different anisotropy decays of day14 and the material pelleted by centrifugation (Figure 3.24 B).
This result is probably explained by the lower fibrillation yield obtained when 0.2 mM lysozyme
was used. Fluorescence anisotropy decays also showed the occurrence of significant energy
migration (homotransfer) between Lz-A488 molecules incorporated in the mixed mature fibrils
formed for Lz-A488/lysozyme mixing ratio 1/2.
On the other hand, the fluorescence intensity decays obtained for Lz-A488 incorporated in
the mixed mature fibrils indicate that Lz-A488 must be rigidly locked in a partially-unfolded and
quenched conformation in the fibril structures produced at the end of the incubation time
(presenting a characteristically long lifetime component of 3= 3.8 ns (Figure 3.20 C)). Although an
extensive characterization of the morphology of the fibrils was not performed in this study, it is
clear that the packing of the fluorescently-labeled protein in mature fibrils isolated from the highest
Lz-A488/lysozyme mixing ratio (1/2) must be somehow different from the rest of the mixing ratios,
Page 126
104
due to its much shorter amplitude-weighted mean fluorescence lifetime (Table 3.8). This result
confirms the plasticity of the lysozyme fibrils formed, suggesting that different arrangements in the
position and orientation of Lz-A488 within the fibrils are possible, depending on the conditions
used in their growth.
The ability of ThT spectroscopic properties to detect amyloid-like fibrils in the presence of
anionic lipid membranes was also addressed at the end of this work. The cationic dye ThT was
confirmed to partition to POPS-containing LUVs through predominantly electrostatic interactions
(Figure 3.25). There was a pronounced increase in the fluorescence intensity of the dye upon
increasing the lipid concentration, even in the absence of any protein added to the solution. This
result reinforces the recommendation that adequate control assays should always be performed
when ThT is used to follow the fibrillation kinetics of a protein in the presence of negatively-
charged liposomes. On the other hand, the competition binding assays of ThT and lysozyme/ mature
lysozyme amyloid fibrils and POPC LUVs containing 20mol% of POPS (Figure 3.26) showed that
the presence of anionic lipid membranes does not induce extensive amyloid-like fibril formation of
lysozyme, at variance with was previously proposed by Kinnunen´s group (Zhao et al., 2004). The
present study clarifies that the changes undergone by the fluorescence properties of Lz-A488 upon
its interaction with POPC LUVs containing variable mol% of POPS (Melo et al., 2012) must be
reporting alterations in the conformation/ oligomerization state of the protein upon varying the
surface coverage of the lipid vesicles, but without progressing into the formation of amyloid-like
assemblies with ThT-binding properties. Additional studies are necessary to evaluate if this
conclusion can be generalized to other non-amyloidogenic peptides/proteins in interaction with
anionic liposomes.
With a similar characterization for other model proteins, this fluorophore can be one more
tool to help clarify the mechanisms associated with amyloid fibril formation, including the
intermediates involved, thanks to its photophysical qualities, including the stability at different pHs
and the capacity to report modification in its vicinity.
Page 127
105
References
Aisenbrey C, Borowik T, Byström R, Bokvist M, Lindström F, Misiak H, Sani M, Gröbner G (2008) How is
protein aggregation in amyloidogenic diseases modulated by biological membranes? Eur. Biophys. J. 37:
247-255.
Alakoskela J, Jutila A, Simonsen AC, Pirneskoski J, Pyhäjoki S, Turunen R, Marttila S, Mouritsen OG,
Goormaghtigh E, Kinnunen PKJ (2006) Characteristics of fibers formed by cytochrome c and induced by
anionic phospholipids. Biochemistry 45: 13447-13453.
Anand U, Jash C, Mukherjee S (2011) Protein unfolding and subsequent refolding: a spectroscopic
investigation. Phys. Chem. Chem. Phys. 13: 20418-20426.
Arnaudov LN, Vries R (2005) Thermally induced aggregation of hen egg white lysozyme. Biophys. J. 88:
515-526.
Aso Y, Shiraki K, Takagi M (2007) Systematic analysis of aggregates from 38 kinds of non disease-related
proteins: identifying the intrinsic propensity of polypeptides to form amyloid fibrils. Biosci. Biotechnol.
Biochem. 71(5): 1313-1321.
Babu KR, Bhakuni V (1997) Ionic-strength-dependent transition of hen egg-white lyszozyme at low pH to a
compact state and its aggregation on thermal denaturation. Eur. J. Biochem. 245: 781-789.
Bader AN, Hoetzl S, Hofman EG, Voortman J, van Bergen en Henegouwen PMP, van Meer G, Gerritsen HC
(2001) Homo-FRET imaging as a tool to quantify protein and lipid clustering. ChemPhysChem. 12: 475-483.
Banks PR, Paquette DM (1995) Comparison of three common amine reactive fluorescent probes used for
conjugation to biomolecules by capillary zone electrophoresis. Bioconjugate Chem.6: 447-458.
Bartlett AI, Radford SE (2009) An expanding arsenal of experimental methods yields an explosion of
insights into protein folding mechanisms. Nat. Struct. Mol. Biol.16(6): 582-588.
Biancalana M, Koide S (2010) Molecular mechanism of Thioflavin-T binding to amyloid fibrils. Biochim.
Biophys. Acta 1804: 1405-1412.
Bokvist M, Lindstrom F, Watts A, Grobner G (2004) Two types of Alzheimer’s β-amyloid (1–40) peptide
membrane interactions: aggregation preventing transmembrane anchoring versus accelerated surface fibril
formation. J. Mol. Biol. 335: 1039–1049.
Bolognesi B, Kumita JR, Barros TP, Esbjorner EK, Luheshi LM, Crowther DC, Wilson MR, Dobson CM,
Favrin G, Yerbury JJ (2010) ANS binding reveals common features of cytotoxic amyloid species. ACS
Chemical Biology 5(8): 735-740.
Booth DR, Sunde M, Belloti V, Robinson CV, Hutchinson WL, Fraser PE, Hawkins PN, Dobson CM,
Radford SE, Blake CCF, Pepys MB (1998) Instability, unfolding and aggregation of human lysozyme
variants underlying amyloid fibrillogenesis. Nature 385: 787-793.
Brinkley M (1992) A brief survey of methods for preparing protein conjugates with dyes, haptens, and cross-
linking reagents. Bioconjugate Chem. 3: 2-13.
Buell AK, Dhulesia A, Mossuto MF, Cremades N, Kumita JR, Dumoulin M, Welland ME, Knowles TPJ,
Salvatella X, Dobson CM (2011) Population of nonnative states of lysozyme variants drives amyloid fibril
formation. J. Am. Chem. Soc. 133: 7737-7743.
Page 128
106
Butterfield SM, Lashuel HA (2010) Amyloidogenic protein-membrane interactions: mechanistic insight from
model systems. Angew. Chem. Int. Ed. 49: 5628-5654.
Cao A, Hu D, Lai L (2004) Formation of amyloid fibrils from fully reduced hen egg white lysozyme. Protein
Sci. 13: 319-324.
Celej MS, Jares-Erijman EA, Jovin TM (2008) Fluorescent N-arylaminonaphthalene sulfonate probes for
amyloid aggregation of α-synuclein. Biophys. J. 94: 4867-4879.
Chen H, Ahsan SS, Santiago-Berrios MB, Abrunã HD, Webb WW (2010) Mechanisms of quenching of
Alexa fluorophores by natural amino acids. J. Am. Chem. Soc. 132: 7244-7245.
Chen H, Rhoades E, Butler JS, Loh SN, Webb WW (2007) Dynamics of equilibrium structural fluctuations
of apomyoglobin measured by fluorescence correlation spectroscopy. Proc. Natl. Acad. Sci. USA 104(25):
10459–10464.
Chirita CN, Necula M, Kuret J (2003) Anionic micelles and vesicles induce tau fibrillization in vitro. J. Biol.
Chem. 278: 25644–25650.
Chiti F, Dobson CM (2006) Protein misfolding, functional amyloid, and human disease. Annu. Rev.
Biochem. 75: 333-66.
Choi J, Kim S, Tachikawa T, Fujitsuka M, Majima T (2011) Unfolding dynamics of cytochrome c revealed
by single-molecule and ensemble-averaged spectroscopy. Phys. Chem. Chem. Phys. 13: 5651-5658.
Czeslik C, Royer C, Hazlett T, Mantulin W (2003) Reorientational dynamics of enzymes adsorbed on quartz:
a temperature-dependent time-resolved TIRF anisotropy study. Biophys. J. 84: 2533-2541.
Dobson CM (1999) Protein misfolding, evolution and disease. Trends Biochem. Sci. 24: 329-332.
Doose S, Neuweiler H, Sauer M (2009) Fluorescence quenching by photoinduced electron transfer: a
reporter for conformational dynamics of macromolecules. ChemPhysChem. 10: 1389-1398.
Dumoulin M, Canet D, Last AM, Pardon E, Archer DB, Muyldermans S, Wyns L, Matagne A, Robinson
CV, Redfield C, Dobson CM (2005) Reduced global cooperativity is a common feature underlying the
amyloidogenicity of pathogenic lysozyme mutations. J. Mol. Biol. 346: 773-788.
Dumoulin M, Kumita JR, Dobson CM (2006) Normal and aberrant biological self-assembly: insights from
studies of human lysozyme and its amyloidogenic variants. Acc. Chem. Res. 39: 603-610.
Foderá V, Groenning M, Vetri V, Librizzi F, Spagnolo S, Cornett C, Olsen L, van de Weert M, Leone M
(2008) Thioflavin T Hydroxylation at basis pH and its effect on amyloid fibril detection. J. Phys. Chem. B
112: 15174-15181.
Frare E, Laureto PP, Zurdo J, Dobson CM, Fontana A (2004) A highly amyloidogenic region of hen
lysozyme. J. Mol. Biol. 340: 1153-1165.
Frare E, Mossuto MF, Laureto PP, Dumoulin M, Dobson CM, Fontana A (2006) Identification of the core
structure of lysozyme amyloid fibrils by proteolysis. J. Mol. Biol. 361: 551-561.
Gorbenko GP, Ioffe VM, Kinnunen PKJ (2007) Binding of lysozyme to phospholipid bilayers: evidence for
protein aggregation upon membrane association. Biophys. J. 93: 140-153.
Gorbenko GP, Kinnunen PKJ (2006) The role of lipid-protein interactions in amyloid-type protein fibril
formation. Chem. Phys. Lipids 141: 72-82.
Page 129
107
Gorbenko GP, Trusova V (2011) Effects of oligomeric lysozyme on structural state of model membranes.
Biophys. Chem. 154: 73-81.
Greenspan P, Fowler SD (1985) Spectrofluorometric studies of the lipid probe, Nile Red. J. Lipid Res. 26:
781-789.
Groenning M (2010) Binding mode of Thioflavin T and other molecular probes in the context of amyloid
fibrils – current status. J. Chem. Biol. 3: 1-18.
Groot NS, Pallarés I, Avilés FX, Vendrell J, Ventura S (2005) Prediction of "hot spots" of aggregation in
disease-linked polypeptides. BMC Struct Biol 5: 18.
Haber E, Anfinsen CB (1962) Side-chain interactions governing the pairing of half-cystine residues in
ribonuclease. J. Biol. Chem. 237: 1839–44.
Hammer ND, Wang X, McGufiie BA, Chapman MR (2008) Amyloids: Friend or Foe? J. Alzheimers Dis.
13(4): 407-419.
Haugland RP (2005) The Handbook. A Guide to Fluorescent Probes and Labeling Technologies, 10th
ed,
Eugene, OR.
Hawe A, Sutter M, Jiskoot W (2008) Extrinsic fluorescent dyes as tools for protein characterization. Pharm.
Res. 25(7): 1487-1499.
Hebda JA, Miranker AD (2009) The interplay of catalysis and toxicity by amyloid intermediates on lipid
bilayers: insights from type II diabetes. Annu. Rev. Biophys. 38: 125-52.
Hill SE, Miti T, Richmond T, Muschol M (2011) Spatial extent of charge repulsion regulates assembly
pathways for lysozyme amyloid fibrils. PLoS ONE 6(4): e18171.
Hill SE, Robinson J, Matthews G, Muschol M (2009) Amyloid protofibrils of lysozyme nucleate and grow
via oligomer fusion. Biophys. J. 96: 3781-3790.
Holley M, Eginton C, Schaefer D, Brown LR (2008) Characterization of amyloidogenesis of hen egg
lysozyme in concentrated ethanol solution. Biochem. Biophys. Res. Co. 373: 164-168.
Imoto T, Forster LS, Rupley JA, Tanaka F (1972) Fluorescence of lysozyme: emissions from tryptophan
residues 62 and 108 and energy migration. Proc. Natl. Acad. Sci. USA 69(5): 1151-1155.
Kazlauskaite J, Sanghera N, Sylvester I, Venien-Bryan C, Pinheiro TJT (2003) Structural changes of the
prion protein in lipid membranes leading to aggregation and fibrillization. Biochemistry 42: 3295–3304.
Kinnunen PKJ (2009) Amyloid Formation on Lipid Membrane Surfaces. Open Biol. 2: 163-175.
Kinosita K, Kawato S, Ikegami A (1977) A theory of fluorescence polarization decay in membranes.
Biophys. J. 20: 289-305.
Knight JD, Hebda JA, Miranker AD (2006) Conserved and cooperative assembly of membrane-bound r-
helical states of islet amyloid polypeptide. Biochemistry 45: 9496-9508.
Knight JD, Miranker AD (2004) Phospholipid catalysis of diabetic amyloid assembly. J. Mol. Biol. 341:
1175-1187.
Page 130
108
Krebs MRH, Wilkins DK, Chung EW, Pitkeathly MC, Chamberlain AK, Zurdo J, Robinson CV, Dobson
CM (2000) Formation and seeding of amyloid fibrils from wild-type hen lysozyme and a peptide fragment
from the β-domain. J. Mol. Biol. 300: 541-549.
Kumar S, Singh AK, Krishnamoorthy G, Swaminathan R (2008) Thioflavin T displays enhanced
fluorescence selectively inside anionic micelles and mammalian cells. J. Fluoresc. 18: 1199–1205.
Kyle RA (2001) Amyloidosis: a convoluted story. Brit. J. Haematol. 114: 529-538.
Lakowicz JR (2006) Principles of Fluorescence Spectroscopy, 3rd
ed. Springer, New York.
Lashuel HA, Lansbury PT Jr. (2006) Are amyloid diseases caused by protein aggregates that mimic bacterial
pore-forming toxins? Q. Rev. Biophys. 39: 167–201.
Layton CJ, Hellinga HW (2010) Thermodynamic analysis of ligand-induced changes in protein thermal
unfolding applied to high-throughput determination of ligand affinities with extrinsic fluorescent dyes.
Biochemistry 49: 10831-10841.
Lee RC, Despa F, Guo L, Betala P, Kuo A, Thiyagarajan P (2006) Surfactant copolymers prevent
aggregation of heat denatured lysozyme. Ann. Biomed. Eng. 34(7): 1190-1200.
Lindgren M, Hammarström P (2010) Amyloid oligomers: spectroscopic characterization of amyloidogenic
protein states. FEBS J. 277: 1380-1388.
Lindgren M, Sörgjerd K, Hammarström P (2005) Detection and Characterization of aggregates, prefibrillar
amyloidogenic oligomers, and protofibrils using fluorescence spectroscopy. Biophys. J. 88: 4200-4212.
Lo M, Aulabaugh A, Jin G, Cowling R, Bard J, Malamas M, Ellestad G (2004) Evaluation of fluorescence-
based thermal shift assays for hit identification in drug discovery. Anal. Biochem. 332: 153–159.
Luk KC, Hyde EG, Trojanowski JQ, Lee VM.-Y (2007) Sensitive fluorescence polarization technique for
rapid screening of α-synuclein oligomerization/fibrillization inhibitors. Biochemistry 46: 12522-12529.
Machuqueiro M, Baptista AM (2008) Acidic range titration of HEWL using a constant-pH molecular
dynamics method. Proteins 72: 289-298.
Mahalka AK, Kinnunen PKJ (2009) Binding of amphipathic α-helical antimicrobial peptides to lipid
membranes: lessons from temporins B and L. Biochim. Biophys. Acta 1788: 1600-1609.
Matulis D, Kranz JK, Salemme FR, Todd MJ (2005) Thermodynamic stability of carbonic anhydrase;
measurements of binding affinity and stoichiometry using ThermoFluor. Biochemistry 44: 5258–5266.
Mayer LD, Hope MJ, Cullis PR (1986) Vesicles of variable sizes produced by a rapid extrusion procedure.
Biochim. Biophys. Acta 858: 161-168.
McClare CW (1971) An accurate and convenient organic phosphorus assay. Anal. Biochem. 39(2): 527-530.
Meersman F, Atilgan C, Miles AJ, Bader R, Shang W, Matagne A, Wallace BA, Koch MHJ (2010)
Consistent picture of the reversible thermal unfolding of hen egg-white lysozyme from experiment and
molecular dynamics. Biophys. J. 99: 2255-2263.
Melo AM, Prieto M, Coutinho A (2011) The effect of variable liposome brightness on quantifying lipid–
protein interactions using fluorescence correlation spectroscopy. Biochim. Biophys. Acta 1808: 2559-2568.
Page 131
109
Melo AM, Federov A, Prieto M, Coutinho A (2012) Exploring fluorescence lifetime and homo-FRET
measurements to monitor lysozyme oligomerization in anionic lipid membranes: relation to “amyloid-like”
fibril formation. Biophys. J. 102(3): 433a-434a.
Meratan AA, Ghasemi A, Nemat-Gorgani M (2011) Membrane integrity and amyloid cytotoxicity: a model
study involving mitochondria and lysozyme fibrillation products. J. Mol. Biol. 409: 826-838.
Mishra R, Sjölander D, Hammarström P (2011) Spectroscopic characterization of diverse amyloid fibrils in
vitro by the fluorescent dye Nile Red. Mol. BioSyst.7: 1232-1240.
Mishra R, Sörgjerd K, Nyström S, Nordigården A, Yu Y, Hammarström P (2007) Lysozyme
amyloidogenesis is accelerated by specific nicking and fragmentation but decelerated by intact protein
binding and conversion. J. Mol. Biol. 366: 1029-1044.
Morshedi D, Ebrahim-Habibi A, Moosavi-Movahedi AA, Nemat-Gorgani M (2010) Chemical modification
of lysine residues in lysozyme may dramatically influence its amyloid fibrillation. Biochim. Biophys. Acta
1804: 714-722.
Mukhopadhyay S, Nayak PK, Udgaonkar JB, Krishnamoorthy G (2006) Characterization of the formation of
amyloid protofibrils from barstar by mapping residue-specific fluorescence dynamics. J. Mol. Biol. 358: 935-
942.
Munishkina LA, Cooper EM, Uversky VN, Fink AL (2004) The effect of macromolecular crowding on
protein aggregation and amyloid fibril formation. J. Mol. Recognit. 17: 456-464.
Munishkina LA, Fink AL (2007) Fluorescence as a method to reveal structures and memebrane-interactions
of amyloidogenic proteins. Biochim. Biophys. Acta 1768: 1862-1885.
Nelson DL, Cox MM (2008) Lehninger Principles of Biochemistry 5th Ed. W.H.Freeman & Co Ltd.
Pace CN, Vajdos F, Fee L, Grimsley G, Gray T (1995) How to measure and predict the molar absorption-
coefficient of a protein. Protein Sci. 4: 2411–2423.
Pastor I, Ferrer ML, Lillo MP, Gómez J, Mateo CR (2007) Structure and dynamics of lysozyme encapsulated
in a silica Sol-Gel matrix. J. Phys. Chem. 111: 11603-11610.
Pepys MB, Hawkins PN, Booth DR, Vigushin DM, Tennent GA, Soutar AK, Totty N, Nguyen O, Blake CC,
Terry CJ, Feest TG, Zalin AM, Hsuan JJ (1993) Human lysozyme gene mutations cause hereditary systemic
amyloidosis. Nature 362: 553-557.
Nilsson KPR (2009) Small organic probes as amyloid specific ligands – Past and recent molecular scaffolds.
FEBS Lett. 583: 2593-2599.
Quist A, Doudevski I, Lin H, Azimova R, Ng D, Frangione B, Kagan B, Ghiso J, Lal R (2005) Amyloid ion
channels: A common structural link for protein-misfolding disease. Proc. Natl. Acad. Sci. USA 102(30):
10427–10432.
Rochet J, Lansbury Jr PT (2000) Amyloid fibrillogenesis: themes and variations. Curr. Opin. Struc. Biol. 10:
60-68.
Rusinova E, Tretyachenko-Ladokhina V, Vele OE, Senear DF, Ross JBA (2002) Alexa and Oregon Green
dyes as fluorescence anisotropy probes for measuring protein-protein and protein-nucleic acid interactions.
Anal. Biochem. 308: 18-25.
Page 132
110
Ryan TM, Howlett GJ, Bailey MF (2008) Fluorescence detection of a lipid-induced tetrameric intermediate
in amyloid fibril formation by apolipoprotein C-II. J. Biol. Chem. 283(20): 35118-35128.
Sackett DL, Wolff J. (1987) Nile Red as a polarity-sensitive fluorescent probe of hydrophobic protein
surfaces. Anal. Biochem. 167(2): 228-34.
Santos NC, Prieto M, Castanho MARB (2003) Quantifying molecular partition into model systems of
biomembranes: an emphasis on optical spectroscopic methods. Biochim. Biophys. Acta 1612: 123-135.
Schnaible V, Przybylski M (1999) Identification of fluorescein-5’-isothiocyanate-modification sites in
proteins by electrospray-ionization mass spectrometry. Bioconjugate Chem.10: 861-866.
Senisterra G, Finerty PJ (2009) High throughput methods of assessing protein stability and aggregation. Mol.
BioSyst. 5: 217–223.
Shcharbin D, Szwedzka M, Bryszewska M (2007) Does fluorescence of ANS reflect its binding to PAMAM
dendrimer? Bioorg. Chem. 35: 170–174.
Sipe JD, Benson MD, Buxbaum JN, Ikeda S, Merlini G, Saraiva MJM, Westermark P (2010) Amyloid fibril
protein nomenclature: 2010 recommendations from the nomenclature committee of the International Society
of Amyloidosis. Amyloid 17(3–4): 101–104.
Smith LJ, Mark AE, Dobson CM, van Gunsteren WF (1998) Molecular dynamics simulations of peptide
fragments from hen lysozyme: insight into non-native protein conformations. J. Mol. Biol. 280: 703-719.
Sohl JL, Jaswal SS, Agard DA (1998) Unfolded conformations of alpha-lytic protease are more stable than
its native state. Nature 395: 817–819.
Sparr E, Engel MFM, Sakharov DV, Sprong M, Jacobs J, Kruijff B, Hoppener JWM, Killian JA (2004) Islet
amyloid polypeptide-induced membrane leakage involves uptake of lipids by forming amyloid fibers. FEBS
Lett. 577: 117-120.
Steinberg TH, Jones LJ, Haugland RP, Singer VL (1996) SYPRO Orange and SYPRO Red protein gel
stains: one-step fluorescent staining of denaturing gels for detection of nanogram levels of protein. Anal.
Biochem. 239: 223-237.
Stsiapura VI, Maskevich AA, Kuzmitsky VA, Uversky VN, Kuznetsova IM, Turoverov KK (2008)
Thioflavin T as a molecular rotor: fluorescent properties of thioflavin t in solvents with different viscosity. J.
Phys. Chem. B 112: 15893-15902.
Suckau D, Mak M, Przybylski M (1992) Protein surface topology-probing by selective chemical
modification and mass spectrometric peptide mapping. Proc. Natl. Acad. Sci. USA 89: 5630-5634.
Sun Q, Lu R, Yu A (2011) Structural heterogeneity in the collision complex between organic dyes and
tryptophan in aqueous solution. J. Phys. Chem. B 116: 660-666.
Sutter M, Oliveira S, Sanders NN, Lucas B, Hoek A, Hink MA, Visser AJWG, De Smedt SC, Hennink WE,
Jiskoot W (2007) Sensitive spectroscopic detection of large and denatured protein aggregates in solution by
use of the fluorescent dye Nile Red. J. Fluoresc. 17: 181-192.
Tajalli H, Gilani AG, Zakerhamidi MS, Tajalli P (2008) The photophysical properties of Nile Red and Nile
Blue in ordered anisotropic media. Dyes Pigments 78: 15-24.
Page 133
111
Teske CA, Simon R, Niebisch A, Hubbuch J (2007) Changes in retention behavior of fluorescently labeled
proteins during ion-exchange chromatography caused by different protein surface labeling positions.
Biotechnol. Bioeng. 98: 193-200.
Thirunavukkuarasu S, Jares-Erijman EA, Jovin TM (2008) Multiparametric fluorescence detection of early
stages in the amyloid protein aggregation of pyrene-labeled α-synuclein. J. Mol. Biol. 378: 1064-1073.
Trexler AJ, Nilsson MR (2007) The formation of amyloid fibrils from proteins in the lysozyme family. Curr.
Protein Pept. Sci. 8: 537-557.
Uversky VN, Fink AL (2004) Conformational constrains for amyloid fibrillation: the importance of being
unfolded. Biochim. Biophys. Acta 1698: 131-153.
van Ham TJ, Esposito A, Kumita JR, Hsu SD, Schierle GSK, Kaminski CF, Dobson CM, Nollen EAA,
Bertoncini CW (2010) Towards multiparametric fluorescent imaging of amyloid formation: studies of a YFP
model of α-synuclein aggregation. J. Mol. Biol. 395: 627-642.
Wang SS, Liu K, Lu Y (2009) Amyloid fibrillation of hen egg-white lysozyme is inhibited by TCEP.
Biochem. Biophys. Res. Co. 381: 639-642.
Westermark P, Benson MD, Buxbaum JN, Cohen AS, Frangione B, Ikeda S, Masters CL, Merlini G, Saraiva
MJM, Sipe JD (2007) A primer of amyloid nomenclature. Amyloid 14(3): 179–183.
Winklhofer KF, Tatzelt J, Haass C (2008) The two faces of protein misfolding: gain- and loss-of-function in
neurodegenerative diseases. EMBO J. 27: 336-349.
Yip CM, Elton EA, Darabie AA, Morrison MR, McLaurin J (2001) Cholesterol, a modulator of membrane-
associated Aβ-fibrillogenesis and neurotoxicity. J. Mol. Biol. 311: 723–734.
Yonezawa Y, Tanaka S, Kubota T, Wakabayashi K, Yutani K, Fujiwara S (2002) An Insight into the
pathway of the amyloid fibril formation of hen egg white lysozyme obtained from a small-angle X-ray and
neutron scattering study. J. Mol. Biol. 323: 237-251.
Zhao H, Jutila A, Nurminen T, Wickstrom SA, Keski-Oja J, Kinnunen PKJ (2005) Binding of endostatin to
phosphatidylserine-containing membranes and formation of amyloid-like fibers. Biochemistry 44: 2857–
2863.
Zhao H, Tuominen EKJ, Kinnunen PKJ (2004) Formation of amyloid fibers triggered by phosphatidylserine-
containing membranes. Biochemistry 43: 10302-10307.
Zhu M, Li J, Fink AL (2003) The association of α-synuclein with membranes affects bilayer structure,
stability and fibril formation. J. Biol. Chem. 278: 40186–44097.