Journal of Environmental Protection, 2016, 7, 784-792 Published Online May 2016 in SciRes. http://www.scirp.org/journal/jep http://dx.doi.org/10.4236/jep.2016.76071
How to cite this paper: Yadav, A., Sahu, Y.K., Rajhans, K.P., Sahu, P.K., Chakradhari, S., Sahu, B.L., Ramteke, S. and Patel, K.S. (2016) Fluoride Contamination of Groundwater and Skeleton Fluorosis in Central India. Journal of Environmental Pro-tection, 7, 784-792. http://dx.doi.org/10.4236/jep.2016.76071
Fluoride Contamination of Groundwater and Skeleton Fluorosis in Central India Ankit Yadav, Yaman Kumar Sahu, Keshaw Prakash Rajhans, Pravin Kumar Sahu, Suryakant Chakradhari, Bharat Lal Sahu, Shobhana Ramteke, Khageshwar Singh Patel* School of Studies in Chemistry/Environmental Science, Pt. Ravishankar Shukla University, Raipur, India
Received 1 February 2016; accepted 8 May 2016; published 11 May 2016
Abstract In country like India, the groundwater is widely used for drinking purposes. In central India, the groundwater is hard and contaminated with F− and other elements above the permissible limits and found to be linked with prevalence of the fluorosis diseases. In this work, the groundwater quality Balod district, Chhattisgarh, India is investigated for assessment of water quality for drinking purposes. The concentration (n = 50) of F− was ranged from 1.5 - 14.0 mg/L with mean value of 3.9 ± 0.8 mg/L. The causes of prevalence of skeleton fluorosis in human of the studied area are described.
Keywords Ground Water Quality, Fluoride, Skeleton Fluorosis
1. Introduction Ground water is an important resource for drinking agriculture purposes. Groundwater uses and applications are often related to its composition, which is increasingly influenced by human activities. In fact the water quality of groundwater was affected by many factors including precipitation, surface runoff, groundwater flow, and the characteristics of the catchment area. The over extraction of groundwater caused huge weathering of the meta-morphic rocks. In several regions of the country, the groundwater was contaminated with F− beyond permissible limit of 1.5 mg/L with linking of fluorosis diseases in human [1]-[15]. The Balod district, Chhattisgarh, India is a rice producing area, taking multiple crops by using the water resources. The water is hard with contamination of F−, Cl− and Fe at hazardous levels. In this work, the groundwater quality of Balod district (area ≈ 4000 km2) is described.
2. Materials and Methods 2.1. Study Area The Balod district included five blocks: Balod, Gurur, Gunderdehi, Dondi Lohara and Dondi. The area of the district is ≈4000 km2 with population of 1.3 million. The materials i.e. buildings, metals, pipes, etc. are corroded due to acidic nature of water. The residents of the studied area were suffering with the fluorosis diseases due to mineralization of F−. In present investigation, the Balod district of Chhattisgarh state, central India has been se-lected for groundwater quality studies to assess the contaminants.
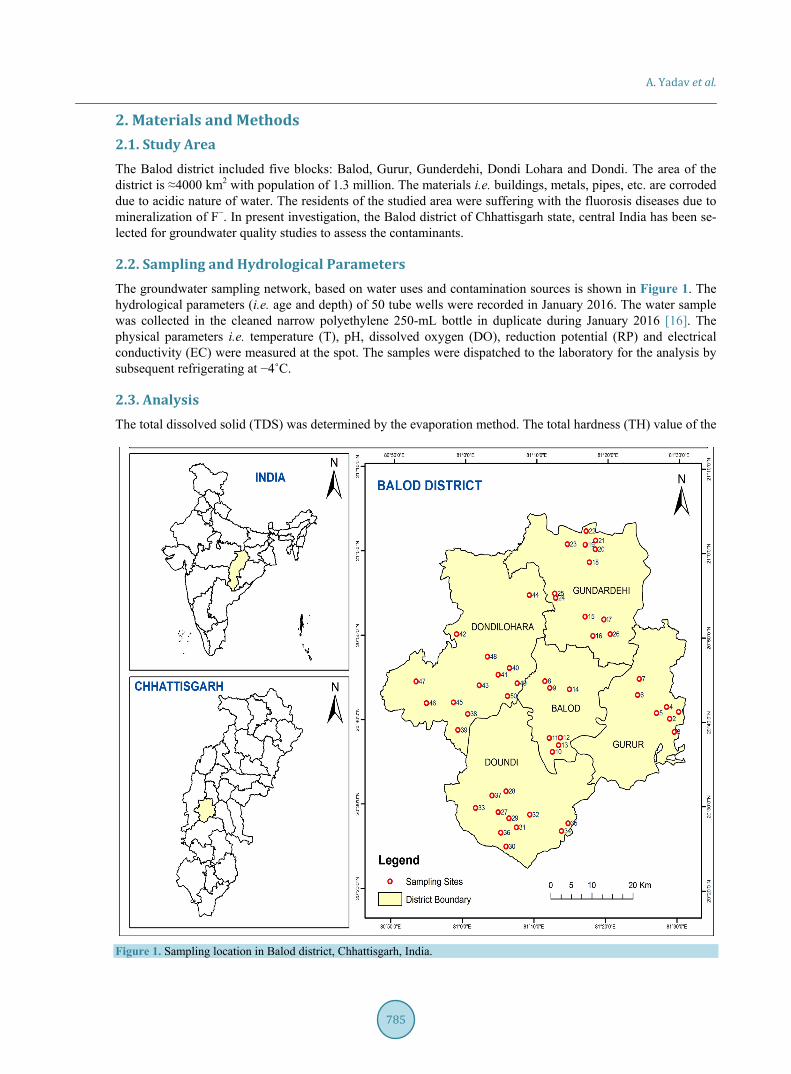
2.2. Sampling and Hydrological Parameters The groundwater sampling network, based on water uses and contamination sources is shown in Figure 1. The hydrological parameters (i.e. age and depth) of 50 tube wells were recorded in January 2016. The water sample was collected in the cleaned narrow polyethylene 250-mL bottle in duplicate during January 2016 [16]. The physical parameters i.e. temperature (T), pH, dissolved oxygen (DO), reduction potential (RP) and electrical conductivity (EC) were measured at the spot. The samples were dispatched to the laboratory for the analysis by subsequent refrigerating at −4˚C.
2.3. Analysis The total dissolved solid (TDS) was determined by the evaporation method. The total hardness (TH) value of the
Figure 1. Sampling location in Balod district, Chhattisgarh, India.
A. Yadav et al.
786
water was analyzed by the titration method [17]. The F− content of the water was monitored by the Metrohm ion meter-781 using the CDTA buffer in a 1:1 volume ratio. The content of other ions were measured by the Dionex ion chromatography-1100 equipped with appropriate anion and cation exchange columns and conductivity de-tector. The Fe content was analyzed by using the GBC flame AAS. The sources of the contaminants in the water were apportioned by the statistical analysis.
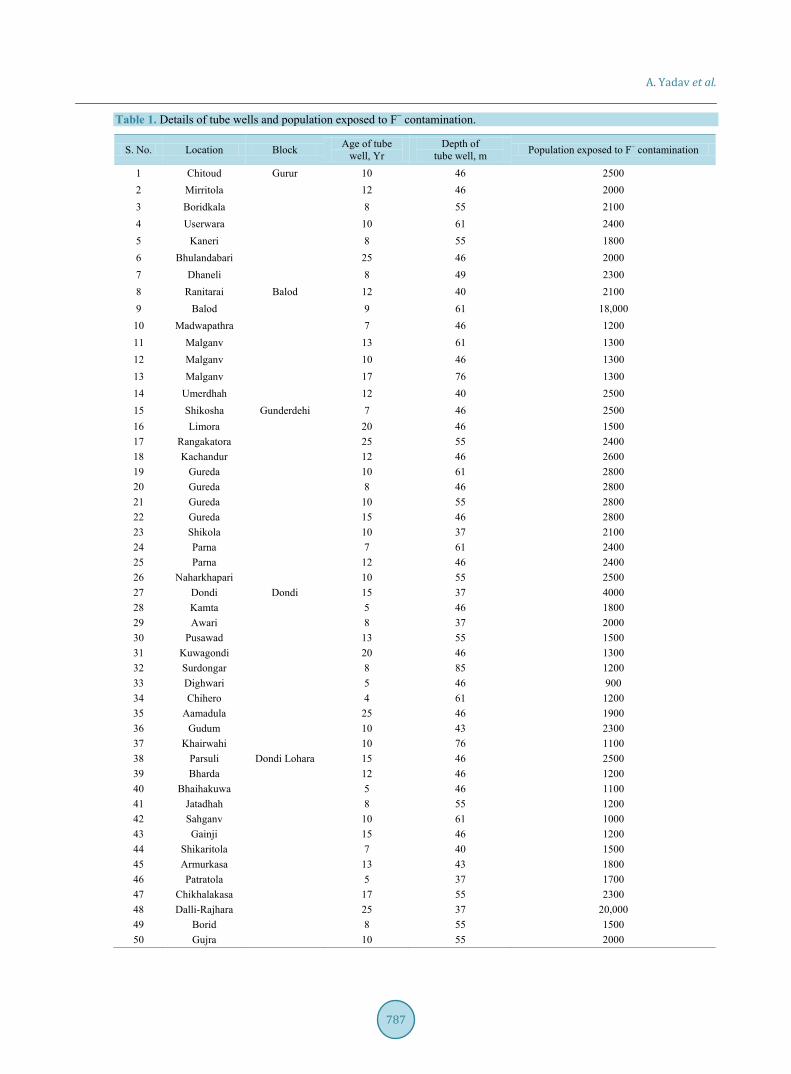
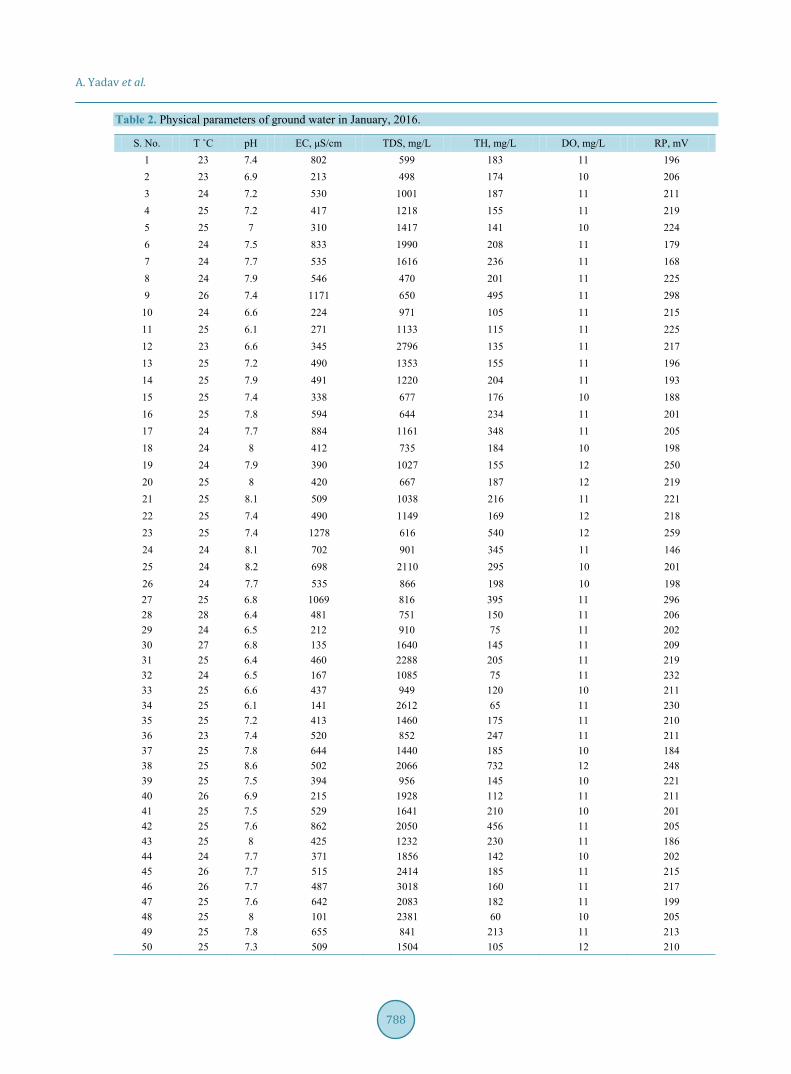
3. Results and Discussion 3.1. Physical Characteristics of Tube Well and Water The physical parameters (i.e. age and depth of tube wells) and habitant population were recorded with the help of public health engineering department, and data are presented in Table 1. The total population residing in the studied is ≈130000. The age and depth of tube wells were ranged from 4 - 25 Yr and 37 - 85 m with mean value of 11.6 ± 1.5 Yr and 50 ± 3 m, respectively. The most of tube wells of the studied area are young with shallow depth. The higher population density is observed in the Balod town. The value of T, pH, DO, RP, EC, TDS and TH of the water (n = 50) was ranged from 23˚C - 28˚C, 6.1 - 8.6, 10 - 12 mg/L, 146 - 298 mV, 101 - 1278 μS/cm, 470 - 3018 mg/L and 60 - 732 mg/L with mean value of 25.0˚C ± 0.3˚C, 7.4 ± 0.2, 10.9 ± 0.2 mg/L, 212 ± 7 mV, 506 ± 70 μS/cm, 1345 ± 180 mg/L and 210 ± 35 mg/L, respectively.
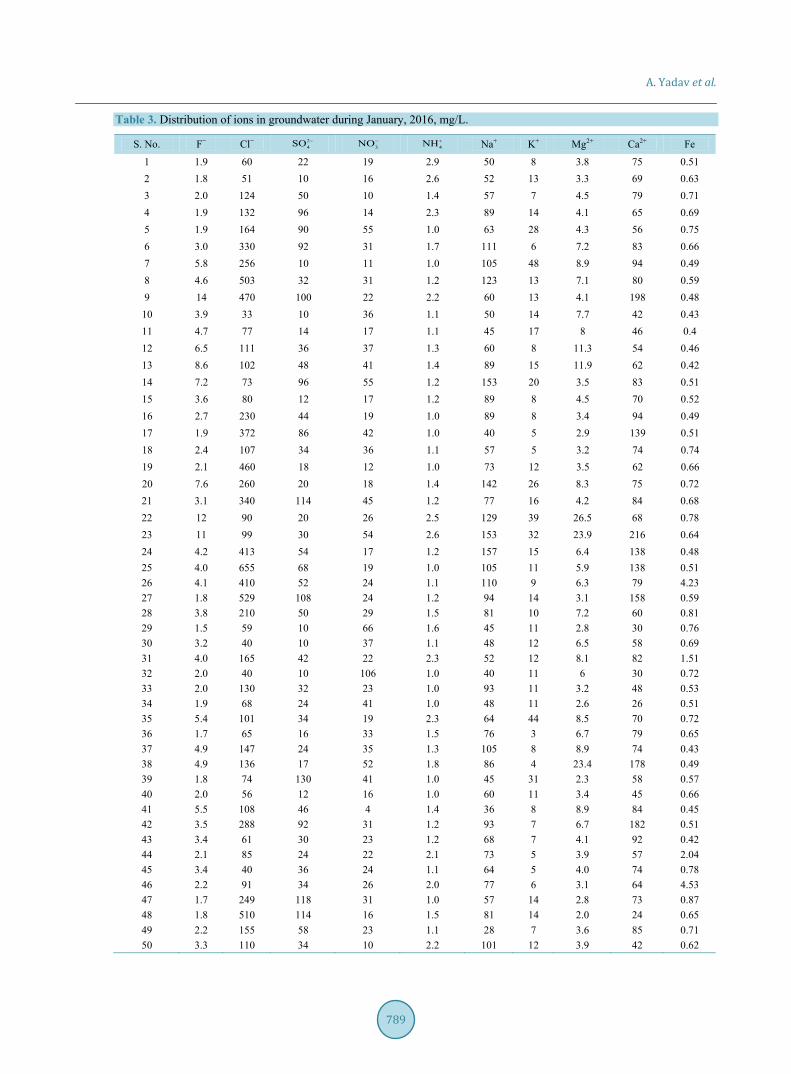
3.2. Chemical Characteristics of Water The chemical characteristics of the groundwater are presented in Table 2 and Table 3. The concentration of F−, Cl−, 3NO− , 2
4SO − , 4NH+ , Na+, K+, Mg2+, Ca2+ and Fe was ranged from 1.5 - 14.0, 33 - 655, 4.0 - 106, 10 - 130, 1.0 - 2.9, 28 - 157, 3.0 - 48, 2.0 - 26.5, 24 - 216 and 0.4 - 4.5 mg/L with mean value of 3.9 ± 0.8, 190 ± 44, 30 ± 5, 47 ± 10, 1.5 ± 0.1, 79 ± 9, 14 ± 3, 6.5 ± 1.4, 82 ± 12 and 0.8 ± 0.2 mg/L, respectively. The ion concentration in the water was found to occur in following increasing order: Fe < 4NH+ < F− < Mg2+ < K+ < 3NO− < 2
4SO − < Ca2+< Cl−. The F− content in the water of the studied area was found to be higher than reported in other parts of the country [1]-[15].
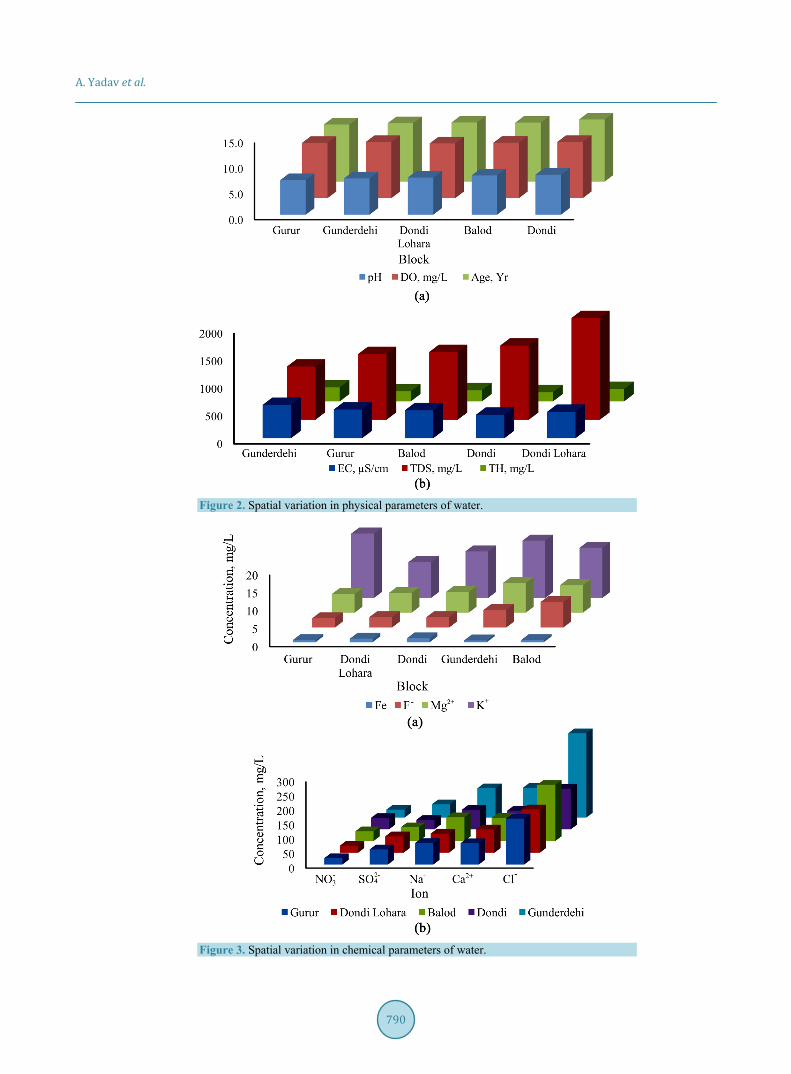
3.3. Spatial Variation in Water Quality The spatial variation in physiochemical parameters of the water is shown in Figure 2 and Figure 3. The water was found to be acidic in the Gurur block. The remarkably high content of F−, Cl−, Na+, Mg2+ and Ca2+ was marked in the water of Gunderdehi block. However, the water of two blocks i.e. Dondi and Dondi Lohara be-comes reddish when exposed to the air due to hydrolysis of the Fe(III) into oxides and hydroxides.
3.4. Sources of Contaminants in Water The correlation matrix of elements in the water of Gunderdehi block is summarized in Table 4. The content of F− ions had good correlation with the 4NH+ , Na+, K+ and Mg2+ ions, indicating existence of F− in the geo media as Barberiite, bararite, ferruccite, sellatite, cryolite, hieratite, etc. Other ions i.e. Cl−, 2
4SO − , Na+, K+, Mg2+ and Ca2+ were partially correlated, showing origin from multiple sources i.e. geogenic, mining, agricul-ture, etc.
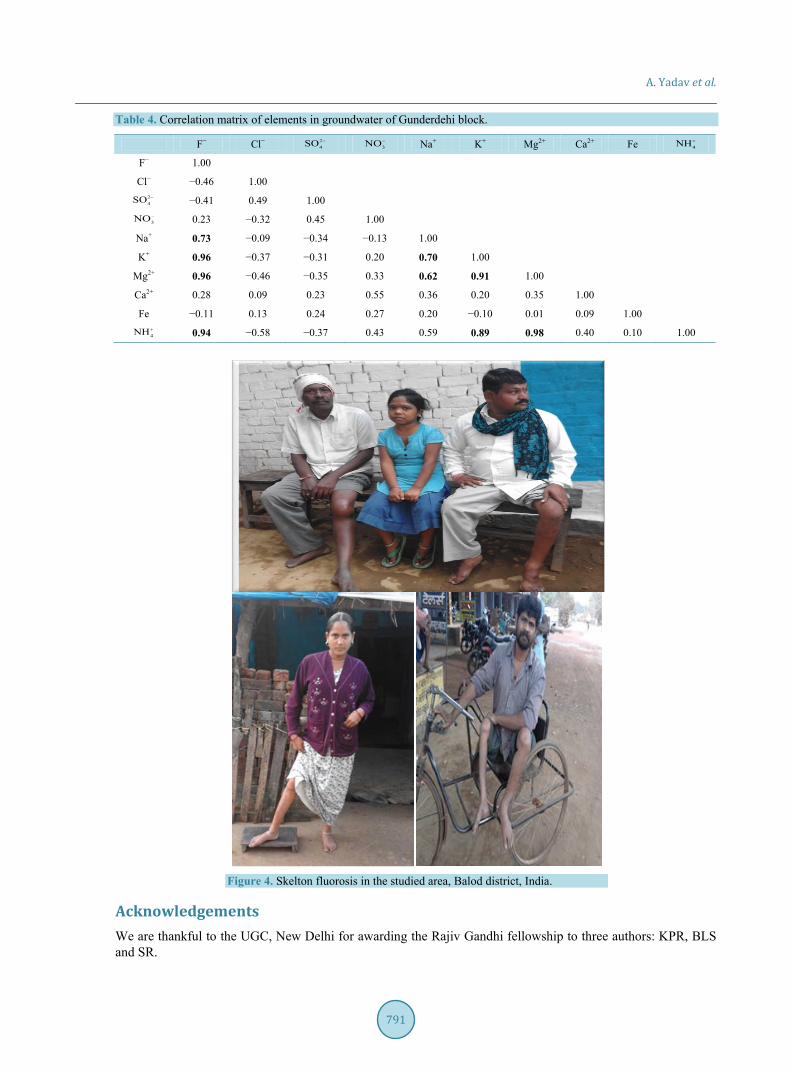
3.5. Toxicities Three elements i.e. F−, Fe and Ca2+ were found in all locations above permissible limit of 1.5, 0.3 and 75 mg/L, respectively [18] [19]. In Gunderdehi block, Cl− was found at hazardous levels, >250 mg/L, may be due to mi-neralization. The skeletal fluorosis (i.e. hyperostosis, osteopetrosis and osteoporosis) was observed due to long term ingestion of F−contaminated water by the residents of the studied area, Figure 4.
4. Conclusion The groundwater of the Balod district, Chhattisgarh, central India was found to be contaminated with Fe, F−, Cl− and Ca2+ above permissible limits, which rendering water not suitable for the drinking purposes. The higher prevalence rate of fluorosis diseases was observed in the Gunderdehi and Balod blocks.
A. Yadav et al.
787
Table 1. Details of tube wells and population exposed to F− contamination.
S. No. Location Block Age of tube well, Yr
Depth of tube well, m Population exposed to F− contamination
Figure 4. Skelton fluorosis in the studied area, Balod district, India.
Acknowledgements We are thankful to the UGC, New Delhi for awarding the Rajiv Gandhi fellowship to three authors: KPR, BLS and SR.
A. Yadav et al.
792
References [1] Salve, P.R., Maurya, A., Kumbhare, P.S., Ramteke, D.S. and Wate, S.R. (2008) Assessment of Groundwater Quality
with Respect to Fluoride. Bulletin of Environmental Contamination and Toxicology, 81, 289-293. http://dx.doi.org/10.1007/s00128-008-9466-x
[2] Vikas, C. (2009) Occurrence and Distribution of Fluoride in Groundwater of Central Rajasthan, India. Journal of En-vironmental Science and Engineering, 51, 169-174.
[3] Kundu, M.C. and Mandal, B. (2009) Assessment of Potential Hazards of Fluoride Contamination in Drinking Groundwater of an Intensively Cultivated District in West Bengal, India. Environmental Monitoring and Assessment, 152, 97-103. http://dx.doi.org/10.1007/s10661-008-0299-1
[4] Rao, N.S. (2009) Fluoride in Groundwater, Varaha River Basin, Visakhapatnam District, Andhra Pradesh, India. Envi-ronmental Monitoring and Assessment, 152, 47-60. http://dx.doi.org/10.1007/s10661-008-0295-5
[5] Viswanathan, G., Jaswanth, A., Gopalakrishnan, S., Siva Ilango, S. and Aditya, G. (2009) Determining the Optimal Fluoride Concentration in Drinking Water for Fluoride Endemic Regions in South India. Science of Total Environment, 407, 5298-5307. http://dx.doi.org/10.1016/j.scitotenv.2009.06.028
[6] Karthikeyan, K., Nanthakumar, K., Velmurugan, P., Tamilarasi, S. and Lakshmanaperumalsamy, P. (2010) Prevalence of Certain Inorganic Constituents in Groundwater Samples of Erode District, Tamilnadu, India, with Special Emphasis on Fluoride, Fluorosis and its Remedial Measures. Environmental Monitoring and Assessment, 160, 141-155. http://dx.doi.org/10.1007/s10661-008-0664-0
[7] Avishek, K., Pathak, G., Nathawat, M.S., Jha, U. and Kumari, N. (2011) Water Quality Assessment of Majhiaon Block of Garwa District in Jharkhand with Special Focus on Fluoride Analysis. Environmental Monitoring and Assessment, 167, 617-623 http://dx.doi.org/10.1007/s10661-009-1077-4
[8] Pandey, J. and Pandey, U. (2011) Fluoride Contamination and Fluorosis in Rural Community in the Vicinity of a Phosphate Fertilizer Factory in India. Bulletin of Environmental Contamination and Toxicology, 87, 245-249. http://dx.doi.org/10.1007/s00128-011-0344-6
[9] Brindha, K., Rajesh, R., Murugan, R. and Elango, L. (2011) Fluoride Contamination in Groundwater in Parts of Nal-gonda District, Andhra Pradesh, India. Environmental Monitoring and Assessment, 172, 481-492. http://dx.doi.org/10.1007/s10661-010-1348-0
[10] Jagtap, S., Yenkie, M.K., Labhsetwar, N. and Rayalu, S. (2012) Fluoride in Drinking Water and Defluoridation of Wa-ter. Chemical Review, 112, 2454-2466. http://dx.doi.org/10.1021/cr2002855
[11] Arif, M., Hussain, I., Hussain, J., Sharma, S. and Kumar, S. (2012) Fluoride in the Drinking Water of Nagaur Tehsil of Nagaur District, Rajasthan, India. Bulletin of Environmental Contamination and Toxicology, 88, 870-875. http://dx.doi.org/10.1007/s00128-012-0572-4
[12] Hussain, I., Arif, M. and Hussain, J. (2012) Fluoride Contamination in Drinking Water in Rural Habitations of Central Rajasthan, India. Environmental Monitoring and Assessment, 184, 5151-5158. http://dx.doi.org/10.1007/s10661-011-2329-7
[13] Arlappa, N., Aatif Qureshi, I. and Srinivas, R. (2013) Fluorosis in India: An Overview. International Journal of Re-search and Development of Health, 1, 97-102.
[14] Datta, A.S., Chakrabortty, A., De Dalal, S.S. and Lahiri, S.C. (2014) Fluoride Contamination of Underground Water in west Bengal, India. Fluoride, 47, 241-248.
[15] Umarani, P. and Ramu, A. (2014) Fluoride Contamination Status of Groundwater in East Coastal Area in Tamilnadu, India. International Journal of Innovative Research in Science, Engineering and Technology, 3, 10045-10051.
[16] Nielson, D.M. and Nielson, G. (2006) The Essential Handbook of Groundwater Sampling. CRC Press, Boca Raton. http://dx.doi.org/10.1201/9781420042795
[17] Nollet, L.M.L. and De Gelder, L.S.P. (2007) Handbook of Water Analysis. 2nd Edition, CRC Press, Boca Raton. [18] WHO (2011) Guidelines for Drinking-Water Quality. 4th Edition, World Health Organization, Switzerland.
http://www.who.int/water_sanitation_health/publications/2011/dwq_chapters/en/ [19] BIS (2009) Drinking Water-Specification, Bureau of Indian Standards. New Delhi.