103
www.crccare.com Cooperative Research Centre for Contamination Assessment and Remediation of the Environment Flux-based groundwater assessment and management TECHNICAL REPORT NO. 37

www.crccare.com
Cooperative Research Centre for Contamination Assessment and Remediation of the Environment
Flux-based groundwater assessment and management
Technical RepoRT no. 37

Cooperative Research Centre for Contamination Assessment and Remediation of the Environment, Technical Report series, no. 37 November 2016 Copyright © CRC CARE Pty Ltd, 2016 This book is copyright. Except as permitted under the Australian Copyright Act 1968 (Commonwealth) and subsequent amendments, no part of this publication may be reproduced, stored or transmitted in any form or by any means, electronic or otherwise, without the specific written permission of the copyright owner. ISBN: 978-1-921431-51-7
Enquiries and additional copies: CRC CARE, C/- Newcastle University LPO, PO Box 18, Callaghan NSW, Australia 2308 Tel: +61 (0) 2 4985 4941 Fax: +61 (0) 8 8302 3124 [email protected] www.crccare.com
This report should be cited as: CRC CARE 2016, Flux-based groundwater assessment and management, CRC CARE Technical Report no. 37, CRC for Contamination Assessment and Remediation of the Environment, Adelaide, Australia.
Disclaimer: This publication is provided for the purpose of disseminating information relating to scientific and technical matters. Participating organisations of CRC CARE do not accept liability for any loss and/or damage, including financial loss, resulting from the reliance upon any information, advice or recommendations contained in this publication. The contents of this publication should not necessarily be taken to represent the views of the participating organisations.

CRC for Contamination Assessment and Remediation of the Environment
Technical Report no. 37
Flux-based groundwater assessment and management
November 2016

CRC CARE Technical Report no. 37 i
Flux-based groundwater assessment and management
Acknowledgements
Project Advisory Group members:
NAME ORGANISATION NOTE
Dennis Monahan Chair
Andrew King BP Australia Flux Oversight Group
Andrew Pruszinski Environment Protection Authority SA
Andrew Miller Department of Environment Regulation WA
Anne Northway EPA Victoria Flux Oversight Group
Brian Priestly Monash University
Colin Roberts Caltex
Craig Barnes Airservices Australia
Damien Davidson Caltex
Damien Home VIVA Energy
Daniel Walters Environment Protection Authority ACT
Dave Thomas Chevron Flux Oversight Group
David Hartog Department of Defence
Erwin Benker Environment Protection Authority NSW
Holly Ainslie Department of Infrastructure and Regional Development
Jack Ng University of Queensland
James Higinbotham Exxon Mobil
Janet Macmillan Department of Environment Regulation WA Flux Oversight Group
John Howell WA Health
John Mikac Exxon Mobil
Paul Barrett Australian Institute of Petroleum
Peter Gniel Australian Institute of Petroleum
Rebecca Hughes Environment Protection Authority SA
Rod Lukatelich BP Australia Flux Oversight Group
Sarah Brown Department of Defence
Stacey Hannon Department of Defence
Stuart Rhodes Rio Tinto
Tanya Astbury VIVA Energy
Terry Soutberg Air Services Australia
Tony Bradshaw EHP Queensland
CRC CARE also acknowledges the contribution made by:
additional members of the Flux Oversight Group, Greg Davis (CSIRO), Bruce Kennedy (CRC CARE) and Ravi Naidu (CRC CARE)
Joytishna Jit of the Future Industries Institute, University of South Australia, towards the management, coordination and compilation of this work, and
CH2M towards the compilation of this report.

CRC CARE Technical Report no. 37 ii
Flux-based groundwater assessment and management
Executive summary
In line with international progress, there has been an increasing acceptance in recent
years by contaminated sites practitioners in Australia of the usefulness of mass flux
concepts for the management of groundwater contamination. However, there is no
nationally consistent guidance or methodology on how mass flux or mass discharge
estimates may be used to assess and manage groundwater contamination, or the
endpoints that should apply. CRC CARE has therefore commissioned this user guide
for the better measurement and use of mass flux and mass discharge in the
management of groundwater contamination.
The purpose of this guidance is therefore to illustrate how flux concepts, tools and
measurements can be used to assess and manage groundwater contamination,
including engaging with regulators and other stakeholders.
The assessment and management of groundwater contamination has traditionally been
driven by contaminant concentrations, however concentration data alone are
sometimes not sufficient to fully understand the behaviour or impact of a plume over
time. Mass flux and mass discharge concepts can help fill the gap in understanding,
and have been applied successfully both in Australia and internationally to:
Enhance the conceptual site model (CSM)
Complement concentration criteria
Assist with remedy selection
Optimise remedial design
Assess remedial performance
Demonstrate risk reduction, and
Evaluate compliance/long term monitoring.
In general, current Australian regulations emphasise a pragmatic, risk-based approach
to the management of groundwater contamination. Mass flux-based techniques are a
valuable tool in supporting this approach, provided the data are robust and well-
presented, in consultation with the regulator.
Five key methods have been identified to derive mass flux and mass discharge
estimates for dissolved phase contaminants, namely:
Transect methods
Passive flux meters
Well capture/pump test methods
Transects based on isocontours, and
Solute transport models.
As with other site investigation approaches, it is necessary to determine the acceptable
level of uncertainty for the intended application of the mass flux and/or discharge
information and how that level of uncertainty can be achieved, managed and assessed.
Mass flux and mass discharge approaches can be incorporated into site assessment
and management through the development of site-specific metrics, i.e. for groundwater
extracted for beneficial uses or groundwater discharging into a surface water body. The

CRC CARE Technical Report no. 37 iii
Flux-based groundwater assessment and management
guideline emphasises that mass flux and mass discharge estimates will typically be
used to complement concentration-based assessments, rather than to replace them.
Mass flux and mass discharge estimates are therefore important tools which may help
practitioners and regulators characterise, remediate and manage groundwater
contamination. Consideration of these concepts when characterising a site, as well as
during remedial design and optimisation, may ultimately result in a more detailed risk-
based approach, along with more time- and cost-efficient groundwater remediation
programs.

CRC CARE Technical Report no. 37 iv
Flux-based groundwater assessment and management
Table of contents
Executive summary ii
1. Introduction 1
1.1 Purpose and objectives 1
1.2 Would mass flux concepts be helpful at my site? 2
1.3 Background 2
1.4 Australian context 4
1.5 Users of the guidance 5
1.6 Structure, content and use of the guideline 5
2. Flux explained 7
2.1 What is flux? 7
2.1.1 Groundwater flux 7
2.1.2 Mass flux 7
2.1.3 Mass discharge 8
2.2 Basic concepts of mass flux 9
2.2.1 Factors that affect mass flux 9
2.2.2 Plume structure and evolution 10
2.2.3 Secondary sources 11
3. Applying mass flux in managing groundwater contamination 13
3.1 Site and scenarios 13
3.1.1 Contaminants of concern 13
3.1.2 Achieving regulatory compliance 14
3.1.3 Site access and budget 14
3.2 Using mass flux to enhance the conceptual site model (CSM) 15
3.3 Complement concentration based criteria with mass flux 18
3.4 Using mass flux to assist with remedy selection 20
3.5 Using mass flux to optimise remedial design 22
3.6 Using mass flux to assess remedial performance 24
3.7 Using flux to demonstrate risk reduction 27
3.8 Evaluating compliance or long term monitoring 28
4. Flux within a regulatory context 30
4.1 The National Environment Protection (Assessment of Site Contamination)
Measure 30
4.2 National Water Quality Management Strategy 32

CRC CARE Technical Report no. 37 v
Flux-based groundwater assessment and management
4.2.1 Australian and New Zealand Guidelines for Fresh and Marine
Water Quality 2000 32
4.2.2 Guidelines for Groundwater Protection in Australia, 2013 33
4.2.3 Australian Drinking Water Guidelines, 2011 34
4.3 State and territory groundwater policies and guidance 34
5. How to measure mass flux and mass discharge 35
5.1 Data required 35
5.2 Data collection methods 36
5.3 Uncertainty 37
6. Deriving mass flux and mass discharge metrics to manage groundwater
contamination 39
6.1 Developing mass flux and mass discharge metrics for groundwater
extracted for beneficial uses 39
6.2 Developing mass flux and mass discharge metrics when groundwater is
discharging into a receiving surface water body 40
6.3 Impact on sensitive receptors 47
6.3.1 Risk to human health 47
6.3.2 Risk to ecosystems 47
6.3.3 Risk to other values 48
7. Effective presentation of mass flux data 49
7.1 Visualising mass discharge distribution along a transect 49
7.2 Heat maps 49
7.3 Visualising before-and-after data 49
7.4 3D models 51
8. Bibliography 52
9. Glossary 57

CRC CARE Technical Report no. 37 vi
Flux-based groundwater assessment and management
Appendices
Appendix A. Methodologies to measure mass flux and/or discharge 65
Appendix B. Measuring water and contaminant mass flux in fractured and
karst formations
82
Appendix C. Case study 1 – Remediation of a brominated DNAPL plume 84
Appendix D. Case study 2 – Mine tailings ponds leakage 89
Tables
Table 1. Practical uses of mass flux and mass discharge to enhance
the CSM
14
Table 2. Practical uses of mass flux and mass discharge to
complement concentration based criteria
19
Table 3. Applications of mass flux in remedy selection, including
examples
20
Table 4. Applications of mass flux concepts in optimising remedial
design, including examples
23
Table 5. The use of mass flux and/or mass discharge estimates to
assess remedial performance
25
Table 6. Relative data density required for particular applications of
mass flux data
36
Figures
Figure 1. Flow chart to help evaluate if mass flux concepts may be
helpful at a site
3
Figure 2. Overview of the process of applying mass flux to assess and
manage groundwater contamination, with references to the
relevant section within the text
6
Figure 3. Relationship between the concepts of mass flux (J) and mass
discharge (Md)
8
Figure 4. Illustration of the effect of K on mass flux, and how considering
only concentration data can be ambiguous
10
Figure 5. Using mass balance to assess whether a plume is expanding
or contracting
11
Figure 6. Movement of contaminants in expanding and contracting
plumes.
12
Figure 7. The impact of the source mass upon mass discharge 28
Figure 8. Mapping of the permeability field which impacts the source and
mass flux distributions
50
Figure 9. Presentation of the mass flux data pre- and post- remediation 50
Figure 10. Presentation of a reduction in TCE following 51

CRC CARE Technical Report no. 37 1
Flux-based groundwater assessment and management
1. Introduction
The assessment and management of groundwater contamination is traditionally driven
by contaminant concentrations; however concentration data alone are sometimes not
sufficient to fully understand the behaviour or impact of a plume over time.
Mass flux and mass discharge estimates are important tools to help practitioners and
regulators characterise and remediate groundwater contamination. Their inclusion
within remedial design and optimisation may ultimately result in more time- and cost-
efficient groundwater remediation programmes.
1.1 Purpose and objectives
In line with international progress, there has been an increasing acceptance in recent
years by contaminated sites practitioners in Australia of the usefulness of mass flux
concepts for the management of groundwater contamination. However, there is no
nationally consistent guidance or methodology on how mass flux or mass discharge
measures may be used to assess and manage groundwater contamination, or the
endpoints that should apply.
The purpose of this guidance is therefore to illustrate how flux concepts, tools and
measurements can be used to assess and manage groundwater contamination,
including engaging with regulators and other stakeholders.
While this guideline aims to provide the concepts, tools and techniques to measure and
use mass flux in groundwater contamination management, it is noted that early and
thorough engagement with the site stakeholders to form agreement on the use of mass
flux concepts may be just as important to overall success. To that end, this guideline
also provides practical steps on communicating results, along with information on mass
flux within the Australian regulatory context for the assessment and remediation of
contaminated land.
As such, the objectives of this guide are to:
Define the terms of mass flux and mass discharge and provide a background to
these concepts and how they can be measured in the field
Provide an overview of the potential applications of mass flux in groundwater
contamination management in Australia as well as sites and scenarios where
mass flux is most likely to be useful
Provide a complementary means of demonstrating contaminated groundwater
management, advancement of the conceptual site model (CSM) or the
effectiveness of remediation with a view to site closure
Encourage practitioners to consider mass flux and mass discharge estimates,
where relevant, and apply these concepts appropriately in the management of
groundwater contamination, and
Increase the understanding of the use of mass flux measurements in groundwater
contamination management, and hence make regulatory acceptance of remedial
objectives specifically related to mass flux and/or discharge more common.

CRC CARE Technical Report no. 37 2
Flux-based groundwater assessment and management
It should be noted that this user guide is specifically focused on mass flux in
groundwater. While the technical and mathematical concepts of flux can be applied to
other media (such as soil and vapour) this guideline explicitly excludes consideration of
these media, except where it aids the understanding of using mass flux in the
assessment and management of groundwater contamination.
1.2 Would mass flux concepts be helpful at my site?
Mass flux and mass discharge estimates have numerous applications associated with
the investigation and remediation of contaminated groundwater.
Mass flux and mass discharge estimates have a range of potential uses, and are likely
to be useful at most sites, depending on site-specific characteristics and the objectives
of the project. The following flow chart outlines the decisions and process which should
be followed to evaluate if mass flux is an appropriate tool for a particular site (figure 1).
Further detail regarding when and where mass flux concepts are best utilised is
provided in section 3.1.
1.3 Background
Contaminated land and groundwater investigation within Australia is guided by the
National Environment Protection Council, National Environment Protection
(Assessment of Site Contamination) Measure (ASC NEPM). This was first published in
1999 and was amended in 2013. As there is no national framework for the remediation
of contaminated sites in Australia, CRC CARE is in the process of developing a
national remediation framework (NRF), as stipulated in the agreement between the
Commonwealth Government and CRC CARE. In developing the framework,
CRC CARE is keen to focus on developing harmonised guidance on the practicalities
of cleaning up contaminated sites, for use by contaminated land practitioners,
regulators and site owners.
In formulating the terms of reference for the NRF, CRC CARE solicited input on
appropriate content from stakeholders in contaminated sites investigation and
management. As part of this input it was identified that a document outlining the
measurement and use of mass flux for groundwater contamination management would
be beneficial, particularly considering the successes in utilisation of these techniques
within international jurisdictions, and considering the use of mass flux measurements
as a critical tool and line of evidence is discussed in several of the existing CRC CARE
Technical Reports.

CRC CARE Technical Report no. 37 3
Flux-based groundwater assessment and management
Figure 1 Flow chart to help evaluate if mass flux concepts may be helpful at a site.

CRC CARE Technical Report no. 37 4
Flux-based groundwater assessment and management
In order to inform its internal processes, CRC CARE completed an initial review of
available technical information on the subject (Flux-based Criteria for Management of
Groundwater, CRC CARE 2014). This document reviewed existing international
guidance, journal articles, tools and industry practice relating to the application of mass
flux for the management of groundwater contamination. It also documented two
examples of mass flux being utilised effectively in the management of contaminated
sites in Australia and concluded that mass flux in Australia is currently being applied as
a measure for both compliance and for site closure. It went on to note that existing
Australian contaminated land guidance typically does not reference the concept of
mass flux.
Following publication of that report, CRC CARE commissioned this project to provide
guidance for the use of flux-based assessment and management of groundwater
contamination.
1.4 Australian context
In general, existing Australian national and state groundwater contamination
management guidance does not include significant or specific mention of flux-based
management techniques. However, as discussed in section4 there is no guidance
which specifically precludes the use of mass flux-based techniques. Furthermore, there
is a general emphasis on a pragmatic, risk-based approach to management of
groundwater contamination.
With this in mind, where mass flux measurements can be robustly demonstrated as
being helpful in achieving the overall objectives for a site, regulators may be
approached to discuss the inclusion of these measurements and concepts to aid in
decision making. It is emphasised that technical veracity is crucial to gaining regulatory
approval. Therefore, key aims of this document are to outline the tools which can form
part of a robust and defensible approach and to provide guidance on the
sites/scenarios where a mass flux-based approach is most feasible.
It is emphasised that acceptance of mass flux-based tools and techniques in the
management of site contamination will depend on the technical basis of the proposed
techniques (discussed throughout this guideline), and how they are relevant to
achieving the overall objectives for a site. These objectives will vary, but are likely to
include a demonstration that remediation has been successful in reducing risks to
acceptable levels (a risk-based approach).
It should be noted that nothing in this guideline supersedes existing Australian
regulatory requirements, and familiarity with relevant state and territory legislation and
regulations is necessary before proceeding with environmental investigations or
remediation/management. Nevertheless, this guidance has been developed in the
context of existing Australian legislation and guidance; as such further discussion of the
national legislation and guidance pertinent to the use of flux-based decision-making in
Australia is presented in section 4.
Given the limited Australia-specific guidance available on mass flux concepts, during
compilation of this document it has been necessary to draw heavily on guidance and
journal articles originating in international jurisdictions. In doing this, careful

CRC CARE Technical Report no. 37 5
Flux-based groundwater assessment and management
consideration has been given to the application of the techniques and concepts in the
Australian context.
1.5 Users of the guidance
This user guide is primarily aimed at regulators and managers of sites where
groundwater contamination is of primary concern, along with the environmental
practitioners who assess and manage those sites.
It is anticipated that this guideline will aid in the use of mass flux or mass discharge
information, and aid the review or interpretation of the work of others. It is assumed that
the reader is familiar with site assessment procedures in accordance with the
ASC NEPM (as published), and will consult with guidelines included within the NRF.
This guideline and the methods presented are not intended to provide the sole or
primary source of information about a site. It is also assumed that sufficient site
characterisation data have been obtained to develop a robust CSM prior to the use of
mass flux and mass discharge estimates in groundwater management. The user must
also be aware of and work in accordance with applicable national and state
legislations.
1.6 Structure, content and use of the guideline
This user guide is arranged into nine sections and follows the steps which may be
followed when applying mass flux concepts. These steps can be considered when
selecting an approach that aligns with the overall objectives for a project/site. Please
refer to the flowchart on the following page, which is intended to guide the reader
through both the document and the process that may be followed when using mass flux
or mass discharge to assess and manage groundwater contamination at a site
(figure 2). Each step has been referenced to the section in the guideline where further
information can be sought. In addition, worked examples are provided throughout the
text in order to highlight important points or show a particular technique, and two Case
Studies are presented in Appendix C. Section 8 provides a reference list for those
documents used in the compilation of this user guide and section 9 is a glossary of the
specific terms, acronyms and formulae used within this guideline.

CRC CARE Technical Report no. 37 6
Flux-based groundwater assessment and management
Figure 2. Overview of the process of applying mass flux to assess and manage groundwater
contamination, with references to the relevant section within the text. It is noted that these steps are
part of an iterative process, and steps may need to be revisited as the CSM evolves.
CRC CARE Technical Report no. 37 7
Flux-based groundwater assessment and management
2. Flux explained
This section provides background information on the mathematics of flux, as well as an
introduction to when and how mass flux concepts can be useful in contaminated
groundwater assessment and management.
2.1 What is flux?
Flux is broadly defined as flow through a medium. Measurements of flux are made
across planes or surfaces that perpendicularly intersect the flow.
This guideline adopts the following definitions from ITRC 2010:
Groundwater flux is defined as “the velocity (speed and direction) of groundwater
through a defined cross-sectional area located perpendicular to the mean direction
of groundwater flow”
Mass flux is defined as “the mass of a chemical that passes through a defined
cross-sectional area located perpendicular to the mean direction of groundwater
flow over a period of time”, and
Mass discharge is defined as “the total mass of a contaminant moving in the
groundwater from a given source.”
Further detail on these definitions, and their application to contaminated groundwater
assessment and management is provided below.
2.1.1 Groundwater flux
Groundwater flux (q) can be calculated as the product of the saturated hydraulic
conductivity (hereafter referred to as K) and the hydraulic gradient (i):
q = K x i where
q = groundwater flux, volume/area/time (e.g. cubic metre (m3)/square metre
(m2)/day (d))
K = saturated hydraulic conductivity, distance/time (e.g. m/d), and
i = hydraulic gradient, dimensionless (e.g. m/m).
Groundwater flux is also referred to as Darcy velocity or Darcy flux in some literature,
however groundwater flux is used exclusively within this guideline.
2.1.2 Mass flux
The concept of mass flux (J) follows on from groundwater flux by incorporating the
concentration of the contaminant within the groundwater.
Mathematically, mass flux can be calculated as follows:
J = q × C where
J = mass flux, (e.g. milligrams (mg)/m2/d)
q = groundwater flux, volume/area/time (e.g. m3/m2/d or m/d), and
C = contaminant concentration, mass/volume (e.g. mg/m3 or µg/L).

CRC CARE Technical Report no. 37 8
Flux-based groundwater assessment and management
Mass flux is a vector quantity as it includes both the magnitude and direction of the
flow, and is expressed as mass/area/time (e.g. mg/m2/d). Mass flux is specific to a
defined area, which is usually small relative to the overall dimensions of the plume.
Mass flux will generally exhibit spatial variability, so several individual mass flux
measurements may be needed to capture this variability.
As the mass flux incorporates the contaminant, it is sometimes referred to (in other
literature) as the contaminant mass flux. This guideline refers to mass flux.
2.1.3 Mass discharge
The concept of mass discharge (Md) follows on from mass flux, as it is the sum
(integral) of the individual mass flux estimates across a transect multiplied by the
representative area:
Md = J1 A1+ J2 A2+ J3 A3+ … + Jn An
Mass discharge (Md) is a scalar entity and is expressed as mass/time (e.g. mg/d or
g/d).
The relationship between mass flux and mass discharge is depicted in figure 3, where
the sum of the mass flux (Jn) across the cross sectional areas (An) in a transect
comprises the total mass discharge (Md) across the transect.
Figure 3 Relationship between the concepts of mass flux (J) and mass discharge (Md) (Adapted from
ITRC 2010).
This transect is referred to as the control plane. While it should ideally be perpendicular
to the groundwater flow direction the placement in the horizontal plane is typically
based on the CSM and measurement objective. Examples of the locations of control
planes include a near source, a property boundary, an intersection with a surface water
body, or within the plume.
Mass flux may vary both spatially and temporally within the control plane, and this
variation may be significant. Spatial and temporal variations in mass flux are caused by
variations in both contaminant concentrations and groundwater flow magnitude and

CRC CARE Technical Report no. 37 9
Flux-based groundwater assessment and management
direction. As mass discharge is the product of the groundwater discharge and the
contaminant concentration, it can also be obtained directly (instead of through
calculations) through methods such as well capture and pumping tests. In these
instances, mass discharge can be divided by the cross-sectional area of the plume at
the control plane to determine the average mass flux (figure 3):
Jav = Md/A
In other literature, mass discharge may be referred to as contaminant mass discharge,
total mass flux or integrated mass flux, however mass discharge is used exclusively in
this guideline. Similarly, the term source zone contaminant mass discharge is used
specifically when the control plane is immediately down-gradient of the source, before
attenuation processes have had an effect.
2.2 Basic concepts of mass flux
The concepts behind mass flux and mass discharge are discussed further in the
following sections.
2.2.1 Factors that affect mass flux
At a location along a groundwater contaminant plume, the mass flux represents the
integrated effects of transport, storage and degradation along the flow path. By
definition, mass flux estimates are impacted by factors that affect groundwater flux,
such as the hydraulic conductivity (K) and the hydraulic gradient (i). Therefore
estimates of mass flux are affected by such things as:
changes in groundwater extraction rates
groundwater elevation changes, and
seasonal variations in velocity or flow directions (ITRC 2010).
Likewise by definition, mass flux estimates are affected by variations in contaminant
concentrations. Factors that may cause contaminant concentrations to vary include
redox changes due to the infiltration of rainwater and variations in dissolved phase
concentrations due to sorption and the precipitation/dissolution of contaminants.
Heterogeneity in the lithology can have significant impacts on mass flux and thus
should be understood prior to implementing a program to measure and use mass flux
Rather than being homogeneous across the full extent of an aquifer, groundwater flow
tends to be concentrated in zones of high K that often occupy a relatively small
proportion of the aquifer cross section. This heterogeneity results in a range of mass
fluxes across the aquifer at one site.
This concept is depicted in Figure 4 Although in this example the concentrations (C)
and hydraulic gradients (i) are the same across the three sand layers, the mass flux
through each lithology differs considerably due to variable K. As a result, the mass of
contaminant that would reach a down-gradient receptor varies significantly in each
layer, with the higher K of the gravelly sand resulting in a much greater mass flux.
Therefore, whilst the potential risk posed to down-gradient receptors would be
considered equal if only concentrations were compared, the use of mass flux illustrates
that a greater potential risk may be posed by more transmissive areas. As the various

CRC CARE Technical Report no. 37 10
Flux-based groundwater assessment and management
layers in this example are all sands, such a dissonance in source strength may not
have been anticipated if mass flux estimates had not been considered.
Figure 4 Illustration of the effect of K on mass flux, and how considering only concentration data
can be ambiguous. Note that 1 microgram (μg)/L = 1 mg/m3 (Adapted from ITRC 2010).
It should be noted that at real sites, the concentration and possibly the hydraulic
gradient) can also vary, and therefore the mass flux may span many orders of
magnitude.
2.2.2 Plume structure and evolution
In many circumstances mass flux and mass discharge can provide useful information in
addition to concentration data to help define the contamination plume structure and its
evolution over time. Typical monitoring focuses on delineating plume boundaries and
concentration trends. However both concentrations and groundwater flux can vary
greatly across a plume, and by focusing only on the plume boundaries, areas of
significant contaminant mass flux may be missed (ITRC 2010).
Using a mass balance assessment, mass discharge can be applied to determine
whether a groundwater contaminant plume is expanding or contracting. This mass
balance is a quantitative comparison of the source zone mass discharge to the plume
attenuation rate (ITRC 2008):
If the source mass discharge is estimated to exceed the attenuation rate, then the
plume is considered to be expanding, and
If the source mass discharge is estimated to be less than the attenuation rate, then
the plume is considered to be contracting.
The concept of mass balance, as well as various factors which contribute to source
mass discharge into a plume and attenuation of the plume, are illustrated in figure 5.

CRC CARE Technical Report no. 37 11
Flux-based groundwater assessment and management
Figure 5 Using mass balance to assess whether a plume is expanding or contracting (Adapted from
ITRC 2010).
Knowledge of mass flux and mass discharge can provide important information
regarding source concentration, natural attenuation rates, and areas of the subsurface
through which the majority of the mobile contaminant mass is moving (ITRC 2010).
This information can be very useful in the management of contaminated groundwater,
for example when assessing risks to down-gradient receptors, or estimating the
remediation timeframe.
2.2.3 Secondary sources
Mass discharge data can be used to assist in the understanding of plume age and the
interaction of the plume with the aquifer lithology. During plume expansion, advective
mass discharge occurs across areas of high K. However, mass flux varies substantially
from the source zone to the leading edge of the plume, as areas closer to the source
have had more time for diffusion from areas of high K to areas of low K. This mass
storage of contaminants in low K zones is characteristic of areas that have had
prolonged contact with the plume (ITRC 2010).
As the mass of contaminant within the source is depleted through remediation or
natural attenuation, residual mass within areas of low K become more important
(figure 6). Areas of greater K may therefore become subject to back-diffusion from
lower K areas, which act as a second-generation source continuing to supply
contaminants to groundwater flowing through areas of higher K (ITRC 2010). Hence,
less transmissive areas are sometimes referred to as secondary sources.

CRC CARE Technical Report no. 37 12
Flux-based groundwater assessment and management
Figure 6 Movement of contaminants in expanding and contracting plumes. A) demonstrates an
expanding plume, where contaminant mass is mainly present within areas of high K (dark blue). B)
demonstrates that following source mass depletion, contaminant mass may back-diffuse form areas of low
K (light blue) to high K (white). (Adapted from ITRC 2010).
The transition from groundwater contamination supplied by the original source zone to
contamination supplied by second-generation sources is complex but controlled by
mass flux from each zone. Understanding the magnitude of mass flux from each zone
can help improve the CSM and prediction of future plume behaviour. Over the lifetime
of a plume, the diffusive mass transfer of contaminants for an expanding plume is from
areas of high to low K, whilst the diffusive mass transfer for a contracting plume is from
areas of low to high K.
Understanding and measurement of this phenomenon can impact the CSM and site
management decisions, including the choice of remedial options and the evaluation of
remedial performance, as discussed in subsequent sections.

CRC CARE Technical Report no. 37 13
Flux-based groundwater assessment and management
3. Applying mass flux in managing groundwater
contamination
The section provides detail on the sites where mass flux concepts are likely to be
helpful, along with when they may not be efficient. Additionally, some of the practical
uses for mass flux measurements in managing groundwater contamination are
presented, in order to provide the reader with context to appreciate how mass flux
measurements may be useful in different situations.
The use of mass flux or mass discharge data in managing groundwater contamination
requires the early, active, and possibly iterative engagement of the site stakeholders,
including the regulators. Agreement on the terms of reference, methodology,
assumptions, acceptable uncertainty and end points is crucial to the effective
application of mass flux and mass discharge data.
In adopting these techniques on a given site, consideration also needs to be given to
the regulatory context to determine whether the technique is useful in achieving the
overall site objectives. The regulatory context is discussed further in section 4.
3.1 Site and scenarios
As introduced in section 1.2, mass flux and mass discharge can be helpful for site
characterisation and remediation in a wide range of circumstances. Whilst from a
technical perspective, mass flux concepts are likely to be suitable for most sites, they
may or may not be cost-effective in a particular circumstance. When deciding if mass
flux concepts are suitable for a site, there are four main considerations:
the contaminant of concern
whether regulatory compliance may be more easily achieved through
concentration-based data alone
the site conditions (access and geology) and budget, and
the regulatory context.
The first three points are considered in more detail below, while the regulatory context
is discussed in section 4.
3.1.1 Contaminants of concern
For mass flux to be calculated, the contaminant of concern must be a dissolved
constituent that migrates with the groundwater flow. Examples of these include:
metals
chlorinated organics;
petroleum hydrocarbons;
pesticides and herbicides
nutrients, and
other inorganic ions.
As such, the use of mass flux may not be appropriate for certain contaminants of
concern with very low solubilities such as polychlorinated biphenyls.

CRC CARE Technical Report no. 37 14
Flux-based groundwater assessment and management
Similarly, it is important to consider the likely distribution of the contaminant mass
between phases: dissolved in groundwater, sorbed onto solids, and/or as an immiscible
liquid. Mass flux estimates may be inaccurate if a significant fraction of the contaminant
mass is sorbed onto suspended solids (colloids) in the groundwater samples (resulting
in an over-estimate of the measurement of the dissolved phase concentration). This
can be mitigated by suitable field techniques such as adequate groundwater well
development, low-flow sampling techniques, passive sampling, and/or filtering turbid
samples.
Specifically regarding the management of sites with non-aqueous phase liquid (NAPL)
contamination, it should be noted that the mass flux concepts presented within this
guideline are discussed with respect to the dissolved phase. The presence of free
product or residual NAPL product should be investigated and managed accordingly. In
addition, some Australian jurisdictions mandate the removal of light NAPL free product
regardless of the potential risk to receptors. As such, while mass flux and mass
discharge estimates can be useful in managing sites with NAPL contamination with
regard to the associated dissolved phase risk, these measures may not reflect the risk
posed by the presence of NAPL.
3.1.2 Achieving regulatory compliance
Flux information is typically most appropriate for sites where it is difficult to achieve
compliance with groundwater concentration criteria alone.
As the estimation of mass flux and mass discharge is more complex than reliance on
concentration measurements alone, it may be more costly to obtain these parameters.
Therefore at sites where closure can be obtained by meeting groundwater
concentration criteria alone, it is unlikely to be necessary to conduct a flux-based site
assessment. As such, at simple sites with small plumes, obtaining mass flux data is
generally not advantageous.
Similarly, where the remedial end-point is restoration of beneficial uses throughout the
aquifer, flux measurements may be of limited value for use as remedial criteria, as such
an approach may require concentrations at all locations to remain below the clean-up
criteria required from a regulatory perspective. If the measured concentrations are
considered to pose unacceptable risks to site receptors, site closure may in some
instances require the risks to be managed and/or mitigated, regardless of the estimated
mass flux and mass discharge. A discussion on the use of mass flux and mass
discharge for a more risk-based approach is provided in section 3.7.
Therefore, it is generally envisioned that mass flux and mass discharge estimates may
be used to complement concentration-based assessments, rather than to replace
them.
3.1.3 Site access and budget
Obtaining mass flux and mass discharge information can require high resolution data to
be collected across transects to account for heterogeneities in the subsurface. Applying
these concepts at sites with logistical or technical restrictions, for example sites with
limited access to install the required number of monitoring wells, may not be
appropriate. Moreover, it may not be cost-effective or practical to obtain accurate
estimates of mass flux or mass discharge in highly heterogeneous sites where
groundwater velocities vary by many orders of magnitude across small distances.

CRC CARE Technical Report no. 37 15
Flux-based groundwater assessment and management
(Although it is noted that this limitation may also apply to concentration-based data
under those field conditions). Exceptions to this are discussed in Appendix A (A.1 and
A.3), as certain methodologies such as integral pumping tests remain appropriate for
highly heterogeneous sites. It should be noted, however, that the cost-benefit decision
in these cases is site and proponent specific, and mass flux techniques may provide
additional value for the investment over the long term.
3.2 Using mass flux to enhance the conceptual site model (CSM)
Characterising a site and developing a sound CSM of groundwater contamination is an
essential aspect of contamination assessment and management. Whilst mass flux and
mass discharge are not explicitly referred to in current Australian (state or territory)
regulatory guidance in regards to the development of a CSM, it is recognised that these
parameters can provide a more complete measure of the potential impact to a receptor
posed by a contaminant plume (CRC CARE 2014).
Understanding the risks that plumes of contamination pose are important aspects of
Australian regulatory decision making; whether the plumes are migrating off site,
whether they are increasing or decreasing in extent, as well as contaminant
concentrations. Assessing mass flux and mass discharge early in a field program,
particularly at more complex sites, may have cost benefits as the site can be better
characterised at an earlier stage and the data can be used to inform further
investigations and remediation at the site.
Mass flux data can be used to track changes in source mass and plume evolution over
time. It is noted that groundwater flow direction and contamination concentration are
dynamic, and hence the contaminant mass flux fluctuates with changes in groundwater
flow (Rein et al 2009). Some examples of the numerous applications of mass flux
and/or mass discharge to enhance the CSM are discussed in table 1.
Important note about worked examples and case studies used in this guidance:
The purpose of the worked examples and case studies is to demonstrate the practical
application of mass flux and mass discharge. It is expected that when a flux approach
is applied it will be used as part of a multiple lines of evidence approach, and that there
will be a comprehensive understanding of the level of risks in the environment. Worked
examples are mostly selected from literature. Case studies are more detailed (in
Appendix C). Remediation action plans and site management plans should consider
environmental values or beneficial uses based on jurisdictional requirements, and be
developed in consultation with regulators.

CRC CARE Technical Report no. 37 16
Flux-based groundwater assessment and management
Table 1 Practical uses of mass flux and mass discharge to enhance the CSM.
Enhance the CSM Practical application of mass flux and mass discharge in this
context
Estimate source mass and source strength
(see Case study 1,
and worked example 2
and 3)
Mass discharge along the length of a plume can be used to estimate the historical mass discharge from the source and thus the source strength function. This can be important for interpreting other processes such as back-diffusion from areas of lower K.
Mass discharge can be applied to establish the baseline source strength at a given point in time. The mass discharge across a transect on the down-gradient edge of the source zone can be measured and used to compare post-remedial mass discharge.
Mass flux can be used to identify source zone hot spots and evaluate locations where the source is contributing the highest mass to the plume.
Mass discharge is a powerful tool in estimating the source strength
function, defined as the change in mass discharge over time with
the natural dissolution of the source. It can be quantified as the
change over time of the mass discharge at the down-gradient edge
of the source zone, known as the source mass discharge (Annable
et al 2014, Wang et al 2014). The source strength function can be
estimated using historical and current site data and simplified
models, such as exponential decay models or more complex
models such as the power law model (Falta et al 2005; Annable
2010).
Evaluate trends in the source and plume over time
(see worked example 4)
Mass flux and mass discharge estimates can be used to evaluate trends in the source and plume over time. Mass discharge generally decreases from the source zone over time. As mass flux represents the combined effects of contaminant transport, attenuation, and storage processes (including sorption in areas of lower K and diffusion to areas of a higher K) a loss of contaminant mass results in a lower mass flux. Therefore, at the distal end of the plume, mass discharge will naturally decline due to dilution and mass storage in areas of lower K. For a recent source, the drop in mass flux with distance from the source is generally much greater than a more mature source where the plume has advectively spread out over a larger area (ITRC 2010). Therefore, mass flux estimates are also a useful indicator of the age of a plume. Data from older plumes have indicated that as plumes age, groundwater contaminant reduction tends to approach an exponential decay model (Chen & Jawitz 2009).
As mass discharge is the sum of the mass flux from each sub area within a transect, the determination of mass discharge at transects at different distances from the source zone can provide estimates of how the mass discharge has changed historically as the plume developed, or through mass loss mechanisms within the plume (CRC CARE 2014).
Evaluate attenuation rates
(see worked example 4 and 6)
Mass discharge can be used to evaluate mass attenuation rates within specific areas of the plume. To do this, mass discharge is measured across multiple transects along a common flow path, and the difference is equal to the attenuation rate between the transects (assuming system equilibrium).
Mass flux distribution of electron acceptors and donors across transects and comparison to contaminant mass flux distribution may assist in characterising biodegradation reactions responsible for attenuation processes.

CRC CARE Technical Report no. 37 17
Flux-based groundwater assessment and management
Enhance the CSM Practical application of mass flux and mass discharge in this
context
Mass discharge can be used to carry out mass balance assessments. As discussed in section 2.2.2, mass balance assessments involve the comparison of the source strength into a dissolved phase plume with plume attenuation rates. Plume attenuation rates can be estimated using models and/or historical concentration data, and should take into consideration ‘losses’ due to sorption, diffusion into areas of higher K and dispersion (ITRC 2010). These types of analyses could provide an additional line of evidence to support application of monitored natural attenuation strategies as noted in CRC CARE Technical Report 15 (Beck & Mann 2010).
Assess whether there is more than one source
Comparison of the source zone mass discharge to the estimated plume attenuation rate can assist in determining whether multiple sources may be contributing to a plume. If the plume attenuation rate exceeds the mass discharge from a known source zone, then there may be additional sources contributing to the plume.
Determine the mobility of the source
(see worked example 2)
Mass flux can be used to determine whether the contaminant mass is primarily located within areas of high or low K within the aquifer.
Determine the likelihood of contamination migrating off-site
(see case study 1 and worked example 6)
Mass discharge measured close to the source zone is a leading indicator of groundwater concentrations leaving the site, and is therefore useful in the assessment of risk to off-site receptors. Whilst concentrations at the site boundary are not necessarily representative of risks to the receptor due to the processes of attenuation, mass discharge estimates do consider attenuation and may provide a more accurate indicator of risk.
The concepts of mass flux and mass discharge can be applied to demonstrate that contamination is unlikely to migrate off-site, if it can be shown that the rate of mass loss through processes such as natural attenuation is such that contaminant mass will reduce and will be contained within the site (CRC CARE 2014).

CRC CARE Technical Report no. 37 18
Flux-based groundwater assessment and management
Worked example 1: Using mass flux to refine the CSM
Mass flux estimates and natural attenuation rate constants were used to characterise
a former gasworks site in Germany (Bockelmann et al 2001) with the following
details:
The geology was described as shallow Quaternary gravels with locally
embedded sand, silt and loamy clay.
Eight pumping wells were positioned along two transects 140 m and 280 m
down-gradient of the source zone.
BTEX and PAH mass discharges were obtained through the integral pumping
test (IPT; see section 5.2, with further details on the methodology presented in
Appendix A).
Well positions, pumping rates and pumping times were optimised to allow the
wells to capture the entire groundwater flow downstream of the source zone.
Overall, PAH mass discharges of 32 g/day (nearest source) and 13 g/day were
calculated for the two transects.
The authors made the following observations:
PAH mass fluxes were found to be over an order of magnitude greater than
BTEX mass fluxes.
Acenaphthene displayed the highest individual contribution to the PAH mass
discharge (31 g/day and 13 g/day, the former in the control plane nearest the
source), with its mobility attributable to its relatively high water solubility.
BTEX mass discharge was dominated by benzene, with mass discharges of
1.8 g/day and 0.094 g/day, with the former in the control plane nearest
the source.
First-order attenuation rate constants for the identified BTEX and PAH
compounds were calculated based on the quantified changes in contaminant
mass fluxes between the two transects.
Supplementary evidence of microbial degradation was indicated by an increase
in dissolved iron mass flux and a reduction of sulfate mass flux between the two
transects.
It should be noted that mass flux and mass discharge estimates are only one tool in the
development of a CSM, and should be used in conjunction with concentration data and
other information gathered regarding a site.
3.3 Complement concentration based criteria with mass flux
Traditionally, decision making in Australian groundwater management is based on
criteria that are defined in terms of contaminant concentrations. The ASC NEPM details
concentration-based groundwater investigation levels (GILs) which can conservatively
be utilised as screening criteria for groundwater (as described in schedule B1 of the
ASC NEPM). The GILs have been developed on a risk basis to offer protection to
potential receptors on the majority of sites (ANZECC 2000), as further described in
section 4. They can be used to screen measured data and identify situations where a
potentially unacceptable risk to a beneficial use may exist and therefore may be

CRC CARE Technical Report no. 37 19
Flux-based groundwater assessment and management
followed by further investigation. These GILs are not intended for use as remedial
criteria.
If exceedances are identified, further risk assessment can be undertaken (as detailed
in Schedule B6 of the ASC NEPM) utilising the GILs as acceptable (concentration-
based) criteria at identified or potential points of exposure (considering current and
realistic future uses on the site or surrounding areas). These GILs are either compared
to concentrations measured at these points of exposure, or through back-calculating
(e.g. based on groundwater modelling) to determine groundwater concentrations at a
control plane which would result in the GILs at the receptor. It is noted that where a site
is intended for a generic, unrestricted use, and/or where a receptor is co-located with
the source, it may be difficult to justify the development of site-specific remedial targets
which are less stringent than the GILs.
Following this standard framework, concentration-based criteria are commonly used in
regulatory decision making for the management of groundwater contamination. While
the concentration of a contaminant is a key indicator of the potential for impact of a
contaminant on human health and the environment, and is often the trigger for further
investigation, it provides a one-dimensional site characterisation and risk profiling tool.
In some situations, although a concentration compliance criterion or a clean-up target
has not been met, a significant decrease in mass flux and discharge in groundwater
may have occurred (CRC CARE 2014), such that the risk may be low and acceptable.
Therefore the use of flux-based metrics may provide a complementary means of
demonstrating the effectiveness of remediation or management of a site with a view to
site closure.
Two of the key ways in which mass flux and mass discharge metrics can be used to
complement concentration criteria are discussed further in Table 2.
Table 2: Practical uses of mass flux and mass discharge to complement concentration based
criteria
Complement
concentration criteria
Practical application of mass flux and mass discharge in this
context
Provide estimate of mass of contaminant entering a receiving water body or pumping well
(see case study 1, and worked example 6 and 7)
Mass flux concepts can be used to estimate the concentration at the receptor. For example, consideration of the mass discharge rate and mixing rates might show that based on the surface water flow or pumping rate, the resulting contaminant concentration will not exceed acceptable water quality criteria at the receptor. These scenarios are further detailed in sections 6.1 and 6.2.
Conversely, if the rate of discharge is large or increasing, then the resulting concentrations may exceed acceptable water quality criteria indicating that remediation is required. This example is illustrative of how augmenting concentration data with mass flux measurements can be useful in further understanding risk to a receptor.
It is noted that mixing or dilution on their own are not considered to be acceptable remedial strategies.
Derive remedial criteria
(see case study 1, ad worked example 6)
Mass flux and mass discharge metrics can be used to assess performance during remedial works and (where the regulator approves) can be used as additional remedial endpoints.
Application of strict concentration-based criteria is a stringent requirement, given that the distribution of contamination is usually variable and non-uniform, with small pockets of higher

CRC CARE Technical Report no. 37 20
Flux-based groundwater assessment and management
Complement
concentration criteria
Practical application of mass flux and mass discharge in this
context
concentrations quite often being the norm. Experience and research shows that concentration criteria can rarely be achieved everywhere at a site or in a groundwater plume within an acceptable timeframe or expenditure of resources. It is possible that the application of mass flux and mass discharge considerations could be helpful in such situations, as mass flux and mass discharge can assist in understanding risk and the implications for long term stewardship of sites, and therefore whether remediation is required.
It should be noted that where localised concentrations exist in exceedance of
concentration-based remedial criteria, it remains necessary to determine that these
impacts do not pose unacceptable risks to receptors, or that these risks can be
adequately mitigated/managed.
An example where mass discharge was used to complement concentration criteria at a
brominated DNAPL site in Western Australia is detailed in case study 1, presented in
Appendix C.
3.4 Using mass flux to assist with remedy selection
Predicting the effectiveness of a remedial method and the time that will be taken to
protect and/or restore the beneficial uses of groundwater are essential considerations
in selecting one remediation method over another. These factors may assist regulatory
decision-making on whether to endorse a proposed remediation approach or not.
Table 3 provides detail on the situations where mass flux and/or mass discharge
estimates may be useful in remedy selection.
Table 3 Applications of mass flux in remedy selection, including examples.
Use in remedy
selection
Practical application of mass flux and mass discharge in this
context
Determine the ability of remedial reagents to reach subsurface impacts
In situ chemical oxidation/reduction relies on contamination or reagents being able to migrate rapidly through an aquifer with high mass flux, and may be relatively ineffective where the contamination is stored in areas of low K with low mass flux.
If this method is deployed in aquifers where contamination is predominantly stored in low K areas, this can result in much of the contamination remaining unrecovered or untreated.
Therefore a sound understanding of the mass flux across a plume can be helpful in predicting the success of this method in a particular aquifer, and therefore whether the method should be applied or not.

CRC CARE Technical Report no. 37 21
Flux-based groundwater assessment and management
Use in remedy
selection
Practical application of mass flux and mass discharge in this
context
Evaluate whether secondary sources exist and chose remedial method accordingly
In situ bioremediation may be useful where significant back-diffusion is measured or anticipated. For example, the enhanced reductive dehalogenation of chlorinated solvents may be effective since conditions established to promote biodegradation can be maintained for years, treating chlorinated solvents as they back-diffuse from low to high K zones.
Therefore, the contaminant mass distribution between high and low conductivity zones should be considered when deciding if in situ bioremediation is an appropriate remedial technique.
Establish appropriate contamination reduction targets, allowing the selection of appropriate remedial methods to achieve targets
(see case study 2)
Rather than focus entirely on achieving a contaminant concentration as a remedial goal, baseline mass flux and mass discharge estimates can be used to establish appropriate and achievable contamination reduction targets (e.g. 90%, 99%, 99.9%). These reduction targets can then be used to screen for appropriate remedial methods that may achieve this, either alone or in combination with other remedial methods (ITRC 2010).
This is particularly useful in situations where entire removal of the contaminant may not be either technically or economically feasible.
Assist in characterising the site, allowing the remedial method to be tailored accordingly
(see case study 1, and worked example 2 and 3)
Mass flux measurements can be used to understand the distribution, seasonality and long-term stability of attenuation rates within the plume.
This then allows the targeting of areas of the plume that may require additional treatment to achieve the remedial objectives, or those areas that will provide the greatest bang for buck.
Understanding the hydrogeology and mass flux distribution (i.e. changes in mass flux across the plume) can allow for a more targeted, effective and efficient remedy.
Prioritise sites for remediation
(see worked example 7)
As mass discharge provides a quantitative estimate of source strength and potential impacts to down-gradient receptors, it can be useful metric with which to compare the risks posed by different sites.
This could be a useful tool for regulatory agencies and responsible parties to prioritise remediation resources and time frames, and is increasingly applied by industry (ITRC 2010). Large industrial companies have also been noted to voluntarily measure mass discharge down-gradient of their impacted sites in order to monitor their environmental liabilities.
These concepts may be used to prioritise sites for remediation within a portfolio of sites. For example, if three sites each have similar concentrations of contamination, yet one site has far greater mass flux due to higher groundwater flux, this site may represent a greater risk to receptors, and therefore be allocated more resources, or resources sooner. Without the aid of mass flux data, this decision may be made for less risk-based reasons.

CRC CARE Technical Report no. 37 22
Flux-based groundwater assessment and management
Use in remedy
selection
Practical application of mass flux and mass discharge in this
context
Help to determine if remedial actions should focus upon the source or the plume
(see case study 1 and worked example 2)
Mass flux and mass discharge can be used to estimate the fraction of the initial contaminant mass that has been removed from the source zone over time, and hence where to focus remedial efforts. Where only a small percentage of source mass has migrated into the contaminant plume or attenuated, the plume is considered young, and therefore the remedial approach should initially focus on the source zone. In contrast, an aged plume is one where the majority of the mass has been removed from the source zone. In this case, remedial efforts should focus on the groundwater plume (and areas of lower K within the plume that may be acting as secondary sources) rather on the depleted primary source zone (Annable 2010).
Worked example 2: Using mass flux to assist with remedy selection
Mass discharge estimates at an expanding dissolved TCE plume at a former
manufacturing site in Australia assisted in selecting the most appropriate remedial
approach (Basu et al 2009), with the following details:
A source mass discharge of approximately 3 g/day was used to determine that
the TCE source mass was small, approximately 10 kg.
Data from passive flux meters (see Appendix A, A.3) additionally suggested that
the TCE source mass was present in low permeability areas, making
remediation through active source treatment less effective.
A TCE mass discharge of 6 g/day at a transect across the plume located 175 m
from the source suggested that biodegradation was minimal, which was
anticipated given the aerobic geochemical conditions observed within the plume.
Based (in part) on this data, the plume was considered to be large and non-
degrading whilst the source strength was small and declining. Therefore remediation
of the source was considered unwarranted. Rather, it was recommended that
remediation should comprise the containment of the large TCE plume (approximately
1.2 km long, 0.3 km wide and 17 m deep) or institutional controls, along with a long-
term mass flux monitoring program.
3.5 Using mass flux to optimise remedial design
As mass flux and mass discharge estimates incorporate the transmissivity of the
subsurface and (consequently) the mobility of the contaminant, they can be helpful in
optimising remedial designs. Specific examples of the use of mass flux to optimise
remedial design are included in Table 4, below.

CRC CARE Technical Report no. 37 23
Flux-based groundwater assessment and management
Table 4 Applications of mass flux concepts in optimising remedial design, including examples.
Optimise remedial
design
Practical application of mass flux and mass discharge in this
context
Identify where the greatest mass is being discharged
(see case study 2 and worked example 3)
Mass discharge estimates can be used to locate zones contributing the most (and the least) contaminant mass to a plume, and hence can provide valuable information for placement of pumping wells, injection points, and monitoring wells (ITRC 2004; 2008 & 2010), as well as where to target treatment for maximum benefit..
Identify where the greatest mass is being discharged, and therefore where treatment should be targeted for maximum benefit. For example, if it is found that mass flux is large in some localised zones, then treatment of these zones may be able to achieve an overall reduction in contamination down-gradient, such that treating all areas of the source zone is not required. This can result in significant cost and resource savings.
Estimate remediation timeframes
Mass flux estimates with approximation of source masses can be used to derive order-of-magnitude estimates of remediation timeframe (API 2003).
Design of permeable reactive barriers
Groundwater flux and mass flux are important design parameters in the design of permeable reactive barriers, which must provide sufficient reactive capacity and retention time to treat the incoming contaminant.
Selection of appropriate reagents
Mass flux can be used to assess the potential for back diffusion from secondary sources. Back diffusion can be addressed by selecting a longer-lasting carbon substrate within a treatment zone, to maintain conditions conducive to bioremediation as the contaminant back-diffuses from areas of low to high K.
In situations where performance monitoring indicates that the current remediation
method is not effective, mass flux and mass discharge estimations can be used to
evaluate alternative technologies. This is particularly relevant in the case where an
active remedial technique is no longer effective because the contaminant mass has
been reduced, and corresponding reductions in mass flux can be used to trigger a
transition to an alternative remedial technology more suited to the new contaminant
profile.
Worked example 3: Using mass flux to optimise remedial design
Mass flux estimates were used to locate and target the source areas that contributed
most to a contaminant plume at a site in Washington state, USA, as well as to
monitor remedial performance (Brooks et al 2008; Annable et al 2014), with the
following details:
The site was impacted by a TCE groundwater plume arising from three main
source areas.
The sources were delineated through cores, groundwater samples, historical site
activities and drum removal.
Electrical resistive heating was selected as the most appropriate
remedial option.
Four well transects were installed down-gradient of the treatment zones and
data collected using passive flux meters (PFMs) segmented in vertical intervals
of approximately 0.3 m to assess local source mass flux.

CRC CARE Technical Report no. 37 24
Flux-based groundwater assessment and management
The data along each transect were used to produce a flux distribution plot using
the computer program Surfer®.
The plots highlighted the variable nature of the TCE mass flux from the source,
likely due to the presence of individual pools of DNAPL up-gradient of
the transect.
The team noted that TCE distributions were less localised in transects further
from the source zones, as more time and travel distance allowed for greater
mixing and dispersion within the groundwater.
The mass flux and mass discharge data indicated that a reduced remedial treatment
zone could be applied by focusing on the areas of higher mass flux.
Additionally, site-wide integrated pumping tests (IPT) were carried out over the
surficial aquifer to assess the overall mass discharge from the source into the plume
system. This was then used for performance monitoring (section 3.6) and risk
assessment (section 3.7) purposes.
The field methodologies used in estimating mass flux and discharge, PFMs and IPT,
are introduced in section 5 with greater detail presented in Appendix A.
Mass fluxes at a source control plane have been observed to be relatively stable over
time (discussed in section 3.6), and this has implications for remedial design, as the
stability of mass fluxes indicate that high-flux zones within the source remain high
throughout the dissolution process. Therefore targeted source treatment of the highest
mass flux zones will be more effective in reduction of mass discharge than uniform
treatment across the entire source control plane.
3.6 Using mass flux to assess remedial performance
In combination with concentration data, mass flux and mass discharge estimates can
be used to assess the performance of a remediation method when in operation, and to
monitor whether it is performing as designed. If the remedial performance is not
meeting the expected milestones, then mass flux measurements can assist in
understanding where contaminant reduction is less than expected, and where
improvement can be directed (CRC CARE 2014).
The use of mass flux and/or mass discharge estimates to assess remedial
performance and examples are detailed in Table 5.

CRC CARE Technical Report no. 37 25
Flux-based groundwater assessment and management
Table 5 The use of mass flux and/or mass discharge estimates to assess remedial performance
Assess remedial
performance
Practical application of mass flux and mass discharge in this
context
Measure the extent to which contaminant mass is being removed from the system
(see case study 1, and worked example 3 and 4)
Baseline mass flux and mass discharge can be compared to current estimates to evaluate the effectiveness of the treatment to date and the rate of contaminant mass removal.
A change in mass flux or mass discharge from the source can be used to quantify source remediation performance, whilst changes in the mass flux or mass discharge from the dissolved-phase plume can be used to quantify the response of the plume to either source or plume remediation.
This information can assist in determining if the treatment has been appropriately targeted and the hot-spots are being addressed, or whether the treatment needs to be redirected to achieve greater effectiveness (CRC CARE 2014). This is difficult to determine from concentration data alone, as mass discharge is a better indicator of the source mass which remains on the site than concentrations alone.
Assess the potential benefits of applying additional remediation methods
Often remedial techniques are better suited to either low or high K zones, but rarely to both. Therefore post-remediation mass discharge mapping can be useful in identify portions of the plume where contaminants are depleted in areas of higher K, but remain in areas of lower K. In these circumstances an alternative remedial technique may be required if further contaminant reductions are required to achieve site closure.
Alternatively, mass flux measurements may indicate that treatment of higher K areas alone is sufficient to allow the remedial targets to be achieved as quickly as treatment of the entire impacted area (ITRC 2010).
Determine the efficiency of treatment reagents
Mass flux and mass discharge estimates may be useful in determining the efficiency of treatment reagents or the distribution of injected reagents within the aquifer. This may assist in the identification of locations not contributing to the overall treatment effort, allowing treatment to be discontinued at those locations and directed to other locations where it will be more effective (CRC CARE 2014).
Identify locations where treatment has affected subsurface hydrodynamics.
Mass flux can be a useful measure in identifying locations where treatments applied during remediation may have affected subsurface hydrodynamics through reducing the K distribution. If treatment causes clogging of the aquifer through precipitation of inorganic by-products, injection of oils, or biomass growth, then this may be able to be identified and quantified through mass flux measurement comparisons before and after remediation (ITRC 2010).
Determine the cause of any changes in contaminant concentrations
Measurement of specific characteristics of the aquifer such as groundwater flux (and hence mass flux) or targeted chemical analysis (e.g. of electron acceptors) can be used to distinguish whether changes in contaminant concentration can be attributed to treatment, natural degradation, partitioning into lower K areas or back-diffusion from areas of lower to higher K. This may assist in determining whether ongoing contaminant mass reduction can occur through natural means and active treatment can cease (CRC CARE 2014).

CRC CARE Technical Report no. 37 26
Flux-based groundwater assessment and management
Assess remedial
performance
Practical application of mass flux and mass discharge in this
context
Estimate remediation time frame
The estimated remediation time frame can be extrapolated from mass discharge data, however longer-term performance data is required to reduce uncertainty (ITRC 2010).
As discussed in section 2.2.3, back-diffusion from areas of low to high K may act as a secondary source of contamination at older sites, and should be taken into consideration when estimating remediation time frames.
Assess performance of monitored natural attenuation (MNA)
Mass flux measurements are commonly used to quantify natural attenuation rates, as discussed in section 3.1. In applying this approach, field measurement and the calculation of mass flux estimates would need to be repeated some time apart (or through spatial separation) to confirm that the differences in mass flux result from attenuation, and not movement of the contaminant plume. This data should also be supported by various chemical measures of MNA.
The relative spatial distribution of the areas of high and low mass flux at a source
control plane is thought to be relatively stable over time even as the source strength
may decline naturally or due to remedial efforts (Basu et al 2006). This is useful for
remedial performance monitoring, as it suggests that groundwater flux can be
measured once for a particular transect and then assumed to remain constant, allowing
the changes in mass flux through time to be estimated simply by measuring
concentrations. It should be noted, however, that in regions known to be highly
seasonal, groundwater flux measurements may be required throughout the year to
account for that seasonality. Moreover, remedial activities that lead to changes in K in
areas of a site could lead to changes in the relative spatial distribution of mass flux and
thus a post-remedial groundwater flux measurement may be required.
While mass flux estimates can be particularly useful in assessing remediation
performance and plume changes over time, there are two key processes that can
confound the interpretation of mass flux data:
Storage processes (partitioning into areas of lower K) must be adequately
considered and not be misinterpreted as degradation, and
The ongoing contribution of secondary source back-diffusion into areas of higher K
must be considered, and not be misinterpreted as remedial underperformance.
Worked example 4: Using mass flux to assess remedial performance
Mass flux was incorporated in the Site Management Plan as a metric of remediation
performance at a brominated DNAPL impacted site in Perth (Johnston et al 2014),
with the following details:
The link between source mass removal and mass fluxes in groundwater were
assessed to see how closely the two corresponded.
The mass flux and mass discharge associated with the brominated DNAPL
plume were measured in high resolution immediately down-gradient of the
source, both before and after partial source removal.
The study found that the reduction of source mass at the site corresponded to a
reduction in the mass discharge estimated for the plume. The mass discharge of

CRC CARE Technical Report no. 37 27
Flux-based groundwater assessment and management
brominated DNAPL from the source was additionally used to model attenuation
in the aquifer.
Further details on the application of mass flux concepts at this site have been
presented in the case study in Appendix C.
Brusseau et al (2007) used mass flux estimates to monitor remedial performance at
a TCE pump-and-treat system, with the following details:
Partitioning inter-well tracer testing was used to measure source mass.
The test indicated that a 50% reduction in source mass had occurred over the
19 years the system had been operational.
This coincided with a greater than 90% reduction in source mass flux.
Mass flux therefore provided useful information to assess remedial performance
beyond that which would have been provided by concentration data alone.
3.7 Using flux to demonstrate risk reduction
Where the consideration of the total contaminant mass reaching a receptor is used as
an indicator of the risk posed by groundwater contamination, then the use of mass flux
and mass discharge estimates can provide a more comprehensive estimate of the risk
than concentrations alone (ITRC 2010). In many cases, point concentrations alone do
not provide sufficient information to calculate down-gradient impacts, and mass flux
and mass discharge can provide a more complete measure of the potential impact to a
receptor posed by a contaminant plume.
For example, as shown in figure 4 in section 2.2.1, whilst two plumes may have the
same contaminant concentrations, one may be moving faster and discharging greater
contaminant mass over time, and therefore pose a greater risk to potential down-
gradient receptors. Moreover, attenuation rates will affect the duration over which the
plume is sustained, thereby impacting potential exposure time frames (ITRC 2010).
Additionally, concentration may not account for site characteristics which may
significantly impact risks to down-gradient receptors. The mass discharge takes into
account the size of the contamination source and/or plume in addition to the
concentration, as depicted in figure 7, where the use of concentration only would not
differentiate between the two cases. Moreover, the pumping rate of the down-gradient
extraction well can be accounted for during mass discharge estimates (as
demonstrated in section 6.1 and Appendix A), and would likely be a key factor in the
assessment of risks to potential receptors exposed to contaminated groundwater.

CRC CARE Technical Report no. 37 28
Flux-based groundwater assessment and management
Figure 7 Whilst the concentrations reported at the wells within the source area are the same, the greater
source mass in Case A results in a greater mass discharge at the receptor. The relatively small source
mass in Case B results in a decreased mass discharge at the receptor. This illustrates the impact of the
source mass upon mass discharge, which is not accounted for using concentrations alone.
Mass discharge estimates are particularly useful when contaminant discharge from a
plume mixes with non-impacted water at or before the exposure point, such as in the
case of supply wells or surface water bodies. Whilst dilution or mixing is not considered
to be an appropriate remedial strategy, in these situations estimates of mass discharge
to the mixing zone are more useful for risk assessment than the contaminant
concentration alone (ITRC 2010).
Worked example 5: Using mass flux estimates to assess risk
Rivett et al (2014) used mass flux to assess the architecture and persistence of a
20 to 45 year old DNPL source zone, and hence the risks associated with this
source, with the following details:
The NAPL source zone was in a heterogeneous sand/gravel aquifer. Mass flux
was typically found to be dominated by mass transport through more
permeable zones.
In some areas, despite high contaminant concentrations, the associated mass
fluxes were low due to the low K in the area.
The dissolved-phase mass discharge from the source zone across the
monitored 4 m by 4 m cross-section of aquifer amounted to 400 kilograms (kg)
per annum (about 100 kg of TCE and 300 kg of total ethenes). This was greater
than anticipated given the age of the DNAPL source zone and that it was no
longer dominated by ganglia.
This illustrated that the mass discharge from a layer or pool dominated source
zone perhaps remained significant, with significant associated risk.
The presence of localised DNAPL additionally led to significant uncertainties in total
source zone mass estimates and endorsed the need for high resolution approaches
when characterising the site.
3.8 Evaluating compliance or long term monitoring
Mass flux and mass discharge information can be used for regulatory compliance
monitoring to supplement concentration-based data. For example, whilst concentration

CRC CARE Technical Report no. 37 29
Flux-based groundwater assessment and management
data may identify an exceedance of the assessment criteria at the compliance point,
mass flux data may indicate that there is minimal flow or discharge occurring. On the
other hand, low concentration data may be accompanied by elevated mass discharge
due to the more rapid flow of groundwater. Compliance metrics in both situations could
potentially be based on the maintenance or reduction to a low or negligible mass flux to
prevent impacts to down-gradient receptors (ITRC 2010), rather than based solely on
concentration data.
Mass flux and mass discharge estimates can be used for regulatory compliance
monitoring to augment concentration data. For example, if the remedial goal includes a
percentage reduction in contaminant mass, then mass discharge estimates using
monitoring wells on the down-gradient boundary of an active treatment zone could be
used to identify when the remedial goal has been achieved. When this goal has been
achieved the groundwater remedial program can be ceased and (depending on
concentrations and regulations) natural attenuation may be relied upon for any residual
impacts (ITRC 2010). It is noted that this approach requires engagement of and
support from the regulator, and some regulators may not support natural attenuation
explicitly as an endpoint of groundwater remediation. Engagement with the regulator is
discussed further in section 4.
In some situations, the contaminant concentrations in groundwater may exceed the
criteria for the protection of beneficial uses, but the mass discharge and extent of
contamination may not be considered to materially affect the use. This situation may
form the basis for accepting that remediation may not be required or to help establish
appropriate objectives for remediation (CRC CARE 2014). Therefore, an exceedance
of a concentration criterion may be considered acceptable if it is localised to a small
area that is not material to the land use and does not pose an unacceptable risk to the
environment. Situations where this concept may be applied within the Australian
context are discussed (along with worked examples) in section 6.

CRC CARE Technical Report no. 37 30
Flux-based groundwater assessment and management
4. Flux within a regulatory context
As illustrated in figure 1, once a practitioner has determined that mass flux may be
useful in achieving the objectives for the site, attention should be focused on whether
those methods can be used within the applicable regulatory context.
Basing decision making on whether contamination will or will not materially affect the
receptor, rather than focusing on concentration-based criteria, may result in
contamination that may be tolerated where the mass flux is small in the context of
groundwater use. The acceptability of such an approach is likely to be highly
dependent on specific policy requirements for groundwater protection in the local
jurisdiction, the demonstration of a robust approach to obtaining and using mass flux
and mass discharge data, and agreement from the regulator and other stakeholders
regarding the acceptability of such an approach.
Relevant jurisdictional policies and guidelines make very limited (if any) direct
reference to the use of flux measurements in managing contaminated groundwater.
However, the absence of reference to these techniques does not necessarily indicate
that their use would not be acceptable to regulators. Most relevant jurisdictional policies
make direct reference to risk-based decision making paradigms, and mass flux
methods can support a risk-based approach, but this needs to be demonstrated clearly.
For example, the data that are used to demonstrate a risk-based approach should be
well-presented and robust, and produced following consultation with the regulator.
As a general rule, regulators should be engaged early in the process to discuss mass
flux estimates as a tool for the site, and the proposed approaches. This includes the
discussion of any data requirements prior to the implementation of the approach.
It is emphasised that the decision to incorporate flux measurements to support decision
making at a site should be undertaken in accordance with jurisdictional guidance and
policy. These policies vary, and reference should be made to the relevant policy for the
jurisdiction in which the site is located.
This guideline provides a general overview of the key current Australian guidance
documents used in the assessment and remediation of groundwater as they relate to
the incorporation of mass flux concepts. It is intended to provide the reader with tools to
evaluate relevant regulations and guidelines, and to present a logical rationale for the
utilisation of flux.
4.1 The National Environment Protection (Assessment of Site
Contamination) Measure
The ASC NEPM is expressly focussed on contaminated sites assessment (rather than
remediation), but does contain extensive guidance on the risk assessment process,
which is linked to the use of mass flux data.
The methods described in the ASC NEPM for assessing risk associated with
groundwater impacts primarily focus on defining whether concentrations exceed a limit.
There is acknowledgement that it is the overall exposure concentration which
determines risk, and the ASC NEPM includes discussion of statistical approaches to

CRC CARE Technical Report no. 37 31
Flux-based groundwater assessment and management
address localised contamination above screening levels. While there is no express
discussion of the use of flux measurements to determine remedial end-points, the use
of such measurements would be in general accordance with the ASC NEPM approach
if it can be demonstrated that the levels correspond to low and acceptable risk as
defined within the ASC NEPM. A number of aspects of the guidance presented in
Schedules B1, B4 and B6 are pertinent to the use of flux measurements, as
summarised below.
Concentration based GILs are presented in Schedule B1 of the ASC NEPM. These
GILs are adopted from the National Water Quality Management Strategy (NWQMS)
documents for drinking water and the protection of surface water ecosystems
described further in section 4.2 (ANZECC 2000; ADWG 2011). Even though they
represent the acceptable concentrations at the receptor (e.g. in abstracted water or at a
surface water feature), they are intended for use as screening criteria, to be compared
with measured groundwater concentrations. As such, screening groundwater
concentrations against these criteria may be a conservative assessment (depending on
site-specific considerations), and as an extension to that, the ASC NEPM emphasises
that these criteria are not intended for use as remediation criteria (clean-up objectives)
for groundwater.
A framework for site-specific human health risk assessment (not restricted to
groundwater) is presented in schedule B4 of the ASC NEPM. The ASC NEPM
framework focuses on the use of exposure point concentrations as an input to assess
the risk to a given human health receptor. In this way, there is a focus on the use of
groundwater concentrations for the assessment of risk, and the use of mass flux
measurements is not specifically referenced in the ASC NEPM. However, as noted in
this document, where human health receptors are located away from the source zone,
mass flux and mass discharge measurements may provide useful data for predicting
exposure concentrations at the receptor (and therefore for estimating the level of risk).
The framework for site-specific groundwater assessment is presented in schedule B6,
advocating a tiered approach:
Tier 1: groundwater concentrations are compared directly to the GILs (as
described above for schedule B1).
Tier 2: groundwater concentrations at the receptor (e.g. in abstracted water or at a
surface water feature) should not exceed the GILs. Based on this principle, the
level of risk can be estimated by predicting the concentrations at the receptor
(e.g. by using a fate and transport model), and comparing these estimated
concentrations to the GILs. Remedial groundwater targets can be similarly back-
calculated as the concentrations in groundwater which will result in the GILs at the
receptor. The use of flux measurements is not specifically referenced in this
Schedule, but an understanding of mass flux is highly relevant to predicting the
level of impact at an off-site receptor, and therefore the level of risk.
Tier 3: more detailed site-specific assessment is undertaken, focusing on the
receptors specific to the site. For example, ecological assessments could include a
receptor survey and direct toxicity assessment. As discussed in section 4.2.1,
ANZECC (2000) provides examples of where flux-based criteria could be utilised
as remedial targets for specific contaminants and receptors.

CRC CARE Technical Report no. 37 32
Flux-based groundwater assessment and management
4.2 National Water Quality Management Strategy
The NWQMS is the primary national framework for water quality management in
Australia. Included in the NWQMS is a framework for groundwater quality protection
and several documents detailing general water quality guideline values which may be
utilised to help achieve this aim. These documents include (but are not limited to):
Guidelines for Groundwater Protection in Australia 2013 (GGPA 2013)
Australian Drinking Water Guidelines (ADWG 2011) which details acceptable
concentrations of a range of potential contaminants in drinking water, and
Australian and New Zealand Guidelines for Fresh and Marine Water Quality
(ANZECC 2000), which includes guideline values for the protection of human
health.
Each of these documents, as they relate to the use of mass flux and mass discharge
information, are discussed further below.
4.2.1 Australian and New Zealand Guidelines for Fresh and Marine Water
Quality 2000
The NWQMS document most pertinent to the discussion of the use of flux
measurements is ANZECC (2000). The water quality guidelines and water quality
objectives for the protection of freshwater and marine ecosystems presented in
ANZECC 2000 are generally numerical concentration limits. These criteria apply at the
receptor (e.g. within freshwater and marine surface waters), and flux measurements
may be relevant to estimating concentrations at the receptor, through the use of fate
and transport modelling, or by considering the effects of mixing (for example as
described in sections 6.1 and 6.2 of this guideline).
Furthermore, while ANZECC 2000 focuses on numerical concentration limits, it
expressly states that numerical concentrations are not the only, or necessarily the best,
approach to determine whether environmental values are protected:
“The philosophical approach for using (ANZECC 2000) is this: protect
environmental values by meeting management goals that focus on
concerns or potential problems, e.g. toxicity. This is in contrast to previous
approaches which more often focused on simple management of individual
water quality parameters, e.g. toxicant concentration, to meet respective
water quality guidelines or objectives. First, identify the water quality
concern…and establish and understand the environmental processes that
most influence or affect the particular concern. Then select the most
appropriate water quality indicators to be measured, and identify the
relevant guidelines.”
In this context, ANZECC 2000 includes discussion of the use of load-based criteria
(rather than concentration-based criteria) for nutrients and sediments as preferred
criteria for these parameters:
“Traditionally, water quality guidelines have been expressed in terms of the
concentration of the stressor that should not be exceeded if problems are to
be avoided (ANZECC 1992). Such concentration-based guidelines are
based primarily on the prevention of toxic effects. In other situations,
guidelines are better expressed in terms of the flux or loading (i.e. mass per

CRC CARE Technical Report no. 37 33
Flux-based groundwater assessment and management
unit time), rather than concentration. While algal growth rate (or
productivity) is related to the concentration of key nutrients in the water
column, the biomass is more controlled by the total mass of these nutrients
available to the growing algae…Load-based guidelines are applicable also
for assessing the effects of sedimentation of suspended particulate matter
in smothering benthic organisms. Both the rate of sedimentation and the
critical depth of the deposited material are load-based.”
The use of load-based criteria is also described in volume 1, section 3.3.2.8 of
ANZECC 2000, and volume 2 details several case studies describing the development
and use of load based criteria in Australia, including:
Case study 4 (presented in volume 2, section 8.3.2.1): describes the
establishment of sustainable nutrient loads for standing waterbodies across the
Murray-Darling basin. Phosphorus loading was identified as the key stressor for
increasing the probability of algal blooms. Trigger values (expressed as
sustainable phosphorus loads, or mass discharge) were developed for each of the
critical water bodies throughout the basin based on a management target for algal
bloom frequency, and site-specific observed relationships between phosphorus,
chlorophyll a concentrations, and algal bloom frequency.
Case study 5 (presented in volume 2, section 8.3.2.1): describes the
establishment of a process for defining sustainable particulate loads for rivers
across the Australian Capital Territory, in which the target is to avoid adverse
effects on benthic macro-invertebrates due to sedimentation. A sedimentation rate
of <2 millimetres/year was identified as a management target. Based on this target
and site specific data for a specific river reach, modelling can be undertaken to
estimate a sustainable sediment load, or mass discharge, for the specific
river reach.
The discussion of non-concentration based criteria within ANZECC 2000 supports the
utilisation of flux-based criteria for groundwater management, where it can be
demonstrated that such criteria are appropriate and relevant to protect environmental
values.
4.2.2 Guidelines for Groundwater Protection in Australia, 2013
Guidelines for groundwater protection in Australia (ARMCANZ & ANZECC 1995) were
initially published in 1995 to provide a framework for jurisdictions to develop
groundwater protection policies (discussed in more detail in section 4.3 below). This
document was superseded in 2013 by GGPA 2013. These updated guidelines specify
that they:
“should primarily be used by government agencies developing legislation
and policies regarding groundwater management and developing
groundwater quality protection plans”
Although it is noted that few jurisdictions have modified their policies since the release
of this updated guideline.
To this end, GGPA 2013 discusses potential beneficial uses of groundwater which
should be protected. These include uses for which groundwater may be extracted or
otherwise utilised, and a requirement to protect and maintain ecosystems (including
subterranean ecosystems within aquifers themselves, such as stygofauna).

CRC CARE Technical Report no. 37 34
Flux-based groundwater assessment and management
GGPA 2013 references other documents within the NWQMS in which numerical,
concentration-based criteria protective of these beneficial uses have been developed
(e.g. ADWG 2011 and ANZECC 2000). There is no specific mention of the use of flux
concepts or measurements within GGPA 2013.
It should be noted that the protection of all potential beneficial uses (e.g. maintaining
groundwater quality such that an abstraction bore of unknown specifications could be
placed at any location) will often require concentrations to remain below criteria
throughout the aquifer, and in this context flux measurements may be of limited value
in demonstrating that beneficial uses are maintained at all locations.
However, GGPA 2013 emphasises that a risk-based approach should be adopted:
“the key objective of adopting a risk-based approach is to guide investment
in groundwater quality protection that is commensurate with the level of risk
to the assigned Environmental Value for the groundwater system.”
On this basis, an approach which takes into consideration the practical limits to
groundwater remediation, and the likelihood that certain beneficial uses could be
realised is in accordance with this principle. The use of flux measurements, as detailed
in this guideline, may support such an approach.
4.2.3 Australian Drinking Water Guidelines, 2011
The Australian Drinking Water Guidelines, 2011 (ADWG 2011) define acceptable
concentrations of a range of potential contaminants (and other water quality
parameters) in drinking water. The use of flux measurements is not directly referenced
in ADWG 2011, however the criteria are defined to be applicable at the consumer’s tap,
after water treatment. Therefore flux measurements may be relevant to estimating
concentrations in abstracted groundwater (for example, by predicting concentrations at
a defined abstraction point and/or accounting for the extraction rate together with the
mass flux, as described in section 6.1).
4.3 State and territory groundwater policies and guidance
Environment protection is generally managed by state and territory based
environmental protection agencies or environment departments. The states and
territories have developed groundwater protection policies to enforce groundwater
protection in general accordance with the NWQMS (although as detailed above, the
NWQMS framework for groundwater protection has been recently updated and these
updates are yet to be carried through to state and territory policies). The state and
territory policies vary, and reference should be made to the relevant policy for the
relevant jurisdiction.

CRC CARE Technical Report no. 37 35
Flux-based groundwater assessment and management
5. How to measure mass flux and mass discharge
This section provides an overview of the methods, tools and calculations which can be
used to measure groundwater flux, mass flux and mass discharge. Further detail has
been provided in Appendix A.
5.1 Data required
As outlined in section 2.1.2, mass flux can be calculated as follows:
J = q x C = K x i × C where
J = mass flux (e.g. mg/m2/d)
q = groundwater flux, volume/area/time (e.g. m3/m2/d or m/d)
K = saturated hydraulic conductivity, distance/time (e.g. m/d)
i = hydraulic gradient, dimensionless (e.g. m/m), and
C = contaminant concentration, mass/volume (e.g. mg/m3 or µg/L)
Therefore, to calculate the mass flux, the following parameters should be measured in
the field or estimated through modelling:
saturated hydraulic conductivity (K)
hydraulic gradient of the groundwater (i)
contaminant concentration in groundwater (C), and
area over which the measurements or estimates are made (transect).
Whilst contaminant concentrations are typically obtained from groundwater sampling
and laboratory analysis, obtaining K and the hydraulic gradient of the groundwater can
be both more complicated technically and associated with increased uncertainty. In
addition, the area over which the mass flux is measured or calculated is an important
parameter. Potential uncertainties associated with estimating the area need to be
recognised and accounted for. As there are a variety of methods that can be used to
obtain these values, and a wide spectrum in the level of effort required to undertake
these methods, the selection of a methodology should be goal specific.
Gathering data at sufficient density to be helpful has a financial and temporal cost. The
use of resources in gathering such data should be weighed against other site
constraints. In order to do this, in accordance with the ASC NEPM, the data quality
objectives (DQO) process relating to the use of mass flux or a mass discharge estimate
should be adopted such that an appropriate method with sufficient data density is used.
For brevity the DQO process is not covered in this guideline, but can be found in the
ASC NEPM schedule B2 Section 18 as well as in the US EPA DQO guidance (2000).
To guide the reader in the likely level of data density required in a variety of scenarios
the ITRC working group has compiled the indicative relative data density needed for
the use of mass flux data across a variety of applications, reproduced for convenience
in Table 6. ITRC noted that data densities are only intended to provide a relative frame
of reference and to make it clear that different objectives require different data, rather
than to specifically recommend the quantity of data to be gathered (which will be site
specific).

CRC CARE Technical Report no. 37 36
Flux-based groundwater assessment and management
Table 6 Relative data density required for particular applications of mass flux data (Adapted from
ITRC 2010).
Remedial applications Mass flux data use Relative data
density needed
To determine whether
active remediation is
required
Estimate source strength Low
Estimate plume stability High a
Estimate balance between mobile
contaminant mass and natural attenuation
capacity of a plume
Medium to High a
Evaluate risk to
groundwater receptor(s)
Estimate risks and exposures at various
points of potential exposure
Low to Medium
Select appropriate
remedial technology
Determine remedial action objectives Low to High b
Determine appropriate remedial
technology(ies) for source and/or plume
treatment
Low to High b
Develop or optimise
remedial design
Evaluate heterogeneities in source
architecture
High
Estimate source strength reductions
necessary to change to alternate methods
(e.g. MNA)
Low
Estimate distribution of contaminants
relative to transmissive zones
High
Evaluate remedial
performance
Compare actual mass removal to design Low to High b
Evaluate compliance or
long term monitoring
Determine mass discharge or flux limits to
achieve remedial goals
Low to Medium
a If using multiple plume transects b Depending on system design and treatment volume(s)
5.2 Data collection methods
At a conceptual level, there are two fundamentally different ways to collect mass flux
data in the field. Point scale techniques include the use of conventional sampling
methods or passive flux meters, and are characterised by taking measurements at
discrete points in space and time. In contrast, integral methods include collecting data
from wells that are screened to be representative of the groundwater in a particular
region of the aquifer, and therefore delineate plumes based on average concentrations.
There are four general methods for estimating mass flux and mass discharge in the
field, namely:
Conventional sampling methods, which allow vertical delineation through the use
of nested or clustered wells where individually installed monitoring wells within
individual or adjacent boreholes are sampled using low-flow methods (point-scale).
Transect methods, an established method to sample the width and depth of the
plume at a control plane across the contaminant plume (point scale).

CRC CARE Technical Report no. 37 37
Flux-based groundwater assessment and management
Passive flux meters (PFMs), a more novel technology comprising permeable sock-
like structures that are placed in well screens forming a transect to obtain
simultaneous chemical mass and groundwater flux data (point scale).
Well capture/pump test methods, including well capture, integral pump test (IPT),
modified integral pump test (MIPT) and tandem circulating wells (TCW) (integral).
In addition to collecting new data, the historical data from existing monitoring well
networks can be used to estimate mass flux and mass discharge through the use of
transects based on isocontours. Potentiometric contour maps can be used to obtain
hydraulic gradient and groundwater flux data, allowing the calculation of mass
information from existing data.
Similarly, solute transport models, e.g. BIOSCREEN and REMChlor, can be used in
isolation or in conjunction with the above methods to calculate mass flux and mass
discharge associated with groundwater contamination.
If site constraints do not allow the transect to be perpendicular to the groundwater flow
direction, trigonometry can be used to calculate the perpendicular component of the
mass flux or mass discharge. However this technique should only be used when other
options have been exhausted, as it can introduce further uncertainty.
In order to assist the reader in choosing the appropriate data collection method for their
site, the principles behind these methods, their application to estimate mass flux, as
well as their advantages, limitations, and inherent assumptions are discussed in further
detail in Appendix A.
Additional field methods have recently been developed to assess sites with complex
hydrogeologic settings, such as fractured and karst bedrock. These settings pose
substantial technical challenges both for characterisation and remediation. Background
information and appropriate methods to measure mass flux and mass discharge in
these scenarios are presented in Appendix B. Combining mass flux measurements
with existing data can greatly improve the CSM at these complex sites and improve the
ability to manage risks associated with contaminated groundwater. One such
advancement is the fractured rock passive fluxmeter (FRPFM).
5.3 Uncertainty
As with any field measurement (including concentration-based data), mass flux and
mass discharge estimates carry elements of uncertainty associated with the methods
used to derive them and the complexity of the site. As part of the data collection
design, it is necessary to determine the acceptable level of uncertainty for the intended
application of the mass flux and/or discharge information, and how this can be
managed. It should be noted that expressing and adequately managing the level of
uncertainty in the mass flux data can be a key factor in attaining regulatory approval.
The magnitude of uncertainty will be driven by:
site-specific elements, such as contaminant properties and risks to potential
receptors, and
project-specific elements, such as the budget, phase of the project, and the
experience assessors have with mass flux estimates.

CRC CARE Technical Report no. 37 38
Flux-based groundwater assessment and management
Key factors that may contribute to the level of uncertainty associated with a mass flux
and/or mass discharge estimate include:
mass discharge estimates may span many orders of magnitude
sampling density
subsurface heterogeneity, and
assumptions regarding groundwater flow direction.
More detailed discussion on the sources of uncertainty for each measurement
technique, methods for estimating uncertainty, and suggested mitigation measures are
presented in Appendix A.

CRC CARE Technical Report no. 37 39
Flux-based groundwater assessment and management
6. Deriving mass flux and mass discharge metrics to
manage groundwater contamination
In addition to the practical uses for mass flux in managing groundwater contamination
presented in section 3, mass flux data can be utilised to develop site specific
management (or clean-up) criteria. Regulatory input is essential to identifying whether
mass flux and discharge approaches are likely to be acceptable.
Often management (or clean-up) criteria are based on agreed concentration criteria
that are then used to calculate the mass discharge for a particular site under a
particular scenario. Along with being helpful in achieving remediation and site closure
objectives, mass discharge metrics can also aid in conducting hypothetical exposure
scenario modelling, and in demonstrating the likely remedial works that would be
required to achieve remediation or site closure.
This section provides information on the practical aspects of utilising mass flux data to
develop site-specific management criteria, and includes the three specific scenarios of
groundwater extracted for beneficial use, groundwater discharging into a surface water
body, and special consideration for sensitive receptors. Each of these scenarios is
illustrated with worked examples, and also within case study 1.
In order to assist the reader in successfully communicating their mass flux and mass
discharge data to their stakeholders, this section also features information on the
effective presentation of flux data.
6.1 Developing mass flux and mass discharge metrics for
groundwater extracted for beneficial uses
If the use of groundwater involves pumping at a certain minimum extraction rate (e.g.
potable, irrigation, stock, swimming pool make up, or industrial use), localised
contamination that exceeds the use concentration-based criterion may be acceptable if
the source mass discharge is such that the use criteria will not be exceeded when the
extraction rate is taken into account. In this case the formula for the maximum
acceptable discharge could be based on (CRC CARE 2014):
Mass discharge < (concentration criterion for use) x (extraction rate)
The above formula is based on the framework developed by Einarson and Mackay
(2001) for using mass discharge to assess risk and prioritise sites by considering the
interaction of a contaminant plume with a down-gradient water supply well. Mass
discharge can be used to estimate the resulting exposure concentration in water
produced from the well, according to the following formula:
Csw = Md/Qsw where
Csw = contaminant concentration in water from the supply well, mass/volume
(e.g. mg/L)
Md = mass discharge of contaminant form the supply well, mass/time
(e.g. mg/d), and
Qsw = pumping rate of supply well, volume/time (e.g. L/d).

CRC CARE Technical Report no. 37 40
Flux-based groundwater assessment and management
It is noted that the protection of all potential beneficial uses (e.g. maintaining
groundwater quality such that an abstraction bore of unknown specifications could be
placed at any location) will often strictly require numerical concentrations to remain
below criteria throughout the aquifer, and in this context flux measurements may be of
limited value when used in isolation. In addition, in some instances this rationale may
be considered dilution. Whilst the remediation of a site should not rely on dilution
through a water supply well, the above calculations can help to estimate potential risks
to receptors. Therefore, as discussed in section 4 it is recommended that the regulator
is consulted before adopting an approach which incorporates assumed extraction rates
into a determination of the maximum acceptable flux.
Worked example 6: Applying mass discharge to assess risks on the use of
groundwater
The mass flux and mass discharge of tetrabromoethane (TBA) and its daughter
products were quantified down-gradient of the source zone using PFMs before and
after remediation through source removal (Johnston et al 2014), with the following
details:
State regulatory authorities and the auditor were actively engaged in the works,
including early and continual communication and agreement on the preferred
approach and mass flux criteria developed for the site.
Mass discharge was used to model attenuation in the aquifer and to provide
estimates of pumped concentrations from a hypothetical well on the
site boundary.
A source zone mass discharge target of 5 g/day was back-calculated from the
irrigation water quality concentration criteria which were agreed to by
the regulator.
The derivation of the source zone mass discharge target provided an additional way
in which to assess the risk to down-gradient receptors, as this parameter is a key
indicator of the concentrations of contaminants which may leave the site. The source
zone mass discharge target became a supplementary means in which to monitor
remediation process with the goal of ultimately demonstrating that the anticipated
pumped concentrations would be below the mass discharge target and provide
another line of evidence that remedial works may cease.
The applications of mass flux concepts at this site are further detailed in the case
study (Appendix C).
6.2 Developing mass flux and mass discharge metrics when
groundwater is discharging into a receiving surface water body
If groundwater is discharged to a receiving water body, contamination that exceeds the
concentration-based criterion for protection of the receiving water body may be
acceptable if the mass discharge is low (e.g. perhaps indistinguishable from that
occurring naturally) and the water quality criterion will not be exceeded in the receiving
water body or over a short reach or mixing zone within the receiving water body.
Jurisdictions may define mixing zones differently and therefore it is useful early in the
project to ensure that mixing zone is clearly understood and consistent with relevant
jurisdictional requirements.

CRC CARE Technical Report no. 37 41
Flux-based groundwater assessment and management
In this case the formula for maximum allowable mass discharge might be based on
(CRC CARE 2014):
Mass discharge < (concentration criterion for receiving water) x (flowrate of
receiving water)
This concept may be able to be extended to determine the mass discharge given the
flowrate through a mixing zone, as is often applied when licensing discharges to
receiving water. The formulae for maximum allowable mass discharge could be
adapted in terms of the receiving water flow through the area where mixing with the
receiving water will take place (CRC CARE 2014):
Mass discharge < (concentration criterion at boundary of mixing zone) x (flowrate
through mixing zone)
Note that in assessing such situations, if the contaminants are such that they may
bioaccumulate then consideration should also be given to possible effects of
bioaccumulation in the ecosystem, as provided for in ANZECC 2000.
The effects of volatilisation in the stream reach may also be important to consider for
the mass discharge from groundwater. This involves consideration of vapour flux, not
included within this guideline. In a number of Australian jurisdictions there is a policy
requirement that the compliance point for the protection of receiving water bodies be
placed immediately up-gradient of the receiving water body. Where this is the case, it
may not be possible to adopt an approach which incorporates consideration of mixing
with the receiving water body without agreement from the regulator. However, mass
flux may still be a useful concept for modelling the likely concentrations at the
compliance point.
Worked example 7: Mass discharge of chlorinated solvents into a Danish river
Mass discharge of contaminants to surface water through groundwater has been
addressed in the European Water Framework Directive
(European Commission 2010), which requires the evaluation of all types of
contamination sources (e.g. point and diffuse) within a specific watershed in order to
assess their impact on water quality and ecosystem health. Mass discharge has
been used to prioritise sites under this framework.
Mass discharge was applied to assess the impact of a contaminant plume on a
stream in Denmark. At the site, a groundwater plume consisting of chlorinated
solvents was migrating east to ultimately intercept a stream boundary where the
plume discharged to surface water. The CSM, depicted in the figure below, illustrates
the mixing zone that is established between the zone of mass discharge along the
stream bank and stream base to the point at which the stream is mixed and the
concentration uniform. This basic model can serve as a template for many plume
discharges to streams.

CRC CARE Technical Report no. 37 42
Flux-based groundwater assessment and management
From Aisopou et al 2015
The mass discharge of TCE into the stream was measured by water samples
collected along its length. Seepage meter samplers were placed in the hyporheic
zone (the region beneath and alongside a stream bed, in which mixing of shallow
groundwater and surface water occurs) to measure TCE concentrations in
groundwater entering the stream. By measuring the stream flow during sampling
events, the mass discharge along the stream was calculated according to the
following formula:
MD = Q Cavg
In this calculation, ‘MD’ is the mass discharge, ‘Q’ is the water flow in the stream, and
‘Cavg’ is the average concentration in the stream. The stream is assumed to be
completely mixed, and therefore average concentrations were used. If the stream is
not completely mixed, then multiple samples collected across the stream may be
required or sampling further downstream where fully mixed conditions may be
achieved.
Aisopou et al (2015) modelled different discharge configurations at the same stream
in Denmark and other sites using COMSOL Multiphysics 4.3 (a 2D finite elements
tool) to predict contaminant concentrations in the stream. The mixing process of
pollutants, as well as transport, volatilisation and dilution processes, were modelled
to look at mass discharge into the stream.
Discharge may be along the stream bed or along the stream’s bank. Modelling using
different scenarios indicated that this was found to be largely determined by the
aquifer depth, hydrogeology, recharge rate, and source location. It was concluded
that a source located within 0.5 km of the stream will typically discharge through its
bank.
The models were compared with field data, and were found to provide useful
information on the risk posed by different groundwater plumes to the stream, such as

CRC CARE Technical Report no. 37 43
Flux-based groundwater assessment and management
peak concentrations, the mixing length and recommendations for location of the
point of compliance.
The approach gained regulatory approval in Denmark. Aisopou et al (2015) noted
that the approach is suitable for regulatory use and has recently been implemented
in the risk assessment tool developed by the Danish EPA in response to the EU
Water Framework Directive.
Worked example 8: Using mass discharge to estimate dilution factors in a tidal
river and derive mass discharge metrics.
Note: Contaminated sites affecting surface water bodies and coasts are usually
complex and it is critical to consider a range of environmental values applicable to
the site, including all water quality objectives such as those which may apply to
benthic organisms (See ANZECC 2000). Wilful discharge of contaminants into river
systems and groundwater is prohibited by law. Dilution factors in this example are to
show that flux concepts are useful for understanding mass discharges entering the
river system. Where feasible, this can be complementary to current methods which
roughly estimate resultant instream calculations using river and contaminated
groundwater discharge parameters. Typically, protection of groundwater quality and
benthic biota is required.
This worked example is a hypothetical scenario that has been adapted from a project
in the United States. In the Australian regulatory context, it is generally envisioned
that flux-based metrics may be used to complement concentration-based
assessments and management, not to replace them. It is expected that when a flux
approach is applied it will be used as part of a multiple lines of evidence approach,
and that there will be a comprehensive understanding of the risk levels of any
discharges to the environment. In addition, other factors relevant to regulatory
decision-making may also be present (e.g. aesthetics of foreshores, waste
management principles, prescribed levels of ecosystem protection).
In this example, two approaches are shown to understand the usefulness of the flux
concept in close proximity to the tidal river i.e. average mass discharge versus fixed
volume discharge. In Australia, water quality objectives are related to environmental
values, including the level of ecosystem protection prescribed in jurisdictions rather
than town planning context. This worked example is about dichloroethylene (DCE)
contaminated groundwater within a brownfield precinct.
Dichloroethylene (DCE) and its daughter products were identified in both the shallow
and deep aquifer at a site. Only the calculations for the shallow aquifer site is shown
here. The plumes were moving north-easterly towards a tidal river, with data
indicating the mass discharge of contaminants into the surface water.
Mass discharge into the river was evaluated using two methods:
A groundwater flow model was used to estimate groundwater flux at the river
edge and groundwater concentrations were then used to derive the mass flux,
and
Mass flux was based on concentrations in porewater and measured gradients.

CRC CARE Technical Report no. 37 44
Flux-based groundwater assessment and management
For simplicity, we will assume that there was no existing background DCE levels in
the river, nor DCE discharges from diffuse and point. In reality, it would be important
to take account of the combined effect of all discharges (and any background levels)
in order to understand the impact on the environment. We will also assume that the
contaminants are diluted in the whole section of the adjacent river i.e. length x width
x breadth. In reality, having a mixing zone across a whole stream would not be
permitted and could be unlawful. Discharges typically fan out from shorelines in the
direction of current movement (see worked example 7). The example has other
simplifications that would need to be addressed in an informed submission to
regulators. The example assumes the tide only goes out, there is no entrainment in
incoming tides, the volume of tidal exchange is the whole river depth and rather than
just the tidal prism (i.e. volume of water above the low tide level), the estuary never
experiences stratification and that full mixing rapidly occurs.
As part of the risk assessment, the dilution of the contaminants of concern (COC)
mixing with the receiving surface water (a tidal river) was calculated using two
different approaches for the shallow aquifer to understand which method would have
lower mass discharges.
1. Average mass discharge method: used to quantify dilution as DCE discharges
from shallow groundwater into the river. Mass discharge for the COCs were
identified using plume plots to quantify plume dimensions and data derived from
a site specific MODFLOW model to quantify groundwater discharge according to
plume dimensions.
Dilution factor = river flux ÷ groundwater flux
(MODFLOW: quantify discharge according to plume dimensions)
= 426,000 m3/d ÷ 22 m3/d
(considering variations in the flux at cross-sections of the plume)
= 19,363
In developing and presenting flux data and models, consider the
hydrogeological and biological regime of the river, contaminant fate, transport
and behaviour, and also outline any assumptions and uncertainties. For
example, tidal cycles.

CRC CARE Technical Report no. 37 45
Flux-based groundwater assessment and management
2. Fixed volume method: A fixed volume of groundwater was assumed to
discharge into a fixed volume of receiving surface water. This method was used
to evaluate the ‘worst case’ scenario based on discharges of groundwater into
the river during a slack stage in the tidal cycle. Discharge rates for each COC
were derived using a combination of plume plots and outputs from the
MODFLOW model. The discharge rate was converted to a volume by assuming
a fixed time period of discharge of one hour.
Dilution factor = volume of mixing zone* ÷ volume of groundwater entering river in 1 hr *mixing zones can vary, and for any particular case should be discussed with the regulator.
Volume of mixing zone = length of river section x river width x river depth = 120 m x 80 m x 0.5 m
= 4,800 m3 Dilution factor = 4,800 m3 ÷ 0.92 m3
= 5,240
A comparison of the empirical dilution calculations (groundwater concentrations ÷
surface water concentrations (accounting for annual trends, etc.)), it was found that
the average discharge method was a better fit for the shallow groundwater in this
case. This means that the mass discharge calculations was able to demonstrate that
there was less mass discharge into the river system using the average mass
discharge method (c.f. the Fixed Volume Method was a better fit for the deep aquifer
– not detailed in this worked example).
NB: as the average discharge method is based on a daily average mass discharge
rather than an hourly average mass discharge, it could be inferred that the average
discharge model had limitations in predicting environmental concentrations over
shorter times frames.
It is noted that whilst reliance on contaminant dilution in surface water is not
considered acceptable, similar calculations may be useful inputs into risk
assessments and in understanding the contaminant behaviour within the river. Mass

CRC CARE Technical Report no. 37 46
Flux-based groundwater assessment and management
discharge values were used to understand the maximum thresholds from the dilution
for each COC on an empirical basis to understand risks. For example, for DCE:
DCE water quality standard for the river: 10 μg/L
Dilution factor: 19,400
Thus, empirically, the maximum threshold for DCE in the water discharging into
the mixing zone of the river would be 194,000 μg/L (NB benthos may need to be
considered).
The measured mean concentration based on 2013 data was 210,000 μg/L to
1,400,000 μg/L, both of which exceeded the empirically derived maximum threshold
of 194,000 μg/L. Similar calculations for other COCs resulted in means less than the
empirical maximum threshold derived using mass discharge. NB: Applying annual
mean concentrations for assessing toxicants is not acceptable for substances with
acute or chronic toxicity as these criteria are typically determined over much shorter
time frames.
Tidal data indicated that peak concentrations are recorded during the flood tide.
Consideration should be given to pre-entrained contaminants that could be flushed
back upstream. At low tide, mass discharge remained high, however at this point it
started to fall. Slack conditions, where net river discharge equals zero, occurred
twice during the tidal cycle: once after high tide at the early stages of the ebb tide
and once after low tide at the early-mid stages of the flood tide. In this case, slack
conditions that occur after low tide were considered to represent the potential worst
case scenario as groundwater will discharge into a lower volume of receiving water
(a simplistic interpretation is given for demonstration purposes).
Conservative assumptions assist in addressing uncertainty. Calculations and
assumptions informed by good quality site data and a good understanding of the
hydrogeological regime is needed. This simplified example noted:
well delineated contaminant plumes
good understanding of groundwater discharges using MODFLOW Model;
river water data, which allowed the comparison of measured dilution with
theoretical calculations; and

CRC CARE Technical Report no. 37 47
Flux-based groundwater assessment and management
tidal or other data allowing the exploration of worst case impact (this would
normally need to be very detailed; for example, flushing of contaminants from a
tidal river would need to be evaluated to ensure that they will not accumulate in
the environment)
As indicated earlier, contaminated sites affecting surface water bodies and coasts
are usually complex in that a range of environmental values may need to be
considered. This requires a robust understanding of the contamination in relation to
the environmental trends and the issues affecting use of the site.
6.3 Impact on sensitive receptors
6.3.1 Risk to human health
If groundwater discharges through an area at risk of impact (such as a shoreline),
contamination may be accepted if the areal extent of exceedance does not result in an
unacceptable effect on human health. Whether the effect is acceptable or not may be
determined, for example, by the application of the process of human health risk
assessment as outlined in the ASC NEPM (schedule B4).
In such an assessment the areal extent of exceedance relevant for determining
exposure can vary. For example, in the case of health risk assessment it can be
appropriate to average the contaminant concentration over the exposure area of
interest (this might be 50 m x 50 m in the case of passive recreation, or perhaps 7 m x
7 m in the case where there is a relatively intense and continuing use) and the
discharge may be accepted if the concentration averaged over this area will not give
rise to unacceptable exposure. Assuming we are dealing with a dissolved contaminant
that does not accumulate in sediments, exposure will depend on concentration passing
through the surface and can be quantified in terms of flux through the area of interest.
In this case, the metric for the maximum allowable mass flux across the area over
which exposure occurs could be based on:
Mass flux < (average concentration over exposure area) x (flow rate through the
exposure area)
If the contaminant accumulates in sediments, additional risk assessment must be
undertaken for risks associated with sediment concentrations e.g. pica behaviour and
dermal contact rather than sole reliance on mass flux rates.
6.3.2 Risk to ecosystems
Risks to ecosystems are inherent in trigger levels for water and sediment quality in the
ANZECC Water Quality Guidelines for Fresh and Marine Waters and sediment. For
example, trigger levels for toxicants vary with the level of ecosystem protection
prescribed for the water and generally relate to the proportion of species adversely
affected. For physico-chemical stressors, the degree of departure from a reference
condition is used to indicate acceptable risk. A similar approach is adopted in terrestrial
environments for ecological risk assessment in the ASC NEPM (schedule B5a).
It is possible that this concept can be extended to determining when additional impact
on a shoreline ecosystem is acceptable, although this will depend on whether and how
the effect varies with concentration, which may not be readily quantifiable. For

CRC CARE Technical Report no. 37 48
Flux-based groundwater assessment and management
example, an additional effect will commence occurring when the concentration exceeds
the effect criterion as indicated for example in the ANZECC Water Quality Guidelines
for Fresh and Marine Waters (sections 3.1, 3.2, 3.3, 3.4 and 3.5) or local criteria
developed by States where available . If the concentration exceedance is small, then it
may be that only some additional species will be affected, whereas if the exceedance is
large many more species will be affected. The proportion of species adversely affected
is likely to rise in line with the character of the species sensitivity distribution for the
contaminant. As such, as the flux increases over an area that is significant, the
additional impact may become more significant in terms of the overall ecosystem. If the
risk relates to an indicator based on a reference approach e.g. physicochemical
stressor or biological indicator, as noted in section 3.1.4.3 of the ANZECC Guidelines
which deals with establishing reference condition, the area of interest may vary in size
from a few square metres, as in the case of a stretch of an upland stream, to a few
square kilometres, as in the case of a large seagrass bed.
In this case, the metric for the groundwater discharge giving rise to a significant effect
on an ecosystem may be able to be characterised in terms of an equation such as:
Mass flux < (concentration criterion for ecosystem effect) x (flow through the area
of significance)
As noted in section 6.2, consideration should also be given to possible effects of
bioaccumulation in the ecosystem where relevant.
It is recommended that liaison with the regulator and other stakeholders occurs to
determine the acceptability of such an approach on any given site.
6.3.3 Risk to other values
Impacts on shorelines may relate to other values such as recreation, aesthetics and
public amenity. In these cases, the affected environment may not pose a problematic
risk to human or ecological health but may be aesthetically unacceptable. Section 3.6
of schedule B1 of the ASC NEPM provides advice on some circumstances whereby
aesthetic considerations may be relevant. Jurisdictional requirements should also be
ascertained.

CRC CARE Technical Report no. 37 49
Flux-based groundwater assessment and management
7. Effective presentation of mass flux data
The presentation of mass flux and mass discharge data should be carefully considered
in order to communicate the concept and ideas effectively. Sound communication can
help engage stakeholders such as site owners, auditors or regulators so that the mass
flux data aids the decision-making process.
It is important to visualise the data in some way, and relate the mass flux and mass
discharge to 3D space, rather than presenting tables of numerical results that must be
internally visualised by the reader. Examples of visualisation techniques include:
the use of hydrogeological cross sections to plot data to show the link between the
data and the hydrogeology
examples of mass flux distribution along a transect and changes along the plume
graphical presentation of plume behaviour over time
graphics with heat-maps indicating areas of high mass flux, and
flow chart to summarise the process.
7.1 Visualising mass discharge distribution along a transect
Data collected at sites using point measurements of mass flux can be used to visualise
the contaminant flux distribution within a control plane or to consider changes that
occur in mass flux distribution either in space or time (see case study 2).
Spatial variation of mass flux can take place along the plume axis as decay rates
influence concentration or as heterogeneous flow fields influence plume behaviour.
Thus control planes along the plume centre line can be used to visualise this
information.
7.2 Heat maps
Models can be used to illustrate the heterogeneity of the subsurface and the resulting
distribution of areas of high mass flux. Heat maps such as the one in figure 8 by
Basu et al (2008) provide a useful representation of the heterogeneity at a site, and
together with concentration data, can be used to develop a similar mass flux heat map.
7.3 Visualising before-and-after data
Changes in mass flux and mass flux distribution are quite informative for both the
design and the evaluation of remedial activities (Brooks et al 2008). Contour surfaces
collected before and after remediation allowing for adequate time for plume recovery at
the control plane, can articulate processes that were effective for remediation.
In the example below, the effects of remediation through surfactant flushing was
measured using PFMs in a monitoring well transect at one site with a TCE plume. The
presentation of before-and-after mass flux data across the transect in figure 9
illustrates the order of magnitude reduction in TCE mass flux as a result of remediation.

CRC CARE Technical Report no. 37 50
Flux-based groundwater assessment and management
Figure 8 Mapping of the permeability field which impacts the source and mass flux distributions
(Basu et al 2008).
Figure 9 Presentation of the mass flux data pre- and post- remediation, demonstrating the
reduction in TCE mass flux across the transect following remediation and hence, the effectiveness
of remediation. Wells and data points from the PFMs are depicted to show the spatial resolution of the
data. Colour scale is depicted relative to the pre remedial flux measurement. (Source: CH2M).
0 10 20 30 40 50 60 70 80 90
4660
4665
4670
0 10 20 30 40 50 60 70 80 90
4660
4665
4670
Second Post Remedial Flux MeasurementOctober 2004
Pre Remedial Flux MeasurementMay 2002
-4
-3.5
-3
-2.5
-2
-1.5
-1
-0.5
0
0.5
1
1.5
2
Relative Flux
Ele
vation (
feet a
msl)
Distance along transect (feet)

CRC CARE Technical Report no. 37 51
Flux-based groundwater assessment and management
7.4 3D models
3D graphical representations of groundwater plumes can be used as a more
sophisticated data visualisation technique. In the example below, a 3D graphical
representation was developed to illustrate the change in a TCE plume as a result of
remedial actions (installation of a biobarrier), shown in figure 10. In this case mass flux,
determined through multilevel transects and a hydraulic model, was used to monitor
remedial performance.
Figure 10 Presentation of a reduction in TCE following remediation (Source: CH2M).

CRC CARE Technical Report no. 37 52
Flux-based groundwater assessment and management
8. Bibliography
Aisopou, A, Bjerg, PL, Sonne, AT, Balbarini, N, Rosenberg, L & Binning, PJ 2015,
‘Dilution and volatilization of groundwater contaminant discharges in streams’, Journal
of Contaminant Hydrology, vol. 172, pp. 71–83. Figure in Worked example 7 (p. 42)
reproduced with permission from Elsevier.
Annable, MD, Hatfield, K, Cho, J, Klammler, H, Parker, BL, Cherry, JA & Rao, PSC
2005, 'Field-scale evaluation of the passive flux meter for simultaneous measurement
of groundwater and contaminant fluxes', Environmental Science & Technology, vol. 39,
no.18, pp. 7194–7201.
Annable, MD 2010, Mass flux short course Module 2, SERDP/ESTCP, accessed 13
February 2015, <www.serdp-estcp.org/Tools-and-Training/Environmental-
Restoration/Groundwater-Plume-Treatment/Mass-Flux-On-Demand-Video/Mass-Flux-
Short-Course-Module-2/(language)/eng-US>.
Annable, MD, Brooks, MC, Jawitz, JW, Hatfield, K, Suresh, P, Rao, C, & Wood, AL
2014, ‘Flux-based site assessment and management’, in B.H. Kueper, BH, Stroo, HF,
Vogel, CM & Ward, CH (eds.) Chlorinated Solvent Source Zone Remediation, Springer
Science+Business Media, New York, USA.
ANZECC 2000, ‘Australian and New Zealand Guidelines for Fresh and Marine Water
Quality’, Australian and New Zealand Environment and Conservation Council and
Agriculture and Resource Management Council of Australia and New Zealand,
Commonwealth of Australia, Canberra, Australia.
API 2003, ‘Groundwater remediation strategies tool’, American Petroleum Institute,
Regulatory Analysis & Scientific Affairs Department, Publication No. 4730, Washington
DC, USA.
ARMCANZ & ANZECC 1995, ‘Guidelines for groundwater protection in Australia’,
Agriculture and Resource Management Council of Australia and New Zealand and the
Australian and New Zealand Environment and Conservation Council, Commonwealth
of Australia, Canberra, Australia.
Basu, NB, Rao, PSC, Poyer, IC, Annable, MD & Hatfield, K 2006, 'Flux-based
assessment at a manufacturing site contaminated with trichloroethylene', Journal of
Contaminant Hydrology, vol. 86, no. 1–2, pp. 105–127.
Basu, NB, Rao, PSC, Falta, RW, Annable, MD, Jawitz, JW & Hatfield, K 2008,
‘Temporal evolution of DNAPL source and contaminant flux distribution: Impacts of
source mass depletion,’ Journal of contaminant Hydrology, vol. 95, pp. 93–109.
Figure 8 (p. 50) reproduced with permission from Elsevier.
Basu, NB, Suresh, P, Rao, C, Pyer, IC, Nandy, S, Mallavarapu, M, Naidu, R, Davis,
GB, Patterson, BM, Annable, MD & Hatfield, K 2009, ‘Integration of traditional and
innovative characterization techniques for flux-based assessment of Dense Non-
aqueous Phase Liquid (DNAPL) sites’, Journal of Contaminant Hydrology, vol. 105, pp.
161–172.

CRC CARE Technical Report no. 37 53
Flux-based groundwater assessment and management
Beck, P & Mann, B 2010, ‘A technical guide for demonstrating monitored natural
attenuation of petroleum hydrocarbons in groundwater’, CRC CARE Technical Report
no. 15, CRC for Contamination Assessment and Remediation of the Environment,
Adelaide, Australia.
Béland-Pelletier, C, Fraser, M, Barker, J & Ptak, T 2011, ‘Estimating contaminant mass
discharge: a field comparison of the multilevel point measurement and the integral
pumping investigation approaches and their uncertainties’, Journal of Contaminant
Hydrology, no. 122, pp. 63–75.
Bockelmann, A, Ptak, T & Teutsch, G 2001, ‘An analytical quantification of mass fluxes
and natural attenuation rate constants at a former gasworks site’, Journal of
Contaminant Hydrology, vol. 53, pp. 429–453.
Bockelmann, AT, Chen, X & Jawitz, JW 2009, ‘Convergence of DNAPL source strength
functions with site age’, Environmental Science & Technology, vol. 43, no. 24,
pp. 9374–9379.
Brooks, MC, Wood, AL, Annable, MD, Hatfield, K, Cho, J, Holbert, C, Rao, PSC,
Enfield, CG, Lynch K & Smith, RE 2008, ‘Changes in contaminant mass discharge from
DNAPL source mass depletion: Evaluation at two field sites,’ Journal of Contaminant
Hydrology, no. 102, pp. 140–153.
Brooks, MC, Ki Young Cha, KY, Lynn, AL & Annable, MD 2015, ‘Screening-level
estimates of mass discharge uncertainty from point measurement methods’, Journal of
Contaminant Hydrology, vol. 177, pp. 167–182.
Brusseau, ML, Nelson, NT, Zhang, Z, Blue, JE, Rohrer, J & Allen T 2007, ‘Source-Zone
Characterization of a Chlorinated Solvent Contaminated Superfund Site in Tucson, AZ,’
Journal of Contaminant Hydrology, vol. 90, pp. 21–40.
Cai, Z, Wilson, RD, Cardiff, MA & Kitanidis, PK 2011, ‘Increasing confidence in mass
discharge estimates using geostatistical methods,’ Groundwater, vol. 49, pp. 197–208.
Chen, X & Jawitz, JW 2009, ‘Convergence of DNAPL source strength functions with
site age’, Environmental Science & Technology, vol. 43, no. 24, pp. 9374–9379.
Chen, X, Brooks, MC & Wood, AL 2014, ‘The uncertainty of mass discharge
measurements using pumping methods under simplified conditions’, Journal of
Contaminant Hydrology, vol. 156, pp. 16–26.
CRC CARE 2014, ‘Flux-based criteria for management of groundwater’, CRC CARE Technical Report no. 31, CRC for Contamination Assessment and Remediation of the Environment, Adelaide, Australia.
De Jonge, H & Rothenberg, G 2005, ‘New device and method for flux-proportional sampling of mobile solutes in soil and groundwater’, Environmental Science and Technology, vol. 39, no. 1, pp. 274–282.
Devlin, JF & McElwee, CD 2007, ‘Effects of measurement error on horizontal hydraulic gradient estimates’, Ground Water, vol. 45, no. 1, pp. 62–73.
Dietze, M & Dietrich, P 2011, ‘A field comparison of BTEX mass flow rates based on integral pumping tests and point scale measurements,’ Journal of Contaminant Hydrology, vol. 122, pp.1–15.
EA Engineering 2009, ‘Site Assessment – Coke Point DMCF at Sparrows Point’, Baltimore, Maryland.

CRC CARE Technical Report no. 37 54
Flux-based groundwater assessment and management
Einarson, MD & Mackay, DM 2001, ‘Predicting the impacts of groundwater contamination’, Environmental Science and Technology, vol. 35, no. 3, pp. 66A–73A.
EPAV 2014, The clean up and management of polluted groundwater, Publication 840.1, Environment Protection Authority of Victoria, Carlton, Victoria, Australia.
Falta, RW, Basu N & Rao, PSC 2005, ‘Assessing the impacts of partial mass depletion in DNAPL source zones: II. Coupling source strength functions to plume evolution’, Journal of Contaminant Hydrology, vol. 79, pp. 45–66.
Goltz, MN, Dim, S, Yoon, H & Park, J 2007, 'Review of groundwater contaminant mass flux measurement', Environmental Engineering Research, vol. 12, no. 4, pp. 176–193.
Goltz, MN, Close, ME, Yoon, H, Huang, J, Flintoft, MJ, Kim, S & Enfield, C 2009,
‘Validation of two innovative methods to measure contaminant mass flux in
groundwater’, Journal of Contaminant Hydrology, vol. 106, no. 1-2, pp. 51–61.
Hatfield, K, Annable, MD, Cho, J, Rao, PSC & Klammler, H, 2004, ‘A Direct Passive Method for Measuring Water and Contaminant Fluxes in Porous Media,’ Journal of Contaminant Hydrology, vol. 75, no. 3-4, pp. 155–81.
HydroGeoLogic Inc, MODFLOW-SURFACT, viewed 5 March 2015,
<www.hgl.com/expertise/modeling-and-optimization/software-tools/modflow-surfact/>.
ITRC 2002, Passive diffusion bag (PDB) samplers, Interstate Technology & Regulatory
Council, Washington, DC, USA.
ITRC 2004, Strategies for monitoring the performance of DNAPL source zone remedies, Interstate Technology & Regulatory Council, Washington, DC, USA.
ITRC, 2008, Enhanced attenuation: chlorinated organics- EAC0-1, Interstate Technology & Regulatory Council, Washington, DC, USA.
ITRC 2010, Use and measurement of mass flux and mass discharge, Interstate Technology & Regulatory Council, Washington, DC, USA.
Jarsjö, J, Bayer-Raich, M & Ptak, T 2005, ‘Monitoring groundwater contamination and
delineating source zones at industrial sites: Uncertainty analysis using integral pumping
tests,’ Journal of Contaminant Hydrology, vol. 79, no. 3–4, pp. 107–134.
Johnston, CD 2010, ‘Selecting and assessing strategies for remediating LNAPL in soil and aquifers’, CRC CARE Technical Report no. 18, CRC for Contamination Assessment and Remediation of the Environment, Adelaide, Australia.
Johnston, CD, Davis, GB, Bastow, TP, Annable, MD, Trefry, MG, Furness, A, Geste, Y, Woodbury, RJ, Rao PSC & Rhodes, S 2013, ‘The use of mass depletion-mass flux reduction relationships during pumping to determine source zone mass of a reactive brominated-solvent DNAPL’, Journal of Contaminant Hydrology, vol. 144, pp. 122–137.
Johnston, CD, Davis, GB, Bastow, TP, Woodbury, RJ, Rao, PSC, Annable, MD & Rhodes, S 2014, ‘Mass discharge assessment at a brominated DNAPL site: effects of known DNAPL source mass removal’, Journal of Contaminant Hydrology, vol. 164 pp.100–113.
Kavanaugh, M, Deeb, R & Hawley, E 2011, Diagnostic tools for performance
evaluation of innovative in-situ remediation technologies at chlorinated solvent-
contaminated sites, Final Report for ESTCP Project ER-200318; Environmental
Security Technology Certification Program.

CRC CARE Technical Report no. 37 55
Flux-based groundwater assessment and management
Klammler, H, Hatfield, K, Luz, JAG, Annable, MD, Newman, M, Cho, J, Peacock, A, Stucker, V, Ranville, J, Cabaniss, S & Rao, PS 2012, ‘Contaminant discharge and uncertainty estimates from passive flux meter measurements’, Water Resources Research, vol. 48, pp. 1–19.
Kübert, M & Finkel, M 2006, ‘Contaminant mass discharge estimation in groundwater based on multi-level point measurements: a numerical evaluation of expected errors’, Journal of Contaminant Hydrology , vol. 84, no. 1–2, pp. 55–80.
MacKay, DM, Einarson, MD, Kaiser, PM, Nozawa-Inoue, M, Goyal, S, Chakraborty, I,
Rasa, E & Scow, KM 2012, ‘Mass discharge in a tracer plume: evaluation of the
Theissen polygon method’, Ground Water, vol. 50, no. 6, pp. 895–907.
Martin, H, Patterson, BM & Davis, GB 2003, ‘Field trial of contaminant groundwater
monitoring: Comparing time-integrating ceramic dosimeters and conventional water
sampling’, Environmental Science & Technology, vol. 37, no. 7, pp. 1360–1364.
McKnight, US, Funder, SG, Rasmussen, JJ, Finkel, M, Binning, PJ & Bjerg, PL 2010,
‘An integrated model for assessing the risk of TCE groundwater contamination to
human receptors and surface water ecosystems’, Ecological Engineering, vol. 36, no.
9, pp. 1126–1137.
MIKE powered by DHI, FEEFLOW, viewed 5 March 2015,
<www.mikepoweredbydhi.com/products/feflow>.
NEPC 2013, National Environment Protection (Assessment of Site Contamination)
Measure 1999, 2013 amendment, National Environment Protection Council, Australia.
NHMRC 2011, Australian Drinking Water Guidelines, 2014 update, National Health and
Medical Research Council, National Resource Management Ministerial Council,
Commonwealth of Australia, Canberra, Australia.
NHMRC 2013, Guidelines for groundwater protection in Australia, National Health and
Medical Research Council, National Resource Management Ministerial Council,
Commonwealth of Australia, Canberra, Australia.
Nichols, E, & Roth, T 2004, ‘Flux redux: using mass flux to improve cleanup decisions’,
L.U.S.T.Line, 46, New England Interstate Water Pollution Control Commission, Lowell,
Massachusetts, USA.
NSW DEC 2007, Guidelines for the Assessment and Management of Groundwater
Contamination, New South Wales Department of Environment and Conservation,
Sydney, Australia.
Padowski, JC, Rothfus, EA, Jawitz, JW, Klammler, H, Hatfield, K & Annable, MD 2009,
‘Effect of passive surface water flux meter design on water and solute mass flux
estimates’, Journal of Hydrologic Engineering, vol. 14, no. 12, pp. 1334–1342.
Patterson, BM, Cohen, E, Prommer, H, Thomas, DG, Rhodes, S & McKinley, AL 2007,
‘Origin of a mixed brominated ethene groundwater plume: contaminant degradation
pathways and reactions’, Environmental Science and Technology, vol. 41, pp. 1352–
1358.
Ptak, T & Teutsch, G 2001, ‘An Analytical Quantification of Mass Fluxes and Natural
Attenuation Rate Constants at a Former Gasworks Site’, Journal of Contaminant
Hydrology, vol. 53, no. 3-4, pp. 429–53.

CRC CARE Technical Report no. 37 56
Flux-based groundwater assessment and management
Quinnan, JA, Curry, PJ, Welty, NRH & Payne, FC 2012, 'Correlating hydrofacies and
permeability to improve mass flux estimates', Battele Eighth International Conference
on Remediation of Chlorinated and Recalcitrant Compounds, , Monterey, California,
21–24 May 2012.
Rein, A, Bauer, S, Dietrich, P & Beyer, C 2009, ‘Influence of temporally variable
groundwater flow conditions on point measurements and contaminant mass flux
estimations’, Journal of Contaminant Hydrology, no. 108, pp. 118–133.
Rio Tinto 2012, Argyle Diamonds – The Belmont Story, submission for the Golden
Gecko Awards.
Rivett, MO, Dearden, RA & Wealthall, GP 2014, ‘Architecture, persistence and
dissolution of a 20 to 45 year old trichloroethene DNAPL source zone’, Journal Of
Contaminant Hydrology, vol. 170, pp. 95–115.
Schwede, RL & Cirpka, OA 2010, ‘Stochastic evaluation of mass discharge from
pointlike concentration measurements’, Journal of Contaminant Hydrology, vol. 111,
no. 1–4, pp. 36–47.
Simunek, J, Sejna, M & van Genuchten MT, Hydrus-1D, PC Progress, viewed 5 March
2015, <www.pc-progress.com/en/Default.aspx?hydrus-1d>.
South Australia Environment Protection Authority 2009, Site Contamination: Guidelines
for the assessment and remediation of groundwater contamination, SA EPA, Adelaide,
Australia.
Troldborg, M, Nowak, W, Tuxen, N, Bjerg, PL, Helmig, R & Binning, PJ 2010,
‘Uncertainty evaluation of mass discharge estimates from a contaminated site using a
fully bayesian framework’, Water Resources Research, vol. 46, no. 12, pp. 1–19.
US EPA 2000, Data quality objectives process for hazardous waste site investigations,
United States Environmental Protection Agency, Washington, DC, USA.
Verreydt, G, Bronders, J, Van Keer, I, Diels, L & Vanderauwera, P 2010, ‘Passive
samplers for monitoring VOCs in groundwater and the prospects related to mass flux
measurements’, Ground Water Monitoring Remediation, vol. 30, no. 2, pp. 114–126.
Verreydt, G, Annable, MD, Kaskassian, S, Van Keer, I, Bronders, J, Diels, L &
Vanderauwera, P 2013, ‘Field demonstration and evaluation of the Passive Flux Meter
on a CAH groundwater plume’, Environmental Science and Pollution Research, vol. 20,
no. 7, pp. 4621–4634.
Wheeldon, JG 2008, 'An evaluation and implementation guide for current groundwater
mass flux measurement practices', Thesis, Air Force Institute of Technology, USA.
Zeru, A & Schäfer, G 2005, ‘Analysis of groundwater contamination using
concentration time series recorded during an integral pumping test: bias introduced by
strong concentration gradients within the plume’, Journal of Contaminant Hydrology,
vol. 81, pp. 106–24.

CRC CARE Technical Report no. 37 57
Flux-based groundwater assessment and management
9. Glossary
9.1 Terms
Term Definition
Advection Mass transport caused by the bulk movement of flowing
groundwater.
Attenuation The reduction in mass, toxicity, mobility, volume or concentration of contaminants by physical, chemical and biological processes
Attenuation rate The changes in contaminants due to attenuation per unit of time. As this is a ratio, it is unit-less
Aquifer In Australia, the definition of an aquifer varies according to jurisdiction. ANZECC 2000, a national document, defines an aquifer as ‘an underground layer of permeable rock, sand or gravel that absorbs water and allows it free passage through pore spaces.’
Beneficial use Uses which should be protected, including the maintenance
of ecosystems, human health, buildings and structures,
aesthetics and production of food, flora and fibre.
Bio-degradation The chemical dissolution of contaminants by bacteria, fungi,
or other biological means.
Contaminant Any chemical existing in the environment above background
levels and representing, or potentially representing, an
adverse health or environment risk.
Diffusion Migration of substances by natural movement of their particles. Migration of chemicals along a concentration gradient in accordance with Fick’s Law.
Dispersion Irregular spreading of solutes due to aquifer heterogeneities
at pore-grain scale (mechanical dispersion) or at field scale
(macroscopic dispersion).
Flux The rate of flow of fluid, particles, or energy through a given
surface.
Ganglia Isolated disconnected globules of LNAPL trapped within pore spaces.
Groundwater flux The velocity (speed and direction) of groundwater through a
defined cross-sectional area located perpendicular to the
mean direction of groundwater flow
Hydraulic conductivity A coefficient of proportionality describing the rate at which
water can move through a permeable medium.
Hydraulic gradient The change in total head with a change in distance in a given
direction.
Hydraulic head The height to which water rises in a bore. It is the resting
groundwater level.
Hyporheic zone The region beneath and alongside a stream bed, in which
mixing of shallow groundwater and surface water occurs.
In situ A Latin phrase that translates literally to "on site" or "in
position". It refers to remediation that occurs on the site,
without excavating the soils and removing them.

CRC CARE Technical Report no. 37 58
Flux-based groundwater assessment and management
Term Definition
Integral pumping test A field method used to obtain the necessary data to estimate mass flux and mass discharge. Multiple pumping wells perpendicular to groundwater flow are used to measure contaminant concentrations, and time series data used to back-calculate the mass discharge.
Investigation Levels The concentration of a contaminant above which further
appropriate investigation and evaluation will be required.
Isocontour Figures that are drawn by joining areas of equal water level
measurements based on available sampling points.
Mass balance assessment A quantitative comparison of the source zone mass discharge
and the plume attenuation rate. This can be used to
determine whether a plume is expanding or contracting.
Mass flux The mass of a contaminant that passes through a defined
cross-sectional area located perpendicular to the mean
direction of groundwater flow over a period of time.
Mass discharge The total mass of a contaminant moving in the groundwater
from a given source. Also referred to in literature as
contaminant mass discharge, total mass flux and integrated
mass flux.
Monitored natural
attenuation
Monitoring of groundwater to confirm whether natural
attenuation processes are acting at a sufficient rate to ensure
that the wider environment is unaffected, and that the
remedial objectives will be achieved within a reasonable time
scale.
Natural attenuation The effect of naturally occurring physical, chemical and
biological processes to reduce the mass, toxicity, mobility,
volume or concentration of contaminants in groundwater.
Passive flux meter A device used in the field to obtain the necessary data to
estimate mass flux and mass discharge. They comprise a
permeable sorbent infused with soluble tracers packed in a
nylon mesh tube.
Permeable reactive barriers An in situ remedial method which entails the emplacement of
reactive materials through which a dissolved contaminant
plume must move as it flows.
Plume A zone of dissolved contaminants in groundwater. A plume
usually originates from the source and extends in the
direction of groundwater flow.
Redox potential An expression of the oxidising or reducing power of a solution
relative to a reference potential. This potential is dependent
on the nature of the substances dissolved in the water, as
well as on the proportion of their oxidised and reduced
components.
Remediation The actions to assess or break a source-pathway-receptor
linkage and thereby manage risks associated with the
presence of contaminants in the environment.
Risk A statistical concept defined as the expected likelihood or
probability of undesirable effects resulting from a specified
exposure to known or potential environmental concentrations

CRC CARE Technical Report no. 37 59
Flux-based groundwater assessment and management
Term Definition
of a material. A material is considered safe if the risks
associated with its exposure are judged to be acceptable.
Secondary Source A concept used to describe the back-diffusion of
contaminants stored within areas of lower hydraulic
conductivity back into groundwater flowing through areas of
higher hydraulic conductivity.
Solute The minor component in a solution, dissolved in the solvent.
Solute transport model Models used to process input data relating to groundwater
flow and contaminant transport processes, and output time-
series contaminant concentration data, which can be post-
processed into contaminant mass flux data.
Sorption Process whereby contaminants in soils adhere to the
inorganic and organic soil particles.
Sorbent A material used to adsorb or absorb liquids or gases.
Source strength Mass discharge at the source zone.
Stratigraphy A branch of geology which studies rock layers (strata) and
layering (stratification).
Steady-state The non-equilibrium state of a system in which matter flows in
and out at equal rates so that all of the components remain at
constant concentrations (dynamic equilibrium).
Stygofauna Any fauna that live in groundwater systems or aquifers.
Tandem circulating wells A field method used to obtain the necessary data to estimate
mass flux and mass discharge. Two dual-screened wells are
used to one extracting water and pump it in a circular fashion.
Tracer A substance introduced into system so that its subsequent
distribution and movement may be readily followed.
Transect A path along which one collects data. Transects are usually
parallel, such as in the case of rows of groundwater bores
perpendicular to groundwater flow.
Transect methods A group of field methods used to obtain the necessary data to
estimate mass flux and mass discharge. They involve the use
of groundwater wells or multilevel samplers arranged in
transects perpendicular to the flow direction of the plume, in
order to measure contaminant concentrations and water
levels for groundwater table gradients.

CRC CARE Technical Report no. 37 60
Flux-based groundwater assessment and management
9.2 Acronyms
Acronym/symbol Definition
A Area
ADWG Australian Drinking Water Guidelines
ANZECC Australian and New Zealand Guidelines for Fresh and Marine Water
Quality
ASC NEPM National Environment Protection (Assessment of Site Contamination)
Measure 1999 (2013 amendment)
C Concentration
CH2M CH2M HILL Australia Limited
COC Contaminant of concern
CRC CARE Cooperative Research Centre for Contamination Assessment and
Remediation of the Environment
CSM Conceptual site model
CUTEP Clean Up to the Extent Practicable
d Day
DCE Dichloroethene
DER Department of Environment Regulation [Western Australia]
DNAPL Dense non-aqueous phase liquid
DQO Data quality objective
EPA Environment Protection Authority
FRPFM Fractured Rock Passive Fluxmeter
g Gram
GIL Groundwater investigation level
GGPA Guidelines for groundwater protection in Australia
GQRUZ Groundwater Quality Restricted Use Zones
i Hydraulic gradient
IPT Integral pump test
ITRC The Interstate Technology & Regulatory Council (USA)
J Mass flux
LNAPL Light non-aqueous phase liquid
m metre
Md Mass discharge
mg Milligram
MIPT Modified integral pump test
MNA Monitored natural attenuation
K Saturated hydraulic conductivity
NAPL Non-aqueous phase liquid
NRF National Remediation Framework
NWQMS National water quality management strategy
q Groundwater flux

CRC CARE Technical Report no. 37 61
Flux-based groundwater assessment and management
SA South Australia
PFM Passive flux meter
TCE Trichloroethylene
TCW Tandem circulating wells
μg microgram
US United States

CRC CARE Technical Report no. 37 62
Flux-based groundwater assessment and management
9.3 Formulae
This section provides a consolidated list of the formulae provided in the guideline. It
does not encompass all the possible formulae that may be applicable when applying
mass flux concepts. It is noted that a formula may be adapted to suit specific site
scenarios, and this section and guideline therefore aim to provide generic formulae that
can guide the reader forward.
Formula List
Groundwater flux (q) (section 2.1.1)
The product of the saturated hydraulic conductivity and the hydraulic gradient:
q = K x i – where
q = groundwater flux, volume/area/time (e.g. cubic metre (m3)/square metre
(m2)/day (d))
K = saturated hydraulic conductivity, distance/time (e.g. m/d)
i = hydraulic gradient, dimensionless (e.g. m/m)
Mass flux (J) (Section 2.1.2)
The product of the groundwater flux and contaminant concentration in a given area:
J = q × C – where
J = mass flux, (e.g. milligrams (mg)/m2/d)
q = groundwater flux, volume/area/time (e.g. m3/m2/d or m/d)
C = contaminant concentration, mass/volume (e.g. mg/m3 or µg/L)
Mass Discharge (Md) (section 2.1.3)
The integral of the spatially variable mass flux estimates across a transect multiplied
by the representative area:
where
Md = mass discharge, mass/time (e.g. g/d)
J = spatially variable mass flux
A = area of the control plane
Simplified, mass discharge can be calculated as the sum of the individual mass flux
estimates multiplied by the representative areas:
Md = J1 A1+ J2 A2+ J3 A3+ … + Jn An
As mass discharge is the product of the groundwater discharge and the contaminant
concentration, it can also be obtained directly (instead of through calculations)
through methods such as well capture and pumping tests. In these instances, mass
discharge can be divided by the cross-sectional area of the plume at the control
plane to determine the average mass flux:
_
Md/A = J
Deriving mass discharge metrics – use of groundwater (section 6.1)
CRC CARE Technical Report no. 37 63
Flux-based groundwater assessment and management
If the use of groundwater involves pumping at a certain minimum extraction rate,
localised contamination that exceeds the use criterion may be acceptable if the
source mass discharge is such that the use criteria will not be exceeded when the
extraction rate is taken into account. In this case the formula for the maximum
acceptable flux could be based on (CRC CARE 2014):
Mass discharge < (concentration criterion for use) x (extraction rate)
Deriving mass discharge metrics – impact on receiving water body (section 6.2)
If groundwater is discharged to a receiving water body, contamination that exceeds
the criterion for protection of the receiving water body may be acceptable if the mass
discharge is low (e.g. perhaps indistinguishable from that occurring naturally) and the
water quality criterion will not be exceeded in the receiving water body or over a
short reach or mixing zone within the receiving water body. In this case the formula
for maximum allowable mass discharge might be based on (CRC CARE 2014):
Mass discharge < (concentration criterion for receiving water) x (flowrate of
receiving water)
This concept may be able to be extended to determine the mass discharge given the
flowrate through a mixing zone, as is often applied when licensing discharges to
receiving water, the formula for maximum allowable mass discharge could be
adapted in terms of the receiving water flow through the area where mixing with the
receiving water will take place:
Mass discharge < (concentration criterion at boundary of mixing zone) x
(flowrate through mixing zone)
Deriving mass discharge metrics – impact on a shoreline (section 6.3)
Human health risk Assuming we are dealing with a dissolved contaminant that does not accumulate in
sediments, exposure will depend on concentration passing through the surface and
can be quantified in terms of flux through the area of interest.
In this case, the metric for the maximum allowable mass flux across the area over
which exposure occurs could be based on:
Mass flux < (average concentration over exposure area) x (flow rate through
the exposure area)
Ecological risk If the concentration exceedance is small, then it may be that only some additional
species will be affected, whereas if the exceedance is large many more species will
be affected. The proportion of species adversely affected is likely to rise in line with
the character of the species sensitivity distribution for the contaminant. As such, as
the flux increases over an area that is significant, the additional impact may become
more significant in terms of the overall ecosystem. If the risk relates to an indicator
based on a reference approach e.g. physicochemical stressor or biological indicator,
as noted in section 3.1.4.3 of the ANZECC Guidelines which deals with establishing
reference condition, the area of interest may vary in size from a few square metres,

CRC CARE Technical Report no. 37 64
Flux-based groundwater assessment and management
as in the case of a stretch of an upland stream, to a few square kilometres, as in the
case of a large seagrass bed.
The formula for groundwater discharge that may give rise to an unacceptable risk to
an ecosystem could be based on:
Mass discharge < (concentration criterion for ecosystem effect) x (flow rate
through the area of significance)

CRC CARE Technical Report no. 37 65
Flux-based groundwater assessment and management
APPENDIX A.
Methodologies to measure mass flux and/or discharge
The key methods for estimating mass flux and mass discharge for dissolved phase
contaminants introduced in Section 5 are further detailed in this appendix. These
methods include:
Transect methods
Passive flux meters (PFMs)
Well capture and pump tests, including integral pump test (IPT), modified integral
pump test (MIPT) and tandem circulating wells (TCW)
Isocontours, and
Solute transport models.
The application of these methods is discussed in further detail below, as well as their
advantages, disadvantages and assumptions associated with the methodology.
Additionally, tools and software which may be used to estimate mass flux and mass
discharge have been discussed, as have the relative uncertainties associated with both
point scale and integral methods, and how to estimate and mitigate that uncertainty.
A.1 Transect methods
Transect methods are the most established and well recognised manner in which to
derive mass flux information. They involve the use of groundwater wells or multilevel
samplers arranged in transects perpendicular to the flow direction of the plume, in
order to measure contaminant concentrations and water levels for groundwater table
gradients.
Each transect is then divided into a series of sub areas, both horizontally and vertically,
with each area representing a discrete area of mass flux, assumed to be uniform in
groundwater flux and concentration.
Data collected from these wells, both concentration and K, allow the estimation of
groundwater and contaminant mass flux (figure 11). The wells (and hence the
measurements) should preferably extend over the full width and depth of the plume
and characterise the distribution of contaminant concentrations within the plume
(API 2003).

CRC CARE Technical Report no. 37 66
Flux-based groundwater assessment and management
Figure 11 Transects can be used to estimate mass flux and mass discharge and changes with
distance from the source and towards potential receptors such as a groundwater bore or a water
body. (Adapted from CRC CARE 2014).
Contaminant concentrations are determined from measurements made at each
screened well, or multilevel point, along the transects.
In order to estimate the groundwater flux, K can be estimated by conducting pumping
tests or slug tests. A potentiometric contour map based on static water level
measurements can be used to estimate groundwater flow direction and hydraulic
gradient (API 2003). Tools such as high resolution piezocones (a type of membrane
interface probe) and hydraulic profiling tools can be utilised to provide high resolution
hydraulic head, soil type data and K (ITRC 2010). Additionally, some of these direct
push approaches can also determine contaminant concentrations and thus produce
high resolution flux profiles.
Whilst the groundwater flow is usually horizontal, estimates should consider whether
there is a significant vertical component, and if so, consider altering the transect angle
so that it remains perpendicular to groundwater flow (ITRC 2010). Fractured rock
aquifers and karst environments are lithologies that may have a significant vertical
component that requires special consideration, and this is discussed further in
Appendix B.
The key steps involved in applying a transect method to estimate the mass flux and/or
mass discharge at a site are as follows (Einarson & Mackay 2001):

CRC CARE Technical Report no. 37 67
Flux-based groundwater assessment and management
3. Characterise plume concentrations. Groundwater sampling is required to delineate
the lateral extent of the plume as well as its thickness and contaminant
distributions within the plume.
4. Characterise groundwater flow. Measurements of K and hydraulic gradient are
required for each plume transect to calculate the groundwater flux (as discussed in
section 2.1.1) and flow direction.
5. Use information in Steps 1 and 2 to select the location and spacing of plume
transects. The transects should extend across the full width and depth of the
plume, perpendicular to groundwater flow.
6. Apply interpolation method. Depending on the quantity of data points, interpolation
may be required to fill concentration and groundwater flux data points to support
mass flux calculations.
7. Calculate mass discharge through the transect by adding the contributions from
each polygon or rectangle (i.e. concentration of contaminant at polygon x
groundwater flux at polygon x area through the polygon).
Aquifers are often heterogenous, with considerable variation in groundwater flow rates.
Therefore, concentration measurements and groundwater flux estimates need to be
made at sufficiently close intervals, both vertically and horizontally, which may
necessitate a large number of closely spaced monitoring points. As discussed in
section 5.1, there are no specific rules on what constitutes an appropriate sample
density, and professional judgement along with the DQO process should be used to
determine the sample density appropriate for each field program.
Estimates of the concentration and groundwater flux at each point will need to be made
either based on direct measurement and simple interpolation, or more advanced
methods such as kriging, nearest neighbour, Thiessen polygons, or specialised
software such as the Mass Flux Toolkit (ITRC 2010). The most commonly used
method, Thiessen polygons, comprises dividing each transect into subareas
(rectangles or polygons), with lines drawn halfway between sampling points. Where
monitoring points are evenly spaced, rectangles can be used to simplify calculations.
Mass flux and mass discharge estimates are then commonly calculated using
specialised software (refer to section 5.4).
Sampling programs that sample more of the area of the transect (either through the
use of a larger number of points or through long screens that average concentrations)
will be more likely to capture the high mass flux zones (ITRC 2010). Single-level
screened wells may be useful if the plume has a limited vertical extent or the media is
relatively homogeneous. In fact, wells screened across the full depth of the plume and
pumped to provide a flow-weighted average concentration for the location can be used
to estimate the average mass discharge. Whilst this method is approximate and does
not provide detailed vertical characterisation, it may result in useful estimates and for
that reason is commonly used. For example, where the goal is to understand the mass
discharge of a contaminant across a compliance boundary or into a surface water
boundary, then an integrated measure is appropriate. However, current literature does
not always agree if this approach is appropriate. Careful consideration of the aquifer
lithology is needed prior to installing a long-screen well, to avoid potentially bridging
and connecting areas of higher K (ITRC 2010).
Moreover, the use of methodologies such as passive diffusion bags (PDB) or snap
samplers allow the collection of vertical distribution data within long screened wells.

CRC CARE Technical Report no. 37 68
Flux-based groundwater assessment and management
PDB are purpose-built low-density polyethylene bags filled with deionized water which
acts as semi-permeable membranes and are suspended in a well to passively collect
groundwater samples (ITRC 2002). PDB sampling is considered a cost-effective
means to provide vertical contaminant concentration profiles and have been used at
purposely long-screened wells to vertically profile dissolved chlorinated solvent
contamination.
A summary of the advantages and limitations of the transect method, relative to the
others discussed in section 3.2, is presented in Table 8.
Table 7: Evaluation of transect methods to calculate mass flux and mass discharge (Adapted from
ITRC 2010).
Transect methods
Advantages
Method is well established and widely documented in literature.
Easier to implement as it requires no special expertise beyond hydrogeology
Spatial information including variations across the plume obtained, unlike with pumping test methods (Section 03)
Involves direct measurement, and is an extension of accepted technology
Fewer regulatory concerns than other methods as it does not require the injection of tracers into the aquifer (such as with TCW and PFM), reinjection of contaminated groundwater (as with TCW) or contaminated groundwater extraction (as with IPT and MIPT) (Section 0)
Limitations
Large number of sampling points required for high resolution characterisation in a variable aquifer
The interpolation methods may not be robust between transects and carry some inherent uncertainties
Uncertainties may be associated with the measured concentrations, K and hydraulic gradients
Samples a relatively small volume of the groundwater, therefore localised areas with high mass flux may not be included.
Considered more expensive than integral methods
Assumptions
Groundwater samples are not highly turbid (i.e. collected through low-flow sampling methods, passive sampling or filtering samples). If a large fraction of the contaminant is sorbed to suspended solids in the groundwater samples, the mass flux calculations may be incorrect.
A.2 Passive flux meters
The PFM is a technology that comprises a permeable sorbent infused with soluble
tracers packed in a nylon mesh tube (Hatfield et al 2004). The device is placed in a
borehole or monitoring well for a known exposure period (from few days to a month),
where it intercepts the groundwater flow and causes dissolved contaminants to sorb to
the sorbent and the soluble tracers to leach out. The measurements of the
contaminants and the remaining resident tracer can then be used to estimate time-
averaged groundwater and contaminant mass fluxes. By using several passive flux
meters across a transect, the average mass flux and total mass discharge through a
control plane can be estimated (ITRC 2010).

CRC CARE Technical Report no. 37 69
Flux-based groundwater assessment and management
PFMs are generally placed in wells along a transect and screened across the vertical
extent of the contaminant plume. The PFM spacing should be based on the geology
and groundwater flow characteristics of the aquifer (Annable et al 2005), and may be
separated into different vertical zones isolated by impermeable barriers such as
rubber/neoprene washers to prevent vertical flow within the PFM and allow the PFM to
be used to assess different zones in the aquifer (ITRC 2010). The PFM should have
approximately the same diameter as the borehole or monitoring well in which it is
installed, so that the groundwater flows through the meter rather than bypassing it.
The sorbent can be varied based on the contaminant. As every sorbent has a limited
capacity to trap contaminants, estimates of contaminant concentration and
groundwater flux should be used to select the appropriate duration to avoid loading the
sorbent to capacity. It should be noted that the tracers used in the PFM are typically
alcohols, and therefore should be carefully considered in regards to the CSM (as some
tracers in certain environments could act as contaminants) and stakeholders prior to
deployment.
The extent to which traces are removed from the PFM and the contaminants are
sorbed onto the PFM is determined by:
The groundwater velocity
The affinities of tracers and contaminants to the sorbent, and
The concentration of the contaminants in the groundwater flowing through the
PFM.
When the PFM is removed, the sorbent is extracted to quantify the mass of
contaminants sorbed to it and the mass of tracer remaining. Permeability differences
between the aquifer and the PFM may cause the flow to converge or diverge near the
PFM, and this must be taken into account when determining the undisturbed aquifer
flow. It is noted that this also applies for streamlines around the monitoring well and
filter pack (Basu et al 2006). Further details regarding this method and calculations
required are detailed in ITRC (2010).
This approach is referred to as passive in contrast to methods that require the pumping
of water. This is a benefit in remote areas, where access to power may be limited, or at
sites where disposing of extracted groundwater may be problematic or expensive.
PFMs are appropriate for use in characterising plumes at depth, and have been applied
at a depth of 67 m at a landfill near Perth (Annable et al 2014).
A summary of the advantages and limitations of using PFMs to determine mass flux
and/or mass discharge, relative to the others discussed in section 3.2, is presented in
Table 8.
Table 8 Evaluation of the use of PFMs to calculate mass flux and mass discharge (Adapted from
ITRC, 2010).
Passive flux meters
Advantages
Easy to install in the field
Provides a simultaneous measure of both cumulative groundwater and contaminant mass fluxes (Hatfield et al 2004)
Gives a direct measurement of subsurface contaminant mass flux at specific monitoring locations (which the transect method does not)

CRC CARE Technical Report no. 37 70
Flux-based groundwater assessment and management
Passive flux meters
Can show variations in groundwater and mass flux over the depth of an aquifer, contributing to better spatial interpretation and characterisation of the plume
Concentration measurements may be more representative in variable field conditions, as measurements are collected over a longer term (Verreydt et al 2013)
Reduced change to hydraulic flow field than pumping methods (Martin et al 2003)
Reduced volatilisation during sampling (Martin et al 2003)
Limitations
Relatively difficult to implement as specialised expertise is required to design customised PFMs for a given site, quantify the remaining tracer and contaminant sorbed onto the PFM, and to estimate the aquifer area associated with each PFM. However, this can be subcontracted to a specialist supplier;
Considered more expensive than integral methods (Goltz et al 2007)
May not be applicable to wells that contain light non-aqueous phase liquids (LNAPL) or free product as mass flux will be over-estimated.
Does not quantify contaminants not intercepted and sorbed by the PFM
Currently better suited to quantify mass discharge in a permeable unconsolidated aquifer.
Uncertainty regarding area of aquifer associated with each PFM
Potential for tracer loss during PFM deployment (Verreydt et al 2013)
Assumptions
As with the other methods, it relies on horizontal groundwater flow without a significant vertical component
Monitoring well is in “good status,” with proper surrounding filter pack and open filter slits (<0.3 mm), with well diameter 41-80 mm. Characteristics of well and filter pack should be known to calculate the flow convergence or divergence through the well filter and PFM (Verreydt et al 2013).
Different adaptations of the PFM have been developed to make them suitable for a
variety of site conditions and to overcome some of the limitations listed above. For
example, a new type of PFM has been developed for fractured-rock applications (refer
to Appendix B for further information), and Martin et al (2003) found that using ceramic
dosimeters for the passive sampler in place of polymer membranes has the advantage
of being an inert material which does not swell in contact with organic compounds.
Similarly, the Fluxsampler obtains simultaneous measurements of groundwater flux
and contaminant concentration (De Jonge and Rothenberg 2005). It combines a single
salt tracer which is released over time and a sorptive resin (a versatile polymer) to
measure organics or an ion-exchange resin to measure nutrients and metals (Verreydt
et al 2010). It is likely less difficult to gain approval for the use of a salt tracer, however
it may be limited in the range of groundwater velocities that it can detect.
A.3 Well capture/pump test methods
There are various methods of estimating mass discharge based on pumping from
groundwater wells, including the following:

CRC CARE Technical Report no. 37 71
Flux-based groundwater assessment and management
Well capture
Integral pump test (IPT)
Modified integral pump test (MIPT), and
Tandem circulating wells (TCW).
These methods all involve pumping water from a well to collect information that is
representative of the groundwater in a particular region of the aquifer. Using the flux
averaged concentration of contaminants in the pumped water and relating this to
groundwater flow provides a measure of the mass discharge within the capture zone of
each pumping well. These methods assume that the zone of influence of the pumping
wells capture the entire plume in order to determine the plume mass discharge. The
methods generally require fairly simple calculations, as mass discharge is the product
of the groundwater flow and contaminant concentration.
These methods are aimed at quantifying the average mass flux or mass discharge
without obtaining the level of high resolution information that other techniques do (such
as transect and PFMs), and may therefore be suitable at highly heterogeneous sites
where it would be difficult to carry out other techniques.
A summary of the advantages and limitations of using well capture/pump test methods
to determine mass flux and/or mass discharge, relative to other methods discussed in
this guideline, is presented in Table 9.
Table 9 General advantages, limitations and assumptions associated with well capture/pump test
methods to calculate mass flux and mass discharge (Adapted from ITRC 2010).
Well capture/pump test methods
Advantages
Samples large quantities of plume water, improving the accuracy and integration of flow and concentration data
Less likely to miss hot-spots of contaminant mass flux in the plume
Fewer wells required
Limitations
Pumping may induce changes in the natural flow regime through the source zone, and may draw water from areas of lower K that would not otherwise contribute to the contaminant mass flux
Pumping can induce geochemical changes as it will affect the aquifer matrix as well as the groundwater quality
Uncertainties exist in extrapolating from induced-flow measurements to flux under natural flow conditions
Less spatial information compared with via point scale techniques
Difficult to determine whether all of the plume has been captured
Assumptions
As with the other methods, it relies on horizontal groundwater flow without a significant vertical component
Monitoring well is in “good status,” with appropriate size filter pack and well screen (slits <0.3 mm). Characteristics of well and filter pack should be known to perform calculations and assure adequate flow
The four well capture/pump test methods are detailed in ITRC (2010). A brief summary
of how the methods are performed and their relative advantages, limitations and
assumptions is provided in Table 10.
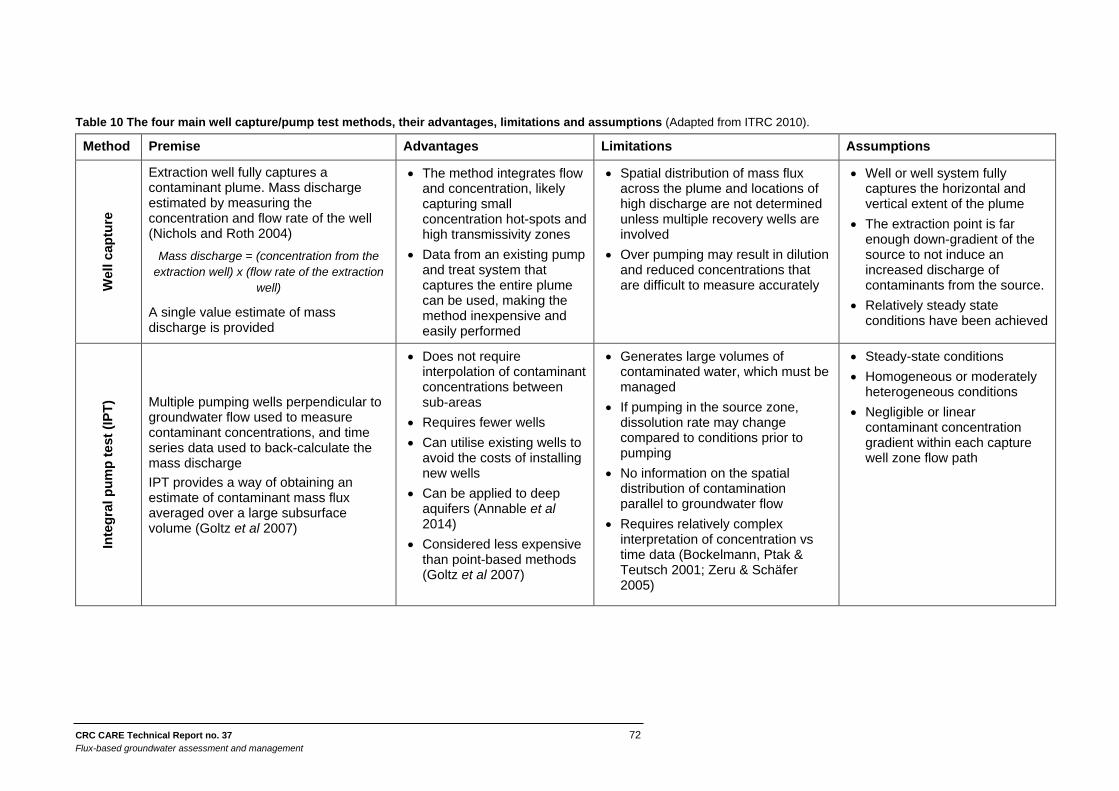
CRC CARE Technical Report no. 37 72
Flux-based groundwater assessment and management
Table 10 The four main well capture/pump test methods, their advantages, limitations and assumptions (Adapted from ITRC 2010).
Method Premise Advantages Limitations Assumptions
We
ll c
ap
ture
Extraction well fully captures a contaminant plume. Mass discharge estimated by measuring the concentration and flow rate of the well (Nichols and Roth 2004)
Mass discharge = (concentration from the
extraction well) x (flow rate of the extraction
well)
A single value estimate of mass discharge is provided
The method integrates flow and concentration, likely capturing small concentration hot-spots and high transmissivity zones
Data from an existing pump and treat system that captures the entire plume can be used, making the method inexpensive and easily performed
Spatial distribution of mass flux across the plume and locations of high discharge are not determined unless multiple recovery wells are involved
Over pumping may result in dilution and reduced concentrations that are difficult to measure accurately
Well or well system fully captures the horizontal and vertical extent of the plume
The extraction point is far enough down-gradient of the source to not induce an increased discharge of contaminants from the source.
Relatively steady state conditions have been achieved
Inte
gra
l p
um
p t
est
(IP
T) Multiple pumping wells perpendicular to
groundwater flow used to measure contaminant concentrations, and time series data used to back-calculate the mass discharge
IPT provides a way of obtaining an estimate of contaminant mass flux averaged over a large subsurface volume (Goltz et al 2007)
Does not require interpolation of contaminant concentrations between sub-areas
Requires fewer wells
Can utilise existing wells to avoid the costs of installing new wells
Can be applied to deep aquifers (Annable et al 2014)
Considered less expensive than point-based methods (Goltz et al 2007)
Generates large volumes of contaminated water, which must be managed
If pumping in the source zone, dissolution rate may change compared to conditions prior to pumping
No information on the spatial distribution of contamination parallel to groundwater flow
Requires relatively complex interpretation of concentration vs time data (Bockelmann, Ptak & Teutsch 2001; Zeru & Schäfer 2005)
Steady-state conditions
Homogeneous or moderately heterogeneous conditions
Negligible or linear contaminant concentration gradient within each capture well zone flow path

CRC CARE Technical Report no. 37 73
Flux-based groundwater assessment and management
Method Premise Advantages Limitations Assumptions
Mo
dif
ied
IP
T (
MIP
T)
A variation of the IPT, used to estimate contaminant mass flux averaged over a large subsurface volume
The groundwater flux is measured directly by measuring the head difference between pumping wells and monitoring wells when the pumping wells are pumped at different flow rates
Mass flux is calculated as the product of the groundwater flux and the average contaminant concentration at the pumping well
Simple and easily implemented, relative to TWC and IPT (Goltz et al 2007)
Avoids need for complex data analysis
Considered less expensive than point-based methods (Goltz et al 2007)
May underestimate the mass flux (Goltz et al 2009)
Generates large volumes of contaminated water, which must be managed
If pumping in the source zone, dissolution rate may change compared to conditions prior to pumping
No information on the spatial distribution of contamination parallel to groundwater flow obtained
Aquifer is confined, isotropic and homogeneous
Aquifer has a uniform thickness
Steady-state and uniform flow conditions
Ta
nd
em
cir
cu
lati
ng
we
lls (
TC
W)
Utilises two dual-screened wells, one extracting water from a lower depth and pumping it upward to inject at a shallow depth, with the second well operating in the opposite direction. This results in the water circulating between the two wells.
The hydraulic gradient is determined by the piezometric surface with the pumps turned off and a third well nearby, and the K is measured by pumping the wells and measuring head changes. Groundwater samples are collected from the wells to determine the contaminant concentration, and the mass discharge is obtained by combining the gradient, conductivity and concentration data.
Measures mass flux integrated over a large sub-surface volume
No wastewater is produced
May be more economical than IPT and MIPT for larger areas (Wheeldon 2008)
May be modified with the addition of a tracer (see below for further details).
Considered difficult to implement due to the construction of special dual-screened wells.
Data interpretation requires complex inverse modelling techniques.
Involves the reinjection of contaminated groundwater into an aquifer, so it may be difficult to gain regulatory approval (even if the aquifer is already contaminated and the groundwater is not pumped above the surface).
Acceptance of method by regulator.

CRC CARE Technical Report no. 37 74
Flux-based groundwater assessment and management
Methods such as TCW may be modified with the addition of a tracer to determine the
fractional flow between the two wells. Ideally, a tracer is conservative in that it flows
with groundwater and does not interact with contaminants nor aquifer materials.
There are many factors that should be considered in selecting a tracer including:
The hydrogeologic setting
Contaminant of interest
Chemical characteristics of tracer
Analytical detection limit
Amount of tracer needed
Cost of tracer
Toxicity of tracer
Background concentration of tracer
Availability
Cost of analytical methods, and
Ease of handling and injection.
Commonly used tracers include bromide, chloride and nitrate. Bromide is often
regarded as an ideal conservative tracer since it is usually present naturally at only
trace concentrations, it is relatively inexpensive and readily available, it is easy to
handle and mix and analytical methods are straightforward and inexpensive. In
contrast, chloride and nitrate are typically present in much higher concentrations
naturally and can have multiple possible sources, so they may not be ideal tracers in
many cases. If chloride concentrations are at similar concentrations to chlorinated
VOCs which may be degrading (i.e. shedding chloride ions), then a chloride tracer
should not be used.
A.4 Transects based on isocontours
Another method for determining mass flux and mass discharge first involves estimating
the hydraulic gradient and groundwater flow direction from a potentiometric contour
map, based on water level measurements at available sampling points.
This method also involves using data obtained from an existing monitoring well network
to construct a contour map of contaminant concentrations in groundwater across the
plume, and from this to estimate concentrations across particular transects
perpendicular to flow (Nichols & Roth 2004). The contour maps can be drawn by hand
or using computer contouring tools; both methods require hydrogeological experience
to give a reliable output. The method is similar to the transect method, however
concentration information is derived from an interpretation of existing data from wells
across the plume.
Use of isocontours based on existing data requires a sufficient number of monitoring
points. As such, the results are more reliable when the well network is dense, when the
network intercepts all or a large fraction of the contamination plume thickness, and
when data represents a flow-weighted average concentration.
A summary of the advantages and limitations of using transects based on isocontours
to determine mass flux and/or mass discharge, relative to the other methods discussed
in section 3.2, is presented in Table 11.
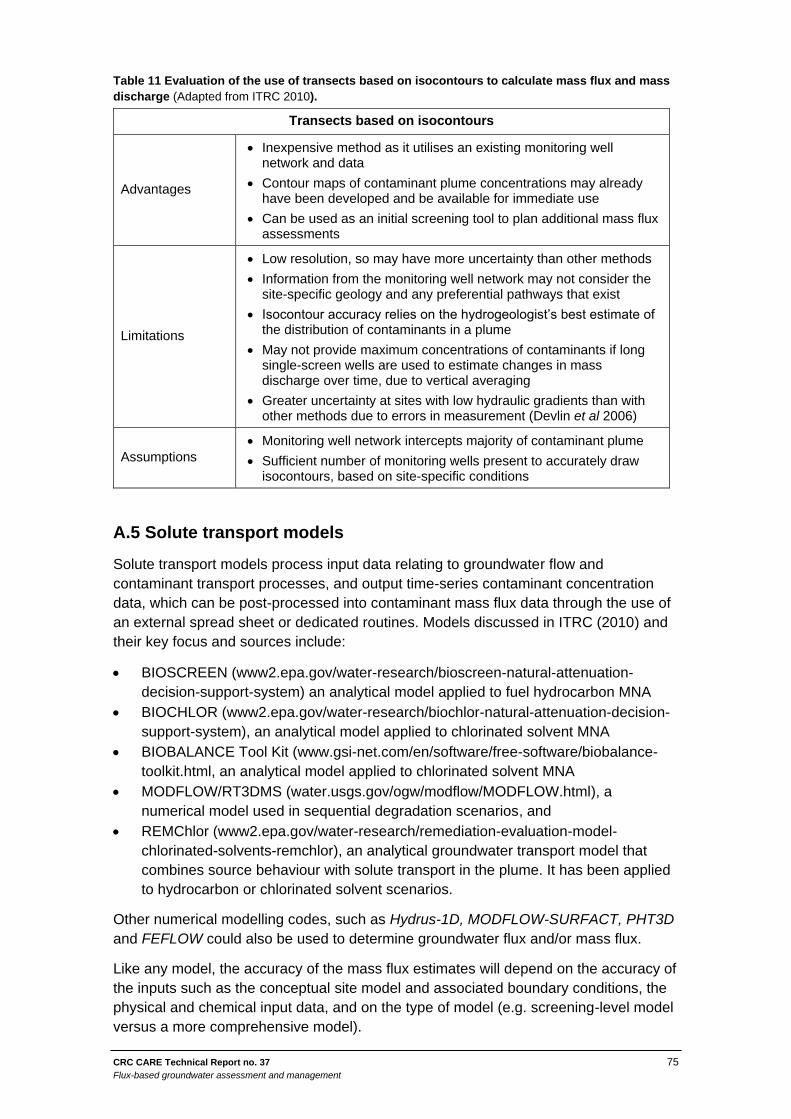
CRC CARE Technical Report no. 37 75
Flux-based groundwater assessment and management
Table 11 Evaluation of the use of transects based on isocontours to calculate mass flux and mass
discharge (Adapted from ITRC 2010).
Transects based on isocontours
Advantages
Inexpensive method as it utilises an existing monitoring well network and data
Contour maps of contaminant plume concentrations may already have been developed and be available for immediate use
Can be used as an initial screening tool to plan additional mass flux assessments
Limitations
Low resolution, so may have more uncertainty than other methods
Information from the monitoring well network may not consider the site-specific geology and any preferential pathways that exist
Isocontour accuracy relies on the hydrogeologist’s best estimate of the distribution of contaminants in a plume
May not provide maximum concentrations of contaminants if long single-screen wells are used to estimate changes in mass discharge over time, due to vertical averaging
Greater uncertainty at sites with low hydraulic gradients than with other methods due to errors in measurement (Devlin et al 2006)
Assumptions
Monitoring well network intercepts majority of contaminant plume
Sufficient number of monitoring wells present to accurately draw isocontours, based on site-specific conditions
A.5 Solute transport models
Solute transport models process input data relating to groundwater flow and
contaminant transport processes, and output time-series contaminant concentration
data, which can be post-processed into contaminant mass flux data through the use of
an external spread sheet or dedicated routines. Models discussed in ITRC (2010) and
their key focus and sources include:
BIOSCREEN (www2.epa.gov/water-research/bioscreen-natural-attenuation-
decision-support-system) an analytical model applied to fuel hydrocarbon MNA
BIOCHLOR (www2.epa.gov/water-research/biochlor-natural-attenuation-decision-
support-system), an analytical model applied to chlorinated solvent MNA
BIOBALANCE Tool Kit (www.gsi-net.com/en/software/free-software/biobalance-
toolkit.html, an analytical model applied to chlorinated solvent MNA
MODFLOW/RT3DMS (water.usgs.gov/ogw/modflow/MODFLOW.html), a
numerical model used in sequential degradation scenarios, and
REMChlor (www2.epa.gov/water-research/remediation-evaluation-model-
chlorinated-solvents-remchlor), an analytical groundwater transport model that
combines source behaviour with solute transport in the plume. It has been applied
to hydrocarbon or chlorinated solvent scenarios.
Other numerical modelling codes, such as Hydrus-1D, MODFLOW-SURFACT, PHT3D
and FEFLOW could also be used to determine groundwater flux and/or mass flux.
Like any model, the accuracy of the mass flux estimates will depend on the accuracy of
the inputs such as the conceptual site model and associated boundary conditions, the
physical and chemical input data, and on the type of model (e.g. screening-level model
versus a more comprehensive model).

CRC CARE Technical Report no. 37 76
Flux-based groundwater assessment and management
Analytical models make use of simplifying assumptions and can be more appropriate
for screening or planning purposes. However, if the simplifying assumptions are too
restrictive, then numerical model codes can be used for a wide range of problems from
screening-level evaluations to other evaluations for which greater defensibility is
warranted (e.g. remedial design).
A summary of the advantages and limitations of using solute transport models to
determine mass flux and/or mass discharge, relative to the other methods discussed in
section 3.2, is presented in Table 12. Specific information regarding individual solute
transport models should be sought to determine which one(s) is most appropriate for a
given set of modelling objectives.
Table 12 Evaluation of the use of solute transport models to calculate mass flux and mass
discharge (Adapted from ITRC 2010).
Solute Transport Models
Advantages
Using historical data, models can be used to assess trends and forecast the transport and fate of a plume, particularly following a remediation event.
Does not require a special field study. Can use existing monitoring system or historical data.
More than one model can be used to compare results
Limitations
Accuracy of mass flux data from numerical models is dependent upon the accuracy of the input data for flow and contaminant concentration, the CSM, and the selected transport formulation
Requires specialised training to develop, execute, and interpret reasonable and appropriate models that achieve the modelling objectives
Assumptions Different models are constrained by different assumptions and calculation techniques
A.6 Tools (software) to use
In addition to the solute transport model REMChlor, discussed in Appendix A, ITRC
(2010) references two key tools developed by GSI Environmental to use when
calculating and using mass flux and/or mass discharge to manage groundwater
contamination:
Mass Flux Toolkit (2011) to evaluate groundwater impacts, attenuation, and
remediation alternatives. Simple excel-based spreadsheets to calculate mass flux
and mass discharge from transect data. The user choses the interpolation method.
The software can also be used to do uncertainty/sensitivity analysis, assess
potential impacts upon wells and surface waters, and as a resource for how to use
mass flux data (from gsi-net.com/en/software/free-software/mass-flux-toolkit.html),
and
Matrix Diffusion Toolkit (2012). Uses indirect contribution of contamination sources
within low-K zones to estimate mass discharge and the mass of contaminants and
concentrations in the less transmissive zones (from www.gsi-
net.com/en/software/free-software/matrix-diffusion-toolkit-version-1-2.html).

CRC CARE Technical Report no. 37 77
Flux-based groundwater assessment and management
Along with tools for estimating mass flux, ITRC (2010) provides one tool for trend
analysis:
Mann-Kendall Toolkit (2012) for constituent trend analysis. Simple spreadsheet for
analysing time-series groundwater monitoring data to quantitatively determine if
the measured concentrations are increasing, decreasing, or stable over time (from
www.gsi-net.com/en/software/free-software/gsi-mann-kendall-toolkit.html).
A.7 Uncertainty in mass flux measurements
As discussed briefly in section 5.3, mass flux and mass discharge estimates carry
elements of uncertainty associated with the methods used to derive them and the
complexity of the site.
Key factors that may contribute to the level of uncertainty associated with a mass flux
and/or mass discharge estimate include:
Mass discharge estimates may span many orders of magnitude: both K values and
contaminant concentrations can range over six or seven orders of magnitude. In
this context, it is considered that the accuracy of mass flux or mass discharge
estimations may be acceptable for site management even with an order of
magnitude of uncertainty (ITRC 2010).
Sampling density: method uncertainty was assessed by Kubert and Finkel (2006)
by comparing both point and integral methods (e.g. PFM and IPT) using an
extensive Monte Carlo analysis on a hypothetical site. In general, uncertainty was
reduced by increasing the sampling density. As an example, the uncertainty in
mass discharge was less than 10% for all heterogeneities simulated, when a high
point density of 5 pts/m2 was employed. If this was reduced to 0.1 pts/m2 (a more
real-world sampling density), the uncertainty increased to approximately 30 to
60%. This study clearly demonstrated how uncertainty could be managed and how
multiple methods for measuring mass discharge performed based on
measurement uncertainty.
Subsurface heterogeneity: published literature to date has indicated that relatively
large uncertainties (>50%) may result from subsurface heterogeneity. At sites with
highly heterogeneous aquifers, it may not be feasible to collect enough samples to
reduce the uncertainty to an acceptable level using conventional statistical
methods. New statistical approaches are therefore needed to allow for cost-
effective determination of integrated mass flux in natural aquifers (ITRC 2010).
Moreover, it has been noted that conventional investigation methods often use
simplified conceptualisations of geology (Quinnan et al 2012), with average K
estimates for an entire cross-section or hydrostratigraphic unit. Because aquifers
often exhibit orders of magnitude variation in permeability both laterally and
vertically, this can lead to significant errors in estimation. The authors therefore
encouraged the use of high resolution characterisation methods, such as direct
push injection logging tools like the Geoprobe® Hydraulic Profiling Tool or the
Waterloo Advanced Profiling System™ (Waterloo APS).
Assumptions regarding groundwater flow direction: the majority of the methods
used to estimate mass discharge across control planes rely on wells perpendicular
to groundwater flow, however it is recognised that groundwater flow direction and
magnitude varies seasonally and with rainfall and anthropogenic factors.

CRC CARE Technical Report no. 37 78
Flux-based groundwater assessment and management
Therefore, there are additional uncertainties involved with the use of prevailing
groundwater flow direction to design studies at a given site.
The level of uncertainty in the methods presented within this guideline can roughly be
characterised by either the point-scale method or the integral method. As such the
further discussion presented below on understanding uncertainty has been arranged
according to these categories.
Following this discussion information is presented regarding estimating and then
managing uncertainty.
Understanding Uncertainty
Uncertainty in point scale methods
When applying the transect method to measure mass flux, it is noted that considerable
uncertainty is associated with mass flux calculations as they are often based on
average values of K, site wide hydraulic gradient, and flux-averaged concentrations
from wells. Each of these values can by highly variable within the aquifer and across a
control plane. If wells are used in the calculation of mass discharge based on the
transect methods, then integral values of each component are used to calculate mass
discharge (Annable et al 2014). Reducing uncertainty requires additional samples to be
taken, thereby increasing sampling and analytical costs. One study estimated that the
error involved in field sampling with multilevel transects was significantly greater than
the error in an integral pump test at the same site, and indicated that a relatively large
number of samples would be required in order to reduce the uncertainty to a
comparable level (Béland-Pelletier et al 2011).
The use of PFMs allows for greater vertical resolution and reduced uncertainty given
that the PFM is sampled continuously over the vertical profile in a well (Kubert & Finkel
2006). The transect method using PFMs still generates uncertainty in the spatial
integration of point data from the wells caused by the well spacing and unsampled
information between wells. Additional uncertainties can arise due to biostimulation and
tracer loss during deployment, and should be considered when applying this method.
Klammler et al (2012) presents novel methods for quantifying uncertainty using PFM
data collected using wells forming a control plane for mass discharge characterisation.
Li et al (2007) found that the magnitude of mass discharge affects the uncertainty of a
given sampling density. In the case of a higher mass discharge (319 g/d), a lower
sampling density (0.1 pt/m2) lead to an error of about 20%. When measuring a much
lower mass discharge (15 g/d), the lower sampling density produced 180% error and
the sampling density had to be increased to 3 pt/m2 to bring the error back to 20%.
Whilst this demonstrated that uncertainty can be managed with higher sampling
density, it is noted that the cost of such high density measurements may be prohibitive.
A recent study by Brooks et al (2015) investigated point method uncertainty using
groundwater flow and transport simulations within a Monte Carlo framework.
Uncertainty in mass discharge estimates was related to the local mass flux, local mass
discharge and the sample density.

CRC CARE Technical Report no. 37 79
Flux-based groundwater assessment and management
Uncertainty in integral methods
Goltz et al (2007) noted that when using pumping tests to assess mass discharge
information, one can reduce uncertainty by increasing the pumping rate over time.
They recommended that the pump tests start at less than the estimated natural
groundwater flow rate and monitoring continues whilst stepping up the rate until
reaching a pumping rate that completely captures the contaminated plume without
risking overcapture.
Studies focusing on integral methods have generally found that uncertainties can be
reduced with proper design of the IPT. Jarsjo et al (2005) typically found errors ranging
from 10 to 40%. Through a sensitivity analysis conducted by Dietze and Dietrich
(2011), it was determined that the mass discharge was relatively insensitive to K and
porosity. In another study, Béland-Pelletier (2011) found a maximum uncertainty of
28% for mass discharge measured by IPT.
A recent study by Chen et al (2014) evaluated uncertainty in various pumping methods
(sequential, concurrent and TCW) using Monte Carlo modelling as a function of the
contaminant plume position and width, and as a function of the pumping conditions
used in the different pumping tests. Sequential pumping was found to be 5 to 12 times
less uncertain than the other pumping approaches. For all methods, uncertainty
decreased as the plume width increased. When the plume width to well spacing ratio
was >2, it was concluded that uncertainty is similar for all the pumping methods tested.
Comparison of uncertainty in point scale and integral methods
Studies comparing the use of point scale and integral investigation methods to estimate
mass discharge have found that where the monitoring network is sparse, point scale
methods are subject to high levels of uncertainty (Li et al 2007, Li and Abriola 2009,
Mackay et al 2012). Kavanaugh et al (2011) reported field study results using a
bromide tracer injection with a known mass discharge. They report three applications of
multiple methods with error from −8% to 31%. Where there are a sufficient number of
monitoring points, given the complexity of the site, the methods have been found to be
comparable. The authors concluded that the IPT provides more reliable results where
the monitoring network is sparse, and point scale methods are more appropriate when
the contaminant plume is of homogeneous shape (a normal distribution shape) and an
adequate sampling grid is used.
A field study investigating the differences between benzene mass discharge and
groundwater flow rate estimates resulting from point scale samples and IPT were
6.44% and 6.97%, respectively, demonstrating the applicability of both methods at the
site (Dietze & Dietrich 2011).
Estimating uncertainty
Estimating the uncertainty inherent to a particular method, and integrating this estimate
into the calculations, is an important part of interpreting the mass flux data collected
and the implications for the CSM.
There are various methods for estimating uncertainty associated with mass flux
estimates, and many different supportive data analysis functions available, including:
Monte Carlo
Mann-Kendall
GSI mass flux toolkit uncertainty tests

CRC CARE Technical Report no. 37 80
Flux-based groundwater assessment and management
Wilcoxon-Mann-Whitney test
Sen’s test
Testing for distributional relationships that affect interpolation
Evaluating seasonality of the data, and
Testing for outliers.
For example, conditional simulation using geostatistical analysis techniques can be
used to analyse uncertainty in the concentration, K, and hydraulic gradient
measurements (Li et al 2007). The data mean and variance can be used to determine
what the 95% confidence level is that the mass discharge target will not be exceeded.
Joint conditional simulation of K and contaminant concentration allows the generation
of multiple, equally probable realisations of local mass flux, which can then be upscaled
to provide the probability distribution of mass discharge. An important benefit of this
approach is the quantified uncertainty of the mass discharge estimate, providing not
only the best estimate of mass discharge but also confidence intervals around that
estimate (Zuansi Cai et al 2010).
Software such as the GSI Mass Flux Toolkit (discussed in Appendix A) typically
incorporate tools with uncertainty tests to estimate uncertainties associated with the
mass flux estimates. It is noted that which methodology was used will influence
whether the inbuilt uncertainty test is appropriate for the data.
Managing uncertainty
As discussed previously, what is considered an acceptable level of uncertainty varies
depending on site and project-specific factors. General constraints in managing or
reducing uncertainty associated with mass flux and mass discharge estimates include
the following (ITRC 2010):
Cost: increased data collection and infrastructure to reduce uncertainty will
increase capital and labour costs
Application of mass flux estimates: i.e. the demonstration of MNA processes may
tolerate more uncertainty than demonstrating compliance
Phase of project: more accurate data may be required during certain phases or
tasks, justifying more sampling and infrastructure installation, and
Experience with mass flux: the experience of the project team and stakeholders
with using mass flux or mass discharge in groundwater management, and hence
the confidence they may have in the estimates.
One method to reduce uncertainty comprises the collection of additional samples to
reduce the amount of interpolation required between data points and areas lacking
data. This must be balanced with increased sampling and analytical costs.
Another method to reduce uncertainty involves sampling in stages. Li and
Abriola (2009) demonstrated that a staged sampling strategy was able to produce
results with comparable uncertainty to reducing the sampling density to 50% or less,
indicating optimised sampling strategies can be employed to reduce cost. Other
strategies to manage uncertainty include pre-characterising the site.
It should be noted that the intended use of the mass flux information will influence the
acceptable level of uncertainty. For instance, mass flux measurements intended for use
in communicating compliance to the regulator may require less uncertainty than mass
flux measurements used to support remedial design. As described in section 5.1, the
CRC CARE Technical Report no. 37 81
Flux-based groundwater assessment and management
DQO process should be used throughout the life of a groundwater contamination
project, and will assist in specifying the level of uncertainty that is acceptable to
achieve site objectives.
As has been demonstrated, uncertainty can be quantified after measurements are
completed and uncertainty can be managed through the above measures. Whilst every
method of estimating mass flux and mass discharge carries elements of uncertainty
that should be recognised and quantified, it is noted that concentration-only data may
have similar or greater levels of uncertainty.

CRC CARE Technical Report no. 37 82
Flux-based groundwater assessment and management
APPENDIX B.
Measuring water and contaminant mass flux in fractured and
karst formations
Complex hydrogeologic settings, such as fractured and karst bedrock, pose substantial
technical challenges both for characterisation and remediation. These technical
challenges lead to the need for cost-effective monitoring tools that can be used in
concert with existing borehole characterisation technologies to quantify groundwater
and contaminant flux. When such flux measurements are combined with data gathered
from other available borehole technologies, the CSM can be greatly improved and the
ability to manage risk can be enhanced.
One recent advancement in this areas in the development of the Fractured Rock
Passive Fluxmeter (FRPFM). When implemented within a fractured media formation,
the FRPFM provides measurement of the following elements (ESTCP Final Report ER-
200831; Acar et al 2013):
Presence or absence of flowing fractures
Specific location of active fractures
Flowing fracture orientation, i.e. dip and dip direction
Direction of groundwater flow in each fracture
Cumulative magnitude of groundwater flux in each fracture, and
Cumulative magnitude of contaminant flux in each fracture.
Other technologies are capable of measuring the first three elements listed, however
the FRPFM is the only technology that also measures latter three elements.
The FRPFM is designed with an inflatable core separated from upper and lower end
packers (a flexible inflatable liner) for isolation. The core consists of a packer covered
with an internal nonreactive layer of permeable mesh which is then wrapped in a
permeable layer of sorbent material such as activated carbon, ion exchange resin, or
similar material impregnated with tracers. The core is then encased in a thin external
permeable layer of dyed cloth for visualization. The core is inflated separately following
inflation of the two end packers to provide isolation. The inflated core holds the fabric
layers against the face of the borehole and any fractures intersecting that borehole. As
currently designed, the FRPFM provides high resolution characterisation over a short
characterisation zone (typically one meter).
During the deployment of the FRPFM in a borehole, visible dyes and tracers are
leached from the internal and external sorbent layers which yields complex patterns of
dye and tracer distributions. Visual inspection of the external layer leads to estimates of
flowing fractures, their location along the borehole, the number of fractures, individual
fracture orientations (dip and dip direction), cumulative groundwater flux and
groundwater flow direction. Fracture characteristics can generally be obtained through
existing borehole imaging technologies for fractures ≥1 mm; however, the technologies
do not distinguish active from inactive fractures or measure the magnitude or direction
of fracture flow. Analysis of the FRPFM internal sorbent layers at flow locations
indicated by dyes yields additional estimates of cumulative groundwater flux in
fractures and cumulative contaminant flux.

CRC CARE Technical Report no. 37 83
Flux-based groundwater assessment and management
Given the high resolution of the FRPFM data, optimum application is likely for targeted
borehole depth intervals, and not for characterising conditions over an entire borehole.
FRPFM prototypes have been tested in 100 mm and 150 mm fractured rock wells.
At the time of writing, the advancement of the PFM technologies for karst settings had
been recently initiated. The design developed for emplacement in karst cavities in rock
boreholes is based on modification of a design used previously for surface water flow
and contaminant flux measurements (Padowski et al 2009). The device is a circular
hard shell construction with ports for intake and exhaust of water similar to the surface
water applications. The interior of the device has a granular sorbent, typically activated
carbon, with impregnated tracers. This device is suspended in a karst cavity
intersected by the borehole for a duration appropriate for the estimate groundwater
velocities. These velocities can be much higher than traditional groundwater, thus
deployment durations may be shorter. The media used in the karst device can be
manipulated to optimise deployment duration. This device is currently under testing in a
limestone karst aquifer in Florida in the United States.

CRC CARE Technical Report no. 37 84
Flux-based groundwater assessment and management
Appendix C
Case study 1 – Remediation of a brominated DNAPL plume
Background
A former mineral processing facility in Belmont, Perth, which had used the dense non-
aqueous phase liquid (DNAPL) tetrabromoethane (TBA) for mineral separation, was
acquired by Argyle Diamonds in 2000. When the drainage system beneath the
laboratory was found to be corroded and leaking, investigation revealed that the
groundwater was contaminated with TBA and its daughter products, principally
tribromoethene (TBE) and dibromoethene (DBE), with lower concentrations of vinyl
bromide (VB).
Investigations indicated that the majority of the impact lay within the intermediate
aquifer comprising sands and silts (9–10 m thick), which contained two high
conductivity zones (4–6 m/d). The water table was ~3 m below ground level (mbgl) and
the gradient was approximately 0.009m/m in a north-westerly direction. The CSM1,
presented on the following page, illustrates the DNAPL and dissolved groundwater
plume as well as the pathways and receptors at the site. The primary beneficial use of
the groundwater is for irrigation of gardens and landscaping in this light industrial area,
and the key receptors were identified as people who may be exposed to contaminated
groundwater during irrigation or vapour migration to indoor or outdoor air, and
ecological receptors in the down-gradient Belmont South Drain, which drains into the
Swan River.
Argyle focused on open and regular engagement from the outset with state
government agencies (Western Australia Department of Environmental Regulation
(DER), Water Corporation and Swan River Trust (now Department of Parks and
Wildlife)) and local stakeholders. This was particularly important given the unusual
nature of the contaminants and the potential impact on neighbouring landholders.
Through a public statement in 2002, Argyle committed to prevent health effects on
neighbours and to protect the river environment. It also expressed the company’s intent
to actively remediate the site to the extent practicable.
Remediation comprised control of vapours and odours by soil vapour extraction, the
hydraulic containment and recovery of the plume and then source zone DNAPL mass
removal (mass flux reduction, as discussed in section 3.5). This case study focuses on
how mass flux and mass discharge concepts were applied to understand plume
behaviour, assess risk to irrigation workers and monitor remedial performance.
Applications of Mass Flux Concepts:
This site is an excellent example of the application of mass flux concepts in Australia,
resulting in improved characterisation of the plume as well as enabling more effective
remedial targets to be set. Examples for each of the applications discussed in section
3, are summarised as follows:
1 The CSM was prepared by Golder Associates Pty Ltd (Golder) in 2014 as part of a risk assessment carried out at the site.

CRC CARE Technical Report no. 37 85
Flux-based groundwater assessment and management
1. Enhance the CSM (section 3.2). Quarterly TBE concentration data were used to
track the dissolved TBE mass (estimated at 200–300 kg in 2003, and 110–190 kg
in 2004). Installation of additional wells in the source area in 2004 enabled initial
estimates of mass discharge, which appeared to be in the range of 10 kg/year.
Coupled with observations of decreasing concentrations (and hence mass flux) in
source area wells these mass and flux estimates informed the initial CSM
development. Mass flux estimates were also used to estimate natural attenuation
rates in situ (compared with lab determined degradation rates). Later, more
detailed measurements of mass flux using passive flux meters (PFMs) were
instrumental in identifying the correlations between permeability, the location of the
source mass and the flux of contaminants. This showed that concentration data
alone were not able to identify the main transmission routes of the contaminants in
the aquifer (and were in fact misleading). The spatial distribution of mass flux also
provided insights into depletion of the DNAPL source over time, both naturally and
under the influence of pumping.
2. Complement concentration criteria (section 3.3). PFMs, a partitioning inter-well
tracer test (PITT) in the source zone, and an integral pump test (IPT) at the site
boundary were completed in 2006–2007, immediately prior to the commencement
of remediation to complement conventional investigation methods to estimate
source mass (220 kg TBA and TBE) and quantify source mass discharge
(~40 kg/year TBE) prior to commencement of remediation. Once the success of
the source zone pump and treat system and PFMs were demonstrated, the auditor
and DER were consulted in regards to the potential use of mass flux-based
performance criteria.
3. Assist with remedy selection (section 3.4). Risk assessments and early thinking
on remedial design were both informed by the mass and flux estimates and the
results of PFM, IPT and PITT. The spatial distribution of mass flux estimates in
sub-units of the intermediate aquifer particularly enabled assessment of how
flushing technologies may have been deployed if pumping alone was not able to
reach remediation targets.
4. Optimise remedial design (section 3.5). Design initially focused on the hydraulic
containment of the plume, targeting the intermediate aquifer (with ~80% of the
mass) with pumping only at the down-gradient site boundary. Once the water
treatment process was proved in operation, including with water from the source
zone, focus shifted from plume containment to mass extraction (to drive down the
mass discharge feeding the plume). Subsequent monitoring aimed to measure
changes in mass flux across two control planes (i.e. fluxes leaving the source zone
and also across the site boundary). Results were used to inform a decision to
cease pumping at the site boundary and continue mass extraction by pumping
from the source zone.
5. Assess remedial performance (section 3.6). Once the auditor and DER
provided in-principle support for the concept, mass flux-based remediation criteria
were derived. PFMs were again used in 2011 to directly measure mass flux
reductions achieved by pumping. Source zone mass discharge was reduced by
70%, but was greater than the target so groundwater extraction continued. The IPT
was also repeated in 2014, and showed that flux across the site boundary had
been reduced by 95%. Decreasing mass discharge from the key pumping wells
was also monitored over time. Correlations between mass discharge from the
wells and the mass flux/discharge across the control planes were also used to
assess remedial performance.

CRC CARE Technical Report no. 37 86
Flux-based groundwater assessment and management
6. Demonstrate risk reduction (section 3.7). Lower mass fluxes across the down-
gradient boundary and from the source indicated a reduced risk in down-gradient
exposure scenarios. Concentration and mass discharge targets have been
developed for a hypothetical well used to extract groundwater for irrigation, as part
of the proposed approach to validate the remediation.
7. Evaluate compliance or long term monitoring (section 3.8). Mass flux-based
criteria for the source are considered to be protective of down-gradient receptors
and take account of travel time and attenuation between source and receptor.
Derivation of mass flux/mass discharge criteria:
The derivation of mass discharge criteria was used to assess risk associated with the
use of the groundwater for irrigation. The derivation example below guides the reader
through the work that was carried out and the calculations that were made, so that
these steps may be adapted to other sites using site-specific data.
Determine receptors/beneficial uses to be protected
Irrigation was identified as the primary use of groundwater, with a risk assessment
identifying persons watering local gardens and landscaped areas as the main
receptors. Whilst no irrigation bores are located in or near the plume and a restriction
has been placed on groundwater use, this is a potential use of the groundwater.
Select concentration criteria
No regulatory risk based groundwater criteria were available for TBA or its daughter
products. Risk based screening levels were developed by Golder and updated over the
course of the project to reflect new information. This culminated in site specific
remediation criteria to protect people who may be exposed to: contaminated
groundwater during irrigation (through direct contact, ingestion or vapour inhalation); or
contaminants in indoor air in the commercial premises at the site; or contaminants in
outdoor air. Criteria were conservative and did not include attenuation factors. The
remediation criteria derived were for TBA (260 μg/L), TBE (480 μg/L), DBE (52 000
ug/L) and VB (120 ug/L). For the irrigation scenario, concentration criteria were based
on an assumed groundwater extraction rate of 0.16 L/sec, and an exposure duration of
15 min/d, 3 d/wk.
Source zone mass discharge
Pump tests were undertaken to assess hydraulic conductivities and this information,
together with concentration data, were used in early estimates of the mass discharge of
contaminants from the source zone. Direct measurement of mass fluxes and discharge
were also made using PFMs in 2006 and 2011. Modelling which incorporated pump
test data, hydraulic conductivity, flow rates and contaminant concentrations was then
used to estimate mass discharge at the down-gradient site boundary, for given source
zone mass discharge.

CRC CARE Technical Report no. 37 87
Flux-based groundwater assessment and management
Mass discharge target
Mass discharge targets for the down gradient boundary, and for the source zone, were
calculated based on the concentration criteria for a hypothetical irrigation well
discharge on down gradient properties (focusing on TBE as the risk driver for this
exposure scenario). A linear correlation between the source zone mass discharge and
the down-gradient site boundary concentrations was noted from the modelling. This
was used to identify the required mass discharge target at both the source zone
(5 g/day TBA plus TBE) and the down-gradient site boundary (1.4 g/day TBE) to
achieve compliance with the derived concentration criterion for irrigation water.
Mass discharge calculations
A TBE source zone mass discharge target of 5 g/day was derived from irrigation water
quality criteria. Direct PFM measurements have only been obtained twice in the project
to date. For most quarterly monitoring events, mass discharge is calculated for each
well interval in the source zone control plane (5 nests of 3 wells) using the following
equation:
MFW = [k] × [c] × [q] × [A] – where
MFW = Mass discharge for well interval (g/day)
k = conversion factor to adjust for differing units
c = Concentration of TBE (µg/L)
q = flow rate (cm/day), and
A = Cross sectional area (m2).
Mass discharge across the flux plane is the sum of the mass discharges calculated for
each well interval in the flux plane (when there is no pumping from the source zone
extraction well, and after a suitable period for re-establishment of flux across the
control plane). Note that the two PFM measurements were used to assess the
uncertainty associated with these estimates.
Data for cross sectional area (A) is calculated using an assumed width and interpreted
depth for each well. The width is the assumed effective width of the well which is from
the mid-point to mid-point between adjacent flux plane wells. The depths have been
interpreted from borelogs and cross sections for the flux plane wells.
Flow rate (q) was established through PFM testing. Alternatively the flow rate can be
calculated using the interpreted hydraulic gradients and hydraulic conductivities.
q = [K] × [i] – where
K = hydraulic conductivity (m/day)
i = hydraulic gradient (dimensionless)
Data for K estimated from slug tests for each well and from analysis of pump test data.
Data for i estimated from water level data.
Compare mass discharge measurements with derived targets
The mass discharge of dissolved brominated organics across the source zone control
plane decreased from 104 g/day to 30 g/day following one year of groundwater

CRC CARE Technical Report no. 37 88
Flux-based groundwater assessment and management
extraction from the source zone (2008–9) and two years natural flux to 2011.
Therefore, the source zone mass discharge exceeded the target mass discharge,
indicating that downgradient groundwater would not be suitable for irrigation use, and
remediation should continue.
After a further three years groundwater extraction, a second IPT was performed in late
2014 to measure the flux across the downgradient site boundary. This showed a TBE
flux of 0.5–0.7 g/day (total BrVOC flux of 1 g/day), significantly less than the
established target of 1.4 g/day, and 95% lower than that measured in 2007. As a result,
a decision was made to terminate pumping on the boundary, but continue pumping the
source zone well.
Advantages of mass discharge/flux
The contaminant plume at this site is quite narrow, with steep concentration gradients
at the periphery. The plume is also dynamic, with its location relative to monitoring
wells varying over time in response to recharge and pumping, including the
groundwater extraction for remediation. This results in highly variable point
concentration measurements from some monitoring wells. Mass discharge
measurements allow for more reliable assessment and management of risk, since it
gives a whole of plume view, and smooths the often extreme variability of point
contaminant concentrations. Understanding the mass discharge allows for greater
understanding of the site within the CSM and acts as a better predictive tool for
remediation performance.
Acknowledgement
The above work is the result of a collaboration between Argyle Diamonds, Rio Tinto,
Golder (Lead Consultant) and CSIRO.

NOTES
? ? ? ? ? ? ? ? ? ? ? ? ??
? ??
? ? ? ??
? ? ? ?
, , , ,
??
{OFF-SITEBOUNDARY{DRAIN
Worker inBasement (ih)
!
!
Workers in oroutdoors (ih)
Irrigated PlantsIrrigation(in,dc,ih)
WorkerirrigatingPlants
ConstructionWorker (in,dc,ih)
Vapours
E
HAdult/Child inPark (in,dc,ih)
H
DomesticPets
AquaticEcosystem E
E
H H
!
Vapours
Source Zone
RemediationExtraction Well
Groundwater FlowGroundwater Flow Groundwater Flow
0
-5
-10
-15
-20
-25
5
10
-30
0
-5
-10
-15
-20
-25
5
10
-30
Vapour
PROJECT
137643006 027 R 0 F007
2016.08.24MS
Path:
G:\S
patia
l_Info
rmati
on_G
roup\G
IS_W
ORKS
PACE
_AUS
TRAL
IA\01
_WA\S
H501
4_PE
RTH_
SPEC
IAL\16
4906
6\Proj
ects\
Sketc
h\164
9066
-SK0
03_C
SM.m
xd
IF TH
IS M
EASU
REME
NT D
OES
NOT M
ATCH
WHA
T IS
SHOW
N, TH
E SH
EET S
IZE H
AS B
EEN
MODI
FIED
FROM
: ISO
A3
CONSULTANT
PROJECT No. CONTROL Rev. FIGURE
YYYY-MM-DDPREPAREDDESIGNREVIEWAPPROVED
25mm
0
CLIENT
REFERENCE
1. COORDINATE SYSTEM:2. SOURCED FROM 097643174-004-R-REV1
CADASTRE BOUNDARY AND ROADS © WESTERN AUSTRALIANLAND INFORMATION AUTHORITY TRADING AS LANDGATE (2014)AERIAL IMAGERY © NEARMAP (01 AUG 2014)
HTTHTT
CONCEPTUAL SITE MODELTITLE
LEGEND, INFERRED WATER TABLE LOCATION - INTERMEDIATE AQUIFER
HISTORICAL TBE PLUME EXTENT
in - INGESTIONdc - DIRECT CONTACTih - INHALATION
ECOLOGICAL RECEPTOR
HUMAN HEALTH RECEPTOR
GROUNDWATER FLOW DIRECTION
EH
CALCAREOUS SHELLY SILTY SAND / SUBORDINATE SILTAND CALCARENITE LAYERS AND CLAY
CALCAREOUS SHELLY SILTY SAND / SUBORDINATE SILTAND CALCARENITE LAYERS
POORLY SORTED FINE TO VERY COARSE SANDSWITH SOME CLAY AND SILT
POORLY SORTED SAND WITH SOME SILT AND/OR CLAY
MODERATELY TO WELL SORTED MEDIUM SANDS
FINE TO VERY FINE SANDS WITH SOME CLAYFINE TO COARSE SAND LAYERSAND LESSER SILTY SAND LAYERS
CLAYEY SILT / PEAT
CLAYEY SANDS
SUPERFICIALSEDIMENTS SILTY SANDS
SANDY FILL
KINGS PARKFORMATION
BASSENDEANSAND
GUILDFORDFORMATION
MULLALOOSANDSTONE
GNANGARASANDS
ASCOTFORMATION
UPPERAQUIFER
LOWERAQUIFER
INTERMEDIATEAQUIFER
0 10 20 30 40 50 m
1:750

CRC CARE Technical Report no. 37 89
Flux-based groundwater assessment and management
Appendix D
Case study 2 – Mine tailings ponds leakage
Background
A mine tailing pond leaked heavy-metal contaminated water into groundwater.
The pond is located immediately upgradient of a listed sensitive receptor, being an
intertidal zone including sand dunes, ephemeral freshwater wetlands and mangroves.
The landscape geology is coarse-grained marine sands overlying marine muds, which
overly weathered fractured granite bedrock, becoming more competent with depth.
The zinc contaminated water had percolated from the tailings dams into the
groundwater, and the groundwater was then transporting the contamination into the
intertidal and mangrove areas. Thus, the contaminated groundwater required
delineation and management.
After a series of investigations the project team identified that the majority of
contaminant mass was being transported by groundwater within a particularly coarse
sandy lense, corresponding to a former creekline (filled in during pond construction)
and dense vegetation.
Traditional monitoring wells were installed into the sands, the marine muds and the
underlying bedrock. Concentration data from these wells showed that the marine muds
were acting as an effective aquitard and the zinc contamination was isolated to the
overlying sands only. Thus, remediation was to focus on this lithology.
During the course of the investigation, both the state regulator and an auditor became
involved in the management of the groundwater contamination. Eventually, it was
decided that remediation should focus on a particular portion of the site located
immediately downgradient of the ponds.
Optimising remedial design
During investigation, two monitoring wells reported elevated concentrations of
dissolved zinc and cadmium. These were located immediately downgradient of the
leaking pond and close to the site boundary.
Based on concentration data alone, the remedial area would need to encompass both
of these monitoring wells. However, using flux techniques, the project team were able
to demonstrate that the reported concentration in only one of the wells was contributing
significant mass discharge, whereas the mass discharge related to the concentration in
the other well was negligible.
Method:
The field program was designed to investigate the mass flux across a transect
corresponding to the anticipated extent of the remediation (the control plane);
Existing monitoring wells were utilised for measuring K
New sampling points were established along the transect and concentrations were
measured by the use of a hand held groundwater spear, and

CRC CARE Technical Report no. 37 90
Flux-based groundwater assessment and management
The data was used to calculate groundwater flux and then mass discharge at each
point along the transect.
The data is displayed in figure 12, with mass discharge of zinc (g/day) against
chainage plotted. This clearly shows that the mass discharge at MW01 was negligible,
and the mass discharge at MW02 was high.
Using this data, the project team effectively communicated to the auditor that
remediation at MW01 was not warranted. The auditor agreed and remedial works were
restricted to the area around MW02.
Figure 12: Zinc mass discharge vs chainage, overlaid on an aerial photograph of the site to aid
visualisation
Calculating site-specific remedial criteria
Due to the sensitive and unique nature of the potential receptor, the project team was
required to calculate site-specific remedial criteria. Concentration-based criteria were
imposed by the regulator at the point of potential exposure (i.e. within the mangroves),
however the challenge lay in converting this receptor-based criteria into something that
could be measured at the source.
To solve this challenge, the project team chose to use the flux data to back-calculate
the mass discharge at the source that would correspond to the concentration at the
receptor. This technique was preferred as:
It afforded actual protection (was based on measured data at the sensitive
receptor) for the most sensitive receptor
Referential data for the ecosystem or groundwater bearing zone was not available,
and
It worked across a range of discharge scenarios, given the high seasonal
variability of the receptor and groundwater system.

CRC CARE Technical Report no. 37 91
Flux-based groundwater assessment and management
Method
Metal concentrations were measured in the receiving environment over a number
of years and seasons and the health of the ecosystem was also measured at these
times
Various site specific parameters were measured or calculated using estimates
(presented in figure 13)
The surface water hydrology was assessed to help calculate the surface water
volume and chemical composition that would discharge into the receptor
The extent to which the sensitive receptor relied on groundwater was determined,
as a proportion of surface flows
The maximum allowable mass flux was then calculated (based on dilution only) for
a worst case scenario at the proposed location of the remedial system foot print,
and
No allowance was made for retardation as the hydraulic conductivity was high and
the lithology had minimal adsorption potential.
The auditor agreed that this technique was useful, and endorsed it as clean up criteria
for the remedial program, as well as for monitoring compliance criteria following
completion of the remedial works.
Figure 13: parameters and calculations for site specific criteria based on mass discharge

CRC CARE Technical Report no. 37 92
Flux-based groundwater assessment and management
Compliance monitoring
As mentioned above, the mass-discharge based clean up criteria were able to be used
as compliance monitoring during and following remediation.
This technique was useful, as it allowed a metric to be measured at the source rather
than the receptor. Thus, if the compliance criteria was exceeded there was still time to
act and prevent actual exposure at the receptor.
Lessons learned in using flux measurements:
Early and open communication with the regulator and the auditor was essential
Visualisation of the data was important. Cross-sections, CSMs and graphs were
utilised strategically to portray the nature of the contamination, and the concepts
behind the remedial design, and
Adequate field planning and contingency provisions were essential. It was
important for field staff to know which data were critical, so if things went wrong
they could prioritise and still achieve the objectives.

CRC CARE ATC Building University of Newcastle Callaghan NSW 2308 Australia
Postal C/- Newcastle University LPO PO Box 18 Callaghan NSW 2308 Australia
Contact usP: +61 2 4985 4941 E: [email protected]
www.crccare.com


