FMI’s Construction Outlook The economy is all about supply and demand seeking equilibrium. That’s what one learns in economics 101. After 101, it gets compli- cated. However, even a basic understanding of the concept of supply and demand curves can provide remarkable explanatory powers. Even if one does not understand much about eco- nomics, we are all participants moving the sup- ply and demand curves one way or the other every time we make a purchasing decision or work to make goods and services for sale. We might want a new computer system, but we re- ally need to spend our money on a new truck. Potential sellers want to fulfil your desire, for a price. Once we add price to the demand curve, things start to get more complicated. We can then start to consider alternative goods and consumer de- cisions. Maybe if we purchased the computer for much less than the new truck, we could work at home and not need to drive to work. These personal decisions that we make every day — microeconomics — are subsets of the larger economic business decisions made each day on a macroeconomic scale. The goal here is not to provide a primer on supply and demand curves, but to shed a little light on what seems to be a tumultuous, un- certain economy and the often over-simplified approach to supply and demand, such as “I build grocery stores (supply); you want to start a grocery business (demand); and, I will build this for a fair price (equilibrium).” For example, supply and demand concepts help us to under- stand what is going on in the oil and gas indus- try with the upswing in mining of shale oil and gas deposits. The boom has spawned a rapidly changing economic and geographical landscape leading to lower prices for natural gas, which in turn affects other fuel choices for power genera- tion, manufacturing and home heating. If the market can supply more natural gas at a lower price, demand rises. Demand for alternative fu- els is likely to go lower. That causes upheaval in the market. For instance, mining shale deposits has taken off right at the time when we were beginning to see more investment from alter- native energy sources like wind and solar. The result is a dimmer outlook for solar and wind power in the long run — unless the providers of wind and solar power can provide energy at a lower price or with the help of subsidies. Sup- ply and demand in one commodity, or a group of commodities, also affects others like the de- mand for workers, technicians and engineers. Labor shortages usually lead to higher salaries. Suddenly, it seems we cannot graduate enough engineers and technicians to meet demand. Equilibrium is a theoretical or short-lived point on a graph. It only happens in a perfect world. Supply and demand is a dynamic phenomenon. For instance, if the price of natural gas goes down too far, suppliers might not want to bring as much of it out of the ground. Supply and de- mand is about competing goods. Supply and demand is everywhere and all those supplies and demands interrelate in some fash- ion. If we could tune up our Google glasses to display supply and demand curves as we walk around town, we would soon get a headache trying to absorb all that information flowing into our brains. That’s what makes forecasting as much an art as it is a science. The complex- ity of things has helped to spawn demand for supercomputers and quants to study markets and complex weather patterns. However, it is difficult to calculate the actions and interactions of people’s emotions and the effect on local, na- Potential sellers want to fulfil your desire, for a price. 1st Quarter Report 2014
Transcript
FMI’s Construction Outlook
The economy is all about supply and demand seeking equilibrium. That’s what one learns in economics 101. After 101, it gets compli-cated. However, even a basic understanding of the concept of supply and demand curves can provide remarkable explanatory powers. Even if one does not understand much about eco-nomics, we are all participants moving the sup-ply and demand curves one way or the other every time we make a purchasing decision or work to make goods and services for sale. We might want a new computer system, but we re-ally need to spend our money on a new truck. Potential sellers want to fulfil your desire, for a price.
Once we add price to the demand curve, things start to get more complicated. We can then start to consider alternative goods and consumer de-cisions. Maybe if we purchased the computer for much less than the new truck, we could work at home and not need to drive to work. These personal decisions that we make every day — microeconomics — are subsets of the larger economic business decisions made each day on a macroeconomic scale.
The goal here is not to provide a primer on supply and demand curves, but to shed a little light on what seems to be a tumultuous, un-certain economy and the often over-simplified approach to supply and demand, such as “I build grocery stores (supply); you want to start a grocery business (demand); and, I will build this for a fair price (equilibrium).” For example, supply and demand concepts help us to under-stand what is going on in the oil and gas indus-try with the upswing in mining of shale oil and gas deposits. The boom has spawned a rapidly changing economic and geographical landscape leading to lower prices for natural gas, which in turn affects other fuel choices for power genera-tion, manufacturing and home heating. If the market can supply more natural gas at a lower price, demand rises. Demand for alternative fu-els is likely to go lower. That causes upheaval in the market. For instance, mining shale deposits has taken off right at the time when we were beginning to see more investment from alter-native energy sources like wind and solar. The result is a dimmer outlook for solar and wind power in the long run — unless the providers of wind and solar power can provide energy at a lower price or with the help of subsidies. Sup-
ply and demand in one commodity, or a group of commodities, also affects others like the de-mand for workers, technicians and engineers. Labor shortages usually lead to higher salaries. Suddenly, it seems we cannot graduate enough engineers and technicians to meet demand. Equilibrium is a theoretical or short-lived point on a graph. It only happens in a perfect world. Supply and demand is a dynamic phenomenon. For instance, if the price of natural gas goes down too far, suppliers might not want to bring as much of it out of the ground. Supply and de-mand is about competing goods.
Supply and demand is everywhere and all those supplies and demands interrelate in some fash-ion. If we could tune up our Google glasses to display supply and demand curves as we walk around town, we would soon get a headache trying to absorb all that information flowing into our brains. That’s what makes forecasting as much an art as it is a science. The complex-ity of things has helped to spawn demand for supercomputers and quants to study markets and complex weather patterns. However, it is difficult to calculate the actions and interactions of people’s emotions and the effect on local, na-
Potential sellers want to fulfil your desire, for a price.
1st Quarter Report
2014
21st Quarter 2014 Report
tional and global politics. So, we need to throw a little crowd psychology into our supply and demand calculations. Like the paparazzi, when a star is sighted, they all run with their flash-ing cameras and stumble over each other to get the juicy photo of Justin or anything Gaga. The same sort of phenomenon happens in construc-tion markets, although most companies are not near as fast to react as the paparazzi. When the government was on its recent spending spree, a wave of contractors looking for work started chasing government contracts. Now, more con-tractors are looking for ways to enter the oil and gas markets. The real trick of market timing is to be there ahead of the pack and to find the ris-ing star before the frenzied paparazzi do. That is the ingredient for finding an exclusive market, but such finds don’t remain exclusive for long in the information age. Nonetheless, the “shale gale” is still in a boom stage and seeking equi-librium of some sort.
So, how do you plan for your business in an economy that can turn on a tweet? Not long ago, what would have been considered short-term planning — about a year for most — is now long-term planning. Short-term planning is becoming more like a weekly work plan. For the construction industry and the economy as a whole, this means it is more difficult to con-sider projects that may take years to unfold. For instance, a commercial venture may be able to put together a website in a few weeks, but planning and building a store takes a year or more. It seems that the constant drive to do ev-erything faster has not only decreased our at-tention span, but has degraded our ability to solve larger problems and provide long-range solutions. In other words, all the quantification that has been done to reduce risk seems to be a cause of more risk.
The issues of rapid change affecting supply and demand are reflected in our construction forecast. Commercial construction is beginning to lift itself out of the slump because investors are beginning to take some more risk as it be-comes “grow or perish” for retailers trying to stay ahead of the consumer. Office construction still faces uncertainty in job growth in the ser-vice sector in no small part due to technology replacing workers (alternative goods). Public sector construction is stagnating due to lack of funding as states build up tax coffers. The fed-eral government wrestles with the deficit, mak-ing the economic choice between directly help-ing people get out of a state of joblessness and growing poverty and back to contributing to the wealth of the nation, or paying down the deficit and hoping that lower debt will spur investors to expand or start up new businesses and hire more. Health care construction is being pulled
in many directions, from political questions to technological advancements to finding some sort of equilibrium between growing demand and high-priced supply.
These days, it seems every strategic plan is a contingency plan in a rapidly changing world. One way to deal with an economy that turns on a tweet is to become really effective at re-acting to or answering the “tweeted” sentiments of the crowd. If a message like, “Saw this really nice little home today. Runs on solar power for $995” is suddenly re-tweeted a million times, then you crank up your 3D printers, turn out a solar home for $989 and go to market next week.
Another approach to planning in a world “all-a-twitter” is to sift through the noise and focus on market fundamentals. For instance, despite the changing economy, the nation will still need schools, health care facilities, homes, factories, bridges and roads, etc. How can the industry or a given firm better understand and offer what the consumer demands? This economy has twisted many supply and demand curves. Nonetheless, it is the fundamentals that shine through and the foundation industries that are making a comeback. However, the fundamen-tals are not without change. For instance, more pipes and wires are going underground, and more communication is being conducted over airwaves than wires. “Net zero” has entered our construction lexicon and is becoming a reality in some areas. Construction and manufactur-ing are morphing into new approaches. After what is only a short time, BIM has become a recognizable acronym for most in the industry, even if many are still struggling to “get with the program.” The outlook is good for those who can get out ahead of the crowd or those who can stand out in the crowd, but it will be a long struggle for those who are stuck behind the pack looking for leftovers. Inaction or non-participation is still a supply and demand decision. Even if the theory that the goal of supply and demand is to reach equilibrium, the goal for individuals and businesses is to find their advantage — in an ethical, legal and moral way. That is what makes markets so dynamic and often uncertain. In a perfect world, supply and demand decisions would be made with access to all the informa-tion needed about the market. This is not a per-fect world, yet. Forecasters and business people must strive for the best information they can get and take action based on informed decisions, or wait for others to take action and follow the bread crumbs.
FMI’s Construction Outlook 3
United States Price of Natural Gas Delivered to Residential Consumers (Dollars Per Thousand Cubic Feet)
Source: U.S. Energy Information Administration
Weekly U.S. Regular Conventional Retail Gasoline Prices (Dollars Per Gallon)
Source: hppt://www.eia.gov/petroleum/gasdiesel/
41st Quarter 2014 Report
Consumer Price Index Inflation Remains Under Control
Conference Board Consumer Confidence Index
Source: The Conference Board
FMI’s Construction Outlook 5
Construction ForecastOverall, our construction forecast remains in the cautiously optimistic zone. As always, the blanket statement hides the detail for individual market
sectors. Residential construction is expected to remain a high-growth market, but we have pulled back on the outlook for multifamily construction.
Multifamily is still a fast-growing market, but the rate of growth is slowing. Home improvements are improving. The interplay between these three resi-
dential categories is dynamic and heavily influenced by job growth, wage growth and interest rates among other factors. Assuming more people won’t
have to live out on the streets, housing choice, especially for new construction, can change relatively fast. For instance, if interest rates or prices take a
large jump up, more people will stay where they are and invest in home improvements.
There is a sense that nonresidential construction is on the verge of breaking out of its long slumber. However, like the groundhog, nonresidential con-
struction has come out of its burrow and seen its shadow. In this case, it means it looks like there will be six more months of slow growth. In fact, one
of the reasons for that slow growth is that the nation has had a long and difficult winter. However, if we think the weather is uncertain, the economy is
even more flighty these days. All that said, we expect total construction put in place to grow at the rate of 8% this year and for the next few years. Just
like the spring, despite all odds and nasty economic weather, the nation needs to grow and that means more construction projects.
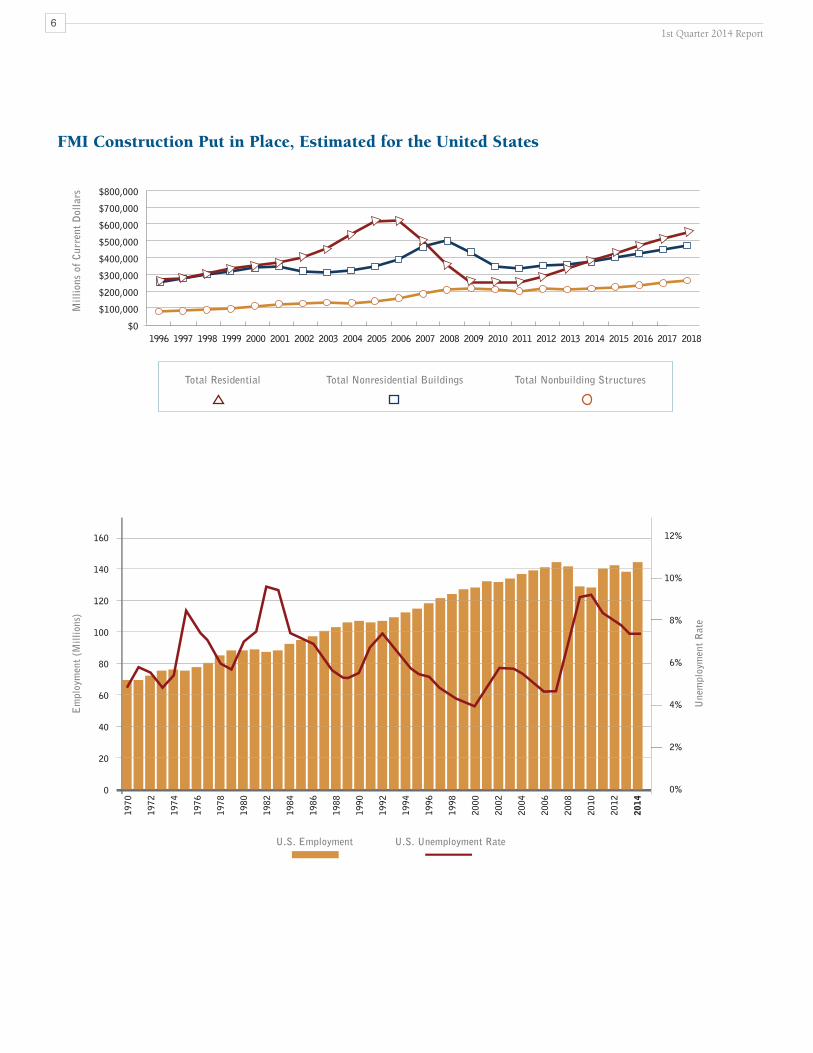
Construction Unemployment Rates
“Construction employment gained 7,000 jobs in May.” (BLS)
61st Quarter 2014 Report
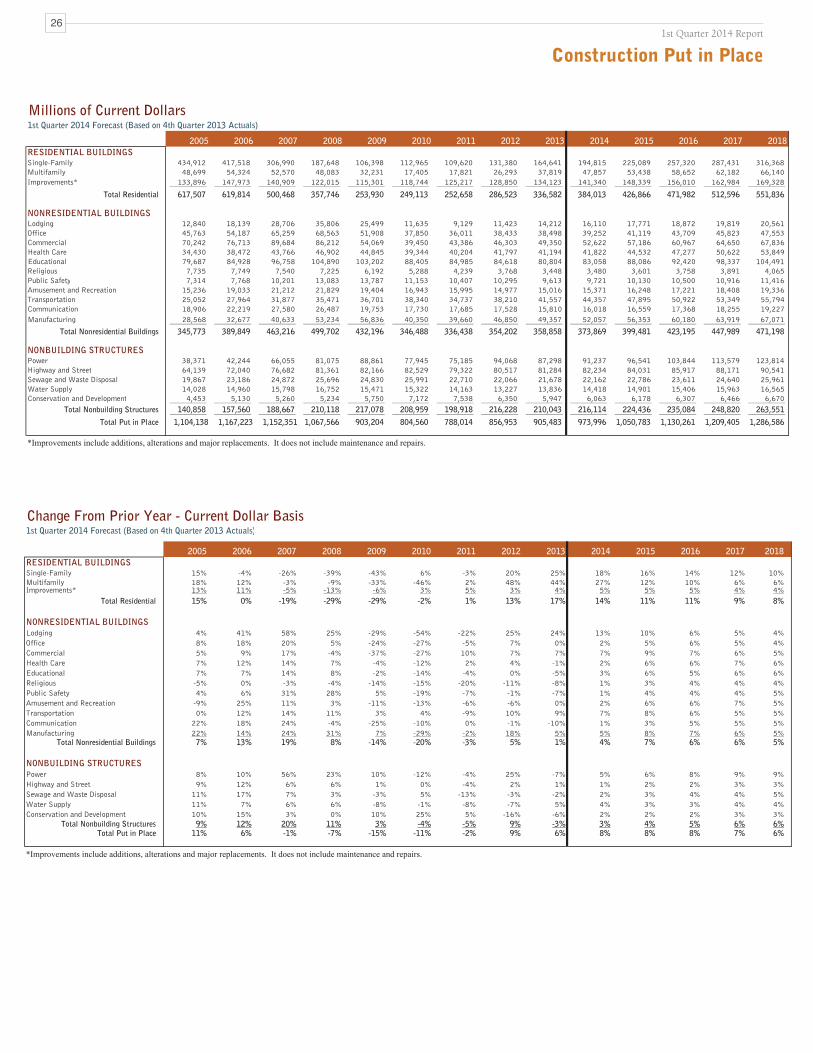
FMI Construction Put in Place, Estimated for the United States
FMI’s Construction Outlook 7
RESIDENTIALMost signs point to continued solid improvement in the growth of residential construction; however, the market will grow at a slower pace than it did
in 2013. Our current forecast calls for 18% growth in single-family construction and a sharper drop in the growth rate for multifamily from 44% in
2013 to a still strong 27% in 2014, with continued tapering in the longer-range forecast. Although mortgage rates are still low by historical standards,
housing affordability is slipping somewhat, mostly due to increasing prices for existing homes. Employment figures are slightly better, but new jobs and
pay scales aren’t rising as fast as costs. This will keep the growth rate down for most of the country.
Trends worth watching in the residential markets include more scrutiny by investors looking to buy low and sell high, or rent distressed properties left
over from the recession. Another related trend that could affect the market for years to come is the growing wealth gap, making high-end markets in
major metro areas continuously more expensive while low-end markets become less affordable to the largest sector of the population. A recent report,
“A Tale of 2000 Cities,” published by the Demand Institute (February 2014) details this phenomenon and predicts what appears to be an inevitable
future for the American dream.
Residential Construction Put in Place
81st Quarter 2014 Report
Residential Construction Improvements Put in PlaceForecast as of Q1 2014
New Privately Owned Housing Units Started(Thousands of Units, Monthly, Seasonally Adjusted Annual Rate)
TRENDS: � According to CoreLogic, completed foreclosures were down 19 percent from January 2013 to January 2014,
and “the seriously delinquent rate is just under 5 percent for the first time since November 2008.”
� The February 2014 report, S&P Dow Jones Indices for its S&P/Case-Shiller Home Price Indices, slipped .08% from January rates for the 20-city composite.
� According to the U.S. Census Bureau, “Privately-owned housing units authorized by building permits in January were at a seasonally adjusted annual rate of 937,000. This is 5.4 percent (±0.7%) below the revised December rate of 991,000, but is 2.4 percent (±1.0%) above the January 2013 estimate of 915,000.” Also, “Privately-owned housing completions in January were at a seasonally adjusted annual rate of 814,000. This is 4.6 percent (±8.3%) above the revised December estimate of 778,000 and is 13.1 percent (±12.8%) above
the January 2013 rate of 720,000.” (January 2014)
DRIVERS: Unemployment Core CPI Income Mortgage rates Home prices Housing starts
Housing permits
FMI’s Construction Outlook 9
NONRESIDENTIAL BUILDINGS
Construction as a Percentage of GDP
Construction Spending and Nominal GDP
*FMI Forecast
*FMI Forecast
101st Quarter 2014 Report
Value of Public Construction Put in Place (Seasonally Adjusted Annual Rate) Millions of dollars. Details may not add up to totals due to rounding.
Value of Construction Put in Place — Seasonally Adjusted Annual Rate (Millions of Dollars)As of November 2013
*Public Construction *State and Local *FederalFMI Forecast: Private Construction Put in PlaceFMI Forecast: Construction Put in Place
* Source: U.S. Census Bureau Construction Spending
Total ConstructionPut in Place(Dec 2012)
% of TotalConstructionPut in Place(Q4 2012)
31%28%3%69%100%
Total ConstructionPut in Place(Dec 2013)
% of TotalConstructionPut in Place(Q3 2013)
29%27%3%71%100%
$268,540$241,954$26,586
$588,413$856,953
$266,567$243,235$23,332
$638,916$905,483
Lodging Construction Put in PlaceForecast as of Q1 2014
LodgingOn a percentage basis, growth in lodging construction was a top performer in the past two years. We expect that double-digit growth to slow to 13%
for 2014 to $16.1 billion and not exceed 2006 levels until 2016. Supporting this growth are continuing brighter forecasts for occupancy levels and
RevPar. In part, the improving economics in the lodging sector is due to the reduced rates of new hotel openings in the past few years. However, Lodging
Econometrics forecasts 591 hotels openings for 2014 compared with 500 in 2013 and just 407 in 2012. The outlook is for fewer luxury, casino-type
hotels and more upper middle and upscale national brands to expand.
TRENDS: � According to a report by PriceWaterhouseCoopers (PwC), RevPar growth should end up at 5.5% for 2013,
with expected growth of 5.9% for 2014. (PwC “Hospitality Directions U.S.,” November 2013)
� The increase in average daily rates per room will continue to be modest as business and vacation travelers shop for the best buy.
� According to Lodging Econometrics’ forecast, the pipeline for new openings will improve 18.2% in 2014.
� Green building is more commonplace in remodels and retrofits.
Office Construction Put in PlaceForecast as of Q1 2014
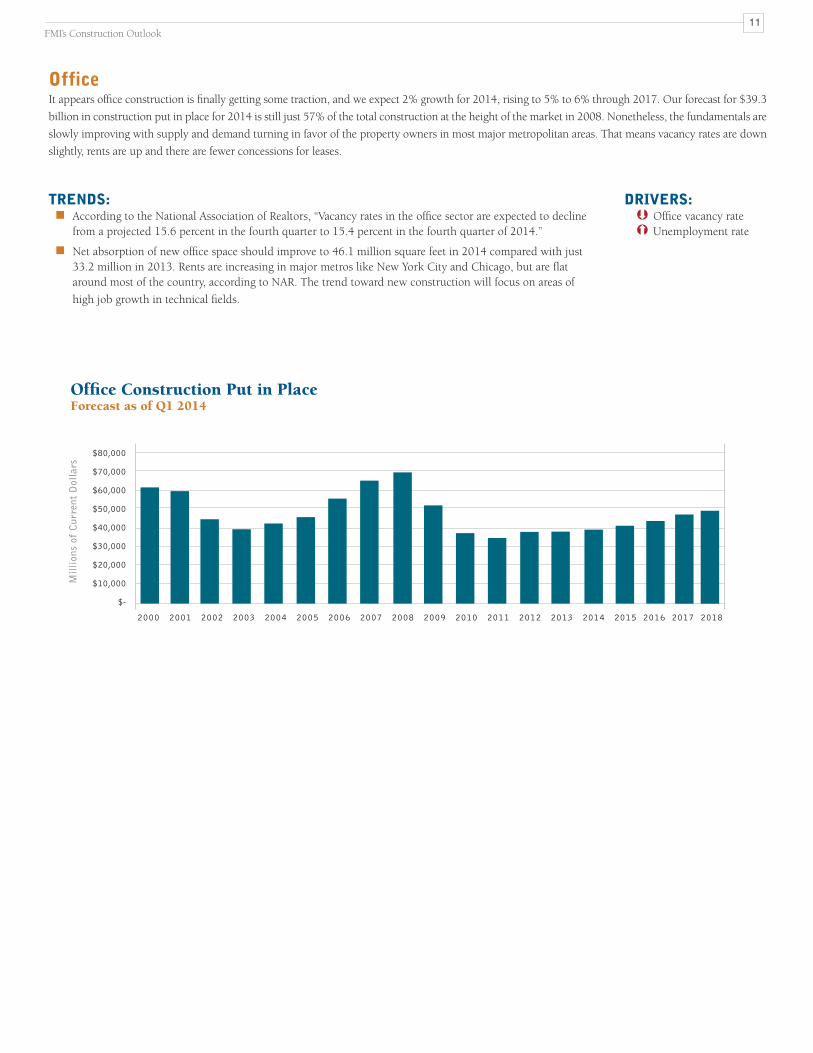
OfficeIt appears office construction is finally getting some traction, and we expect 2% growth for 2014, rising to 5% to 6% through 2017. Our forecast for $39.3
billion in construction put in place for 2014 is still just 57% of the total construction at the height of the market in 2008. Nonetheless, the fundamentals are
slowly improving with supply and demand turning in favor of the property owners in most major metropolitan areas. That means vacancy rates are down
slightly, rents are up and there are fewer concessions for leases.
TRENDS: � According to the National Association of Realtors, “Vacancy rates in the office sector are expected to decline
from a projected 15.6 percent in the fourth quarter to 15.4 percent in the fourth quarter of 2014.”
� Net absorption of new office space should improve to 46.1 million square feet in 2014 compared with just 33.2 million in 2013. Rents are increasing in major metros like New York City and Chicago, but are flat around most of the country, according to NAR. The trend toward new construction will focus on areas of
high job growth in technical fields.
DRIVERS:Office vacancy rate Unemployment rate
121st Quarter 2014 Report
Commercial Construction Put in PlaceForecast as of Q1 2014
CommercialWe expect commercial construction will grow another 7% in 2014 to $52.6 billion — the highest mark seen since 2008. Consumer spending is up,
but wage increases aren’t keeping up with spending, so it is not expected that we will have a boom at the mall anytime soon. However, nonstore sales
continue to rise faster than traditional purchasing sites. For contractors working in the commercial sector, pricing will continue to be a challenge even
while owners want more amenities such as green building methods. The challenges may have some benefits as contractors learn to work leaner and use
new building methods like prefabrication and modular construction.
TRENDS: � According to the Department of Commerce, “retail and food services sales for February, adjusted for seasonal
variation and holiday and trading-day differences, but not for price changes, were $427.2 billion, an increase of 0.3 percent (±0.5%) from the previous month, and 1.5 percent (±0.9%) above February 2013. Total sales for the December 2013 through February 2014 period were up 2.3 percent (±0.5%) from the same period a year ago. The December 2013 to January 2014 percent change was revised from -0.4 percent (±0.5%) to -0.6 percent (±0.2%).”
� The Department of Commerce also reported “Nonstore retailers were up 6.3 percent (±2.5%) from February 2013 and health and personal care stores were up 5.5 percent (±1.9%) from last year.”
� Consumer confidence fell from 79.4% in January to 78.1% in February, the same score as December 2013. (The Conference Board)
� Increased store remodeling could stall new construction.
Health Care Construction Put in PlaceForecast as of Q1 2014
Health CareHealth care construction will continue to grow at a slow pace of 2% for 2014 and is expected to improve to 6% in 2015. While hospital beds may be
trending downward, nursing homes and assisted-living facilities will continue to grow due to the demographics of retiring baby boomers. The growing
bifurcation of wealth in the nation, along with a growing scarcity of physicians, will also affect how health care is delivered in the future. However, due
to uncertainty as to the direction of new health care insurance and other new regulations, the industry has put many plans on hold and gone back to the
drawing board. In 2014, the expectation is that there will be more clarity as to the direction of the industry, and one direction is to build more ambulato-
ry care centers. With new laws and scrutiny of costs, the goal is to be more efficient and less extravagant by using greater technology for record keeping
and care. Hospital stays have been decreasing; so many regions require fewer beds even if more people become eligible for medical care. Excluding the
posh facilities for the wealthy, new designs will be more lean, green and filled with technologies to keep the added labor requirements to a minimum.
TRENDS: � The Affordable Health Care Act (ACA) implementation is highly flawed due to poor software imple-
mentation and continued political hurdles causing uncertainty in the market for health care
� Hospital beds per 1,000 people trending downward
� Shorter patient stays
� Increasing use of growing number of ambulatory-care facilities
� Heath care industry still not prepared for increased number of insured
� Trend toward rebuilding existing facilities to use modern hospital design and allow for greater use of technology
� Nontraditional funding sources for private nonprofit facilities
� Private development and equity
� Government or government-backed
� Pension and life insurance companies
DRIVERS:Population change younger than age 18Population change ages 18-24 Stock market Government spending Nonresidential structure investment
141st Quarter 2014 Report
Educational Construction Put in PlaceForecast as of Q1 2014
EducationalEducational construction put in place will improve 3% in 2014 to $83.0 billion. Improving state and local budgets will help move educational construc-
tion back into growth mode; however, for most states in the union, funding, especially for higher education, will continue to decrease while tuitions
increase. Higher tuition and fewer job opportunities have led to growing student debt levels. Students ready to enter college may look to other means
of education than traditional brick and mortar schools or may skip college altogether.
TRENDS: � Significantly less funding from states for K-12 schools
� Enrollment growth of 2.5 million in the next four years
� New school designs more flexible for changing classrooms and greater use of natural light
� Greater attention to reducing energy use and employing green building technologies
� Renovation and additions to current school buildings will continue to grow in comparison to new school projects
� Greater focus on safe schools as the threat of shootings on campus continues to rise
DRIVERS:Population change younger than age 18 Population change ages 18-24 Stock market Government spending
Nonresidential structure investment
FMI’s Construction Outlook 15
Religious Construction Put in PlaceForecast as of Q1 2014
ReligiousAfter a drop of 8% in religious construction in 2013, we expect 1% growth in 2014. What growth we see will likely be renovation, as newly formed
congregations move into vacated retail space or reoccupy church buildings abandoned by other faiths. As the housing market slowly continues a growth
trend in the coming years, we may also see more expendable income for contributing to new community-based houses of worship. However, like retail,
it is possible that more religious congregations will meet online or use other forms of communication.
TRENDS: � The lending environment continues to be a challenge for many congregations.
� Establishing a capital campaign is becoming increasingly common.
� Many churches are seeing tremendous declines in contributions and tithes.
� More parishioners are relying on their houses of worship to provide guidance and assistance, further stretching thin resources.
� New methods for charitable giving, including online giving and donation collections, are empowering religious organizations.
� Churches are becoming smarter about attracting parishioners who are drawn in by facilities and the church building itself.
� Energy efficiency, green sustainability and long-lasting quality are becoming top features many congregations want in worship houses.
DRIVERS:GDPPopulationIncomePersonal savings rate
161st Quarter 2014 Report
Public Safety Construction Put in PlaceForecast as of Q1 2014
Public SafetyPublic safety construction is expected to rise a modest 1% in 2014. According to the U.S. Department of Justice Federal Prison System FY 2014 Con-
gressional Budget report, “Inmate overcrowding continues to be a major concern and challenge for the BOP. Thus far in FY 2013, the federal inmate
population totals 217,929, and systemwide crowding is at 37 percent over rated capacity, with 54 percent and 44 percent at high and medium security
institutions, respectively (data as of March 21, 2013).” Although we expect spending to increase, the rate of increase will be attenuated by the public’s
abhorrence of new taxes.
TRENDS: � “About 1 in every 35 adult residents in the United States was under some form of correctional
supervision at year-end 2012, the lowest rate observed since 1997.” (Bureau of Justice Statistics, December 2013)
� “At year-end 2012, the combined U.S. adult correctional systems supervised about 6,937,600 offenders, down by about 51,000 offenders during the year.” (Ibid.)
� The President denied a request by the Pentagon seeking to overhaul the U.S. detention facility at Guantanamo Bay, Cuba.
� Privately managed secure facilities are increasing.
� Private corporations now operate 5% of the 5,000 prisons and jails in the U.S. The private prison-industry is growing at a rate of 30% per year.
� CM-at-risk or design-build arrangements will increase.
Amusement and Recreation Construction Put in PlaceForecast as of Q1 2014
Amusement and RecreationConstruction for amusement and recreation markets should improve 2% in 2014 to $15.4 billion. New stadiums are increasingly more like new towns
as the development includes mixed-use venues, in addition to baseball or football or whatever the anchor sport is in the stadium. This approach can
often revitalize a decaying part of town, but also offers more ongoing work and growth. That is the approach that is required these days to get the pub-
lic to support the new arena both with their allegiance to the team and with its tax dollars. In the case of the Atlanta Braves, there will be a significant
input of funds from the team, which helps demonstrate its long-term commitment as well. While large projects dominate the news, smaller projects for
amusement and recreation may include baseball fields in towns and smaller venues as part of school projects, especially for higher education.
TRENDS: � The Atlanta Braves have announced they will build a new stadium using a public/private
partnership.
� The San Francisco 49ers have recently broken ground on their new $850 million stadium expected to be completed in 2014 in time for the new season.
� The Minnesota Vikings $1.1 billion project has been approved by the state senate.
� Casino plans are underway in a number of states, including New York, Pennsylvania, Maryland, Florida and Ohio, with some investors coming from offshore.
� A public/private venture planned for the campus of UNLV includes a 50,000-seat, domed stadium but is still awaiting approvals and taxpayer votes on plan to allow the project to be tax-free.
� Competition in the gaming sector will draw business away from some existing gambling centers such as Atlantic City, as well as other public arenas.
DRIVERS:Income Personal savings rate
Unemployment rate
181st Quarter 2014 Report
Transportation Construction Put in PlaceForecast as of Q1 2014
TransportationTransportation construction will improve 7% in 2014 to $4.4 billion. While reauthorization or a replacement of MAP-21 is still uncertain, the presi-
dent’s 2015 budget proposes $73.61 billion for surface transportation spending in fiscal year 2015; most of the proposed funds are directed at highway
programs. A sign of the need for updated transportation made the news recently when Vice President Biden compared LaGuardia airport to a “third
world country.” According to a report from CNN, the Port Authority responded with an announcement that it proposed to spend $27 billion on a “10-
year capital plan.” (CNN, February 6, 2014)
TRENDS: � On February 26, 2014, the President announced, “the U.S. Department of Transportation is making
available $600 million in TIGER competitive grants to fund transportation projects.” (White House Press Release)
� According to the American Association of Railroads in February 2014, carload volume decreased and intermodal volume increased compared with February 2013. “Intermodal traffic in February totaled 993,807 containers and trailers, up 1.1 percent (10,729 units) compared with February 2013, which represents the 51st-consecutive year-over-year monthly increase for intermodal volume. U.S. carload originations totaled 1,100,858 in February 2014, down 1.1% (12,061 carloads) from February 2013. (AAR February 2014)
� The FAA Modernization and Reform Act will provide $63.6 billion for the agency’s programs between 2012 and 2015.
� The 2013 FAA forecast calls for U.S. carrier passenger growth over the next 20 years to average 2.2 percent per year, compared to last year’s forecast growth of 2.6 percent per year.
� High-speed rail is slow to get projects off the ground due to state funding and political resistance.
� Growth in container ports is recovering from the recession.
� Intermodal transportation will be the focus of new projects.
DRIVERS:PopulationGovernment spending
Transportation funding
FMI’s Construction Outlook 19
Communication Construction Put in PlaceForecast as of Q1 2014
CommunicationCommunication construction dropped 10% in 2013, but is expected to recover 1% in 2014 and modestly in the coming forecast years. While the rate
of cell tower installations may decrease due to most major service providers completing their service expansion, a recent report from Chessiecap notes
that there is an increasing demand for small cell networks to cover “dead” areas and provide improved service in areas where cell towers are prohibited.
Chessiecap estimates that this will be a primary driver for engineering and construction in the sector in the next two years. (Chessiecap “A Middle
Market M&A Update—January 2014”) The growth in wireless devices is sure to keep demand high in the coming years.
TRENDS: � “Mini towers” for increasing coverage and spectrum will proliferate rapidly in the next five years.
� Wireless technology is the fastest-growing area, as telecoms roll out more 4G technologies with smartphones and tablets.
� Data security is critical for large businesses and governments in the face of potential disasters and threats from hackers and foreign enemies.
Manufacturing Construction Put in PlaceForecast as of Q1 2014
ManufacturingManufacturing construction is showing signs of sustainable growth with an expected 5% increase for 2014 to $45.2 billion and adding another 8%
for 2015 to $56.4 billion. While the outlook for continued steady growth is good, improvements in the economic outlook for durable goods has had
difficulty sustaining a rally as new orders fell $2.2 billion in January to $225 billion. Nonetheless, global economic factors like the cost of energy and
transportation, as well as political unrest and the need for trained workers in high tech areas, will continue to tip the balance for locating or relocating
to the U.S.
TRENDS: � The Federal Reserve reports that manufacturing capacity fell slightly in January to 76.0%, but
increased 1.9% over January 2013. “Industrial production decreased 0.3 percent in January after having risen 0.3 percent in December. In January, manufacturing output fell 0.8 percent, partly because of the severe weather that curtailed production in some regions of the country. Additionally, manufacturing production is now reported to have been lower in the fourth quarter; the index is now estimated to have advanced at an annual rate of 4.6 percent in the fourth quarter rather than 6.2 percent.”
� “Reshoring of manufacturing” is happening slowly, in part due to availability of lower energy costs.
� The U.S. Census Bureau Department of Commerce reports that, “New orders for manufactured durable goods in January decreased $2.2 billion or 1.0 percent to $225.0 billion, . . . This decrease, down three of the last four months, followed a 5.3 percent December decrease. Excluding transportation, new orders increased 1.1 percent. Excluding defense, new orders decreased 1.8 percent.”
DRIVERS:ISMIndustrial production Capacity utilization Factory orders Durable goods orders
Manufacturing inventories
FMI’s Construction Outlook 21
Power Construction Put in PlaceForecast as of Q1 2014
NONBUILDING STRUCTURES
PowerConstruction for the power industry will increase 5% in 2014 with slow growth to 9% in 2017 and 2018. Our forecast calls for $91.2 billion in con-
struction put in place for the power industry in 2014. With the expiration of the production tax credits (PTC), wind power construction will pick up
from projects making it under the line, then lose momentum due to financing concerns. Alternative energy sources will continue to be explored, but
the new shale gas boom will continue to provide an alternative and elbow out coal-fired plants for new construction. The cost of new nuclear power
will continue to be prohibitive even before regulatory concerns are considered.
TRENDS: � Since 2008, the refinement of hydraulic fracturing technology has allowed the United
States to go from an increasingly dependent buyer of foreign oil to being the second-leading producer of oil in the world.” (FMI research paper, “Skills Shortages in a Booming Market: The Big Oil and Gas Challenge,” 2014)
� “In 2008, just 3.8 percent of the total construction workforce was engaged in direct oil and gas construction. By 2012, 6.4 percent – nearly double the number from 2008 – of that workforce was engaged in direct oil and gas construction.” (Ibid.)
� According to the “Annual Energy Outlook 2014,” energy consumption, “including both purchases from electric power producers and on-site generation,” will grow “from 3,826 billion kWh in 2012 to 4,954 billion kWh in 2040, an average annual rate of 0.9%.” Due to increased manufacturing activity, most growth will come from the industrial sector.
� U.S. Army Corps of Engineers has a proposal out for $7 billion in locally generated renewable energy through power purchase agreements. The $7 billion capacity would be expended for the purchase of energy over a period of 30 years or less from renewable energy plants that are constructed and operated by contractors using private-sector financing. (Renewablesbiz.com, Bill Opalka, Aug. 15, 2012)
� Consumer electricity demand is slowing due to more efficient appliances.
� Growth in renewable energy sources is expected to slow as production tax credits expire. Also, the competitive costs will be more difficult to overcome as shale sources continue to be exploited.
DRIVERS:Industrial productionPopulation
Nonresidential structure investment
221st Quarter 2014 Report
Highway and Street Construction Put in PlaceForecast as of Q1 2014
Highway and StreetPresident Obama is attempting to garner support to pass a four-year, $302 billion surface transportation reauthorization bill. If passed, the bill would
help achieve some certainty in highway funding in addition to funds in the proposed 2016 budget. Passage of the bill is not at all certain. At this time,
our forecast is for a modest 1% increase in highway and street construction for 2014 to $82.2 billion. Public-private-partnerships still hold out hope
for projects that can generate revenue from usage fees, but funding from more private investors will not approach the needed amount of infrastructure
the country needs to make.
TRENDS: � President Obama’s 2015 budget calls for “$199 billion over four years to continue critical
investments in highways and includes the creation of a new freight program as well as a new “Fix-it-First” program, which is aimed at repairing structurally deficient bridges.”
� According to ARTBA (American Road & Transportation Builders), “Taking into account changes in wages, materials and inflation, state and local governments awarded $54.3 billion in real highway and bridge contracts between February 2012 and January 2013, compared to $55.8 billion in the same 2011-2012 time period”.
� State budgets will continue to be strained, and it will be difficult to get larger projects off the ground due to uncertainty of long-term government funding and highway program renewal.
� The ACEC (American Council of Engineers) reports that, “According to the Congressional Budget Office, the balance of the HTF will be depleted in fiscal year 2015, necessitating dramatic cuts in highway and transit spending unless new revenues are provided. Absent congressional action, highway program funding would fall from $40 billion to approximately $4 billion, while
funding for transit projects would fall from $11 billion to $7 billion.”
Sewage and Waste Construction Put in PlaceForecast as of Q1 2014
Sewage and Waste DisposalConstruction for sewage and waste disposal is forecast to be up 2% in 2014 to around $21.6 billion and increase to $25.9 billion by 2018. The ability
to fund necessary water infrastructure improvements is central to the decline in construction as many municipal water systems still depend on the tax
base for funding. Environmentally friendly approaches, using new technologies and planning, offer greener solutions that attract business and people
who want to live near the city rather than dealing with constant leaks and repairs. Unfortunately, one of the primary drivers of water and wastewater
projects appears to be court ordered consent decrees issued under the Clean Water Act (CWA).
TRENDS: � Growth, driven by aging infrastructure and regulation, is on the horizon, but the length of the
horizon is still unknown. Slow water infrastructure markets in the aftermath of the recession continue to build the backlog of necessary work as existing infrastructure ages.
� In need of replacement and upgrades, the 16,000 wastewater systems nationwide discharge more than 850 billion gallons of untreated sewage into surface waters each year.
� Combined sewer systems (storm water and sewage) serve roughly 950 communities with about 40 million people. Most communities with CSOs are located in the Northeast and Great Lakes regions.
� The Clean Water State Revolving Fund (CWSRF) programs have provided more than $5 billion
annually in recent years to fund water-quality protection projects.
DRIVERS:PopulationIndustrial production
Government spending
241st Quarter 2014 Report
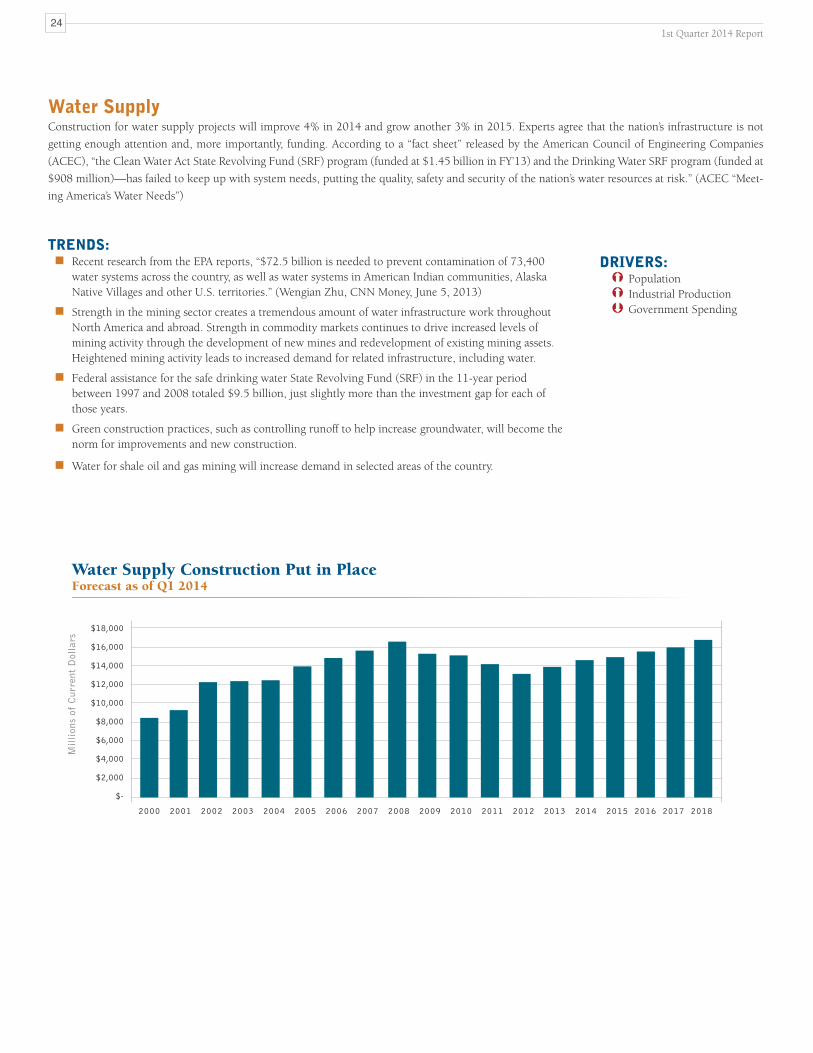
Water Supply Construction Put in PlaceForecast as of Q1 2014
Water SupplyConstruction for water supply projects will improve 4% in 2014 and grow another 3% in 2015. Experts agree that the nation’s infrastructure is not
getting enough attention and, more importantly, funding. According to a “fact sheet” released by the American Council of Engineering Companies
(ACEC), “the Clean Water Act State Revolving Fund (SRF) program (funded at $1.45 billion in FY’13) and the Drinking Water SRF program (funded at
$908 million)—has failed to keep up with system needs, putting the quality, safety and security of the nation’s water resources at risk.” (ACEC “Meet-
ing America’s Water Needs”)
TRENDS: � Recent research from the EPA reports, “$72.5 billion is needed to prevent contamination of 73,400
water systems across the country, as well as water systems in American Indian communities, Alaska Native Villages and other U.S. territories.” (Wengian Zhu, CNN Money, June 5, 2013)
� Strength in the mining sector creates a tremendous amount of water infrastructure work throughout North America and abroad. Strength in commodity markets continues to drive increased levels of mining activity through the development of new mines and redevelopment of existing mining assets. Heightened mining activity leads to increased demand for related infrastructure, including water.
� Federal assistance for the safe drinking water State Revolving Fund (SRF) in the 11-year period between 1997 and 2008 totaled $9.5 billion, just slightly more than the investment gap for each of those years.
� Green construction practices, such as controlling runoff to help increase groundwater, will become the norm for improvements and new construction.
� Water for shale oil and gas mining will increase demand in selected areas of the country.
Conservation and Development Construction Put in PlaceForecast as of Q1 2014
Conservation and DevelopmentConservation and development construction will improve slowly from 2% to 3% over the next four years. The environmental market continued to
be a tale of two markets in 2013. The industrial market continues to flourish behind the strength in the natural resource sector. In addition, the low
cost of energy is driving an onshoring phenomenon in other industrial sectors, such as chemical and automotive. Conversely, DOD and DOE markets
continue to struggle against the headwinds of budget constraints. Industrial market strength should increase the size of the overall environmental
market, albeit much more slowly as public markets contract.
DRIVERS:Population Government spending
261st Quarter 2014 Report
Construction Put in Place
Construction Put in Place
BenefitsA Construction Market Forecast fromFMI’s Research Services Group can:____________________________________
� Supply the market-oriented, economy-driv-
en dimension essential for preparing, im-
plementing and monitoring strategic plans.
� Be a significant aid in defining, targeting,
implementing and monitoring other criti-
cal corporate decisions, such as long- and
short-term sales goals, or redirecting re-
sources (i.e., on a geographic or a product-
line basis).
� Provide the basis for estimating submarkets.
� Provide the basis for comparing perfor-
mance among markets.
� Provide the basis for identifying activities
that are beneficial or detrimental to perfor-
mance.
Features Each Standard Construction Market Forecast:____________________________________
Notice of Rights: No part of this publication may be reproduced or transmitted in any form, or by any means, without permission from the publisher.† Investment banking services provided by FMI Capital Advisors, Inc., a registered broker-dealer and wholly owned subsidiary of FMI.
Raleigh — Headquarters5171 Glenwood Avenue
Suite 200Raleigh, NC 27612
T 919.787.8400F 919.785.9320
Denver210 University Boulevard
Suite 800Denver, CO 80206T 303.377.4740F 303.398.7291
Scottsdale14500 N. Northsight Boulevard
Suite 313 Scottsdale, AZ 85260
T 602.381.8108F 602.381.8228
Tampa308 South Boulevard
Tampa, FL 33606T 813.636.1364F 813.636.9601
About FMIFMI is a leading provider of management consulting, investment banking† and research to the engineering and
construction industry. We work in all segments of the industry providing clients with value-added business solutions,
including:
� Strategic Advisory
� Market Research and Business Development
� Leadership and Talent Development
� Project and Process Improvement
� Mergers, Acquisitions and Financial Consulting†
� Compensation Benchmarking and Consulting
� Risk Management Consulting
Founded by Dr. Emol A. Fails in 1953, FMI has professionals in offices across the U.S. We deliver innovative,
customized solutions to contractors, construction materials producers, manufacturers and suppliers of building
materials and equipment, owners and developers, engineers and architects, utilities, and construction industry trade
associations. FMI is an advisor you can count on to build and maintain a successful business, from your leadership