36
FOCUS DISCIPLINE GROWTH First Quarter Report 2016 Q1
F O C U S D I S C I P L I N E G R O W T H
First Quarter Report 2016
Q1

report to shareholders 2
management’s discussion and analysis 5
consolidated financial statements 24
notes to consolidated financial statements 28
corporate information 33

T O T A L E N E R G Y S E R V I C E S I N C .
M A N A G E M E N T ’ S D I S C U S S I O N A N D A N A LY S I S
Total Energy Services Inc. (“Total Energy” or the “Company”) is a growth oriented
energy services company based in Calgary, Alberta. Through various operating
divisions and wholly-owned subsidiaries and partnerships, Total Energy is involved
in three businesses: contract drilling services, rentals and transportation services and
the fabrication, sale, rental and servicing of new and used natural gas compression
and process equipment. Together these businesses provide a platform for building
long-term shareholder value. Total Energy has achieved its growth by maintaining
a disciplined acquisition strategy and undertaking strategic internal growth.
The shares of Total Energy are listed and trade on the Toronto Stock Exchange
under the symbol TOT.
1
F O C U S • D I S C I P L I N E • G R O W T H
T O T A L E N E R G Y S E R V I C E S I N C .
R E P O R T T O S H A R E H O L D E R S
Total Energy’s results for the first quarter of 2016 reflect arguably the most challenging industry conditions faced by the Company since it commenced operations in 1997. The decline in North American oil and natural gas drilling and comple-tion activity that began in 2014 accelerated during the first three months of 2016, defying the Canadian seasonal upswing in oilfield activity that normally occurs during the winter months.
Total Energy’s financial condition remains strong, with a positive working capital position of $87.7 million at March 31, 2016, which includes $18.0 million of cash and marketable securities. Total Energy’s only bank debt consists of a $48.3 million mortgage loan, which is secured by approximately 60% of the Company’s real estate. Such loan requires monthly principal and interest payments of $278,800 until May of 2020 when the remaining principal of approximately $40 million becomes due. Since the beginning of the current downturn, Total Energy has not had to renegotiate its banking arrange-ments and has remained solidly in compliance with all bank covenants. Total Energy is also proud to have maintained its quarterly dividend to shareholders of $0.06 per share.
LOOKING FORWARD
This difficult environment has led to a dysfunctional market in certain of Total Energy’s businesses, most notably within the Contract Drilling Services and Rental and Transportation Services divisions. Such dysfunction is characterized by unsustainable pricing, cannibalization of equipment and excessive counter-party credit risk. In such circumstances, Total Energy has elected to remain disciplined so as to preserve its equipment base, minimize operating losses and protect its financial strength and flexibility. Simply put, Total Energy will not pursue unprofitable work, cannibalize its equipment fleet or recklessly extend trade credit simply to enhance near term equipment utilization or generate headline EBITDA numbers to appease near-sighted objectives.
Total Energy continues to evaluate numerous opportunities to add quality assets and personnel. The Company will look to pursue only those opportunities that provide reasonable risk-adjusted returns in the context of what is expected to be a very challenging year for the North American energy services industry.
Total Energy’s cash and marketable securities position at March 31, 2016 is sufficient to fund its mortgage loan payments and existing dividend well into 2017, with cash flow from operations and its undrawn $65 million credit facility available to fund future growth opportunities. The Company will remain disciplined in the issuance of new equity.
On behalf of the Board of Directors and Shareholders of Total Energy, I would like to thank all of our employees for their continued perseverance and effort. While it may at times be tempting to quit, our employees refuse to do so and we are very proud of their continued efforts to strive to do their very best to provide our customers with quality equipment and service.
Finally, all Shareholders and other interested persons are encouraged to attend the annual meeting of Shareholders which will commence at 10:00 a.m. (MDT) on Thursday, May 19, 2016 at the Calgary Petroleum Club, 319 – 5th Avenue S.W., Calgary, Alberta.
DANIEL K. HALYKPresident and Chief Executive Officer
May 2016
2
2 0 1 6 F I R S T Q U A R T E R R E P O R T

T O T A L E N E R G Y S E R V I C E S I N C .
R E P O R T T O S H A R E H O L D E R S
T O T A L E N E R G Y S E R V I C E S I N C .
F I R S T Q UA R T E R G R O W T HUnaudited (in millions of Canadian dollars)
(1) EBITDA means earnings before interest, taxes, depreciation and amortization and is equal to net income before income taxes plus finance costs plus depreciation less finance income. Cashflow means cash provided by operations before changes in non-cash working capital items. EBITDA and cashflow are not recognized measures under IFRS. Management believes that in addition to net income, EBITDA and cashflow are useful supplemental measures as they provide an indication of the results generated by the Company’s primary business activities prior to consideration of how those activities are financed, amortized or how the results are taxed in various jurisdictions as well as the cash generated by the Company’s primary business activities without consideration of the timing of the monetization of non-cash working capital items. Readers should be cautioned, however, that EBITDA and cashflow should not be construed as an alternative to net income determined in accordance with IFRS as an indicator of Total Energy’s performance. Total Energy’s method of calculating EBITDA and cashflow may differ from other organizations and, accordingly, EBITDA and cashflow may not be comparable to measures used by other organizations.
(2) Cashflow for the three months ended March 31, 2013 is net of $15.3 million on income taxes paid during the period that relates to 2012 taxable income as a result of the Company not having been required to make income tax installment payments during 2012. Cashflow for the three months ended March 31, 2015 is net of $12.7 million of income taxes paid during the period that relates to 2014 taxable income as a result of the Company not having been required to make income tax installment payments during 2014.
101.4
115.1
102.9
40.1
34.0
12.4
40.1
35.7
31.6
24.5
21.0
17.4
REVENUES EBITDA (1) CASHFLOW (1) NET INCOME (LOSS)
Q1 Q1 Q1 Q1
13 1412 13 141213(2)12
92.5
50.0
8.0
5.0
21.9
4.3
9.2
(2.1)
15 13 1412 15 1515(2)16 16 161614
3
F O C U S • D I S C I P L I N E • G R O W T H
T O T A L E N E R G Y S E R V I C E S I N C .
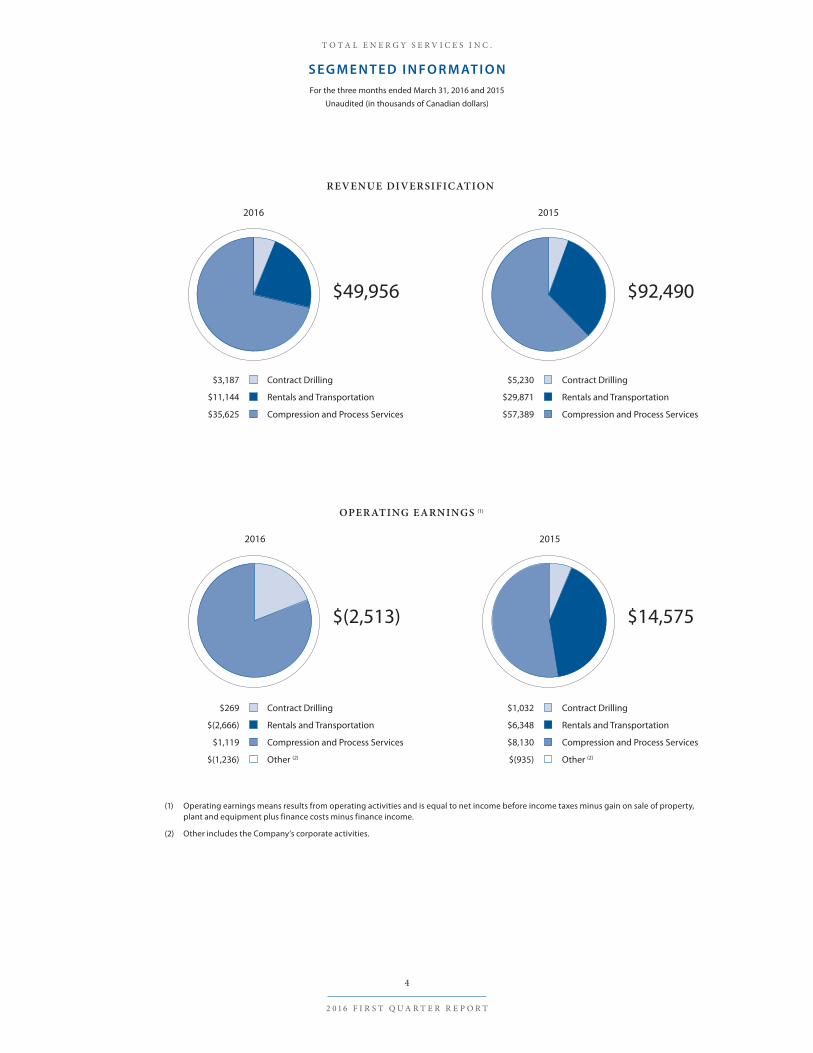
S E G M E N T E D I N F O R M AT I O NFor the three months ended March 31, 2016 and 2015
Unaudited (in thousands of Canadian dollars)
(1) Operating earnings means results from operating activities and is equal to net income before income taxes minus gain on sale of property, plant and equipment plus finance costs minus finance income.
(2) Other includes the Company’s corporate activities.
Contract Drilling
Rentals and Transportation
Compression and Process Services
$3,187
$11,144
$35,625
$49,956
2016
2016
$(2,513)
REVENUE DIVERSIFICATION
OPERATING EARNINGS (1)
Contract Drilling
Rentals and Transportation
Compression and Process Services
$269
$(2,666)
$1,119
Other (2)$(1,236)
Contract Drilling
Rentals and Transportation
Compression and Process Services
$5,230
$29,871
$57,389
$92,490
2015
2015
$14,575
Contract Drilling
Rentals and Transportation
Compression and Process Services
$1,032
$6,348
$8,130
Other (2)$(935)
4
2 0 1 6 F I R S T Q U A R T E R R E P O R T

T O T A L E N E R G Y S E R V I C E S I N C .
S E G M E N T E D I N F O R M AT I O NFor the three months ended March 31, 2016 and 2015
Unaudited (in thousands of Canadian dollars)
T O T A L E N E R G Y S E R V I C E S I N C .
M A N AG E M E N T ’ S D I S C U S S I O N A N D A N A LYS I S (“ M D & A” )
MANAGEMENT’S DISCUSSION AND ANALYSIS (“MD&A”)
The following MD&A, dated May 12, 2016, focuses on key statistics from the unaudited condensed interim consolidated financial statements of Total Energy Services Inc. (the “Company” or “Total Energy”) and pertains to known risks and uncertainties relating to the energy services industry. This discussion should not be considered all-inclusive, as it excludes changes that may occur in general economic, political and environmental conditions. This discussion and analysis of the financial condition and results of operations for the three months ended March 31, 2016, should be read in conjunction with the unaudited condensed interim consolidated financial statements for the three months ended March 31, 2016 and related notes and material contained in other parts of this report, the audited annual consolidated financial statements for the year ended December 31, 2015 and related notes and material contained in other parts of the 2015 Annual Report as well as the Company’s Annual Information Form (“AIF”). Additional information relating to Total Energy, including the Company’s AIF, may be found on SEDAR at www.sedar.com. Unless otherwise indicated, all dollar amounts presented herein are in Canadian dollars.
FORWARD-LOOKING STATEMENTS
Certain information and statements contained in this MD&A constitute forward-looking information, including the an-ticipated costs associated with the purchase of capital equipment, expectations concerning the nature and timing of growth within the various business divisions operated through affiliates of Total Energy, expectations respecting the competitive position of such business divisions, expectations concerning the financing of future business activities, statements as to future economic and operating conditions and expectations regarding the payment of dividends in the future. Readers should review the cautionary statement respecting forward-looking information that appears below.
The information and statements contained in this MD&A that are not historical facts are forward-looking statements. Forward-looking statements (often, but not always, identified by the use of words such as “seek”, “plan”, “continue”, “esti-mate”, “project”, “predict”, “potential”, “targeting”, “intend”, “could”, “might”, “should”, “believe”, “expect”, “may”, “antici-pate” or “will” and similar expressions) may include plans, expectations, opinions, or guidance that are not statements of fact. Forward-looking statements are based upon the opinions, expectations and estimates of management as at the date the statements are made and are subject to a variety of risks and uncertainties and other factors that could cause actual events or outcomes to differ materially from those anticipated or implied by such forward-looking statements. These factors include, but are not limited to, such things as changes in industry conditions (including the levels of capital expenditures made by oil and gas producers and explorers), the credit risk to which the Company is exposed in the conduct of its busi-ness, fluctuations in prevailing commodity prices or currency and interest rates, the competitive environment to which the various business divisions are, or may be, exposed in all aspects of their business, the ability of the Company’s various busi-ness divisions to access equipment (including parts) and new technologies and to maintain relationships with key suppliers, the ability of the Company’s various business divisions to attract and maintain key personnel and other qualified employ-ees, various environmental risks to which the Company’s business divisions are exposed in the conduct of their operations, inherent risks associated with the conduct of the businesses in which the Company’s business divisions operate, timing and costs associated with the acquisition of capital equipment, the impact of weather and other seasonal factors that affect business operations, availability of financial resources or third-party financing and the impact of new laws and regulations or changes in existing laws, regulations or administrative practices on the part of regulatory authorities, including without limitation taxation and environmental laws and regulations and changes in how such laws and regulations are interpreted and enforced. Forward-looking information respecting the anticipated costs associated with the purchase of capital equip-ment are based upon historical prices for various classes of equipment, expectations relating to the impact of inflation on the future cost of such equipment and management’s views concerning the negotiating position of the Company and its af-filiates. Forward-looking information concerning the nature and timing of growth within the various business divisions is based on the current budget of the Company (which is subject to change), factors that affected the historical growth of such business divisions, sources of historic growth opportunities and expectations relating to future economic and operating conditions. Forward-looking information concerning the future competitive position of the Company’s business divisions
5
F O C U S • D I S C I P L I N E • G R O W T H
T O T A L E N E R G Y S E R V I C E S I N C .
M A N A G E M E N T ’ S D I S C U S S I O N A N D A N A LY S I S
is based upon the current competitive environment in which those business divisions operate, expectations relating to future economic and operating conditions, current and announced build programs and other expansion plans of other organizations that operate in the energy service business. Forward-looking information concerning the financing of future business activities is based upon the financing sources on which the Company and its predecessors have historically relied and expectations relating to future economic and operating conditions. Forward-looking information concerning future economic and operating conditions is based upon historical economic and operating conditions, opinions of third-party analysts respecting anticipated economic and operating conditions. Although management of the Company believes that the expectations reflected in such forward looking statements are reasonable, it can give no assurance that such expecta-tions will prove to have been correct. Accordingly, readers should not place undue reliance upon any of the forward-looking information set out in this MD&A. All of the forward looking statements of the Company contained in this MD&A are expressly qualified, in their entirety, by this cautionary statement. The various risks to which the Company is exposed are described in additional detail in this MD&A under the heading “Risk Factors” below and in the Company’s AIF. Except as required by law, the Company disclaims any intention or obligation to update or revise any forward-looking information or statements, whether as a result of new information, future events or otherwise.
RESPONSIBILITY OF MANAGEMENT AND THE BOARD OF DIRECTORS
Management is responsible for the information disclosed in this MD&A and the accompanying unaudited condensed interim consolidated financial statements, and has in place appropriate information systems, procedures and controls to ensure that information used internally by management and disclosed externally is materially complete and reliable. In addition, the Company’s Audit Committee, on behalf of the Board of Directors, provides an oversight role with respect to all public financial disclosures made by the Company, and has reviewed and approved this MD&A and the accompanying unaudited condensed interim consolidated financial statements.
DISCLOSURE CONTROLS AND PROCEDURES AND INTERNAL CONTROL OVER FINANCIAL REPORTING
The Chief Executive Officer and the Chief Financial Officer, together with other members of management (collectively, the “Officers”), have designed the Company’s disclosure controls and procedures in order to provide reasonable assurance that the information required to be disclosed by the Company and its consolidated divisions, subsidiaries and partnerships in its filings or other reports submitted by it under securities legislation is in compliance with the time periods specified in the securities legislation. These disclosure controls and procedures include controls and procedures which have been designed to ensure that the information required to be disclosed by the Company and its consolidated divisions and subsidiaries in its filings or other reports submitted by it under securities legislation is accumulated and communicated to the Officers and others within those entities to allow timely decisions regarding required disclosure.
Additionally, the Officers have designed internal controls over financial reporting to provide reasonable assurance regard-ing the reliability of financial reporting and the preparation of financial statements for external purposes in accordance with IFRS. There were no changes to internal controls over financial reporting that would materially affect, or be reasonably likely to materially affect, the Company’s internal controls over financial reporting during the quarter ended March 31, 2016.
While the Officers have designed the Company’s disclosure controls and procedures and internal controls over financial reporting, they expect that these controls and procedures will not prevent all errors and fraud. A control system, no matter how well conceived or operated, can only provide reasonable, not absolute, assurance that the objectives of the control system are met.
6
2 0 1 6 F I R S T Q U A R T E R R E P O R T

T O T A L E N E R G Y S E R V I C E S I N C .
M A N A G E M E N T ’ S D I S C U S S I O N A N D A N A LY S I S
NON-IFRS MEASURES
Operating earnings means results from operating activities and is equal to net income (loss) before income taxes minus gain on sale of property, plant and equipment plus finance costs minus finance income. EBITDA means earnings before interest, taxes, depreciation and amortization and is equal to net income (loss) before income taxes plus finance costs and depreciation minus finance income. Cashflow means cash provided by operations before changes in non-cash working capital items. Operating earnings, EBITDA and cashflow are not recognized measures under IFRS. Management believes that in addition to net income, operating earnings, EBITDA and cashflow are useful supplemental measures as they provide an indication of the results generated by the Company’s primary business activities prior to consideration of how those activities are financed, amortized or how the results are taxed in various jurisdictions as well as the cash generated by the Company’s primary business activities without consideration of the timing of the monetization of non-cash working capital items. Readers should be cautioned, however, that operating earnings, EBITDA and cashflow should not be con-strued as an alternative to net income determined in accordance with IFRS as an indicator of Total Energy’s performance. Total Energy’s method of calculating operating earnings, EBITDA and cashflow may differ from other organizations and, accordingly, operating earnings, EBITDA and cashflow may not be comparable to measures used by other organizations. Reconciliations of these non-IFRS measures to the most directly comparable IFRS measure are outlined below.
Results from operating activities(in thousands of Canadian dollars)
Three monthsended
March 31, 2016
Three months ended
March 31, 2015
Net income (loss) and total comprehensive income (loss) $ (2,132) $ 9,183
Add back (deduct):
Finance income – (133)
Finance costs 523 2,546
Gain on sale of property, plant and equipment (334) (317)
Income tax (recovery) expense (570) 3,296
Results from (used in) operating activities $ (2,513) $ 14,575
EBITDA(in thousands of Canadian dollars)
Three monthsended
March 31, 2016
Three months ended
March 31, 2015
Net income (loss) and total comprehensive income (loss) $ (2,132) $ 9,183
Add back (deduct):
Depreciation 6,482 6,983
Finance income – (133)
Finance costs 523 2,546
Income tax (recovery) expense (570) 3,296
EBITDA $ 4,303 $ 21,875
Cashflow(in thousands of Canadian dollars)
Three monthsended
March 31, 2016
Three months ended
March 31, 2015
Cash provided by operations $ 12,686 $ 23,739
Add back (deduct):
Changes in non-cash working capital items (7,647) (16,239)
Cashflow $ 5,039 $ 7,500
7
F O C U S • D I S C I P L I N E • G R O W T H

T O T A L E N E R G Y S E R V I C E S I N C .
M A N A G E M E N T ’ S D I S C U S S I O N A N D A N A LY S I S
BUSINESS OF THE COMPANY
Total Energy is a public energy services company based in Calgary, Alberta. Through its operating divisions, wholly owned subsidiaries and limited partnerships, Total Energy is involved in three businesses: contract drilling services (“Chinook Drilling” or “Chinook”), the rental and transportation of equipment used in the drilling, completion and production of oil and natural gas wells (“Total Oilfield Rentals”) and the fabrication, sale, rental and servicing of new and used natural gas compression (“Bidell”) and process equipment (“Spectrum”). Substantially all of the operations of the Company are conducted within the Western Canadian Sedimentary Basin (“WCSB”), although Total Energy investigates opportunities from time to time to expand its operations outside of the WCSB. Bidell and Spectrum generate international sales from their Calgary based facilities and Total Oilfield Rentals and Bidell conduct business in the United States through United States corporate affiliates.
VISION, CORE BUSINESS AND STRATEGY
Total Energy is focused on building sustainable value for its shareholders through the disciplined management of its opera-tions and a commitment to growing its business in a capital efficient manner. Management believes that Total Energy’s existing business divisions provide a platform for building long-term shareholder value. Total Energy has achieved its growth by maintaining a disciplined acquisition strategy and undertaking measured and strategic organic growth. The Company intends to achieve ongoing expansion through organic growth and selective acquisitions.
Generally, the Company’s business strategy and marketing plans and strategy are as follows:
Contract Drilling Services: The Company currently operates a fleet of 18 rigs in western Canada. Of these rigs, 16 are telescopic doubles and two are telescopic singles with integrated top drives. The Company also maintains an extensive in-ventory of top drives, drill pipe and spare components to support its operations. The Company’s rig fleet has an established operating history in the horizontal well market, having drilled wells up to 6,000 meters total measured depth in Western Canada. The Company is focused on continuing to grow its drilling rig fleet to obtain the marketing and operational ef-ficiencies enjoyed by a larger fleet and monitors industry trends and developments to assess the type of equipment to add to its fleet. The Company expects to pursue the growth of its fleet through organic growth and the acquisition of modern and efficient equipment that is complementary to its existing fleet in an effort to distinguish its equipment from the competition and attract quality operations personnel.
Rentals and Transportation Services: Historically northern Alberta and northeastern British Columbia were the primary markets for the Company’s rentals and transportation services. In 2007, this division expanded its operations into south-eastern Saskatchewan and in 2012 into North Dakota. In early 2015, the Company established a presence in Wyoming through a corporate acquisition. The Company now operates out of 22 locations throughout Western Canada and the Northwestern United States and currently owns and operates approximately 10,000 pieces of rental equipment as well as a fleet of 115 heavy trucks. The Company seeks to invest in a modern and high quality equipment base supported by an exten-sive branch network in order to establish and maintain a significant presence in its target markets. The Company intends to pursue opportunities, both internal and acquisition, to increase its market share in its existing areas of operation and to further expand its geographic presence within the WCSB and the United States. The Company continuously evaluates opportunities to expand its product and service offering within existing areas of operation.
Compression and Process Services: The Company provides a full range of natural gas compression equipment and service as well as select oil and natural gas process equipment. While the Company historically has been focused on Western Canada, it has expanded its market to include international sales. The Company has and will continue to compete with its larger competitors by providing quality equipment and maintaining an efficient business model. The Company has increased its in-house engineering capabilities in order to focus on developing proprietary equipment designs that provide solutions to its customers. Total Energy has received patent protection in Canada, the United States, Europe, Australia and Mexico and is awaiting the receipt of a patent in India for its proprietary trailer-mounted compression package which is
8
2 0 1 6 F I R S T Q U A R T E R R E P O R T

T O T A L E N E R G Y S E R V I C E S I N C .
M A N A G E M E N T ’ S D I S C U S S I O N A N D A N A LY S I S
branded the NOMADTM. During 2010, the Company began an expansion of its parts and service business and currently op-erates out of 10 locations throughout Alberta, British Columbia, Saskatchewan and Wyoming. During 2012, the Company began establishing a presence in the process equipment fabrication business and in January 2013 expanded its presence in this business through the acquisition of an established process equipment business. The Compression and Process Services division currently occupies approximately 208,000 square feet of fabrication space.
OVERALL PERFORMANCE
The results for the three months ended March 31, 2016 reflect extremely challenging North American energy industry conditions, arguably the most difficult in the Company’s 20 year history. In such environment, the Company is focused on maintaining its financial strength and liquidity, preserving its operating assets and retaining key personnel. Price competi-tion has been fierce and the Company has taken significant steps to lower its operating cost structure so as to remain com-petitive without compromising the safety and quality of its service and equipment. However, the Company has declined to pursue business opportunities where variable operating costs are not covered (including depreciation in the case of drilling rigs) or customer credit risk is determined to be unacceptable. While this strategy has resulted in lower equipment utiliza-tion, it is expected to benefit the Company in two ways. First, bad debt expense will be minimized. Second, when industry conditions improve, the Company’s equipment fleet will be in a good state of repair and ready to resume normal operations in short order with relatively minimal expense. Consolidated revenue decreased 46% in the first quarter of 2016 relative to the prior year comparable period. For the three months ended March 31, 2016, the Company generated a net loss of $2.1 million as compared to net income of $9.2 million during the comparable period of 2015.
The Company’s financial condition remains strong, with a positive working capital balance of $87.7 million as at March 31, 2016 as compared to $90.3 million of working capital at December 31, 2015. Shareholders’ equity decreased by $3.6 mil-lion, during the first three months of 2016 due primarily to realizing a net loss and the continued payment of dividends to Shareholders.
KEY PERFORMANCE DRIVERS
Total Energy believes the following key performance drivers are critical to the success of its business.
• Oil and natural gas prices and the resulting cash flows, access to debt and equity financing and capital expenditures of its customers, the exploration and development companies that operate in the WCSB and, to a lesser extent, in other markets in which the Company competes.
• The expectations of its customers as to future oil and natural gas prices.
• The expectations of its customers as to oil and natural gas exploration and development prospects in North America.
• The prevailing competitive conditions in each of the business segments in which Total Energy competes.
• The general state of global and national financial markets which impact the Company’s and its customers’ access to debt and equity, which in turn affects the Company’s and its customers’ cost of capital and economic rate of return on the Company’s and its customers’ assets.
• Weather, which impacts both the ability to operate in the WCSB, as well as the overall demand for North American natural gas and heating oil.
• Effect of non-market forces such as government royalty and taxation policy, government incentives for renewable energy and regulatory changes, which create market uncertainty and affect industry activity levels.
• Access to, and retention of, qualified personnel.
9
F O C U S • D I S C I P L I N E • G R O W T H

T O T A L E N E R G Y S E R V I C E S I N C .
M A N A G E M E N T ’ S D I S C U S S I O N A N D A N A LY S I S
• Ongoing technological developments that influence resource development.
There are several key performance measures the Company uses to monitor and assess its performance relative to the key performance drivers, the implementation of its strategy, and the achievement of its goals and vision. Such measures include:
• Return on invested capital and return on equity.
• Safety and environmental stewardship. The Company has a health, safety and environmental management policy in place within each of its operating divisions. Targets and objectives are set within those policies.
CAPABILITY TO DELIVER RESULTS
Non-Capital Resources
Qualified people are the most critical non-capital resource required in order for the Company to achieve its goals set out in its strategic plan, particularly during periods of robust industry conditions when competition for skilled labour is greatest. During periods of low activity levels the Company strives to balance the retention of key personnel with its cost manage-ment objectives. The Company is continually evaluating its human resources levels to ensure that it has adequate human resources to meet its business requirements. In addition, succession planning is ongoing in order to mitigate the impact of planned or unplanned departures of key personnel. The Company believes that it presently has sufficient human resources to successfully operate its business and to execute its strategic plan.
Capital Resources
The Company has the necessary working capital to meet its current obligations and commitments. In order to finance future growth, Total Energy anticipates utilizing a combination of working capital, cashflow, existing and new debt facili-ties and new equity issuances.
Systems and Processes
The Company’s operational systems and processes are continually reviewed by management. The Company periodically evaluates existing systems and develops new ones as required.
In addition to certain risks, which are explained under the heading “Risk Factors” below and in the Company’s AIF, the following factors impact Total Energy’s business:
Seasonality and Cyclicality
The Company’s business is cyclical due to the nature of its customers’ cash flows and capital expenditures. Customers’ cash flows and capital expenditures are in turn affected by, among other things, oil and gas prices, access to capital, the prospects for oil and gas exploration and development in the geographical areas where the Company operates and the economics of oil and gas exploration and production in such areas compared to the economics of competing op-portunities. The Company currently has no material long-term contracts in place for the provision of its equipment and services.
Seasonality impacts the Company’s operations. Most of the Company’s operations are carried on in the WCSB. The ability to move heavy equipment in the Canadian oil and natural gas fields is dependent on weather conditions. As warm weather returns in the spring, the winter’s frost comes out of the ground rendering many secondary roads incapable of supporting the weight of heavy equipment until such roads have thoroughly dried out. The duration of this “spring breakup” has a direct impact on the Company’s activity levels. In addition, many exploration and production areas in northern Canada are accessible only in winter months when the ground is frozen hard enough to support equipment. The timing of freeze up and spring breakup affects the ability to move equipment in and out of these areas. As a result, late March through May is traditionally the Company’s slowest period.
10
2 0 1 6 F I R S T Q U A R T E R R E P O R T

T O T A L E N E R G Y S E R V I C E S I N C .
M A N A G E M E N T ’ S D I S C U S S I O N A N D A N A LY S I S
Trends and Outlook
North American oil and natural gas drilling and completion activity levels during the first quarter of 2016 were substan-tially lower than activity levels during the same period of 2015 and current industry conditions are as challenging as any faced by the Company during its 20 year history. Oil and natural gas prices remain low compared to historical levels and many North American oil and natural gas producers are in a difficult financial position which in turn has resulted in substantial reductions to their capital expenditure programs. As such, the Company expects that industry conditions for North American energy services providers will remain very challenging for the foreseeable future. Steps have been taken to right-size the Company’s operations in all business segments in response to reduced customer demand. Steps have also been taken to refocus sales efforts and relocate assets to jurisdictions based on future expected activity levels. Additional measures to rationalize the Company’s operating cost structure will be taken as future industry conditions may warrant. Despite a challenging near term outlook, the Company believes that long-term fundamentals require continued explora-tion and development in the WCSB and elsewhere, particularly in respect of unconventional oil and natural gas reserves, to meet global demand for oil and natural gas. A continued focus on the development of unconventional oil and natural gas resources in the WCSB is expected to continue to drive activity in the future, particularly should export opportunities for WCSB producers increase through the construction of new liquefied natural gas (“LNG”) export terminals and ad-ditional pipeline or other take-away capacity. The application of horizontal drilling and multi-stage fracturing completion technologies to oil and liquids rich natural gas resources has significantly increased drilling and completion activity in the WCSB targeting oil and natural gas liquids. As a result, the Company’s revenue base has become more weighted toward oil and natural gas liquids versus natural gas related activities whereas historically natural gas drilling and production activity was the primary driver of the Company’s revenues. The oil and gas service industry is highly reliant on the levels of capital expenditures made by oil and gas producers and explorers to find and produce oil, natural gas liquids and natural gas. These companies base their capital expenditures on several factors, including but not limited to current and expected hydrocarbon prices, exploration and development prospects and access to capital. Current indications are that 2016 WCSB capital expenditures will be substantially lower than 2015 levels.
Governmental and Environmental Regulation and Risk Management
The Company has a comprehensive insurance and risk management program in place to protect its assets, operations and employees. The Company also has programs in place to ensure it meets or exceeds current safety and environmental stan-dards. The Company has safety and environmental personnel responsible for maintaining and developing the Company’s policies and monitoring the Company’s operations in each division to ensure they are in compliance with such policies and applicable legislation. The safety and environmental personnel report to the divisional General Managers and directly to the Vice President of Operations of the Company. Corporate management reports to the Board of Directors quarterly on health, safety and environmental matters as well as on risk management generally.
RESULTS OF OPERATIONS
Consolidated Revenue
Revenue decreased 46% to $50.0 million for the three months ended March 31, 2016 versus $92.5 million for the comparable period in 2015.
Divisional Revenue
Divisional revenue for the three months ended March 31, 2016 was $3.2 million for Contract Drilling Services, $11.2 million for Rentals and Transportation Services and $35.6 million for Compression and Process Services.
Contract Drilling Services
The revenue reported from Total Energy’s Contract Drilling Services division decreased by 39% to $3.2 million for the three months ended March 31, 2016, as compared to $5.2 million for the same period in 2015. For the first quarter of 2016 the Contract Drilling Services division achieved a utilization rate, on a spud to release basis, of 12% as compared to 17% for the same period in 2015. The decrease in utilization during the first quarter of 2016 relative to 2015 was due to substantially
1 1
F O C U S • D I S C I P L I N E • G R O W T H
T O T A L E N E R G Y S E R V I C E S I N C .
M A N A G E M E N T ’ S D I S C U S S I O N A N D A N A LY S I S
decreased oil and natural gas drilling activity in Western Canada. Operating days (spud to release) for the three months ended March 31, 2016 totaled 196 days, with a fleet of 18 rigs, as compared to 263 days for the same period in 2015, with the same rig fleet. Revenue per operating day received for contract drilling services for the three months ended March 31, 2016 decreased 18% as compared to revenue per operating day during the same period of 2015. The decrease in revenue per operating day was due primarily to decreased day rate pricing.
Rentals and Transportation Services
The revenue reported from Total Energy’s Rentals and Transportation Services division decreased by 63% to $11.2 million, for the three months ended March 31, 2016, as compared to $29.9 million for the same period in 2015. The revenue decrease was due to reduced equipment utilization and lower pricing. Average utilization of the rental assets was 15%, for the three months ended March 31, 2016, as compared to 38% for the prior year comparable period. This division exited the first quarter of 2016 with approximately 10,000 pieces of rental equipment and a fleet of 115 heavy trucks as compared to 10,000 pieces of rental equipment and 119 heavy trucks at the end of March 2015.
Compression and Process Services
The revenue reported from Total Energy’s Compression and Process Services division decreased by 38% to $35.6 million for the three months ended March 31, 2016, as compared to $57.4 million for the same period in 2015. The revenue decrease was due primarily to lower demand for new equipment and a smaller compression rental fleet operating at a lower utilization rate compared to the prior year period. The reduction in the size of the compression rental fleet was due to the exercise of purchase options during 2015 and 2014. This division exited the first quarter of 2016 with a backlog of fabrication sales orders of approximately $49.4 million, as compared to a backlog of $86.6 million as at March 31, 2015 and $48.9 million at December 31, 2015. Included in the December 31, 2015 and March 31, 2016 backlog is an $8.1 million order purported to be cancelled without payment of the prescribed cancellation fee. Legal action has been taken to enforce such contract and no revenue has or will be recorded in respect of such order until resolution. As at March 31, 2016, the total horsepower of compressors on rent was approximately 11,200 as compared to approximately 38,400 as at March 31, 2015. The compression rental fleet experienced an average utilization of 35% (based on fleet horsepower) during three months ended March 31, 2016, as compared to 77% for the same period in 2015.
Other
Total Energy’s Other division consists of the Company’s corporate activities. The Other division does not generate any revenue but provides sales, operating and other support services to Total Energy’s operating divisions and wholly owned subsidiaries and partnerships and manages the corporate affairs of the Company.
Cost of Services
Cost of services decreased by 37% to $39.7 million, for the three month period ended March 31, 2016, as compared to $63.1 million for the same period in 2015. The decrease in cost of services resulted primarily from lower activity levels in all three operating segments. Gross margin, as a percentage of revenue, for the three months ended March 31, 2016 was 21%, as compared to 32% for the same period in 2015. The lower gross margin realized in 2016 compared to 2015 is a result of the Contract Drilling Services and Rentals and Transportation Services divisions contributing a lower portion of consolidated revenue in 2016 as compared to 2015 as both divisions historically generate a higher gross margin percentage than the Compression and Process Services division. Lower pricing in all three divisions during 2016 as compared to 2015 also contributed to the lower realized gross margin. A detailed margin analysis for each division is presented in the discussion of Results from Operating Activities. Cost of services consists of salaries and benefits for operations personnel, repairs, maintenance, and fuel, manufacturing costs and trucking costs.
Selling, General and Administrative Expenses
Selling, general and administrative expenses decreased by 25% to $5.8 million for the three months ended March 31, 2016, as compared to $7.7 million for the same period in 2015. The decrease was due to decreased activity levels and as a result of cost reduction initiatives taken.
1 2
2 0 1 6 F I R S T Q U A R T E R R E P O R T
T O T A L E N E R G Y S E R V I C E S I N C .
M A N A G E M E N T ’ S D I S C U S S I O N A N D A N A LY S I S
Included in these costs are compensation for directors and officers pursuant to the Company’s cash based compensation plans. Selling, general and administrative expenses also include salaries and benefits for office staff, rent, utilities, and communications in the Company’s various divisional offices and its corporate head office as well as professional fees and other costs to maintain the Company’s public listing.
Share-based Compensation Expense
Share-based compensation expense was $0.5 million for the three months ended March 31, 2016, as compared to $0.1 mil-lion for the prior year comparable period. Share-based compensation expense arises from share options granted pursuant to the share option plans implemented in 2015 and 2012. The increase in share-based compensation expense was due to share options being granted during 2015.
Depreciation Expense
Depreciation expense decreased by 7% to $6.5 million for the three months ended March 31, 2016, as compared to $7.0 mil-lion for the prior year comparable period. The decrease in depreciation expense was primarily due to a smaller compression rental fleet in the Compression and Process Services division and lower utilization of the Company’s contract drilling equipment. All of the Company’s property, plant and equipment is depreciated on a straight-line basis with the exception of contract drilling equipment which is depreciated on a utilization basis.
Results from Operating Activities
Operating results decreased to an operating loss of $2.5 million for the three months ended March 31, 2016 compared to operating earnings of $14.6 million for the comparable period in 2015. The decrease in operating earnings was due to decreased activity levels and lower pricing in all three divisions.
The Contract Drilling Services division had operating earnings of $0.3 million for the three months ended March 31, 2016, as compared to $1.0 million for the prior year comparable period. The operating earnings margins in this division was 8% for the three months ended March 31, 2016, as compared to 20% for the comparable period in 2015. The decrease in operat-ing earnings margin during the three months ended March 31, 2016 compared to the prior year comparable period was due primarily to lower rig utilization and decreased day rate pricing.
The Rentals and Transportation Services division had an operating loss of $2.7 million for the three months ended March 31, 2016, as compared to operating earnings of $6.3 million for the comparable period in 2015. The operating earnings margins in this division was negative 24% for the three months ended March 31, 2016, as compared to 21% for the compa-rable period in 2015. The decrease in operating earnings margin during the first three months of 2016 resulted from lower equipment utilization and pricing as compared to 2015 as well as the relatively high fixed cost structure of this division.
The Compression and Process Services division had operating earnings of $1.1 million for the three months ended March 31, 2016, as compared to $8.1 million for the comparable period in 2015. The operating earnings margins in this division was 3% for the three months ended March 31, 2016, as compared to 14% for the comparable period in 2015. The decrease in operating earnings margin during the first three months of 2016 compared to 2015 was due to lower production levels arising from lower customer demand and a 71% decrease in the amount of compression horsepower on rent at March 31, 2016 compared to March 31, 2015.
The Other division had an operating loss of $1.2 million for the three months ended March 31, 2016, as compared to $0.9 million for the comparable period in 2015. The increase in the operating loss during the three months ended March 31, 2016 was due to an increase in share-based compensation expense. The Other division does not include any direct sales activities relating to Total Energy’s business and therefore does not generate any revenue.
Finance income
Finance income was nil for the three months ended March 31, 2016, as compared to $0.1 million for the same period in 2015. Finance income includes dividends, interest income on bank balances and other ancillary interest income.
1 3
F O C U S • D I S C I P L I N E • G R O W T H
T O T A L E N E R G Y S E R V I C E S I N C .
M A N A G E M E N T ’ S D I S C U S S I O N A N D A N A LY S I S
Finance Costs
Finance costs were $0.5 million for the three months ended March 31, 2016, as compared to $2.5 million for the same period in 2015. The decrease in finance costs was due primarily to a lower unrealized decrease in the market value of other assets and a decrease in interest expense due to the redemption of the convertible debentures in May of 2015. Other assets include marketable securities of publically traded entities. Finance costs also include interest paid on finance leases, interest expense on the Term Loan (as defined under the heading “Liquidity and Capital Resources”) and, during the three months ended March 31, 2015, interest expense (including accretion) on the convertible debentures.
Gain on Sale of Property, Plant and Equipment
During the three months ended March 31, 2016 and 2015, the Company realized a gain on disposal of equipment of $0.3 million. Disposals of equipment result from the exercise of purchase options on compression equipment previously on lease in the Compression and Process Services division as well as the replacement and upgrade of older equipment in the Company’s fleet.
Income Taxes and Net income
The Company recorded a net loss of $2.1 million ($0.07 loss per share basic and diluted) for the three months ended March 31, 2016 as compared to net income of $9.2 million ($0.30 per share basic and diluted) for the corresponding period in 2015. The Company recorded a current income tax expense of $0.3 million for the three months ended March 31, 2016, as compared to $2.4 million for the corresponding period in 2015. The Company recorded a deferred income tax recovery of $0.9 million for the three months ended March 31, 2016, as compared to a deferred tax expense of $0.9 million for the corresponding period in 2015. The decrease in current and deferred income taxes during the first three months of 2016 was due primarily to the lower net operating results before income tax as compared to the same period in 2015 and timing of taxation of the Company’s limited partnerships. This resulted in a negative income tax rate for the three months ended March 31, 2016 as compared to effective income tax rate of 26% for the prior year comparable period.
On August 30, 2015 Company was notified by the Canada Revenue Agency (the “CRA”) that certain of the Company’s income tax filings related to its conversion from an income trust to a corporation in 2009 were being re-assessed. Specifically, the CRA increased the Company’s taxable income by $56.1 million and denied $1.7 million of investment tax credits claimed (the “Reassessment”). The Reassessment is based entirely on the CRA’s proposed application of the general anti-avoidance rule (“GAAR”) and gives rise to approximately $14.1 million of federal income tax payable. In September 2015 the Company paid 50% of the Reassessment amount, or $7.1 million, to the CRA as required pending appeal. On November 4, 2015, related provincial income tax reassessments totaling $5.6 million (including interest and penalties) were received.
The Company has received both legal and tax advice relating to its conversion from an income trust to a corporation indi-cating that its income tax filing position is strong. As such, the Company has filed notices of objection in response to the Reassessment and intends to vigorously defend its filing position and seek reimbursement from the CRA for the costs aris-ing from having to defend such Reassessment to the fullest extent possible. Management believes that it will be successful in defending its tax filing position, and as such, the Company has not recognized any provision for the Reassessment at March 31, 2016. The $7.1 million paid on account of the Reassessment has been recorded as income tax receivable on the basis management believes it will be successful in its defending the Company’s filing position. In the event the Company is not successful, an additional $12.7 million of cash may be owing and $19.8 million of income tax expense would be recognized.
LIQUIDITY AND CAPITAL RESOURCES
Cash Provided by Operations
Cash provided by operations was $12.7 million for the three months ended March 31, 2016, as compared to $23.7 million for the comparable period in 2015. Cashflow was $5.0 million for the three months ended March 31, 2016, as compared to $7.5 million for the comparable period in 2015. The changes in cash provided by operations and cashflow were due primarily to changes in operating earnings and working capital balances, including income taxes of $12.7 million paid in 2015 that
14
2 0 1 6 F I R S T Q U A R T E R R E P O R T
T O T A L E N E R G Y S E R V I C E S I N C .
M A N A G E M E N T ’ S D I S C U S S I O N A N D A N A LY S I S
related to 2014 taxable income. The Company reinvests the remaining cash provided by operations after required long-term debt and finance lease payments and dividend payments to shareholders into the internal growth of existing businesses, acquisitions, voluntary repayment of long-term debt or the repurchase of Company’s shares pursuant to the Company’s normal course issuer bid.
Investments
Net cash used in investing activities was $5.6 million for the three months ended March 31, 2016, as compared to $18.7 million for the comparable period in 2015. The decrease in net cash used in investment activities during 2016 compared to 2015 was due primarily to decreased purchases of other assets and property, plant and equipment. $2.3 million of property, plant and equipment (“PP&E”) purchases and a $3.6 million acquisition during the first three months of 2016 were allocated as follows: $0.1 million in the Contract Drilling Services division relating primarily to the purchase of rig equipment, $4.9 million in the Rentals and Transportation Services division relating primarily to purchases of new and used rental equip-ment and $1.0 million in the Compression and Process Services division relating primarily to additions to the compression rental fleet. During the first quarter of 2015, the property, plant and equipment additions were as follows: $0.3 million in the Contract Drilling Services division, $4.7 million in the Rentals and Transportation Services division and $2.6 million in the Compression and Process Services. The purchase of property, plant and equipment and the acquisition of assets during the first three months of 2016 was offset by proceeds on disposal of property, plant and equipment of $2.3 million as compared to $1.2 million during the same period of 2015. The disposal of equipment resulted from the replacement and upgrade of older equipment in the Company’s fleet.
The $3.6 million acquisition relates to the acquisition of substantially all of the operating assets of a United States oilfield rental company through a wholly-owned United States subsidiary.
Financing
Net cash used in financing activities was $3.6 million for the three months ended March 31, 2016, as compared to $4.7 mil-lion for the comparable period in 2015. The decrease in net cash used in financing activities in 2016 was due primarily to decreased interest expense on account of the redemption of $69 million of convertible debentures in May of 2015.
Liquidity
The Company had a working capital surplus of $87.7 million as at March 31, 2016 as compared to $90.3 million as at December 31, 2015. As at March 31, 2016, and the date of this MD&A, the Company is in material compliance with all debt covenants.
On February 5, 2015, the Company renewed its operating facility (the “Operating Facility”) with a major Canadian financial institution. The Operating Facility is a $65 million committed revolving facility with payments not required until February 2017 in the event such facility is not renewed. The Operating Facility bears interest at the lender’s prime rate plus 0.40% and is secured by the Company’s cash and cash equivalents, accounts receivable and inventory. As at March 31, 2016, this facility was undrawn and available to the extent of $51.7 million based on margin requirements.
On May 19, 2015, the Company completed the redemption of all outstanding 5.75% convertible unsecured subordinated debentures (the “Debentures”) that were due to mature on March 31, 2016. Upon redemption, the Company paid to the holders of the Debentures $1,007.72 per $1,000 principal amount of Debentures held less any taxes required to be deducted or withheld, which was equal to the outstanding principal amount of the Debentures plus accrued and unpaid interest up to, but excluding, the redemption date. In connection with the redemption of the Debentures, the Company secured a $50 million bank loan (the “Term Loan”) with the Company’s primary bank.
The Term Loan is a five year term loan amortized over 20 years with blended monthly principal and interest payments of approximately $278,800. At the end of the five year term, approximately $40.2 million of principal will become due and payable assuming only regular monthly payments are made. The Term Loan bears a fixed interest rate of 3.06% and is secured by certain of the Company s̀ real estate assets. In April 2015, the Company received an independent third party
1 5
F O C U S • D I S C I P L I N E • G R O W T H
T O T A L E N E R G Y S E R V I C E S I N C .
M A N A G E M E N T ’ S D I S C U S S I O N A N D A N A LY S I S
report indicating the current market value of its real estate holdings at the time to be approximately $110 million, of which properties having an ascribed value of approximately $72 million have been mortgaged to secure the Term Loan.
The Term Loan and the Operating Facility require that the Company’s total debt to equity ratio not exceed 2.5 to 1.0 and the Company maintain a current ratio of at least 1.3 to 1.0. As at March 31, 2016, the Company’s total debt to equity ratio was 0.10 to 1.0 and the current ratio was 4.05 to 1.0. For purposes of determining compliance with such financial covenants, total debt includes bank debt and finance lease obligations, including the current portion, minus cash and cash equivalents and the current ratio is equal to current assets minus current liabilities (excluding the current portion of long-term debt and obligations under finance leases).
The Company expects that cash and cash equivalents, cash flow from operations, together with existing and available credit facilities, will be sufficient to fund its presently anticipated requirements for investments in working capital and capital assets as well as required debt and finance lease payments, dividend payments and common share repurchases.
Dividends
For the three months ended March 31, 2016 and 2015, the Company declared dividends of $1.9 million ($0.06 per share).
For 2016, the Company expects cash provided by operations and cashflow to exceed dividends to shareholders. Management and the Board of Directors of the Company will monitor the Company’s dividend policy in the context of forecasted net income, cashflow, cash provided by operations, debt levels, capital expenditures and other investment opportunities and will aim to finance future dividends through cash provided by operations.
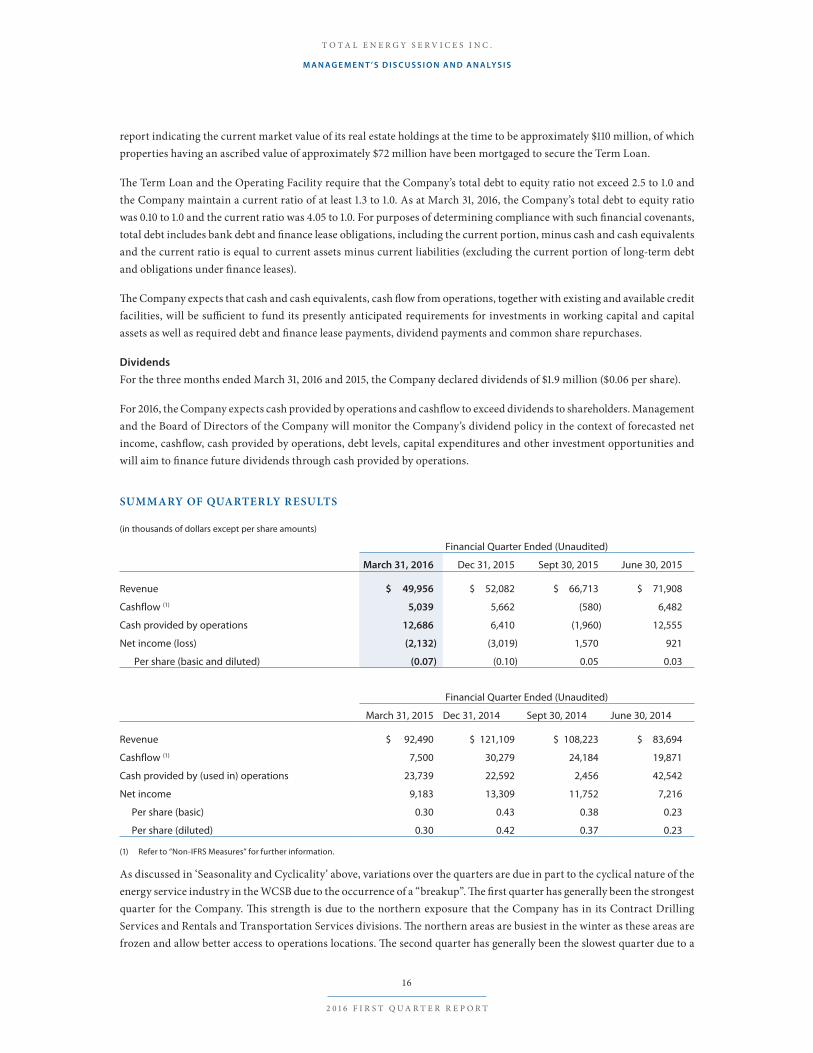
SUMMARY OF QUARTERLY RESULTS
(in thousands of dollars except per share amounts)
Financial Quarter Ended (Unaudited)
March 31, 2016 Dec 31, 2015 Sept 30, 2015 June 30, 2015
Revenue $ 49,956 $ 52,082 $ 66,713 $ 71,908
Cashflow (1) 5,039 5,662 (580) 6,482
Cash provided by operations 12,686 6,410 (1,960) 12,555
Net income (loss) (2,132) (3,019) 1,570 921
Per share (basic and diluted) (0.07) (0.10) 0.05 0.03
Financial Quarter Ended (Unaudited)
March 31, 2015 Dec 31, 2014 Sept 30, 2014 June 30, 2014
Revenue $ 92,490 $ 121,109 $ 108,223 $ 83,694
Cashflow (1) 7,500 30,279 24,184 19,871
Cash provided by (used in) operations 23,739 22,592 2,456 42,542
Net income 9,183 13,309 11,752 7,216
Per share (basic) 0.30 0.43 0.38 0.23
Per share (diluted) 0.30 0.42 0.37 0.23
(1) Refer to “Non-IFRS Measures” for further information.
As discussed in ‘Seasonality and Cyclicality’ above, variations over the quarters are due in part to the cyclical nature of the energy service industry in the WCSB due to the occurrence of a “breakup”. The first quarter has generally been the strongest quarter for the Company. This strength is due to the northern exposure that the Company has in its Contract Drilling Services and Rentals and Transportation Services divisions. The northern areas are busiest in the winter as these areas are frozen and allow better access to operations locations. The second quarter has generally been the slowest quarter due to a
16
2 0 1 6 F I R S T Q U A R T E R R E P O R T
T O T A L E N E R G Y S E R V I C E S I N C .
M A N A G E M E N T ’ S D I S C U S S I O N A N D A N A LY S I S
“breakup” as described above. Many of the areas that the Company operates in are not accessible during this period when ground conditions do not permit the movement of heavy equipment. The third quarter has generally been the third busiest quarter, as some of the issues associated with a “breakup” are no longer affecting access to areas of operations. The fourth quarter has usually been the second busiest quarter of the year as customers are generally able to start accessing northern areas with the onset of winter and the ground freezing. Notwithstanding the foregoing, the significant downturn in North American oil and natural gas industry activity that began in mid-2014 has skewed activity levels such that historical sea-sonality trends have not been experienced since the latter part of 2015.
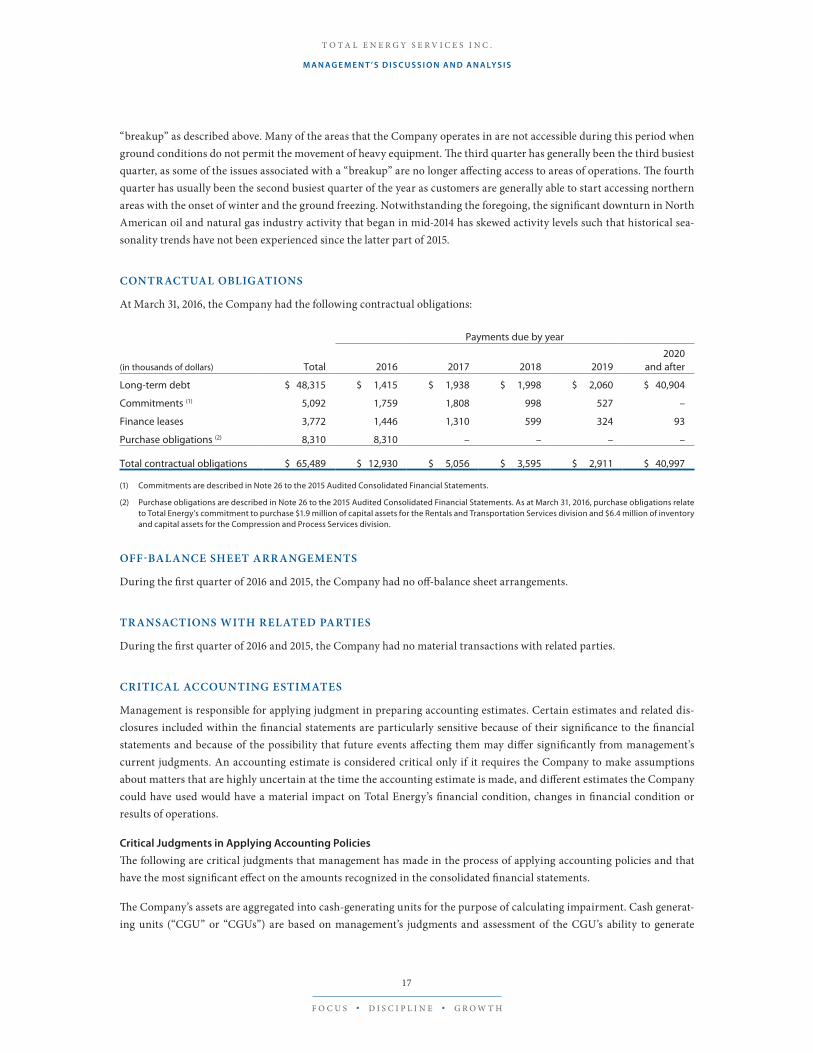
CONTRACTUAL OBLIGATIONS
At March 31, 2016, the Company had the following contractual obligations:
Payments due by year
(in thousands of dollars) Total 2016 2017 2018 20192020
and after
Long-term debt $ 48,315 $ 1,415 $ 1,938 $ 1,998 $ 2,060 $ 40,904
Commitments (1) 5,092 1,759 1,808 998 527 –
Finance leases 3,772 1,446 1,310 599 324 93
Purchase obligations (2) 8,310 8,310 – – – –
Total contractual obligations $ 65,489 $ 12,930 $ 5,056 $ 3,595 $ 2,911 $ 40,997
(1) Commitments are described in Note 26 to the 2015 Audited Consolidated Financial Statements.
(2) Purchase obligations are described in Note 26 to the 2015 Audited Consolidated Financial Statements. As at March 31, 2016, purchase obligations relate to Total Energy’s commitment to purchase $1.9 million of capital assets for the Rentals and Transportation Services division and $6.4 million of inventory and capital assets for the Compression and Process Services division.
OFF-BALANCE SHEET ARRANGEMENTS
During the first quarter of 2016 and 2015, the Company had no off-balance sheet arrangements.
TRANSACTIONS WITH RELATED PARTIES
During the first quarter of 2016 and 2015, the Company had no material transactions with related parties.
CRITICAL ACCOUNTING ESTIMATES
Management is responsible for applying judgment in preparing accounting estimates. Certain estimates and related dis-closures included within the financial statements are particularly sensitive because of their significance to the financial statements and because of the possibility that future events affecting them may differ significantly from management’s current judgments. An accounting estimate is considered critical only if it requires the Company to make assumptions about matters that are highly uncertain at the time the accounting estimate is made, and different estimates the Company could have used would have a material impact on Total Energy’s financial condition, changes in financial condition or results of operations.
Critical Judgments in Applying Accounting Policies
The following are critical judgments that management has made in the process of applying accounting policies and that have the most significant effect on the amounts recognized in the consolidated financial statements.
The Company’s assets are aggregated into cash-generating units for the purpose of calculating impairment. Cash generat-ing units (“CGU” or “CGUs”) are based on management’s judgments and assessment of the CGU’s ability to generate
17
F O C U S • D I S C I P L I N E • G R O W T H

T O T A L E N E R G Y S E R V I C E S I N C .
M A N A G E M E N T ’ S D I S C U S S I O N A N D A N A LY S I S
independent cash inflows. Judgments are also required to assess when impairment indicators exist and impairment testing is required.
The Company is required to exercise judgment in assessing whether the criteria for recognition of a provision or a con-tingency have been met. The Company considers whether a present obligation exists, probability of loss and if a reliable estimate can be formulated.
The Company’s functional currency is based on the primary economic environment in which it operates and is based on an analysis of several factors including which currency principally affects sales prices of products sold by the Company, which currency influences the main expenses of providing services, in which currency the Company keeps it receipts from operating activities and in which currency the Company has received financing.
The Company makes judgments regarding the determination of its reportable segments, including aggregation criteria (as appropriate), for segmented reporting.
Judgments are made by management to determine the likelihood of whether deferred income tax assets at the end of the reporting period will be realized from future taxable earnings.
Key Sources of Estimation Uncertainty
The following are key estimates and their assumptions made by management affecting the measurement of balances and transactions in these consolidated financial statements.
Where impairment indicators exist or annually for goodwill, the recoverable amount of the asset or CGU is determined using the greater of fair value less costs to sell or value-in-use. Value-in-use calculations require assumptions for discount rates and estimations of the timing for events or circumstances that will affect future cash flows. Fair value less costs to sell requires management to make estimates of fair value using market conditions for similar assets as well as estimations for costs to sell taking into account dismantle and transportation costs.
The Company is required to estimate the amount of provisions and contingencies based on the estimated future outcome of the event.
The Company uses the percentage-of-completion method in accounting for its equipment manufacturing contract revenue. Use of the percentage-of-completion method requires estimates of the stage of completion of the contract to date as a proportion of the total work to be performed.
As pertains to property, plant and equipment the Company is required to estimate the residual value and useful lives of assets for purposes of depreciation.
As pertains to accounts receivable the Company is required to estimate allowances for doubtful accounts based on historic collection trends and experiences with customers.
In a business combination, management makes estimates of the fair value of assets acquired and liabilities assumed which includes assessing the value of property, plant and equipment and intangible assets being acquired.
The Company’s estimate of stock-based compensation is dependent upon estimates of historic volatility and forfeiture rates.
The Company’s estimate of the fair value of derivative financial instruments is dependent on estimated forward prices / rates and volatility in those prices / rates.
The Company’s estimate of the fair value of other assets is based on the market prices quoted on the relevant stock ex-changes. Such market prices are volatile and subject to change.
18
2 0 1 6 F I R S T Q U A R T E R R E P O R T
T O T A L E N E R G Y S E R V I C E S I N C .
M A N A G E M E N T ’ S D I S C U S S I O N A N D A N A LY S I S
The deferred tax liability is based on estimates as to the timing of the reversal of temporary differences, substantively enacted tax rates and the likelihood of assets being realized.
FINANCIAL INSTRUMENTS
Risk management activities
The Company does not have significant exposure to any individual customer or counter party other than one intermediate oil and gas company, which accounted for over 10% of revenue during the three month period ended March 31, 2016. No other customer accounted for more than 10% of revenue during this period. Concentration of credit risk on the Company’s trade accounts receivable exists in the oil and gas industry.
Fair values
The carrying values of cash and cash equivalents, accounts receivable, accounts payable and accrued liabilities, dividends payable and obligations under finance leases approximate their fair value due to the relatively short periods to maturity of the instruments. Other assets include marketable securities and are designated as financial assets measured at fair value. Changes in fair value are recorded in profit or loss. As at March 31, 2016, the fair value of other assets was approximately $5.6 million. The discounted future cash repayments of the Term Loan is calculated using prevailing market rates for a similar debt instrument as at the reporting date. The net present value of future cash repayments of the Term Loan is $48.7 mil-lion utilizing an interest rate for a similar debt instrument at March 31, 2016 of 2.82%. The carrying value and Company s̀ liability with respect to the Term Loan is $48.3 million.
Interest rate risk
As at March 31, 2016, the Company did not have any long-term debt that was subject to variable interest rates. The Term Loan bears interest at a fixed rate of 3.06%.
Foreign currency risk
The Company’s sales are predominantly denominated in Canadian dollars, which is the Company’s functional currency, and as such the Company does not have significant exposure to foreign currency exchange rate risk. Where sales are de-nominated in a currency other than Canadian dollars, the Company may enter into forward currency contracts to mitigate its exposure to exchange rate fluctuations from the date of sale until the date of receipt of funds. Where foreign currency denominated purchases are made, it is the Company’s practice to pay invoiced amounts within 15 days of receipt of invoice to reduce the Company s̀ exposure to foreign exchange risk. In addition, from time to time the Company purchases funds in the foreign currency to which the order is denominated to mitigate against foreign exchange rate changes from the date of ordering to when payment is made. Pricing to customers is also customarily adjusted to reflect changes in the Canadian dollar landed cost of imported goods.
1 9
F O C U S • D I S C I P L I N E • G R O W T H

T O T A L E N E R G Y S E R V I C E S I N C .
M A N A G E M E N T ’ S D I S C U S S I O N A N D A N A LY S I S
OUTSTANDING COMPANY SHARE DATA
As at the date of this report the Company had 30,985,000 Common Shares outstanding.
Summary information with respect to share options outstanding is provided below:
Outstanding atMarch 31, 2016 Exercise Price
Remaining life(years)
Exercisable atMarch 31, 2016
75,000 $ 14.21 0.20 75,000
1,140,000 13.74 1.10 1,140,000
76,666 14.96 1.90 76,666
53,334 14.72 2.10 26,667
150,000 17.61 2.50 100,000
1,400,000 14.13 4.30 –
2,895,000 $ 14.19 2.74 1,418,333
There has been no material change in the Common Share data from March 31, 2016 to the date of this report.
RISK FACTORS
The following is a summary of certain risk factors relating to the activities of the Company and its subsidiaries.
Risks Relating to the Energy Services Business
General
Certain activities of the Company are affected by factors that are beyond its control or influence. The business and activi-ties of the Company are directly affected by fluctuations in the levels of oil and natural gas exploration, development and production activity carried on by its customers, which in turn, is dictated by numerous factors, including world energy prices and government policies. Any addition to or elimination or curtailment of government incentives or other material changes to government regulation of the energy industry in North America could have a significant impact on the oilfield service industry in North America. The substantial decline in oil prices that began in 2014 and continued low natural gas prices are expected to have a material adverse impact on the North American energy services industry for the foreseeable future.
Industry Conditions
The oil and gas service industry is highly reliant on the levels of capital expenditures made by oil and gas explorers and pro-ducers. Exploration and production companies base their capital expenditures on various factors, including but not limited to realized oil and natural gas prices, exploration and development prospects in various jurisdictions, production levels of their reserves and access to capital. Oil and gas producers and explorers tend to examine long-term fundamentals affecting the foregoing factors before they adjust their capital expenditure plans. Risk factors associated with the Company’s opera-tions include business factors and changes in government regulation. Should one or more of these risks materialize, actual results may vary materially from those currently anticipated. In recent years, commodity prices, and therefore, the levels of drilling, production and exploration activity have been volatile. Any prolonged, substantial reduction in commodity prices will likely affect the activity levels of the exploration and production companies and the demand for the Company’s products and services. A significant prolonged decline in commodity prices would have a material adverse effect on the Company’s business, results of operations and financial condition, including the Company’s ability to pay dividends to its Shareholders. Since 2014, North American oil and natural gas drilling and completion activity has declined materially re-sulting in current industry conditions being as difficult as any faced by the Company since commencing operations in 1997.
2 0
2 0 1 6 F I R S T Q U A R T E R R E P O R T

T O T A L E N E R G Y S E R V I C E S I N C .
M A N A G E M E N T ’ S D I S C U S S I O N A N D A N A LY S I S
Government Regulation
Total Energy’s business and the business of its customers are subject to significant and evolving laws and government regulations, including in the areas of environment, health and safety. Changes to such laws and regulations may impose additional costs on Total Energy and may affect its business in other ways, including the requirement to comply with various operating procedures and guidelines that may impact Total Energy’s operations. Total Energy has in place, in each of its divisions, programs for monitoring compliance to ensure that it meets or exceeds applicable laws and regulatory requirements. Ensuring a healthy and safe workplace minimizes injuries and other risks employees may face in carrying out their duties, improves productivity and avoids penalties or other costs and liabilities.
Material changes to the regulations and taxation of the energy industry may reasonably be expected to have an impact on the energy services industry. A material increase in royalties or other regulatory burdens would reasonably be expected to result in a material decrease in industry drilling and production activity in the applicable jurisdiction, which in turn would lead to corresponding declines in the demand for the goods and services provided by the Company in such jurisdiction. Conversely, reductions in royalties and other government regulations may reasonably be expected to have a positive impact on Total Energy’s business.
Any initiatives by Canada or the provinces in which the Company operates to set legally binding targets to reduce emis-sions of carbon dioxide, methane, nitrous oxide and other so-called “greenhouse gases” could have direct or indirect compliance costs. Such initiatives and costs may adversely affect the oil and gas business in Canada, which in turn may adversely affect the oil and gas services industry in which the Company participates. The impact of such effects and/or costs is not yet certain.
Credit Risk
A substantial portion of the Company’s accounts receivable are with customers involved in the oil and gas industry, whose cash flow may be significantly impacted by many factors including commodity prices, the success of drilling programs, well reservoir decline rates and access to capital. The Company does not have significant exposure to any individual customer or counter party other than one intermediate oil and gas company, which accounted for over 10% of revenue during the three month period ended March 31, 2016. No other customer accounted for more than 10% of revenue during this period. Concentration of credit risk on the Company s̀ trade accounts receivable exists in the oil and gas industry. Although collec-tion of these receivables could be influenced by economic factors affecting this industry, management considers the risk of a significant loss to be remote at this time. Management is sensitive to and is continuously monitoring the impact of ongoing global economic and financial challenges and uncertainties on credit risk to the Company.
Currency Fluctuations
The Compression and Process Services division, and in particular Bidell, obtains critical components and parts from U.S. suppliers and is therefore subject to foreign exchange rate fluctuations in the procurement of those materials. Where Bidell is contracted to undertake custom work, an exchange rate fluctuation provision is included in the relevant purchase order to reduce Bidell’s exposure to such fluctuations. When Bidell has sales denominated in a currency other than Canadian dol-lars, it may enter into forward currency contracts to mitigate its exposure to exchange rate fluctuations from the date of sale until the date of receipt of funds. The Company’s Contract Drilling Services division and the Rentals and Transportation Services division purchase certain capital equipment from U.S. suppliers and are also subject to foreign exchange rate fluctuations in the procurement of those items. Total Energy has taken measures that it considers reasonable to mitigate its exposure to exchange rate fluctuations, including the purchase of foreign currencies in an amount approximately equal to such foreign currency obligations at any given time. However, there can be no assurance that such measures will reduce Total Energy’s exposure to currency fluctuations to a level that is not material.
Competition
The various business segments in which the Company participates are highly competitive. The Company competes with several large national and multinational organizations in the contract drilling services, rental and transportation services
2 1
F O C U S • D I S C I P L I N E • G R O W T H

T O T A L E N E R G Y S E R V I C E S I N C .
M A N A G E M E N T ’ S D I S C U S S I O N A N D A N A LY S I S
and compression and process services businesses. Many of those national and multinational organizations have greater financial and other resources than the Company. There can be no assurance that such competitors will not substantially increase the resources devoted to the development and marketing of products and services that compete with those of the Company or that new competitors will not enter the various markets in which the Company is active. In certain aspects of its business, the Company also competes with a number of small and medium-sized companies, which, like the Company, have certain competitive advantages such as low overhead costs and specialized regional strengths.
Access to Parts, Development of New Technology and Relationships with Key Suppliers
The ability of Bidell to compete and expand is dependent on Bidell having access, at a reasonable cost, to equipment, parts and components, which are at least technologically equivalent to those utilized by competitors and to the development and acquisition of new and competitive technologies. Although Bidell has secured individual distribution agreements with various key suppliers, there can be no assurance that those sources of equipment, parts, components or relationships with key suppliers will be maintained. If these sources and relationships are not maintained, Bidell’s ability to compete may be impaired. Bidell is able to access certain distributors and secure discounts on parts and components that would not be available if it were not for its relationship with certain key suppliers. Should the relationships with key suppliers come to an end, the availability and cost of securing certain equipment and parts may be adversely affected. The ability of Chinook to compete and expand is dependent upon Chinook having access, at a reasonable cost, to drilling equipment and supplies that are at least technologically equivalent to those utilized by competitors and to the development and acquisition of new and competitive technologies as industry conditions require. There can be no assurance that existing sources for equipment will be maintained or that new technologically advanced equipment will be acquired. If such equipment is not available, Chinook’s ability to compete may be impaired.
Employees
The success of the Company is dependent upon its key personnel. Any loss of the services of such persons could have a ma-terial adverse effect on the business and operations of the Company. The ability of the Company to expand its services will be dependent upon its ability to attract additional qualified employees in all of its divisions. While attracting and retaining skilled personnel requires continuous effort and attention, the ability to obtain the services of qualified and skilled person-nel is particularly challenging in times of strong industry activity. The Company’s financial performance may be negatively impacted by the additional costs to retain and secure qualified personnel to fully conduct its various business affairs.
Environmental Liability Risks
Total Energy routinely deals with natural gas, oil and other petroleum products. The Company has established programs to address compliance with current environmental standards and monitors its practices concerning the handling of en-vironmentally hazardous materials. The Company also generally performs “phase 1” environmental studies on all of its properties prior to acquisition to minimize the risk of acquisition of a contaminated property. However, there can be no assurance that the Company’s procedures will prevent environmental damage occurring from spills of materials handled by the Company or that such damage has not already occurred. As a result of its fabrication and refurbishing operations, Bidell also generates or manages hazardous wastes, such as solvents, thinners, waste paint, waste oil, washdown wastes and sandblast material.
Although the Company attempts to identify and address contamination issues before acquiring properties, and attempts to utilize generally accepted operating and disposal practices, hydrocarbons or other wastes may have been disposed of or released on or under properties owned, leased, operated or worked on by the Company or on or under other locations where such wastes have been taken for disposal. These properties and the wastes disposed thereon may be subject to environmen-tal laws that could require the Company to remove the wastes or remediate sites where they have been released.
Potential Operating Risks and Insurance
Total Energy has an insurance and risk management program in place which has been implemented in an effort to protect its assets, operations and employees. Total Energy also has programs in place to address compliance with current safety
2 2
2 0 1 6 F I R S T Q U A R T E R R E P O R T

T O T A L E N E R G Y S E R V I C E S I N C .
M A N A G E M E N T ’ S D I S C U S S I O N A N D A N A LY S I S
and regulatory standards. Total Energy has a health and safety manager in each division who is responsible for maintaining and developing policies and monitoring operations vis-à-vis those policies. Third party consultants are also retained as required to assist the divisional health and safety managers. Each health and safety manager is required to report incidents directly to the Vice President of Operations of Total Energy.
The Company’s operations are subject to risks inherent in the oil and gas drilling and production services industry, such as equipment defects, malfunction and failures and natural disasters with resultant uncontrollable flows of oil, gas or well fluids, fires, spills and explosions.
These risks could expose the Company to substantial liability for personal injury, loss of life, business interruption, prop-erty damage or destruction, pollution and other environmental damages. Although the Company has obtained insurance against certain of the risks to which it is exposed, such insurance is subject to coverage limits and no assurance can be given that such insurance will be adequate to cover the Company’s liabilities or will be generally available in the future or, if available, that premiums will be commercially justifiable. If the Company were to incur substantial liability and such damages were not covered by insurance or were in excess of policy limits, or if the Company were to incur such liability at a time when it is not able to obtain liability insurance, its business, results of operations and financial condition could be materially adversely affected.
Access to Additional Financing
Total Energy may find it necessary in the future to obtain additional debt or equity to support ongoing operations, to undertake capital expenditures or to undertake acquisitions or other business combination transactions. There can be no assurance that additional financing will be available to Total Energy when needed or on terms acceptable to Total Energy, particularly during the current global financial crisis. Total Energy’s inability to raise financing to support ongoing opera-tions or to fund capital expenditures or acquisitions could limit the Company’s growth and may have a material adverse effect upon the Company.
Seasonality
In general, the level of activity in the Canadian oilfield service industry is influenced by seasonal weather patterns. Wet weather and the spring thaw may make the ground unstable. Consequently, municipalities and provincial transportation departments enforce road bans that restrict the movement of rigs and other heavy equipment, thereby reducing activity levels. Additionally, certain oil and gas producing areas are located in areas that are inaccessible other than during the winter months, because the ground surrounding the drilling sites in these areas consists of swampy terrain. Seasonal fac-tors and unexpected weather patterns may lead to declines in the activity levels of exploration and production companies and corresponding declines in the demand for the goods and services of the Company.
2 3
F O C U S • D I S C I P L I N E • G R O W T H
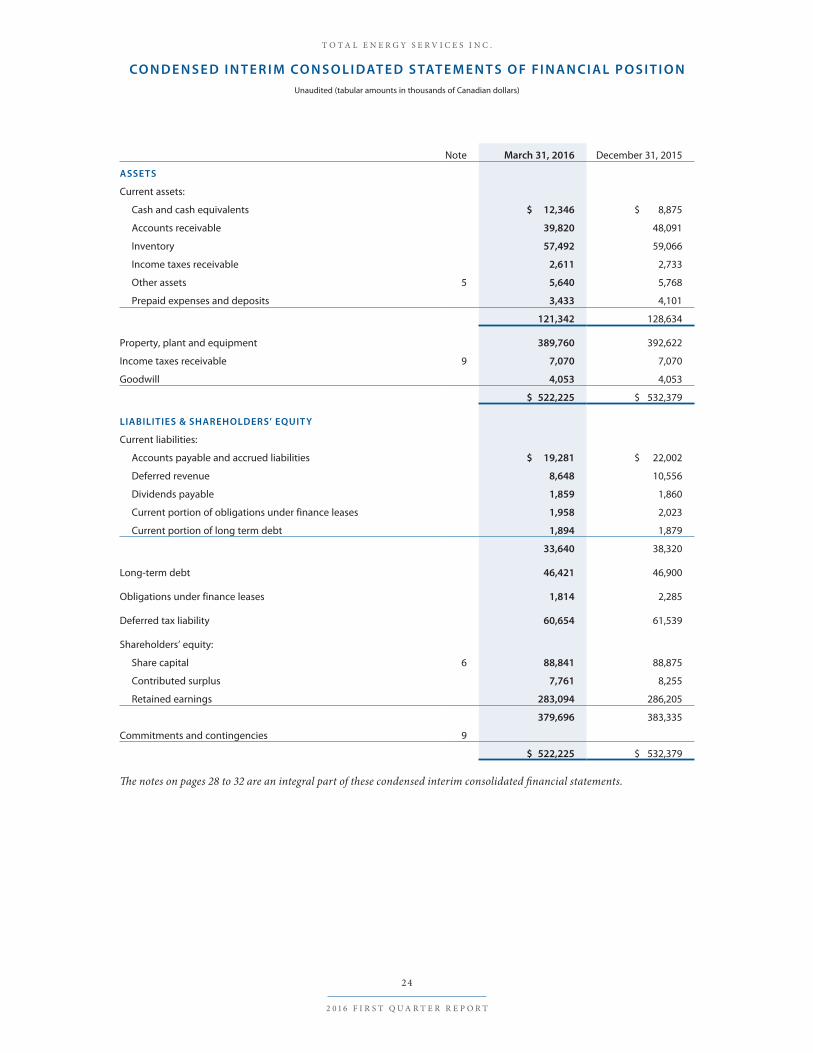
Note March 31, 2016 December 31, 2015
ASSETS
Current assets:
Cash and cash equivalents $ 12,346 $ 8,875
Accounts receivable 39,820 48,091
Inventory 57,492 59,066
Income taxes receivable 2,611 2,733
Other assets 5 5,640 5,768
Prepaid expenses and deposits 3,433 4,101
121,342 128,634
Property, plant and equipment 389,760 392,622
Income taxes receivable 9 7,070 7,070
Goodwill 4,053 4,053
$ 522,225 $ 532,379
LIABILITIES & SHAREHOLDERS’ EQUIT Y
Current liabilities:
Accounts payable and accrued liabilities $ 19,281 $ 22,002
Deferred revenue 8,648 10,556
Dividends payable 1,859 1,860
Current portion of obligations under finance leases 1,958 2,023
Current portion of long term debt 1,894 1,879
33,640 38,320
Long-term debt 46,421 46,900
Obligations under finance leases 1,814 2,285
Deferred tax liability 60,654 61,539
Shareholders’ equity:
Share capital 6 88,841 88,875
Contributed surplus 7,761 8,255
Retained earnings 283,094 286,205
379,696 383,335
Commitments and contingencies 9
$ 522,225 $ 532,379
The notes on pages 28 to 32 are an integral part of these condensed interim consolidated financial statements.
T O T A L E N E R G Y S E R V I C E S I N C .
CO N D E N S E D I N T E R I M CO N S O L I DAT E D S TAT E M E N T S O F F I N A N C I A L P O S I T I O NUnaudited (tabular amounts in thousands of Canadian dollars)
2 4
2 0 1 6 F I R S T Q U A R T E R R E P O R T
T O T A L E N E R G Y S E R V I C E S I N C .
CO N D E N S E D I N T E R I M CO N S O L I DAT E D S TAT E M E N T S O F CO M P R E H E N S I V E I N CO M E (L O S S)Unaudited (Tabular amounts in thousands of Canadian dollars except per share amounts)
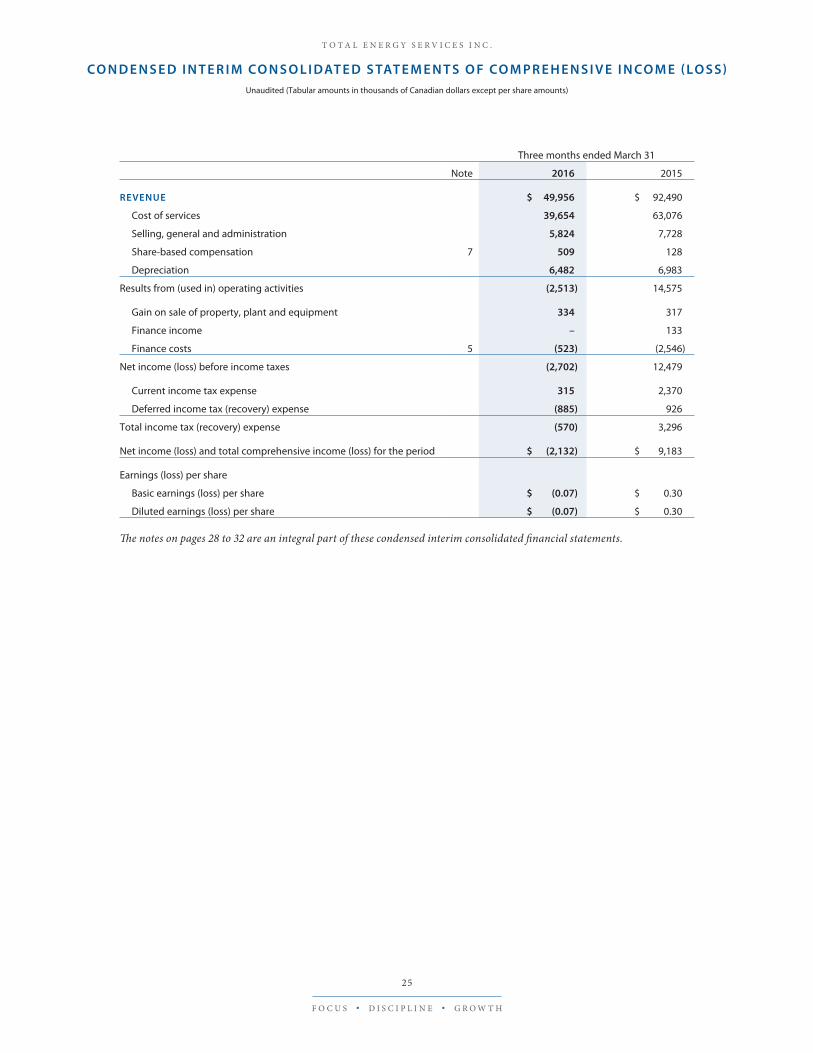
Three months ended March 31
Note 2016 2015
REVENUE $ 49,956 $ 92,490
Cost of services 39,654 63,076
Selling, general and administration 5,824 7,728
Share-based compensation 7 509 128
Depreciation 6,482 6,983
Results from (used in) operating activities (2,513) 14,575
Gain on sale of property, plant and equipment 334 317
Finance income – 133
Finance costs 5 (523) (2,546)
Net income (loss) before income taxes (2,702) 12,479
Current income tax expense 315 2,370
Deferred income tax (recovery) expense (885) 926
Total income tax (recovery) expense (570) 3,296
Net income (loss) and total comprehensive income (loss) for the period $ (2,132) $ 9,183
Earnings (loss) per share
Basic earnings (loss) per share $ (0.07) $ 0.30
Diluted earnings (loss) per share $ (0.07) $ 0.30
The notes on pages 28 to 32 are an integral part of these condensed interim consolidated financial statements.
2 5
F O C U S • D I S C I P L I N E • G R O W T H
T O T A L E N E R G Y S E R V I C E S I N C .
CO N D E N S E D I N T E R I M CO N S O L I DAT E D S TAT E M E N T S O F CO M P R E H E N S I V E I N CO M E (L O S S)Unaudited (Tabular amounts in thousands of Canadian dollars except per share amounts)

NoteShare
CapitalContributed
Surplus
Equity portionof convertible
debentureRetainedearnings
TotalEquity
Balance at December 31, 2014 $ 88,899 $ 6,880 $ 4,601 $ 281,683 $ 382,063
Net income and total comprehensive income for the year – – – 8,655 8,655
Transactions with shareholders, recorded directly in equity:
Dividends to shareholders ($0.24 per common share) – – – (7,440) (7,440)
Repurchase of common shares 6 (24) – – (84) (108)
Redemption of convertible debentures – – (4,601) 3,391 (1,210)
Share-based compensation – 1,375 – – 1,375
(24) 1,375 (4,601) (4,133) (7,383)
Balance at December 31, 2015 $ 88,875 $ 8,255 $ – $ 286,205 $ 383,335
Net loss and total comprehensive loss for the period – – – (2,132) (2,132)
Transactions with shareholders, recorded directly in equity:
Dividends to shareholders ($0.06 per common share) – – – (1,859) (1,859)
Repurchase of common shares 6 (34) – – (123) (157)
Share-based compensation 7 – 509 – – 509
Expiration of share options – (1,003) – 1,003 –
(34) (494) – (979) (1,507)
Balance at March 31, 2016 $ 88,841 $ 7,761 $ – $ 283,094 $ 379,696
NoteShare
CapitalContributed
Surplus
Equity portionof convertible
debentureRetainedearnings
TotalEquity
Balance at December 31, 2014 $ 88,899 $ 6,880 $ 4,601 $ 281,683 $ 382,063
Net income and total comprehensive income for the period – – – 9,183 9,183
Transactions with shareholders, recorded directly in equity:
Dividends to shareholders ($0.06 per common share) – – – (1,860) (1,860)
Repurchase of common shares 6 (15) – – (54) (69)
Share-based compensation 7 – 128 – – 128
(15) 128 – (1,914) (1,801)
Balance at March 31, 2015 $ 88,884 $ 7,008 $ 4,601 $ 288,952 $ 389,445
The notes on pages 28 to 32 are an integral part of these condensed interim consolidated financial statements.
2 6
2 0 1 6 F I R S T Q U A R T E R R E P O R T
T O T A L E N E R G Y S E R V I C E S I N C .
CO N D E N S E D I N T E R I M CO N S O L I DAT E D S TAT E M E N T S O F E Q U I T YAs at and for the three months ended March 31, 2016 and 2015, and year ended December 31, 2015
Unaudited (Tabular amounts in thousands of Canadian dollars)

Three months ended March 31
Note 2016 2015
Cash provided by (used in):
Operations:
Net (loss)income for the period $ (2,132) $ 9,183
Add (deduct) items not affecting cash:
Depreciation 6,482 6,983
Share-based compensation 509 128
Gain on sale of property, plant and equipment (334) (317)
Unrealized loss on other assets 5 25 1,000
Finance costs 498 1,546
Unrealized loss (gain) on foreign currencies translation 754 (488)
Current income tax expense 315 2,370
Deferred income tax (recovery) expense (885) 926
Income taxes paid (193) (13,831)
5,039 7,500
Changes in non-cash working capital items:
Accounts receivable 7,540 18,638
Inventory 1,274 (6,514)
Prepaid expenses and deposits 419 2,484
Accounts payable and accrued liabilities 322 (5,056)
Deferred revenue (1,908) 6,687
12,686 23,739
Investments:
Purchase of property, plant and equipment (2,311) (6,493)
Acquisitions 4 (3,590) (1,231)
Proceeds on sale of other assets 53 –
Purchase of other assets – (5,075)
Proceeds on disposal of property, plant and equipment 2,305 1,228
Changes in non-cash working capital items (2,028) (7,109)
(5,571) (18,680)
Financing:
Repayment of long-term debt (464) –
Repayment of obligations under finance leases (665) (720)
Dividends to shareholders (1,860) (1,860)
Repurchase of common shares 6 (157) (69)
Interest paid (498) (2,040)
(3,644) (4,689)
Change in cash and cash equivalents 3,471 370
Cash and cash equivalents, beginning of period 8,875 7,745
Cash and cash equivalents, end of period $ 12,346 $ 8,115
The notes on pages 28 to 32 are an integral part of these condensed interim consolidated financial statements.
2 7
F O C U S • D I S C I P L I N E • G R O W T H
T O T A L E N E R G Y S E R V I C E S I N C .
CO N D E N S E D I N T E R I M CO N S O L I DAT E D S TAT E M E N T S O F C A S H FL O W SUnaudited (Tabular amounts in thousands of Canadian dollars)

1. Reporting entity
Total Energy Services Inc. (the “Company”) is domiciled in Canada and is incorporated under the Business Corporations Act (Alberta).
The consolidated financial statements include the accounts of the Company, its subsidiaries and its partnerships established in Canada, the United States of America and Australia.
The Company’s business is the provision of contract drilling services, the rental and transportation of equipment used in oil and natural gas drilling, completion and production processes and the fabrication, sale, rental and servicing of natural gas compression and process equipment to oil and gas exploration and production companies located primarily in western Canada.
The Company’s operations are seasonal in nature and are carried out primarily in the Western Canadian Sedimentary Basin. The ability to move heavy equipment in the Canadian oil and natural gas fields is dependent on weather condi-tions. As warm weather returns in the spring, the winter’s frost comes out of the ground rendering many secondary roads incapable of supporting the weight of heavy equipment until such roads have thoroughly dried out. The duration of this “spring breakup” has a direct impact on the Company’s activity levels. In addition, many exploration and production areas in northern Canada are accessible only in winter months when the ground is frozen hard enough to support equipment. The timing of freeze up and spring breakup affects the ability to move equipment in and out of these areas. As a result, late March through May is traditionally the Company’s slowest period.
2. Basis of preparation
Statement of compliance:
The condensed interim consolidated financial statements have been prepared in accordance with IAS 34, “Interim Financial Reporting” of International Financial Reporting Standards (IFRS) and using the accounting policies outlined in the Company’s consolidated financial statements for the year ended December 31, 2015. These condensed interim consoli-dated financial statements do not include all the necessary annual disclosures and should be read in conjunction with the Company’s audited consolidated financial statements for the year ended December 31, 2015.
The condensed interim consolidated financial statements were authorized for issue by the Board of Directors on May 12, 2016.
3. Operating segments
The Company has three reportable segments which are substantially in one geographic segment, as described below, which are the Company’s strategic business units. The strategic business units offer different services. For each of the strategic business units, the Company’s Board of Directors and senior corporate management reviews internal management reports on at least a monthly basis.
The segments are: Contract Drilling Services, which includes the contracting of drilling equipment and the provision of labour required to operate the equipment, Rentals and Transportation Services, which includes the rental and transporta-tion of equipment used in oil and natural gas drilling, completion and production processes and Compression and Process Services, which includes the fabrication, sale, rental and servicing of natural gas compression and process equipment.
Information regarding the results of each reportable segment is included below. Performance is measured based on net income before income taxes, as included in the internal management reports that are reviewed by the Company’s Board of Directors and senior corporate management. Segment net income before income taxes is used to measure performance as management believes that such information is the most relevant in evaluating the results of certain segments relative to other entities that operate within these industries.
2 8
2 0 1 6 F I R S T Q U A R T E R R E P O R T
T O T A L E N E R G Y S E R V I C E S I N C .
N O T E S T O T H E CO N D E N S E D I N T E R I M CO N S O L I DAT E D F I N A N C I A L S TAT E M E N T SAs at and for the three months ended March 31, 2016 and 2015
Unaudited (tabular amounts in thousands of Canadian dollars)

Inter-segment pricing is determined on an arm’s length basis. Interest is allocated based on capital employed in each segment.
The segmented amounts are as follows:
As at and for the three months endedMarch 31, 2016
ContractDrilling
Services
Rentals andTransportation
Services
Compression and Process
Services Other(1) Total
Revenue $ 3,187 $ 11,144 $ 35,625 $ – $ 49,956
Cost of services 1,855 7,018 30,781 – 39,654
Selling, general and administration 526 2,742 1,847 709 5,824
Share-based compensation – – – 509 509
Depreciation 537 4,050 1,877 18 6,482
Results from (used in) operating activities 269 (2,666) 1,119 (1,236) (2,513)
Gain on sale of property, plant and equipment – 55 279 – 334
Finance income – – – – –
Finance costs (93) (189) (111) (130) (523)
Net income (loss) before income taxes 176 (2,799) 1,287 (1,366) (2,702)
Goodwill – 2,514 1,539 – 4,053
Total assets 114,177 229,722 163,610 14,716 522,225
Total liabilities 19,120 42,332 31,615 49,462 142,529
Capital expenditures (2) $ 50 $ 4,856 $ 995 $ – $ 5,901
As at and for the three months endedMarch 31, 2015
ContractDrilling
Services
Rentals andTransportation
Services
Compression and Process
Services Other(1) Total
Revenue $ 5,230 $ 29,871 $ 57,389 $ – $ 92,490
Cost of services 3,030 15,375 44,671 – 63,076
Selling, general and administration 554 3,950 2,431 793 7,728
Share-based compensation – – – 128 128
Depreciation 614 4,198 2,157 14 6,983
Results from operating activities 1,032 6,348 8,130 (935) 14,575
Gain on sale of property, plant and equipment 5 (73) 385 – 317
Finance income – – – 133 133
Finance costs (204) (439) (304) (1,599) (2,546)
Net income (loss) before income taxes 833 5,836 8,211 (2,401) 12,479
Goodwill – 2,514 1,539 – 4,053
Total assets 119,357 259,261 199,434 9,331 587,383
Total liabilities 18,201 52,755 55,988 70,994 197,938
Capital expenditures (3) $ 334 $ 4,666 $ 2,620 $ 104 $ 7,724
(1) Other includes the Company’s corporate activities, accretion of convertible debentures and obligations pursuant to long-term credit facilities.
(2) Includes acquisition described in note 4.
(3) Includes January 1, 2015 acquisition of a business described in note 5 to 2015 audited Financial Statements.
T O T A L E N E R G Y S E R V I C E S I N C .
N O T E S T O T H E C O N S O L I D AT E D F I N A N C I A L S TAT E M E N T S
As at and for the three months ended March 31, 2016 and 2015
Unaudited (tabular amounts in thousands of Canadian dollars)
29
F O C U S • D I S C I P L I N E • G R O W T H
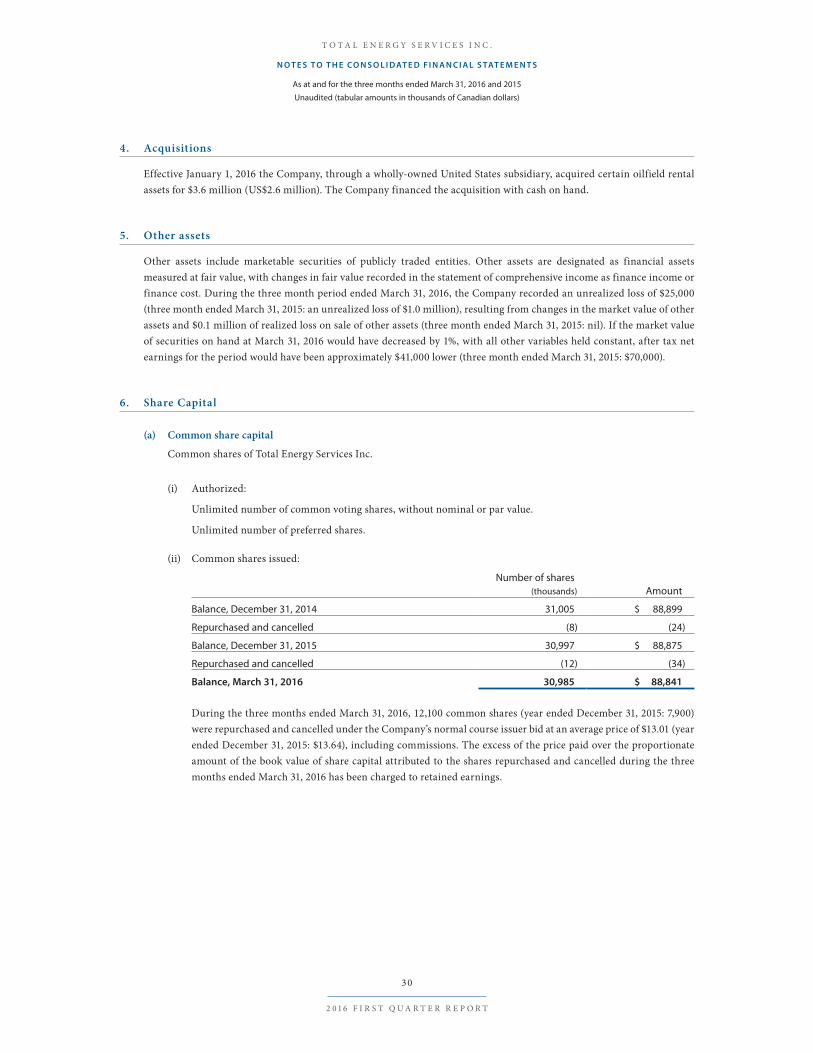
4. Acquisitions
Effective January 1, 2016 the Company, through a wholly-owned United States subsidiary, acquired certain oilfield rental assets for $3.6 million (US$2.6 million). The Company financed the acquisition with cash on hand.
5. Other assets
Other assets include marketable securities of publicly traded entities. Other assets are designated as financial assets measured at fair value, with changes in fair value recorded in the statement of comprehensive income as finance income or finance cost. During the three month period ended March 31, 2016, the Company recorded an unrealized loss of $25,000 (three month ended March 31, 2015: an unrealized loss of $1.0 million), resulting from changes in the market value of other assets and $0.1 million of realized loss on sale of other assets (three month ended March 31, 2015: nil). If the market value of securities on hand at March 31, 2016 would have decreased by 1%, with all other variables held constant, after tax net earnings for the period would have been approximately $41,000 lower (three month ended March 31, 2015: $70,000).
6. Share Capital
(a) Common share capital
Common shares of Total Energy Services Inc.
(i) Authorized:
Unlimited number of common voting shares, without nominal or par value.
Unlimited number of preferred shares.
(ii) Common shares issued:
Number of shares(thousands) Amount
Balance, December 31, 2014 31,005 $ 88,899
Repurchased and cancelled (8) (24)
Balance, December 31, 2015 30,997 $ 88,875
Repurchased and cancelled (12) (34)
Balance, March 31, 2016 30,985 $ 88,841
During the three months ended March 31, 2016, 12,100 common shares (year ended December 31, 2015: 7,900) were repurchased and cancelled under the Company’s normal course issuer bid at an average price of $13.01 (year ended December 31, 2015: $13.64), including commissions. The excess of the price paid over the proportionate amount of the book value of share capital attributed to the shares repurchased and cancelled during the three months ended March 31, 2016 has been charged to retained earnings.
T O T A L E N E R G Y S E R V I C E S I N C .
N O T E S T O T H E C O N S O L I D AT E D F I N A N C I A L S TAT E M E N T S
As at and for the three months ended March 31, 2016 and 2015
Unaudited (tabular amounts in thousands of Canadian dollars)
3 0
2 0 1 6 F I R S T Q U A R T E R R E P O R T
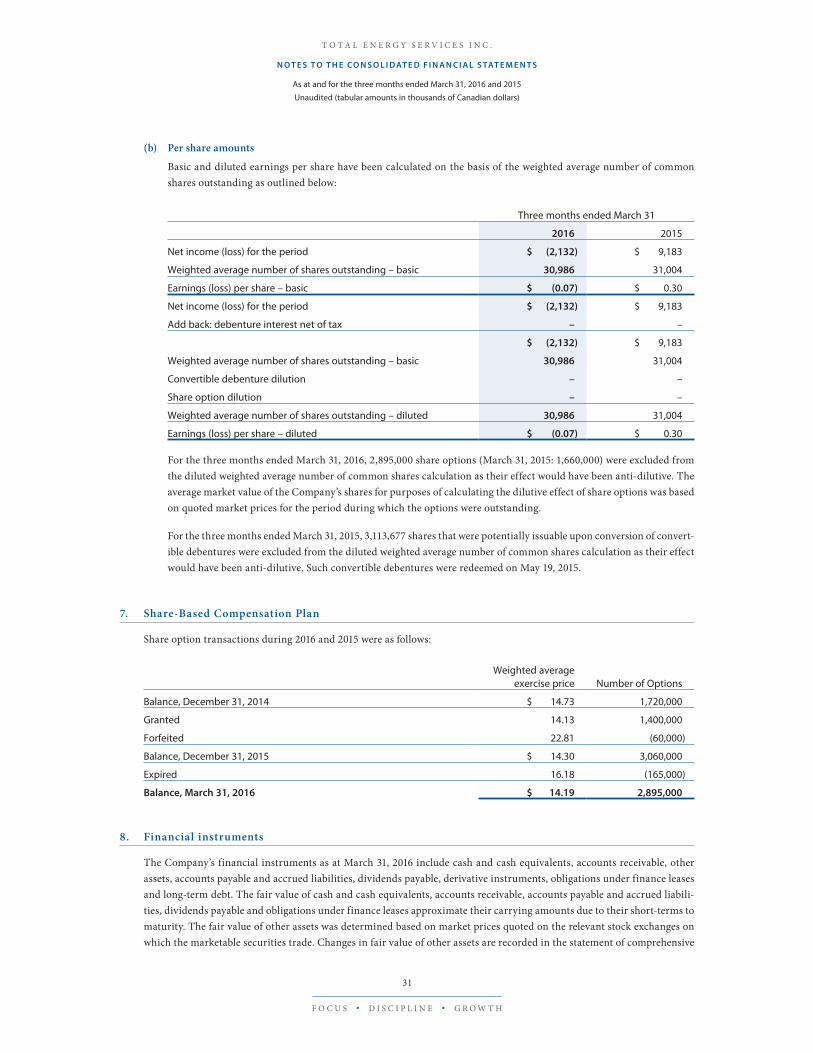
(b) Per share amounts
Basic and diluted earnings per share have been calculated on the basis of the weighted average number of common shares outstanding as outlined below:
Three months ended March 31
2016 2015
Net income (loss) for the period $ (2,132) $ 9,183
Weighted average number of shares outstanding – basic 30,986 31,004
Earnings (loss) per share – basic $ (0.07) $ 0.30
Net income (loss) for the period $ (2,132) $ 9,183
Add back: debenture interest net of tax – –
$ (2,132) $ 9,183
Weighted average number of shares outstanding – basic 30,986 31,004
Convertible debenture dilution – –
Share option dilution – –
Weighted average number of shares outstanding – diluted 30,986 31,004
Earnings (loss) per share – diluted $ (0.07) $ 0.30
For the three months ended March 31, 2016, 2,895,000 share options (March 31, 2015: 1,660,000) were excluded from the diluted weighted average number of common shares calculation as their effect would have been anti-dilutive. The average market value of the Company’s shares for purposes of calculating the dilutive effect of share options was based on quoted market prices for the period during which the options were outstanding.
For the three months ended March 31, 2015, 3,113,677 shares that were potentially issuable upon conversion of convert-ible debentures were excluded from the diluted weighted average number of common shares calculation as their effect would have been anti-dilutive. Such convertible debentures were redeemed on May 19, 2015.
7. Share-Based Compensation Plan
Share option transactions during 2016 and 2015 were as follows:
Weighted averageexercise price Number of Options
Balance, December 31, 2014 $ 14.73 1,720,000
Granted 14.13 1,400,000
Forfeited 22.81 (60,000)
Balance, December 31, 2015 $ 14.30 3,060,000
Expired 16.18 (165,000)
Balance, March 31, 2016 $ 14.19 2,895,000
8. Financial instruments
The Company’s financial instruments as at March 31, 2016 include cash and cash equivalents, accounts receivable, other assets, accounts payable and accrued liabilities, dividends payable, derivative instruments, obligations under finance leases and long-term debt. The fair value of cash and cash equivalents, accounts receivable, accounts payable and accrued liabili-ties, dividends payable and obligations under finance leases approximate their carrying amounts due to their short-terms to maturity. The fair value of other assets was determined based on market prices quoted on the relevant stock exchanges on which the marketable securities trade. Changes in fair value of other assets are recorded in the statement of comprehensive
T O T A L E N E R G Y S E R V I C E S I N C .
N O T E S T O T H E C O N S O L I D AT E D F I N A N C I A L S TAT E M E N T S
As at and for the three months ended March 31, 2016 and 2015
Unaudited (tabular amounts in thousands of Canadian dollars)
31
F O C U S • D I S C I P L I N E • G R O W T H
income in the period the changes in fair value occur. The discounted future cash repayments of the Company s̀ bank loan are calculated using prevailing market rates of a similar debt instrument as at the reporting date. The net present value of future cash repayments of the bank loan and related interest at the prevailing market rate of 2.82% for a similar debt instrument at March 31, 2016 was $48.7 million. The carrying value and Company s̀ liability with respect to the bank loan is $48.3 million.
9. Contingencies
On August 30, 2015 the Company was notified by the Canada Revenue Agency (the “CRA”) that certain of the Company’s income tax filings related to its conversion from an income trust to a corporation in 2009 were being re-assessed. Specifically, the CRA increased the Company’s taxable income by $56.1 million and denied $1.7 million of investment tax credits claimed (the “Reassessment”). The Reassessment is based entirely on the CRA’s proposed application of the general anti-avoidance rule (“GAAR”) and gives rise to approximately $14.1 million of federal income tax payable. In September 2015 the Company paid one half of the Reassessed amount, or $7.1 million, on account of the Reassessment as required pending appeal. On November 4, 2015, related provincial income tax reassessments totaling $5.6 million (including interest and penalties) were received.
The Company has received both legal and tax advice relating to its conversion from an income trust to a corporation indicating that its income tax filing position is strong. As such, the Company has filed notices of objection in response to the Reassessment and intends to vigorously defend its filing position and seek reimbursement from the CRA for the costs arising from having to defend such Reassessment to the fullest extent possible. Management believes that it will be success-ful in defending its tax filing position, and as such, the Company has not recognized any provision for the Reassessment at March 31, 2016. The $7.1 million paid on account of the Reassessment has been recorded as income tax receivable on the basis management believes it will be successful in defending the Company s̀ filing position. In the event the Company is not successful, an additional $12.7 million of cash may be owing and $19.8 million of income tax expense would be recognized.
The Company, in the normal course of operations, will become subject to a variety of legal and other claims against it. Management and the Company’s legal counsel evaluate all claims on their apparent merits and accrue management’s best estimate of the costs to satisfy such claims. Management believes that the outcome of legal and other claims currently filed against the Company will not be material to the Company.
T O T A L E N E R G Y S E R V I C E S I N C .
N O T E S T O T H E C O N S O L I D AT E D F I N A N C I A L S TAT E M E N T S
As at and for the three months ended March 31, 2016 and 2015
Unaudited (tabular amounts in thousands of Canadian dollars)
32
2 0 1 6 F I R S T Q U A R T E R R E P O R T
T O T A L E N E R G Y S E R V I C E S I N C .
CO R P O R AT E I N F O R M AT I O N

BOARD OF DIRECTORS
Bruce Pachkowski 3
Chairman of the Board
Daniel HalykPresident and Chief Executive Officer
Gregory Fletcher 1, 2
Randy Kwasnicia 1, 3
Greg Melchin 1, 2
Andrew Wiswell 2, 3
1 Member of the Compensation Committee2 Member of the Audit Committee3 Member of the Corporate Governance and Nominating Committee
MANAGEMENT TEAM
TOTAL ENERGY SERVICES INC.
Daniel HalykPresident and Chief Executive Officer
Gerry CrawfordVice President, Field Services
Cam DanylukVice President, Legal, General Counsel and Corporate Secretary
Yuliya GorbachVice President, Finance and Chief Financial Officer
William KosichVice President, Drilling Services
Brad MacsonVice President, Operations
CHINOOK DRILLING, A DIVISION OF TOTAL ENERGY SERVICES INC.
Rod RundellGeneral Manager
TOTAL OILFIELD RENTALS LIMITED PARTNERSHIP
Clint GabouryGeneral Manager
BIDELL EQUIPMENT LIMITED PARTNERSHIP
Sean UlmerPresident
SPECTRUM PROCESS SYSTEMS INC.
Kelly ManteiGeneral Manager
HEAD OFFICE
Suite 2550, 300 - 5th Avenue S.W.
Calgary, Alberta T2P 3C4
Telephone: (403) 216-3939
Toll Free: (877) 818-6825
Fax: (403) 234-8731
Website: www.totalenergy.ca
Email: [email protected]
AUDITOR
KPMG LLP
Calgary, Alberta
TRUSTEE, REGISTRAR AND TRANSFER AGENT
Computershare
Calgary, Alberta
LEGAL COUNSEL
Bennett Jones, LLP
Calgary, Alberta
BANKER
HSBC
Calgary, Alberta
STOCK EXCHANGE LISTING
Toronto Stock Exchange
Common Shares: TOT
33
F O C U S • D I S C I P L I N E • G R O W T H
T O T A L E N E R G Y S E R V I C E S I N C .
CO R P O R AT E I N F O R M AT I O N
CANADIAN LOCATIONS
Calgary • Carlyle • Dawson Creek • Drayton Valley • Drumheller • Edmonton • Edson • Fort Nelson • Fort St. John
Fox Creek • Grande Prairie • High Level • Lac La Biche • Lloydminster • Manning • Medicine Hat • Peace River
Red Deer • Red Earth • Rocky Mountain House • Slave Lake • Valleyview • Weyburn/Midale • Whitecourt
U.S. LOCATIONS
Denver, CO • Minot, ND • Casper, WY
Total Energy, Bidell, Bidell Gas Compression, Chinook, Chinook Drilling, NOMAD, Spectrum Process Systems and
the respective logos are registered trademarks of Total Energy Services Inc.


