28
STATE PROFILES Spring 2018 COMMUNITIES IN SCHOOLS NATIONAL REPORT COMMUNITY MATTERS Focus on Chronic Absenteeism

STATE PROFILES
Spring 2018
COMMUNITIES IN SCHOOLS NATIONAL REPORT COMMUNITY MATTERS Focus on Chronic Absenteeism

STATE DATA PROFILE
NATIONAL NETWORK SY 2016 – 2017
Our Reach:
Our Results:**case-managed student outcomes
Schools Served by Type
GenderRace
# of schools
Our Students:
1.56Mtotal students served
1.4M students receivingwhole-school supports
92% of case-managed students qualified for free or reduced-price lunch (FRPL)
Elementary Schools
Middle Schools
High Schools
Other K–12 Combinations137 affiliate organizations (including state offices and licensed partners) operated in 25 states and the District of Columbia.
0 200
578
570
893
260
400 600 800 1,000
94%were promoted
(K–11)
88%improved
academics
78%improved
attendance
93%graduated or received GED
(grade 12)
Amer. Ind. Asian
Black Hispanic White 2+ Races Other
15%
47%
33%
49%Male
51%Female
TX
NM
CO KS
OK
NE
WA
CA
AK
HI
NV
FL
SCNC
VA
PA
WVOH
TN
MI
INILIA
GALA
DEDC
153,000case-managed students
3%0.3%
0.6%1%

STATE DATA PROFILE
SY 2016 – 2017
Our Reach:
Our Results:**case-managed student outcomes
GenderRace
438total students served
400 students receivingwhole-school supports
2+ RACESWHITEHISPANICBLACKASIANAMER. IND. OTHER2+ RACESWHITEHISPANICBLACKASIANAMER. IND.OTHER2+ RACESWHITEHISPANICBLACKASIANAMER. IND.
OTHER2+ RACESWHITEHISPANICBLACKASIANAMER. IND. OTHER2+ RACESWHITEHISPANICBLACKASIANAMER. IND. OTHER2+ RACESWHITEHISPANICBLACKASIANAMER. IND.
OTHER2+ RACESWHITEHISPANICBLACKASIANAMER. IND.OTHER2+ RACESWHITEHISPANICBLACKASIANAMER. IND. OTHER2+ RACESWHITEHISPANICBLACKASIANAMER. IND.
OTHER2+ RACESWHITEHISPANICBLACKASIANAMER. IND.OTHER2+ RACESWHITEHISPANICBLACKASIANAMER. IND. OTHER2+ RACESWHITEHISPANICBLACKASIANAMER. IND.
OTHER2+ RACESWHITEHISPANICBLACKASIANAMER. IND.
OTHER2+ RACESWHITEHISPANICBLACKASIANAMER. IND. OTHER2+ RACESWHITEHISPANICBLACKASIANAMER. IND.
OTHER2+ RACESWHITEHISPANICBLACKASIANAMER. IND.OTHER2+ RACESWHITEHISPANICBLACKASIANAMER. IND. OTHER2+ RACESWHITEHISPANICBLACKASIANAMER. IND.
OTHER2+ RACESWHITEHISPANICBLACKASIANAMER. IND.OTHER2+ RACESWHITEHISPANICBLACKASIANAMER. IND. OTHER2+ RACESWHITEHISPANICBLACKASIANAMER. IND.
OTHER2+ RACESWHITEHISPANICBLACKASIANAMER. IND. OTHER2+ RACESWHITEHISPANICBLACKASIANAMER. IND.OTHER2+ RACESWHITEHISPANICBLACKASIANAMER. IND.
OTHER2+ RACESWHITEHISPANICBLACKASIANAMER. IND. OTHER2+ RACESWHITEHISPANICBLACKASIANAMER. IND. OTHER2+ RACESWHITEHISPANICBLACKASIANAMER. IND.
63%Male
37%Female
Students Served by School Type
# of students
Elementary School
Middle School
High School(1 high school)
Other K–12 CombinationsAffiliate Office0 2,000
438
4,000 6,000 8,000 10,000
1O0% of case-managed students qualified for free or reduced-price lunch (FRPL)
100%were promoted
(K–11)
87%improved
academics
100%graduated or received GED
(grade 12)
ALASKA
3%
21%
24%
32%
11%
32%
11%
38case-managed students
Amer. Ind. Asian
Black Hispanic White 2+ Races
Our Students:

SY 2016 – 2017
Our Reach:
Our Results:**case-managed student outcomes
RaceOur Students:
STATE DATA PROFILE
79%
97%were promoted
(K–11)
60%improved
academics
48%improved
attendance
100%graduated or received GED
(grade 12)
Gender
55%Male
45%Female
11,979total students served
11,051 students receivingwhole-school supports
100% of case-managed students qualified for free or reduced-price lunch (FRPL)
Students Served by School Type
# of students
Elementary School
Middle School(6 middle schools)
High School(4 high schools)
Other K–12 Combinations
0 2,000
4,857
7,107
4,000 6,000 8,000 10,000
CALIFORNIA
2+ RACESWHITEHISPANICBLACKASIANAMER. IND. OTHER2+ RACESWHITEHISPANICBLACKASIANAMER. IND.OTHER2+ RACESWHITEHISPANICBLACKASIANAMER. IND.
OTHER2+ RACESWHITEHISPANICBLACKASIANAMER. IND. OTHER2+ RACESWHITEHISPANICBLACKASIANAMER. IND. OTHER2+ RACESWHITEHISPANICBLACKASIANAMER. IND.
OTHER2+ RACESWHITEHISPANICBLACKASIANAMER. IND.OTHER2+ RACESWHITEHISPANICBLACKASIANAMER. IND. OTHER2+ RACESWHITEHISPANICBLACKASIANAMER. IND.
OTHER2+ RACESWHITEHISPANICBLACKASIANAMER. IND.OTHER2+ RACESWHITEHISPANICBLACKASIANAMER. IND. OTHER2+ RACESWHITEHISPANICBLACKASIANAMER. IND.
OTHER2+ RACESWHITEHISPANICBLACKASIANAMER. IND.
OTHER2+ RACESWHITEHISPANICBLACKASIANAMER. IND. OTHER2+ RACESWHITEHISPANICBLACKASIANAMER. IND.
OTHER2+ RACESWHITEHISPANICBLACKASIANAMER. IND.OTHER2+ RACESWHITEHISPANICBLACKASIANAMER. IND. OTHER2+ RACESWHITEHISPANICBLACKASIANAMER. IND.
OTHER2+ RACESWHITEHISPANICBLACKASIANAMER. IND.OTHER2+ RACESWHITEHISPANICBLACKASIANAMER. IND. OTHER2+ RACESWHITEHISPANICBLACKASIANAMER. IND.
OTHER2+ RACESWHITEHISPANICBLACKASIANAMER. IND. OTHER2+ RACESWHITEHISPANICBLACKASIANAMER. IND.OTHER2+ RACESWHITEHISPANICBLACKASIANAMER. IND.
OTHER2+ RACESWHITEHISPANICBLACKASIANAMER. IND. OTHER2+ RACESWHITEHISPANICBLACKASIANAMER. IND. OTHER2+ RACESWHITEHISPANICBLACKASIANAMER. IND.
1%1% 0.7%
0.4%0.2%
79%
17%
Affiliate Office
928case-managed students
Other than the number of students served, data were received for only one affiliate.
Amer. Ind. Asian
Black Hispanic White 2+ Races Other

STATE DATA PROFILE
SY 2016 – 2017
Our Reach:
Our Results:**case-managed student outcomes
GenderRace
97%were promoted
(K–11)
94%improved
academics
77%improved
attendance
36%graduated or received GED
(grade 12)
52%Male
48%Female
4,040total students served
3,762 students receivingwhole-school supports
100% of case-managed students qualified for free or reduced-price lunch (FRPL)
Students Served by School Type
# of students
Elementary School(2 elementary schools)
Middle School
High School(1 high school)
Other K–12 Combinations(2 combined schools) 0 2,000
802
2,125
1,113
4,000 6,000 8,000 10,000
COLORADO
2+ RACESWHITEHISPANICBLACKASIANAMER. IND. OTHER2+ RACESWHITEHISPANICBLACKASIANAMER. IND.OTHER2+ RACESWHITEHISPANICBLACKASIANAMER. IND.
OTHER2+ RACESWHITEHISPANICBLACKASIANAMER. IND. OTHER2+ RACESWHITEHISPANICBLACKASIANAMER. IND. OTHER2+ RACESWHITEHISPANICBLACKASIANAMER. IND.
OTHER2+ RACESWHITEHISPANICBLACKASIANAMER. IND.OTHER2+ RACESWHITEHISPANICBLACKASIANAMER. IND. OTHER2+ RACESWHITEHISPANICBLACKASIANAMER. IND.
OTHER2+ RACESWHITEHISPANICBLACKASIANAMER. IND.OTHER2+ RACESWHITEHISPANICBLACKASIANAMER. IND. OTHER2+ RACESWHITEHISPANICBLACKASIANAMER. IND.
OTHER2+ RACESWHITEHISPANICBLACKASIANAMER. IND.
OTHER2+ RACESWHITEHISPANICBLACKASIANAMER. IND. OTHER2+ RACESWHITEHISPANICBLACKASIANAMER. IND.
OTHER2+ RACESWHITEHISPANICBLACKASIANAMER. IND.OTHER2+ RACESWHITEHISPANICBLACKASIANAMER. IND. OTHER2+ RACESWHITEHISPANICBLACKASIANAMER. IND.
OTHER2+ RACESWHITEHISPANICBLACKASIANAMER. IND.OTHER2+ RACESWHITEHISPANICBLACKASIANAMER. IND. OTHER2+ RACESWHITEHISPANICBLACKASIANAMER. IND.
OTHER2+ RACESWHITEHISPANICBLACKASIANAMER. IND. OTHER2+ RACESWHITEHISPANICBLACKASIANAMER. IND.OTHER2+ RACESWHITEHISPANICBLACKASIANAMER. IND.
OTHER2+ RACESWHITEHISPANICBLACKASIANAMER. IND. OTHER2+ RACESWHITEHISPANICBLACKASIANAMER. IND. OTHER2+ RACESWHITEHISPANICBLACKASIANAMER. IND.
5%3%
22%
8%
26%
35%
Licensee
278case-managed students
Asian Black Hispanic White 2+ Races Other

STATE DATA PROFILE
SY 2016 – 2017
Our Reach:
Our Results:**case-managed student outcomes
Students Served by School Type
GenderRace
# of students
Elementary School
Middle School(4 middle schools)
High School(5 high schools)
Other K–12 Combinations(1 combined school)
0 2,000
1,337
4,591
42
4,000 6,000 8,000 10,000
51%Male
49%Female
68%were promoted
(K–11)
77%improved
academics
79%improved
attendance
96%graduated or received GED
(grade 12)
5,987total students served
5,045 students receivingwhole-school supports
100% of case-managed students qualified for free or reduced-price lunch (FRPL)
DELAWARE2+ RACESWHITEHISPANICBLACKASIANAMER. IND. OTHER2+ RACESWHITEHISPANICBLACKASIANAMER. IND.
OTHER2+ RACESWHITEHISPANICBLACKASIANAMER. IND.
OTHER2+ RACESWHITEHISPANICBLACKASIANAMER. IND. OTHER2+ RACESWHITEHISPANICBLACKASIANAMER. IND. OTHER2+ RACESWHITEHISPANICBLACKASIANAMER. IND.
OTHER2+ RACESWHITEHISPANICBLACKASIANAMER. IND.OTHER2+ RACESWHITEHISPANICBLACKASIANAMER. IND. OTHER2+ RACESWHITEHISPANICBLACKASIANAMER. IND.
OTHER2+ RACESWHITEHISPANICBLACKASIANAMER. IND.OTHER2+ RACESWHITEHISPANICBLACKASIANAMER. IND. OTHER2+ RACESWHITEHISPANICBLACKASIANAMER. IND.
OTHER2+ RACESWHITEHISPANICBLACKASIANAMER. IND.
OTHER2+ RACESWHITEHISPANICBLACKASIANAMER. IND. OTHER2+ RACESWHITEHISPANICBLACKASIANAMER. IND.
OTHER2+ RACESWHITEHISPANICBLACKASIANAMER. IND.OTHER2+ RACESWHITEHISPANICBLACKASIANAMER. IND. OTHER2+ RACESWHITEHISPANICBLACKASIANAMER. IND.
OTHER2+ RACESWHITEHISPANICBLACKASIANAMER. IND.OTHER2+ RACESWHITEHISPANICBLACKASIANAMER. IND. OTHER2+ RACESWHITEHISPANICBLACKASIANAMER. IND.
OTHER2+ RACESWHITEHISPANICBLACKASIANAMER. IND. OTHER2+ RACESWHITEHISPANICBLACKASIANAMER. IND.OTHER2+ RACESWHITEHISPANICBLACKASIANAMER. IND.
OTHER2+ RACESWHITEHISPANICBLACKASIANAMER. IND. OTHER2+ RACESWHITEHISPANICBLACKASIANAMER. IND. OTHER2+ RACESWHITEHISPANICBLACKASIANAMER. IND.
0.6%0.2%0.7%
52%
20%
19%
7%
Affiliate Office
State Office
942case-managed students
An additional 17 students were served at one community-based site.
Amer. Ind. Asian
Black Hispanic White 2+ Races Other

STATE DATA PROFILE
SY 2016 – 2017
Our Reach:
Our Results:**case-managed student outcomes
Race
# of students
Gender
Students Served by School Type
Elementary School(3 elementary schools)
Middle School(4 middle schools)
High School(1 high school)
Other K–12 Combinations(1 combined school)
0 2,000
1,445
984
440
38
4,000 6,000 8,000 10,000
47%Male
53%Female
100%were promoted
(K–11)
99%improved
academics
82%improved
attendance
100%graduated or received GED
(grade 12)
2,907total students served
2,512 students receivingwhole-school supports
100% of case-managed students qualified for free or reduced-price lunch (FRPL)
DISTRICT OF COLUMBIA2+ RACESWHITEHISPANICBLACKASIANAMER. IND. OTHER2+ RACESWHITEHISPANICBLACKASIANAMER. IND.
OTHER2+ RACESWHITEHISPANICBLACKASIANAMER. IND.
OTHER2+ RACESWHITEHISPANICBLACKASIANAMER. IND. OTHER2+ RACESWHITEHISPANICBLACKASIANAMER. IND. OTHER2+ RACESWHITEHISPANICBLACKASIANAMER. IND.
OTHER2+ RACESWHITEHISPANICBLACKASIANAMER. IND.OTHER2+ RACESWHITEHISPANICBLACKASIANAMER. IND. OTHER2+ RACESWHITEHISPANICBLACKASIANAMER. IND.
OTHER2+ RACESWHITEHISPANICBLACKASIANAMER. IND.OTHER2+ RACESWHITEHISPANICBLACKASIANAMER. IND. OTHER2+ RACESWHITEHISPANICBLACKASIANAMER. IND.
OTHER2+ RACESWHITEHISPANICBLACKASIANAMER. IND.
OTHER2+ RACESWHITEHISPANICBLACKASIANAMER. IND. OTHER2+ RACESWHITEHISPANICBLACKASIANAMER. IND.
OTHER2+ RACESWHITEHISPANICBLACKASIANAMER. IND.OTHER2+ RACESWHITEHISPANICBLACKASIANAMER. IND. OTHER2+ RACESWHITEHISPANICBLACKASIANAMER. IND.
OTHER2+ RACESWHITEHISPANICBLACKASIANAMER. IND.OTHER2+ RACESWHITEHISPANICBLACKASIANAMER. IND. OTHER2+ RACESWHITEHISPANICBLACKASIANAMER. IND.
OTHER2+ RACESWHITEHISPANICBLACKASIANAMER. IND. OTHER2+ RACESWHITEHISPANICBLACKASIANAMER. IND.OTHER2+ RACESWHITEHISPANICBLACKASIANAMER. IND.
OTHER2+ RACESWHITEHISPANICBLACKASIANAMER. IND. OTHER2+ RACESWHITEHISPANICBLACKASIANAMER. IND. OTHER2+ RACESWHITEHISPANICBLACKASIANAMER. IND.
0.3%0.8% 0.3%
84%
12%
4%
Affiliate Office
395case-managed students
Amer. Ind. Asian
Black Hispanic White 2+ Races

SY 2016 – 2017
Our Reach:
Our Results:**case-managed student outcomes
GenderRace
# of students
Our Students:
STATE DATA PROFILE
0 3,000
4,134
6,000 9,000 12,000 15,000
96%were promoted
(K–11)
96%improved
academics
92%improved
attendance
96%graduated or received GED
(grade 12)
30,460total students served
25,749 students receivingwhole-school supports
96% of case-managed students qualified for free or reduced-price lunch (FRPL)
50%Male
50%Female
FLORIDA2+ RACESWHITEHISPANICBLACKASIANAMER. IND. OTHER2+ RACESWHITEHISPANICBLACKASIANAMER. IND.
OTHER2+ RACESWHITEHISPANICBLACKASIANAMER. IND.
OTHER2+ RACESWHITEHISPANICBLACKASIANAMER. IND. OTHER2+ RACESWHITEHISPANICBLACKASIANAMER. IND. OTHER2+ RACESWHITEHISPANICBLACKASIANAMER. IND.
OTHER2+ RACESWHITEHISPANICBLACKASIANAMER. IND.OTHER2+ RACESWHITEHISPANICBLACKASIANAMER. IND. OTHER2+ RACESWHITEHISPANICBLACKASIANAMER. IND.
OTHER2+ RACESWHITEHISPANICBLACKASIANAMER. IND.OTHER2+ RACESWHITEHISPANICBLACKASIANAMER. IND. OTHER2+ RACESWHITEHISPANICBLACKASIANAMER. IND.
OTHER2+ RACESWHITEHISPANICBLACKASIANAMER. IND.
OTHER2+ RACESWHITEHISPANICBLACKASIANAMER. IND. OTHER2+ RACESWHITEHISPANICBLACKASIANAMER. IND.
OTHER2+ RACESWHITEHISPANICBLACKASIANAMER. IND.OTHER2+ RACESWHITEHISPANICBLACKASIANAMER. IND. OTHER2+ RACESWHITEHISPANICBLACKASIANAMER. IND.
OTHER2+ RACESWHITEHISPANICBLACKASIANAMER. IND.OTHER2+ RACESWHITEHISPANICBLACKASIANAMER. IND. OTHER2+ RACESWHITEHISPANICBLACKASIANAMER. IND.
OTHER2+ RACESWHITEHISPANICBLACKASIANAMER. IND. OTHER2+ RACESWHITEHISPANICBLACKASIANAMER. IND.OTHER2+ RACESWHITEHISPANICBLACKASIANAMER. IND.
OTHER2+ RACESWHITEHISPANICBLACKASIANAMER. IND. OTHER2+ RACESWHITEHISPANICBLACKASIANAMER. IND. OTHER2+ RACESWHITEHISPANICBLACKASIANAMER. IND.
0.1%0.6%
0.3%2%
7%
73%
16%
Affiliate Office
State Office
Students Served by School Type
Elementary School (8 elementary schools)
Middle School(16 middle schools)
High School(19 high schools)
Other K–12 Combinations(10 combined schools)
0 3,000
7,529
2,847
14,969
4,134
6,000 9,000 12,000 15,000
4,711case-managed students
An additional 981 students were served at one community-based site and one other site.
Amer. Ind. Asian
Black Hispanic White 2+ Races Other
SY 2016 – 2017
Our Reach:
Our Results:**case-managed student outcomes
GenderRaceOur Students:
STATE DATA PROFILE
Amer. Ind. Asian
Black Hispanic White 2+ Races Other
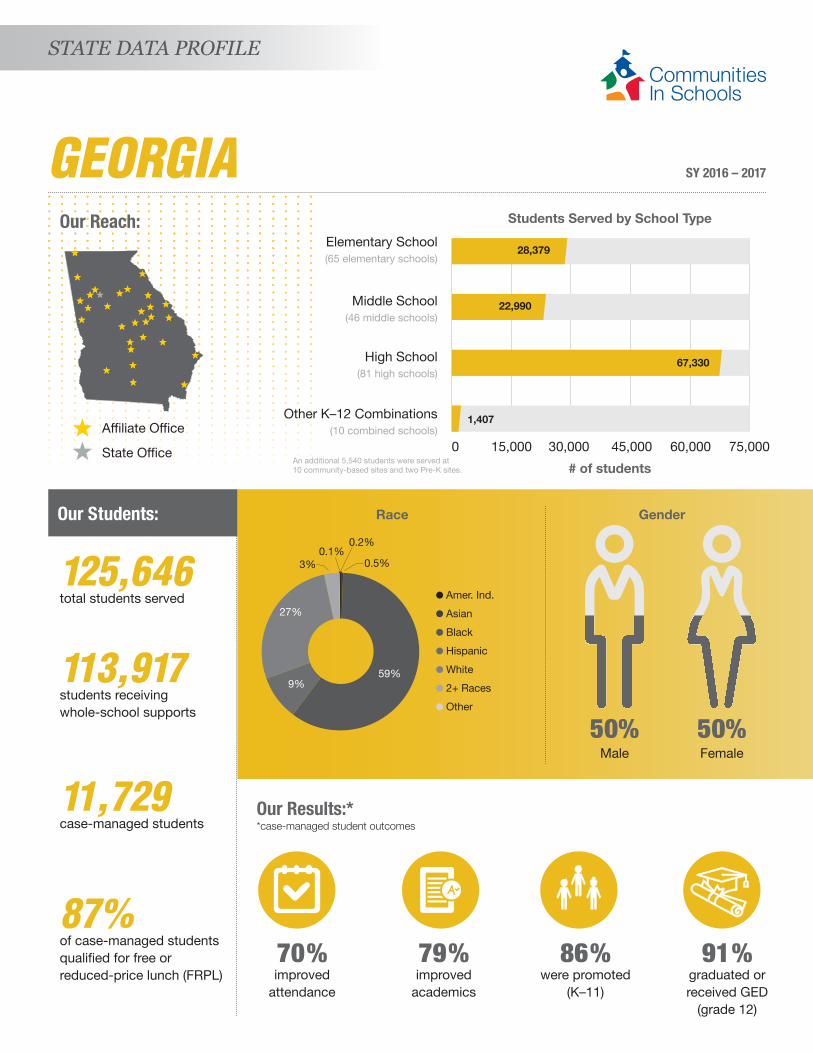
86%were promoted
(K–11)
79%improved
academics
70%improved
attendance
91%graduated or received GED
(grade 12)
125,646total students served
113,917 students receivingwhole-school supports
87% of case-managed students qualified for free or reduced-price lunch (FRPL)
Students Served by School Type
# of students
Elementary School(65 elementary schools)
Middle School(46 middle schools)
High School(81 high schools)
Other K–12 Combinations(10 combined schools)
0 15,000
22,990
28,379
67,330
1,407
30,000 45,000 60,000 75,000
GEORGIA
50%Male
50%Female
2+ RACESWHITEHISPANICBLACKASIANAMER. IND. OTHER2+ RACESWHITEHISPANICBLACKASIANAMER. IND.OTHER2+ RACESWHITEHISPANICBLACKASIANAMER. IND.
OTHER2+ RACESWHITEHISPANICBLACKASIANAMER. IND. OTHER2+ RACESWHITEHISPANICBLACKASIANAMER. IND. OTHER2+ RACESWHITEHISPANICBLACKASIANAMER. IND.
OTHER2+ RACESWHITEHISPANICBLACKASIANAMER. IND.OTHER2+ RACESWHITEHISPANICBLACKASIANAMER. IND. OTHER2+ RACESWHITEHISPANICBLACKASIANAMER. IND.
OTHER2+ RACESWHITEHISPANICBLACKASIANAMER. IND.OTHER2+ RACESWHITEHISPANICBLACKASIANAMER. IND. OTHER2+ RACESWHITEHISPANICBLACKASIANAMER. IND.
OTHER2+ RACESWHITEHISPANICBLACKASIANAMER. IND.
OTHER2+ RACESWHITEHISPANICBLACKASIANAMER. IND. OTHER2+ RACESWHITEHISPANICBLACKASIANAMER. IND.
OTHER2+ RACESWHITEHISPANICBLACKASIANAMER. IND.OTHER2+ RACESWHITEHISPANICBLACKASIANAMER. IND. OTHER2+ RACESWHITEHISPANICBLACKASIANAMER. IND.
OTHER2+ RACESWHITEHISPANICBLACKASIANAMER. IND.OTHER2+ RACESWHITEHISPANICBLACKASIANAMER. IND. OTHER2+ RACESWHITEHISPANICBLACKASIANAMER. IND.
OTHER2+ RACESWHITEHISPANICBLACKASIANAMER. IND. OTHER2+ RACESWHITEHISPANICBLACKASIANAMER. IND.OTHER2+ RACESWHITEHISPANICBLACKASIANAMER. IND.
OTHER2+ RACESWHITEHISPANICBLACKASIANAMER. IND. OTHER2+ RACESWHITEHISPANICBLACKASIANAMER. IND. OTHER2+ RACESWHITEHISPANICBLACKASIANAMER. IND.
0.2%
0.5%0.1%
3%
27%
59%9%
Affiliate Office
State Office
11,729case-managed students
An additional 5,540 students were served at 10 community-based sites and two Pre-K sites.

STATE DATA PROFILE
SY 2016 – 2017
Our Reach:
Our Results:**case-managed student outcomes
GenderRace
# of students
39%Male
61%Female
83,469total students served
82,771 students receivingwhole-school supports
100% of case-managed students qualified for free or reduced-price lunch (FRPL)
99%were promoted
(K–11)
88%improved
academics
82%improved
attendance
100%graduated or received GED
(grade 12)
Students Served by School Type
Elementary School (38 elementary schools)
Middle School(15 middle schools)
High School(12 high schools)
Other K–12 Combinations(118 combined schools)
0 15,000
2,029
8,413
4,383
68,596
30,000 45,000 60,000 75,000
ILLINOIS
2+ RACESWHITEHISPANICBLACKASIANAMER. IND. OTHER2+ RACESWHITEHISPANICBLACKASIANAMER. IND.OTHER2+ RACESWHITEHISPANICBLACKASIANAMER. IND.
OTHER2+ RACESWHITEHISPANICBLACKASIANAMER. IND. OTHER2+ RACESWHITEHISPANICBLACKASIANAMER. IND. OTHER2+ RACESWHITEHISPANICBLACKASIANAMER. IND.
OTHER2+ RACESWHITEHISPANICBLACKASIANAMER. IND.OTHER2+ RACESWHITEHISPANICBLACKASIANAMER. IND. OTHER2+ RACESWHITEHISPANICBLACKASIANAMER. IND.
OTHER2+ RACESWHITEHISPANICBLACKASIANAMER. IND.OTHER2+ RACESWHITEHISPANICBLACKASIANAMER. IND. OTHER2+ RACESWHITEHISPANICBLACKASIANAMER. IND.
OTHER2+ RACESWHITEHISPANICBLACKASIANAMER. IND.
OTHER2+ RACESWHITEHISPANICBLACKASIANAMER. IND. OTHER2+ RACESWHITEHISPANICBLACKASIANAMER. IND.
OTHER2+ RACESWHITEHISPANICBLACKASIANAMER. IND.OTHER2+ RACESWHITEHISPANICBLACKASIANAMER. IND. OTHER2+ RACESWHITEHISPANICBLACKASIANAMER. IND.
OTHER2+ RACESWHITEHISPANICBLACKASIANAMER. IND.OTHER2+ RACESWHITEHISPANICBLACKASIANAMER. IND. OTHER2+ RACESWHITEHISPANICBLACKASIANAMER. IND.
OTHER2+ RACESWHITEHISPANICBLACKASIANAMER. IND. OTHER2+ RACESWHITEHISPANICBLACKASIANAMER. IND.OTHER2+ RACESWHITEHISPANICBLACKASIANAMER. IND.
OTHER2+ RACESWHITEHISPANICBLACKASIANAMER. IND. OTHER2+ RACESWHITEHISPANICBLACKASIANAMER. IND. OTHER2+ RACESWHITEHISPANICBLACKASIANAMER. IND.
10%27%
0.9%2%5%
56%
Affiliate Office
698case-managed students
An additional 48 students were served at two pre-K sites.
Asian Black Hispanic White 2+ Races Other

SY 2016 – 2017
Our Reach:
Our Results:**case-managed student outcomes
GenderRaceOur Students:
STATE DATA PROFILE
Amer. Ind. Asian
Black Hispanic White 2+ Races Other
97%were promoted
(K–11)
82%improved
academics
75%improved
attendance
41%graduated or received GED
(grade 12)
Students Served by School Type
# of students
Middle School(4 middle schools)
High School(2 high schools)
Other K–12 Combinations(1 combined school)
0 3,000
1,697
15,105
2,674
16
6,000 9,000 12,000 20,000
53%Male
47%Female
19,492total students served
17,338 students receivingwhole-school supports
75% of case-managed students qualified for free or reduced-price lunch (FRPL)
INDIANA
2+ RACESWHITEHISPANICBLACKASIANAMER. IND. OTHER2+ RACESWHITEHISPANICBLACKASIANAMER. IND.OTHER2+ RACESWHITEHISPANICBLACKASIANAMER. IND.
OTHER2+ RACESWHITEHISPANICBLACKASIANAMER. IND. OTHER2+ RACESWHITEHISPANICBLACKASIANAMER. IND. OTHER2+ RACESWHITEHISPANICBLACKASIANAMER. IND.
OTHER2+ RACESWHITEHISPANICBLACKASIANAMER. IND.OTHER2+ RACESWHITEHISPANICBLACKASIANAMER. IND. OTHER2+ RACESWHITEHISPANICBLACKASIANAMER. IND.
OTHER2+ RACESWHITEHISPANICBLACKASIANAMER. IND.OTHER2+ RACESWHITEHISPANICBLACKASIANAMER. IND. OTHER2+ RACESWHITEHISPANICBLACKASIANAMER. IND.
OTHER2+ RACESWHITEHISPANICBLACKASIANAMER. IND.
OTHER2+ RACESWHITEHISPANICBLACKASIANAMER. IND. OTHER2+ RACESWHITEHISPANICBLACKASIANAMER. IND.
OTHER2+ RACESWHITEHISPANICBLACKASIANAMER. IND.OTHER2+ RACESWHITEHISPANICBLACKASIANAMER. IND. OTHER2+ RACESWHITEHISPANICBLACKASIANAMER. IND.
OTHER2+ RACESWHITEHISPANICBLACKASIANAMER. IND.OTHER2+ RACESWHITEHISPANICBLACKASIANAMER. IND. OTHER2+ RACESWHITEHISPANICBLACKASIANAMER. IND.
OTHER2+ RACESWHITEHISPANICBLACKASIANAMER. IND. OTHER2+ RACESWHITEHISPANICBLACKASIANAMER. IND.OTHER2+ RACESWHITEHISPANICBLACKASIANAMER. IND.
OTHER2+ RACESWHITEHISPANICBLACKASIANAMER. IND. OTHER2+ RACESWHITEHISPANICBLACKASIANAMER. IND. OTHER2+ RACESWHITEHISPANICBLACKASIANAMER. IND.
10%18%
10%
0.2%0.2%
0.1%
62%
Affiliate Office
State Office
Elementary School (34 elementary schools)
2,154case-managed students

SY 2016 – 2017
Our Reach:
Our Results:**case-managed student outcomes
GenderRaceOur Students:
STATE DATA PROFILE
99%were promoted
(K–11)
61%improved
academics
51%improved
attendance
997total students served
880 students receivingwhole-school supports
100% of case-managed students qualified for free or reduced-price lunch (FRPL)
32%11%
52%Male
48%Female
Students Served by School Type
# of students
Elementary School
Middle School(2 middle schools)
High School
Other K–12 Combinations
0 2,000
997
4,000 6,000 8,000 10,000
IOWA
2+ RACESWHITEHISPANICBLACKASIANAMER. IND. OTHER2+ RACESWHITEHISPANICBLACKASIANAMER. IND.OTHER2+ RACESWHITEHISPANICBLACKASIANAMER. IND.
OTHER2+ RACESWHITEHISPANICBLACKASIANAMER. IND. OTHER2+ RACESWHITEHISPANICBLACKASIANAMER. IND. OTHER2+ RACESWHITEHISPANICBLACKASIANAMER. IND.
OTHER2+ RACESWHITEHISPANICBLACKASIANAMER. IND.OTHER2+ RACESWHITEHISPANICBLACKASIANAMER. IND. OTHER2+ RACESWHITEHISPANICBLACKASIANAMER. IND.
OTHER2+ RACESWHITEHISPANICBLACKASIANAMER. IND.OTHER2+ RACESWHITEHISPANICBLACKASIANAMER. IND. OTHER2+ RACESWHITEHISPANICBLACKASIANAMER. IND.
OTHER2+ RACESWHITEHISPANICBLACKASIANAMER. IND.
OTHER2+ RACESWHITEHISPANICBLACKASIANAMER. IND. OTHER2+ RACESWHITEHISPANICBLACKASIANAMER. IND.
OTHER2+ RACESWHITEHISPANICBLACKASIANAMER. IND.OTHER2+ RACESWHITEHISPANICBLACKASIANAMER. IND. OTHER2+ RACESWHITEHISPANICBLACKASIANAMER. IND.
OTHER2+ RACESWHITEHISPANICBLACKASIANAMER. IND.OTHER2+ RACESWHITEHISPANICBLACKASIANAMER. IND. OTHER2+ RACESWHITEHISPANICBLACKASIANAMER. IND.
OTHER2+ RACESWHITEHISPANICBLACKASIANAMER. IND. OTHER2+ RACESWHITEHISPANICBLACKASIANAMER. IND.OTHER2+ RACESWHITEHISPANICBLACKASIANAMER. IND.
OTHER2+ RACESWHITEHISPANICBLACKASIANAMER. IND. OTHER2+ RACESWHITEHISPANICBLACKASIANAMER. IND. OTHER2+ RACESWHITEHISPANICBLACKASIANAMER. IND.
3%
10%
68%7%
13%
CIS of Mid-America Location
117case-managed students
Asian Black Hispanic White 2+ Races

STATE DATA PROFILE
SY 2016 – 2017
Our Reach:
Our Results:**case-managed student outcomes
GenderRace
Students Served by School Type
# of students0 5,000
2,458
4,034
21,272
10,000 15,000 20,000 25,000
49%Male
51%Female
94%were promoted
(K–11)
78%improved
academics
80%improved
attendance
92%graduated or received GED
(grade 12)
27,764total students served
25,494 students receivingwhole-school supports
88% of case-managed students qualified for free or reduced-price lunch (FRPL)
KANSAS
2+ RACESWHITEHISPANICBLACKASIANAMER. IND. OTHER2+ RACESWHITEHISPANICBLACKASIANAMER. IND.OTHER2+ RACESWHITEHISPANICBLACKASIANAMER. IND.
OTHER2+ RACESWHITEHISPANICBLACKASIANAMER. IND. OTHER2+ RACESWHITEHISPANICBLACKASIANAMER. IND. OTHER2+ RACESWHITEHISPANICBLACKASIANAMER. IND.
OTHER2+ RACESWHITEHISPANICBLACKASIANAMER. IND.OTHER2+ RACESWHITEHISPANICBLACKASIANAMER. IND. OTHER2+ RACESWHITEHISPANICBLACKASIANAMER. IND.
OTHER2+ RACESWHITEHISPANICBLACKASIANAMER. IND.OTHER2+ RACESWHITEHISPANICBLACKASIANAMER. IND. OTHER2+ RACESWHITEHISPANICBLACKASIANAMER. IND.
OTHER2+ RACESWHITEHISPANICBLACKASIANAMER. IND.
OTHER2+ RACESWHITEHISPANICBLACKASIANAMER. IND. OTHER2+ RACESWHITEHISPANICBLACKASIANAMER. IND.
OTHER2+ RACESWHITEHISPANICBLACKASIANAMER. IND.OTHER2+ RACESWHITEHISPANICBLACKASIANAMER. IND. OTHER2+ RACESWHITEHISPANICBLACKASIANAMER. IND.
OTHER2+ RACESWHITEHISPANICBLACKASIANAMER. IND.OTHER2+ RACESWHITEHISPANICBLACKASIANAMER. IND. OTHER2+ RACESWHITEHISPANICBLACKASIANAMER. IND.
OTHER2+ RACESWHITEHISPANICBLACKASIANAMER. IND. OTHER2+ RACESWHITEHISPANICBLACKASIANAMER. IND.OTHER2+ RACESWHITEHISPANICBLACKASIANAMER. IND.
OTHER2+ RACESWHITEHISPANICBLACKASIANAMER. IND. OTHER2+ RACESWHITEHISPANICBLACKASIANAMER. IND. OTHER2+ RACESWHITEHISPANICBLACKASIANAMER. IND.
7%18%
21%
1%1%
0.9%
50%
State Office
CIS of Mid-America Location
Middle School(5 middle schools)
High School(20 high schools)
Other K–12 Combinations
Elementary School (9 elementary schools)
2,270case-managed students
Amer. Ind. Asian
Black Hispanic White 2+ Races Other

STATE DATA PROFILE
SY 2016 – 2017
Our Reach:
Our Results:**case-managed student outcomes
GenderRace
52%Male
48%Female
88%were promoted
(K–11)
87%improved
academics
82%improved
attendance
72%graduated or received GED
(grade 12)
7,238total students served
5,443 students receivingwhole-school supports
99% of case-managed students qualified for free or reduced-price lunch (FRPL)
Students Served by School Type
# of students
Middle School(1 middle school)
High School(7 high schools)
Other K–12 Combinations(7 combined schools)
0 2,000
142
1,395
1,219
4,294
4,000 6,000 8,000 10,000
LOUISIANA
2+ RACESWHITEHISPANICBLACKASIANAMER. IND. OTHER2+ RACESWHITEHISPANICBLACKASIANAMER. IND.OTHER2+ RACESWHITEHISPANICBLACKASIANAMER. IND.
OTHER2+ RACESWHITEHISPANICBLACKASIANAMER. IND. OTHER2+ RACESWHITEHISPANICBLACKASIANAMER. IND. OTHER2+ RACESWHITEHISPANICBLACKASIANAMER. IND.
OTHER2+ RACESWHITEHISPANICBLACKASIANAMER. IND.OTHER2+ RACESWHITEHISPANICBLACKASIANAMER. IND. OTHER2+ RACESWHITEHISPANICBLACKASIANAMER. IND.
OTHER2+ RACESWHITEHISPANICBLACKASIANAMER. IND.OTHER2+ RACESWHITEHISPANICBLACKASIANAMER. IND. OTHER2+ RACESWHITEHISPANICBLACKASIANAMER. IND.
OTHER2+ RACESWHITEHISPANICBLACKASIANAMER. IND.
OTHER2+ RACESWHITEHISPANICBLACKASIANAMER. IND. OTHER2+ RACESWHITEHISPANICBLACKASIANAMER. IND.
OTHER2+ RACESWHITEHISPANICBLACKASIANAMER. IND.OTHER2+ RACESWHITEHISPANICBLACKASIANAMER. IND. OTHER2+ RACESWHITEHISPANICBLACKASIANAMER. IND.
OTHER2+ RACESWHITEHISPANICBLACKASIANAMER. IND.OTHER2+ RACESWHITEHISPANICBLACKASIANAMER. IND. OTHER2+ RACESWHITEHISPANICBLACKASIANAMER. IND.
OTHER2+ RACESWHITEHISPANICBLACKASIANAMER. IND. OTHER2+ RACESWHITEHISPANICBLACKASIANAMER. IND.OTHER2+ RACESWHITEHISPANICBLACKASIANAMER. IND.
OTHER2+ RACESWHITEHISPANICBLACKASIANAMER. IND. OTHER2+ RACESWHITEHISPANICBLACKASIANAMER. IND. OTHER2+ RACESWHITEHISPANICBLACKASIANAMER. IND.
15%
0.8%0.3%0.3%
3%
4%
77%
Affiliate Office
Elementary School (5 elementary schools)
1,795case-managed students
Licensee An additional 188 students were served at one pre-K site.
Amer. Ind. Asian
Black Hispanic White 2+ Races Other

SY 2016 – 2017
Our Reach:
Our Results:**case-managed student outcomes
RaceOur Students:
STATE DATA PROFILE
Amer. Ind. Asian
Black Hispanic White 2+ Races Other
96%were promoted
(K–11)
91%improved
academics
82%improved
attendance
96%graduated or received GED
(grade 12)
Students Served by School Type
# of students
Middle School(7 middle schools)
High School(15 high schools)
Other K–12 Combinations(7 combined schools)
0 2,000
2,364
5,889
5,409
3,679
4,000 6,000 8,000 10,000
Gender
48%Male
52%Female
17,341total students served
14,583 students receivingwhole-school supports
91% of case-managed students qualified for free or reduced-price lunch (FRPL)
MICHIGAN
2+ RACESWHITEHISPANICBLACKASIANAMER. IND. OTHER2+ RACESWHITEHISPANICBLACKASIANAMER. IND.OTHER2+ RACESWHITEHISPANICBLACKASIANAMER. IND.
OTHER2+ RACESWHITEHISPANICBLACKASIANAMER. IND. OTHER2+ RACESWHITEHISPANICBLACKASIANAMER. IND. OTHER2+ RACESWHITEHISPANICBLACKASIANAMER. IND.
OTHER2+ RACESWHITEHISPANICBLACKASIANAMER. IND.OTHER2+ RACESWHITEHISPANICBLACKASIANAMER. IND. OTHER2+ RACESWHITEHISPANICBLACKASIANAMER. IND.
OTHER2+ RACESWHITEHISPANICBLACKASIANAMER. IND.OTHER2+ RACESWHITEHISPANICBLACKASIANAMER. IND. OTHER2+ RACESWHITEHISPANICBLACKASIANAMER. IND.
OTHER2+ RACESWHITEHISPANICBLACKASIANAMER. IND.
OTHER2+ RACESWHITEHISPANICBLACKASIANAMER. IND. OTHER2+ RACESWHITEHISPANICBLACKASIANAMER. IND.
OTHER2+ RACESWHITEHISPANICBLACKASIANAMER. IND.OTHER2+ RACESWHITEHISPANICBLACKASIANAMER. IND. OTHER2+ RACESWHITEHISPANICBLACKASIANAMER. IND.
OTHER2+ RACESWHITEHISPANICBLACKASIANAMER. IND.OTHER2+ RACESWHITEHISPANICBLACKASIANAMER. IND. OTHER2+ RACESWHITEHISPANICBLACKASIANAMER. IND.
OTHER2+ RACESWHITEHISPANICBLACKASIANAMER. IND. OTHER2+ RACESWHITEHISPANICBLACKASIANAMER. IND.OTHER2+ RACESWHITEHISPANICBLACKASIANAMER. IND.
OTHER2+ RACESWHITEHISPANICBLACKASIANAMER. IND. OTHER2+ RACESWHITEHISPANICBLACKASIANAMER. IND. OTHER2+ RACESWHITEHISPANICBLACKASIANAMER. IND.
7%
24%
8%
0.4%0.2%
1%
59%
Affiliate Office
State Office
Elementary School (26 elementary schools)
2,758case-managed students

STATE DATA PROFILE
SY 2016 – 2017
Our Reach:
Our Results:**case-managed student outcomes
GenderRace
22%Male
78%Female
100%were promoted
(K–11)
97%graduated or received GED
(grade 12)
1,566total students served
1,488 students receivingwhole-school supports
100% of case-managed students qualified for free or reduced-price lunch (FRPL)
Students Served by School Type
# of students
Elementary School
Middle School
High School(1 high school)
Other K–12 Combinations
0 2,000
1,566
4,000 6,000 8,000 10,000
NEBRASKA
2+ RACESWHITEHISPANICBLACKASIANAMER. IND. OTHER2+ RACESWHITEHISPANICBLACKASIANAMER. IND.OTHER2+ RACESWHITEHISPANICBLACKASIANAMER. IND.
OTHER2+ RACESWHITEHISPANICBLACKASIANAMER. IND. OTHER2+ RACESWHITEHISPANICBLACKASIANAMER. IND. OTHER2+ RACESWHITEHISPANICBLACKASIANAMER. IND.
OTHER2+ RACESWHITEHISPANICBLACKASIANAMER. IND.OTHER2+ RACESWHITEHISPANICBLACKASIANAMER. IND. OTHER2+ RACESWHITEHISPANICBLACKASIANAMER. IND.
OTHER2+ RACESWHITEHISPANICBLACKASIANAMER. IND.OTHER2+ RACESWHITEHISPANICBLACKASIANAMER. IND. OTHER2+ RACESWHITEHISPANICBLACKASIANAMER. IND.
OTHER2+ RACESWHITEHISPANICBLACKASIANAMER. IND.
OTHER2+ RACESWHITEHISPANICBLACKASIANAMER. IND. OTHER2+ RACESWHITEHISPANICBLACKASIANAMER. IND.
OTHER2+ RACESWHITEHISPANICBLACKASIANAMER. IND.OTHER2+ RACESWHITEHISPANICBLACKASIANAMER. IND. OTHER2+ RACESWHITEHISPANICBLACKASIANAMER. IND.
OTHER2+ RACESWHITEHISPANICBLACKASIANAMER. IND.OTHER2+ RACESWHITEHISPANICBLACKASIANAMER. IND. OTHER2+ RACESWHITEHISPANICBLACKASIANAMER. IND.
OTHER2+ RACESWHITEHISPANICBLACKASIANAMER. IND. OTHER2+ RACESWHITEHISPANICBLACKASIANAMER. IND.OTHER2+ RACESWHITEHISPANICBLACKASIANAMER. IND.
OTHER2+ RACESWHITEHISPANICBLACKASIANAMER. IND. OTHER2+ RACESWHITEHISPANICBLACKASIANAMER. IND. OTHER2+ RACESWHITEHISPANICBLACKASIANAMER. IND.
12%
9%
6%
1%
72%
78case-managed students
CIS of Mid-America Location
Asian Black Hispanic White 2+ Races

STATE DATA PROFILE
2+ RACESWHITEHISPANICBLACKASIANAMER. IND. OTHER2+ RACESWHITEHISPANICBLACKASIANAMER. IND.OTHER2+ RACESWHITEHISPANICBLACKASIANAMER. IND.
OTHER2+ RACESWHITEHISPANICBLACKASIANAMER. IND. OTHER2+ RACESWHITEHISPANICBLACKASIANAMER. IND. OTHER2+ RACESWHITEHISPANICBLACKASIANAMER. IND.
OTHER2+ RACESWHITEHISPANICBLACKASIANAMER. IND.OTHER2+ RACESWHITEHISPANICBLACKASIANAMER. IND. OTHER2+ RACESWHITEHISPANICBLACKASIANAMER. IND.
OTHER2+ RACESWHITEHISPANICBLACKASIANAMER. IND.OTHER2+ RACESWHITEHISPANICBLACKASIANAMER. IND. OTHER2+ RACESWHITEHISPANICBLACKASIANAMER. IND.
OTHER2+ RACESWHITEHISPANICBLACKASIANAMER. IND.
OTHER2+ RACESWHITEHISPANICBLACKASIANAMER. IND. OTHER2+ RACESWHITEHISPANICBLACKASIANAMER. IND.
OTHER2+ RACESWHITEHISPANICBLACKASIANAMER. IND.OTHER2+ RACESWHITEHISPANICBLACKASIANAMER. IND. OTHER2+ RACESWHITEHISPANICBLACKASIANAMER. IND.
OTHER2+ RACESWHITEHISPANICBLACKASIANAMER. IND.OTHER2+ RACESWHITEHISPANICBLACKASIANAMER. IND. OTHER2+ RACESWHITEHISPANICBLACKASIANAMER. IND.
OTHER2+ RACESWHITEHISPANICBLACKASIANAMER. IND. OTHER2+ RACESWHITEHISPANICBLACKASIANAMER. IND.OTHER2+ RACESWHITEHISPANICBLACKASIANAMER. IND.
OTHER2+ RACESWHITEHISPANICBLACKASIANAMER. IND. OTHER2+ RACESWHITEHISPANICBLACKASIANAMER. IND. OTHER2+ RACESWHITEHISPANICBLACKASIANAMER. IND.
SY 2016 – 2017
Our Reach:
Our Results:**case-managed student outcomes
Students Served by School Type
GenderRace
# of students
60,903total students served
55,456 students receivingwhole-school supports
93% of case-managed students qualified for free or reduced-price lunch (FRPL)
Elementary School(42 elementary schools)
Middle School(9 middle schools)
High School(12 high schools)
Other K–12 Combinations(3 combined schools)
0 6,000
7,461
100
12,000 18,000 24,000 30,000
97%were promoted
(K–11)
85%improved
academics
75%improved
attendance
88%graduated or received GED
(grade 12)
13%26%
4% 2%1%0.1%
54%
54%Male
46%Female
NEVADA
Affiliate Office
State Office
28,708
24,241
5,447case-managed students
An additional 393 students were served at four community-based sites.
Amer. Ind. Asian
Black Hispanic White 2+ Races Other

STATE DATA PROFILE
2+ RACESWHITEHISPANICBLACKASIANAMER. IND. OTHER2+ RACESWHITEHISPANICBLACKASIANAMER. IND.OTHER2+ RACESWHITEHISPANICBLACKASIANAMER. IND.
OTHER2+ RACESWHITEHISPANICBLACKASIANAMER. IND. OTHER2+ RACESWHITEHISPANICBLACKASIANAMER. IND. OTHER2+ RACESWHITEHISPANICBLACKASIANAMER. IND.
OTHER2+ RACESWHITEHISPANICBLACKASIANAMER. IND.OTHER2+ RACESWHITEHISPANICBLACKASIANAMER. IND. OTHER2+ RACESWHITEHISPANICBLACKASIANAMER. IND.
OTHER2+ RACESWHITEHISPANICBLACKASIANAMER. IND.OTHER2+ RACESWHITEHISPANICBLACKASIANAMER. IND. OTHER2+ RACESWHITEHISPANICBLACKASIANAMER. IND.
OTHER2+ RACESWHITEHISPANICBLACKASIANAMER. IND.
OTHER2+ RACESWHITEHISPANICBLACKASIANAMER. IND. OTHER2+ RACESWHITEHISPANICBLACKASIANAMER. IND.
OTHER2+ RACESWHITEHISPANICBLACKASIANAMER. IND.OTHER2+ RACESWHITEHISPANICBLACKASIANAMER. IND. OTHER2+ RACESWHITEHISPANICBLACKASIANAMER. IND.
OTHER2+ RACESWHITEHISPANICBLACKASIANAMER. IND.OTHER2+ RACESWHITEHISPANICBLACKASIANAMER. IND. OTHER2+ RACESWHITEHISPANICBLACKASIANAMER. IND.
OTHER2+ RACESWHITEHISPANICBLACKASIANAMER. IND. OTHER2+ RACESWHITEHISPANICBLACKASIANAMER. IND.OTHER2+ RACESWHITEHISPANICBLACKASIANAMER. IND.
OTHER2+ RACESWHITEHISPANICBLACKASIANAMER. IND. OTHER2+ RACESWHITEHISPANICBLACKASIANAMER. IND. OTHER2+ RACESWHITEHISPANICBLACKASIANAMER. IND.
SY 2016 – 2017
Our Reach:
Our Results:**case-managed student outcomes
Students Served by School Type
GenderRace
# of students
4,531 total students served
4,205 students receivingwhole-school supports
95% of case-managed students qualified for free or reduced-price lunch (FRPL)
Elementary School(3 elementary schools)
Middle School(1 middle school)
High School(2 high schools)
Other K–12 Combinations(2 combined schools)
0 2,000
554
976
1,662
1,339
4,000 6,000 8,000 10,000+
91%were promoted
(K–11)
81%improved
academics
76%improved
attendance
78%graduated or received GED
(grade 12)
11%
76%
39%Male
61%Female
NEW MEXICO
Affiliate Office
4% 0.3%6%0.6%2%
326case-managed students
Amer. Ind. Asian
Black Hispanic White 2+ Races Other

SY 2016 – 2017
Our Reach:
Our Results:**case-managed student outcomes
GenderRaceOur Students:
STATE DATA PROFILE
Amer. Ind. Asian
Black Hispanic White 2+ Races Other
Students Served by School Type
# of students
Middle School(82 middle schools)
High School(69 high schools)
Other K–12 Combinations(13 combined schools)
0 12,000
52,663
39,393
53,471
6,454
24,000 36,000 48,000 60,000
96%were promoted
(K–11)
90%improved
academics
87%improved
attendance
96%graduated or received GED
(grade 12)
163,682total students served
147,081 students receivingwhole-school supports
97% of case-managed students qualified for free or reduced-price lunch (FRPL)
NORTH CAROLINA
49%Male
51%Female
2+ RACESWHITEHISPANICBLACKASIANAMER. IND. OTHER2+ RACESWHITEHISPANICBLACKASIANAMER. IND.OTHER2+ RACESWHITEHISPANICBLACKASIANAMER. IND.
OTHER2+ RACESWHITEHISPANICBLACKASIANAMER. IND. OTHER2+ RACESWHITEHISPANICBLACKASIANAMER. IND. OTHER2+ RACESWHITEHISPANICBLACKASIANAMER. IND.
OTHER2+ RACESWHITEHISPANICBLACKASIANAMER. IND.OTHER2+ RACESWHITEHISPANICBLACKASIANAMER. IND. OTHER2+ RACESWHITEHISPANICBLACKASIANAMER. IND.
OTHER2+ RACESWHITEHISPANICBLACKASIANAMER. IND.OTHER2+ RACESWHITEHISPANICBLACKASIANAMER. IND. OTHER2+ RACESWHITEHISPANICBLACKASIANAMER. IND.
OTHER2+ RACESWHITEHISPANICBLACKASIANAMER. IND.
OTHER2+ RACESWHITEHISPANICBLACKASIANAMER. IND. OTHER2+ RACESWHITEHISPANICBLACKASIANAMER. IND.
OTHER2+ RACESWHITEHISPANICBLACKASIANAMER. IND.OTHER2+ RACESWHITEHISPANICBLACKASIANAMER. IND. OTHER2+ RACESWHITEHISPANICBLACKASIANAMER. IND.
OTHER2+ RACESWHITEHISPANICBLACKASIANAMER. IND.OTHER2+ RACESWHITEHISPANICBLACKASIANAMER. IND. OTHER2+ RACESWHITEHISPANICBLACKASIANAMER. IND.
OTHER2+ RACESWHITEHISPANICBLACKASIANAMER. IND. OTHER2+ RACESWHITEHISPANICBLACKASIANAMER. IND.OTHER2+ RACESWHITEHISPANICBLACKASIANAMER. IND.
OTHER2+ RACESWHITEHISPANICBLACKASIANAMER. IND. OTHER2+ RACESWHITEHISPANICBLACKASIANAMER. IND. OTHER2+ RACESWHITEHISPANICBLACKASIANAMER. IND.
16%
16%
2%1% 2%
3%
61%
Affiliate Office
State Office
Elementary School (131 elementary schools)
16,601case-managed students
Other than the number of students served, data were received for 24 of 25 affiliates.
An additional 10,813 students were served at 13 community-based sites.

STATE DATA PROFILE
2+ RACESWHITEHISPANICBLACKASIANAMER. IND. OTHER2+ RACESWHITEHISPANICBLACKASIANAMER. IND.OTHER2+ RACESWHITEHISPANICBLACKASIANAMER. IND.
OTHER2+ RACESWHITEHISPANICBLACKASIANAMER. IND. OTHER2+ RACESWHITEHISPANICBLACKASIANAMER. IND. OTHER2+ RACESWHITEHISPANICBLACKASIANAMER. IND.
OTHER2+ RACESWHITEHISPANICBLACKASIANAMER. IND.OTHER2+ RACESWHITEHISPANICBLACKASIANAMER. IND. OTHER2+ RACESWHITEHISPANICBLACKASIANAMER. IND.
OTHER2+ RACESWHITEHISPANICBLACKASIANAMER. IND.OTHER2+ RACESWHITEHISPANICBLACKASIANAMER. IND. OTHER2+ RACESWHITEHISPANICBLACKASIANAMER. IND.
OTHER2+ RACESWHITEHISPANICBLACKASIANAMER. IND.
OTHER2+ RACESWHITEHISPANICBLACKASIANAMER. IND. OTHER2+ RACESWHITEHISPANICBLACKASIANAMER. IND.
OTHER2+ RACESWHITEHISPANICBLACKASIANAMER. IND.OTHER2+ RACESWHITEHISPANICBLACKASIANAMER. IND. OTHER2+ RACESWHITEHISPANICBLACKASIANAMER. IND.
OTHER2+ RACESWHITEHISPANICBLACKASIANAMER. IND.OTHER2+ RACESWHITEHISPANICBLACKASIANAMER. IND. OTHER2+ RACESWHITEHISPANICBLACKASIANAMER. IND.
OTHER2+ RACESWHITEHISPANICBLACKASIANAMER. IND. OTHER2+ RACESWHITEHISPANICBLACKASIANAMER. IND.OTHER2+ RACESWHITEHISPANICBLACKASIANAMER. IND.
OTHER2+ RACESWHITEHISPANICBLACKASIANAMER. IND. OTHER2+ RACESWHITEHISPANICBLACKASIANAMER. IND. OTHER2+ RACESWHITEHISPANICBLACKASIANAMER. IND.
SY 2016 – 2017
Our Reach:
Our Results:**case-managed student outcomes
Students Served by School Type
GenderRace
# of students
4,741total students served
4,099 students receivingwhole-school supports
97% of case-managed students qualified for free or reduced-price lunch (FRPL)
Elementary School(4 elementary schools)
Middle School(3 middle schools)
High School(1 high school)
Other K–12 Combinations(2 combined schools)
0 2,000
1,236
1,433
980
1,092
4,000 6,000 8,000 10,000
93%were promoted
(K–11)
85%improved
academics
84%improved
attendance
91%graduated or received GED
(grade 12)
5% 2%3%
0.6%
60%
20%
9%
51%Male
49%Female
OHIO
Affiliate Office
642case-managed students
Amer. Ind. Asian
Black Hispanic White 2+ Races Other

STATE DATA PROFILE
2+ RACESWHITEHISPANICBLACKASIANAMER. IND. OTHER2+ RACESWHITEHISPANICBLACKASIANAMER. IND.OTHER2+ RACESWHITEHISPANICBLACKASIANAMER. IND.
OTHER2+ RACESWHITEHISPANICBLACKASIANAMER. IND. OTHER2+ RACESWHITEHISPANICBLACKASIANAMER. IND. OTHER2+ RACESWHITEHISPANICBLACKASIANAMER. IND.
OTHER2+ RACESWHITEHISPANICBLACKASIANAMER. IND.OTHER2+ RACESWHITEHISPANICBLACKASIANAMER. IND. OTHER2+ RACESWHITEHISPANICBLACKASIANAMER. IND.
OTHER2+ RACESWHITEHISPANICBLACKASIANAMER. IND.OTHER2+ RACESWHITEHISPANICBLACKASIANAMER. IND. OTHER2+ RACESWHITEHISPANICBLACKASIANAMER. IND.
OTHER2+ RACESWHITEHISPANICBLACKASIANAMER. IND.
OTHER2+ RACESWHITEHISPANICBLACKASIANAMER. IND. OTHER2+ RACESWHITEHISPANICBLACKASIANAMER. IND.
OTHER2+ RACESWHITEHISPANICBLACKASIANAMER. IND.OTHER2+ RACESWHITEHISPANICBLACKASIANAMER. IND. OTHER2+ RACESWHITEHISPANICBLACKASIANAMER. IND.
OTHER2+ RACESWHITEHISPANICBLACKASIANAMER. IND.OTHER2+ RACESWHITEHISPANICBLACKASIANAMER. IND. OTHER2+ RACESWHITEHISPANICBLACKASIANAMER. IND.
OTHER2+ RACESWHITEHISPANICBLACKASIANAMER. IND. OTHER2+ RACESWHITEHISPANICBLACKASIANAMER. IND.OTHER2+ RACESWHITEHISPANICBLACKASIANAMER. IND.
OTHER2+ RACESWHITEHISPANICBLACKASIANAMER. IND. OTHER2+ RACESWHITEHISPANICBLACKASIANAMER. IND. OTHER2+ RACESWHITEHISPANICBLACKASIANAMER. IND.
SY 2016 – 2017
Our Reach:
Our Results:**case-managed student outcomes
Students Served by School Type
GenderRace
# of students
5,075total students served
4,507 students receivingwhole-school supports
100% of case-managed students qualified for free or reduced-price lunch (FRPL)
Elementary School(3 elementary schools)
Middle School(2 middle schools)
High School(4 high schools)
Other K–12 Combinations
0 2,000
1,790
854
2,431
4,000 6,000 8,000 10,000+
92%were promoted
(K–11)
87%improved
academics
88%improved
attendance
97%graduated or received GED
(grade 12)
0.2% 1%
23%
5%8%
24%
39%
46%Male
54%Female
OKLAHOMA
568 case-managed students
CIS of Mid-America Location
Amer. Ind. Asian
Black Hispanic White 2+ Races Other

STATE DATA PROFILE
2+ RACESWHITEHISPANICBLACKASIANAMER. IND. OTHER2+ RACESWHITEHISPANICBLACKASIANAMER. IND.OTHER2+ RACESWHITEHISPANICBLACKASIANAMER. IND.
OTHER2+ RACESWHITEHISPANICBLACKASIANAMER. IND. OTHER2+ RACESWHITEHISPANICBLACKASIANAMER. IND. OTHER2+ RACESWHITEHISPANICBLACKASIANAMER. IND.
OTHER2+ RACESWHITEHISPANICBLACKASIANAMER. IND.OTHER2+ RACESWHITEHISPANICBLACKASIANAMER. IND. OTHER2+ RACESWHITEHISPANICBLACKASIANAMER. IND.
OTHER2+ RACESWHITEHISPANICBLACKASIANAMER. IND.OTHER2+ RACESWHITEHISPANICBLACKASIANAMER. IND. OTHER2+ RACESWHITEHISPANICBLACKASIANAMER. IND.
OTHER2+ RACESWHITEHISPANICBLACKASIANAMER. IND.
OTHER2+ RACESWHITEHISPANICBLACKASIANAMER. IND. OTHER2+ RACESWHITEHISPANICBLACKASIANAMER. IND.
OTHER2+ RACESWHITEHISPANICBLACKASIANAMER. IND.OTHER2+ RACESWHITEHISPANICBLACKASIANAMER. IND. OTHER2+ RACESWHITEHISPANICBLACKASIANAMER. IND.
OTHER2+ RACESWHITEHISPANICBLACKASIANAMER. IND.OTHER2+ RACESWHITEHISPANICBLACKASIANAMER. IND. OTHER2+ RACESWHITEHISPANICBLACKASIANAMER. IND.
OTHER2+ RACESWHITEHISPANICBLACKASIANAMER. IND. OTHER2+ RACESWHITEHISPANICBLACKASIANAMER. IND.OTHER2+ RACESWHITEHISPANICBLACKASIANAMER. IND.
OTHER2+ RACESWHITEHISPANICBLACKASIANAMER. IND. OTHER2+ RACESWHITEHISPANICBLACKASIANAMER. IND. OTHER2+ RACESWHITEHISPANICBLACKASIANAMER. IND.
SY 2016 – 2017
Our Reach:
Our Results:**case-managed student outcomes
Students Served by School Type
GenderRace
# of students
32,339total students served
29,106 students receivingwhole-school supports
94% of case-managed students qualified for free or reduced-price lunch (FRPL)
Elementary School(13 elementary schools)
Middle School(10 middle schools)
High School(29 high schools)
Other K–12 Combinations(11 combined schools)
0 4,000
6,395
4,669
15,111
5,371
8,000 12,000 16,000 20,000
79%were promoted
(K–11)
79%improved
academics
74%improved
attendance
90%graduated or received GED
(grade 12)
12%
44%
38%
4% 0.9%0.4%
44%Male
56%Female
PENNSYLVANIA
Affiliate Office
State Office
3,233case-managed students
Asian Black Hispanic White 2+ Races Other
An additional 793 students were served at one college and two community-based sites.

STATE DATA PROFILE
2+ RACESWHITEHISPANICBLACKASIANAMER. IND. OTHER2+ RACESWHITEHISPANICBLACKASIANAMER. IND.OTHER2+ RACESWHITEHISPANICBLACKASIANAMER. IND.
OTHER2+ RACESWHITEHISPANICBLACKASIANAMER. IND. OTHER2+ RACESWHITEHISPANICBLACKASIANAMER. IND. OTHER2+ RACESWHITEHISPANICBLACKASIANAMER. IND.
OTHER2+ RACESWHITEHISPANICBLACKASIANAMER. IND.OTHER2+ RACESWHITEHISPANICBLACKASIANAMER. IND. OTHER2+ RACESWHITEHISPANICBLACKASIANAMER. IND.
OTHER2+ RACESWHITEHISPANICBLACKASIANAMER. IND.OTHER2+ RACESWHITEHISPANICBLACKASIANAMER. IND. OTHER2+ RACESWHITEHISPANICBLACKASIANAMER. IND.
OTHER2+ RACESWHITEHISPANICBLACKASIANAMER. IND.
OTHER2+ RACESWHITEHISPANICBLACKASIANAMER. IND. OTHER2+ RACESWHITEHISPANICBLACKASIANAMER. IND.
OTHER2+ RACESWHITEHISPANICBLACKASIANAMER. IND.OTHER2+ RACESWHITEHISPANICBLACKASIANAMER. IND. OTHER2+ RACESWHITEHISPANICBLACKASIANAMER. IND.
OTHER2+ RACESWHITEHISPANICBLACKASIANAMER. IND.OTHER2+ RACESWHITEHISPANICBLACKASIANAMER. IND. OTHER2+ RACESWHITEHISPANICBLACKASIANAMER. IND.
OTHER2+ RACESWHITEHISPANICBLACKASIANAMER. IND. OTHER2+ RACESWHITEHISPANICBLACKASIANAMER. IND.OTHER2+ RACESWHITEHISPANICBLACKASIANAMER. IND.
OTHER2+ RACESWHITEHISPANICBLACKASIANAMER. IND. OTHER2+ RACESWHITEHISPANICBLACKASIANAMER. IND. OTHER2+ RACESWHITEHISPANICBLACKASIANAMER. IND.
SY 2016 – 2017
Our Reach:
Our Results:**case-managed student outcomes
Students Served by School Type
GenderRace
# of students
16,292total students served
14,842 students receivingwhole-school supports
96% of case-managed students qualified for free or reduced-price lunch (FRPL)
Elementary School(20 elementary schools)
Middle School(7 middle schools)
High School(8 high schools)
Other K–12 Combinations(2 combined schools)
0 2,000
3,437
8,212
4,011
632
4,000 6,000 8,000 10,000
96%were promoted
(K–11)
94%improved
academics
86%improved
attendance
98%graduated or received GED
(grade 12)
0.1% 0.1%0.7%4%
72%
12%
11%
49%Male
51%Female
SOUTH CAROLINA
Affiliate Office
1,450case-managed students
Amer. Ind. Asian
Black Hispanic White 2+ Races Other

STATE DATA PROFILE
2+ RACESWHITEHISPANICBLACKASIANAMER. IND. OTHER2+ RACESWHITEHISPANICBLACKASIANAMER. IND.OTHER2+ RACESWHITEHISPANICBLACKASIANAMER. IND.
OTHER2+ RACESWHITEHISPANICBLACKASIANAMER. IND. OTHER2+ RACESWHITEHISPANICBLACKASIANAMER. IND. OTHER2+ RACESWHITEHISPANICBLACKASIANAMER. IND.
OTHER2+ RACESWHITEHISPANICBLACKASIANAMER. IND.OTHER2+ RACESWHITEHISPANICBLACKASIANAMER. IND. OTHER2+ RACESWHITEHISPANICBLACKASIANAMER. IND.
OTHER2+ RACESWHITEHISPANICBLACKASIANAMER. IND.OTHER2+ RACESWHITEHISPANICBLACKASIANAMER. IND. OTHER2+ RACESWHITEHISPANICBLACKASIANAMER. IND.
OTHER2+ RACESWHITEHISPANICBLACKASIANAMER. IND.
OTHER2+ RACESWHITEHISPANICBLACKASIANAMER. IND. OTHER2+ RACESWHITEHISPANICBLACKASIANAMER. IND.
OTHER2+ RACESWHITEHISPANICBLACKASIANAMER. IND.OTHER2+ RACESWHITEHISPANICBLACKASIANAMER. IND. OTHER2+ RACESWHITEHISPANICBLACKASIANAMER. IND.
OTHER2+ RACESWHITEHISPANICBLACKASIANAMER. IND.OTHER2+ RACESWHITEHISPANICBLACKASIANAMER. IND. OTHER2+ RACESWHITEHISPANICBLACKASIANAMER. IND.
OTHER2+ RACESWHITEHISPANICBLACKASIANAMER. IND. OTHER2+ RACESWHITEHISPANICBLACKASIANAMER. IND.OTHER2+ RACESWHITEHISPANICBLACKASIANAMER. IND.
OTHER2+ RACESWHITEHISPANICBLACKASIANAMER. IND. OTHER2+ RACESWHITEHISPANICBLACKASIANAMER. IND. OTHER2+ RACESWHITEHISPANICBLACKASIANAMER. IND.
SY 2016 – 2017
Our Reach:
Our Results:**case-managed student outcomes
Students Served by School Type
GenderRace
# of students
10,530total students served
9,463students receivingwhole-school supports
100% of case-managed students qualified for free or reduced-price lunch (FRPL)
Elementary School(8 elementary schools)
Middle School(10 middle schools)
High School(5 high schools)
Other K–12 Combinations(3 combined schools)
0 2,000
3,996
2,665
2,664
1,205
4,000 6,000 8,000 10,000+
90%were promoted
(K–11)
93%improved
academics
83%improved
attendance
91%graduated or received GED
(grade 12)
3%2%
0.8%0.2%
1%
93%
43%Male
57%Female
TENNESSEE
Affiliate Office
State Office
1,067case-managed students
Asian Black Hispanic White 2+ Races Other

STATE DATA PROFILE
2+ RACESWHITEHISPANICBLACKASIANAMER. IND. OTHER2+ RACESWHITEHISPANICBLACKASIANAMER. IND.OTHER2+ RACESWHITEHISPANICBLACKASIANAMER. IND.
OTHER2+ RACESWHITEHISPANICBLACKASIANAMER. IND. OTHER2+ RACESWHITEHISPANICBLACKASIANAMER. IND. OTHER2+ RACESWHITEHISPANICBLACKASIANAMER. IND.
OTHER2+ RACESWHITEHISPANICBLACKASIANAMER. IND.OTHER2+ RACESWHITEHISPANICBLACKASIANAMER. IND. OTHER2+ RACESWHITEHISPANICBLACKASIANAMER. IND.
OTHER2+ RACESWHITEHISPANICBLACKASIANAMER. IND.OTHER2+ RACESWHITEHISPANICBLACKASIANAMER. IND. OTHER2+ RACESWHITEHISPANICBLACKASIANAMER. IND.
OTHER2+ RACESWHITEHISPANICBLACKASIANAMER. IND.
OTHER2+ RACESWHITEHISPANICBLACKASIANAMER. IND. OTHER2+ RACESWHITEHISPANICBLACKASIANAMER. IND.
OTHER2+ RACESWHITEHISPANICBLACKASIANAMER. IND.OTHER2+ RACESWHITEHISPANICBLACKASIANAMER. IND. OTHER2+ RACESWHITEHISPANICBLACKASIANAMER. IND.
OTHER2+ RACESWHITEHISPANICBLACKASIANAMER. IND.OTHER2+ RACESWHITEHISPANICBLACKASIANAMER. IND. OTHER2+ RACESWHITEHISPANICBLACKASIANAMER. IND.
OTHER2+ RACESWHITEHISPANICBLACKASIANAMER. IND. OTHER2+ RACESWHITEHISPANICBLACKASIANAMER. IND.OTHER2+ RACESWHITEHISPANICBLACKASIANAMER. IND.
OTHER2+ RACESWHITEHISPANICBLACKASIANAMER. IND. OTHER2+ RACESWHITEHISPANICBLACKASIANAMER. IND. OTHER2+ RACESWHITEHISPANICBLACKASIANAMER. IND.
SY 2016 – 2017
Our Reach:
Our Results:**case-managed student outcomes
Schools Served by Type
GenderRace
# of schools
802,192total students served
717,064 students receivingwhole-school supports
90% of case-managed students qualified for free or reduced-price lunch (FRPL)
Elementary Schools
Middle Schools
High Schools
Other K–12 Combinations
0 100 200 300 400
94%were promoted
(K–11)
90%improved
academics
76%improved
attendance
95%graduated or received GED
(grade 12)
1%
0.3%
11%
1%
19%
67%
TEXAS
Affiliate Office
48%Male
52%Female
85,128case-managed students
351
280
222
60
An additional three community-based sites and four other sites were served. Breakdown of students by school type not available.
Amer. Ind. Asian
Black Hispanic White 2+ Races

STATE DATA PROFILE
2+ RACESWHITEHISPANICBLACKASIANAMER. IND. OTHER2+ RACESWHITEHISPANICBLACKASIANAMER. IND.OTHER2+ RACESWHITEHISPANICBLACKASIANAMER. IND.
OTHER2+ RACESWHITEHISPANICBLACKASIANAMER. IND. OTHER2+ RACESWHITEHISPANICBLACKASIANAMER. IND. OTHER2+ RACESWHITEHISPANICBLACKASIANAMER. IND.
OTHER2+ RACESWHITEHISPANICBLACKASIANAMER. IND.OTHER2+ RACESWHITEHISPANICBLACKASIANAMER. IND. OTHER2+ RACESWHITEHISPANICBLACKASIANAMER. IND.
OTHER2+ RACESWHITEHISPANICBLACKASIANAMER. IND.OTHER2+ RACESWHITEHISPANICBLACKASIANAMER. IND. OTHER2+ RACESWHITEHISPANICBLACKASIANAMER. IND.
OTHER2+ RACESWHITEHISPANICBLACKASIANAMER. IND.
OTHER2+ RACESWHITEHISPANICBLACKASIANAMER. IND. OTHER2+ RACESWHITEHISPANICBLACKASIANAMER. IND.
OTHER2+ RACESWHITEHISPANICBLACKASIANAMER. IND.OTHER2+ RACESWHITEHISPANICBLACKASIANAMER. IND. OTHER2+ RACESWHITEHISPANICBLACKASIANAMER. IND.
OTHER2+ RACESWHITEHISPANICBLACKASIANAMER. IND.OTHER2+ RACESWHITEHISPANICBLACKASIANAMER. IND. OTHER2+ RACESWHITEHISPANICBLACKASIANAMER. IND.
OTHER2+ RACESWHITEHISPANICBLACKASIANAMER. IND. OTHER2+ RACESWHITEHISPANICBLACKASIANAMER. IND.OTHER2+ RACESWHITEHISPANICBLACKASIANAMER. IND.
OTHER2+ RACESWHITEHISPANICBLACKASIANAMER. IND. OTHER2+ RACESWHITEHISPANICBLACKASIANAMER. IND. OTHER2+ RACESWHITEHISPANICBLACKASIANAMER. IND.
SY 2016 – 2017
Our Reach:
Our Results:**case-managed student outcomes
Students Served by School Type
GenderRace
# of students
42,833total students served
38,390students receivingwhole-school supports
97% of case-managed students qualified for free or reduced-price lunch (FRPL)
Elementary School(35 elementary schools)
Middle School(18 middle schools)
High School(17 high schools)
Other K–12 Combinations(1 combined school)
0 4,000
13,035
16,310
762
8,000 12,000 16,000 20,000
91%were promoted
(K–11)
76%improved
academics
56%improved
attendance
90%graduated or received GED
(grade 12)
8%
1% 0.1%0.6%2%
11%
77%
51%Male
49%Female
VIRGINIA
Affiliate Office
State Office
12,726
4,443case-managed students
Amer. Ind. Asian
Black Hispanic White 2+ Races Other

STATE DATA PROFILE
2+ RACESWHITEHISPANICBLACKASIANAMER. IND. OTHER2+ RACESWHITEHISPANICBLACKASIANAMER. IND.OTHER2+ RACESWHITEHISPANICBLACKASIANAMER. IND.
OTHER2+ RACESWHITEHISPANICBLACKASIANAMER. IND. OTHER2+ RACESWHITEHISPANICBLACKASIANAMER. IND. OTHER2+ RACESWHITEHISPANICBLACKASIANAMER. IND.
OTHER2+ RACESWHITEHISPANICBLACKASIANAMER. IND.OTHER2+ RACESWHITEHISPANICBLACKASIANAMER. IND. OTHER2+ RACESWHITEHISPANICBLACKASIANAMER. IND.
OTHER2+ RACESWHITEHISPANICBLACKASIANAMER. IND.OTHER2+ RACESWHITEHISPANICBLACKASIANAMER. IND. OTHER2+ RACESWHITEHISPANICBLACKASIANAMER. IND.
OTHER2+ RACESWHITEHISPANICBLACKASIANAMER. IND.
OTHER2+ RACESWHITEHISPANICBLACKASIANAMER. IND. OTHER2+ RACESWHITEHISPANICBLACKASIANAMER. IND.
OTHER2+ RACESWHITEHISPANICBLACKASIANAMER. IND.OTHER2+ RACESWHITEHISPANICBLACKASIANAMER. IND. OTHER2+ RACESWHITEHISPANICBLACKASIANAMER. IND.
OTHER2+ RACESWHITEHISPANICBLACKASIANAMER. IND.OTHER2+ RACESWHITEHISPANICBLACKASIANAMER. IND. OTHER2+ RACESWHITEHISPANICBLACKASIANAMER. IND.
OTHER2+ RACESWHITEHISPANICBLACKASIANAMER. IND. OTHER2+ RACESWHITEHISPANICBLACKASIANAMER. IND.OTHER2+ RACESWHITEHISPANICBLACKASIANAMER. IND.
OTHER2+ RACESWHITEHISPANICBLACKASIANAMER. IND. OTHER2+ RACESWHITEHISPANICBLACKASIANAMER. IND. OTHER2+ RACESWHITEHISPANICBLACKASIANAMER. IND.
SY 2016 – 2017
Our Reach:
Our Results:**case-managed student outcomes
Students Served by School Type
GenderRace
# of students
72,241total students served
67,137 students receivingwhole-school supports
92% of case-managed students qualified for free or reduced-price lunch (FRPL)
Elementary School(88 elementary schools)
Middle School(44 middle schools)
High School(31 high schools)
Other K–12 Combinations(6 combined schools)
0 6,000
22,576
27,128
20,427
1,782
12,000 18,000 24,000 30,000
97%were promoted
(K–11)
86%improved
academics
83%improved
attendance
78%graduated or received GED
(grade 12)
10% 8%
31%
28%
21%
49%Male
51%Female
WASHINGTON
Affiliate Office
State Office
1% 1%
5,104case-managed students
An additional 328 students were served at one community-based site.
Amer. Ind. Asian
Black Hispanic White 2+ Races Other

STATE DATA PROFILE
2+ RACESWHITEHISPANICBLACKASIANAMER. IND. OTHER2+ RACESWHITEHISPANICBLACKASIANAMER. IND.OTHER2+ RACESWHITEHISPANICBLACKASIANAMER. IND.
OTHER2+ RACESWHITEHISPANICBLACKASIANAMER. IND. OTHER2+ RACESWHITEHISPANICBLACKASIANAMER. IND. OTHER2+ RACESWHITEHISPANICBLACKASIANAMER. IND.
OTHER2+ RACESWHITEHISPANICBLACKASIANAMER. IND.OTHER2+ RACESWHITEHISPANICBLACKASIANAMER. IND. OTHER2+ RACESWHITEHISPANICBLACKASIANAMER. IND.
OTHER2+ RACESWHITEHISPANICBLACKASIANAMER. IND.OTHER2+ RACESWHITEHISPANICBLACKASIANAMER. IND. OTHER2+ RACESWHITEHISPANICBLACKASIANAMER. IND.
OTHER2+ RACESWHITEHISPANICBLACKASIANAMER. IND.
OTHER2+ RACESWHITEHISPANICBLACKASIANAMER. IND. OTHER2+ RACESWHITEHISPANICBLACKASIANAMER. IND.
OTHER2+ RACESWHITEHISPANICBLACKASIANAMER. IND.OTHER2+ RACESWHITEHISPANICBLACKASIANAMER. IND. OTHER2+ RACESWHITEHISPANICBLACKASIANAMER. IND.
OTHER2+ RACESWHITEHISPANICBLACKASIANAMER. IND.OTHER2+ RACESWHITEHISPANICBLACKASIANAMER. IND. OTHER2+ RACESWHITEHISPANICBLACKASIANAMER. IND.
OTHER2+ RACESWHITEHISPANICBLACKASIANAMER. IND. OTHER2+ RACESWHITEHISPANICBLACKASIANAMER. IND.OTHER2+ RACESWHITEHISPANICBLACKASIANAMER. IND.
OTHER2+ RACESWHITEHISPANICBLACKASIANAMER. IND. OTHER2+ RACESWHITEHISPANICBLACKASIANAMER. IND. OTHER2+ RACESWHITEHISPANICBLACKASIANAMER. IND.
SY 2016 – 2017
Our Reach:
Our Results:**case-managed student outcomes
Students Served by School Type
GenderRace
# of students
1,966total students served
1,624 students receivingwhole-school supports
100% of case-managed students qualified for free or reduced-price lunch (FRPL)
Elementary School(5 elementary schools)
Middle School(2 middle schools)
High School(1 high school)
Other K–12 Combinations
0 2,000
755
370
841
4,000 6,000 8,000 10,000+
87%were promoted
(K–11)
84%improved
academics
85%improved
attendance
100%graduated or received GED
(grade 12)
5% 3%
6%
86%
WEST VIRGINIA
Affiliate Office
51%Male
49%Female
342case-managed students
Black Hispanic White 2+ Races


