6
RESIDENTIAL RESEARCH SHOREDITCH HACKNEY CENTRAL HACKNEY WICK FOCUS ON: HACKNEY AND SURROUNDS 2017

RESIDENTIAL RESEARCH
SHOREDITCH HACKNEY CENTRAL HACKNEY WICK
FOCUS ON: HACKNEY AND SURROUNDS 2017
2
FOCUS ON: HACKNEY AND SURROUNDS 2017
Please refer to the important notice at the end of this report
As one of the host boroughs of the 2012 London Olympics, Hackney has benefited from multi-billion pound investment from Transport for London, the London Legacy Development Corporation (LLDC), Mayor of London and the Government.
The upgrade of the London Overground rail line in 2007, which runs to Liverpool Street and Euston, as well as out towards Stratford, Watford and Richmond, has increased connectivity in Hackney for both businesses and residents.
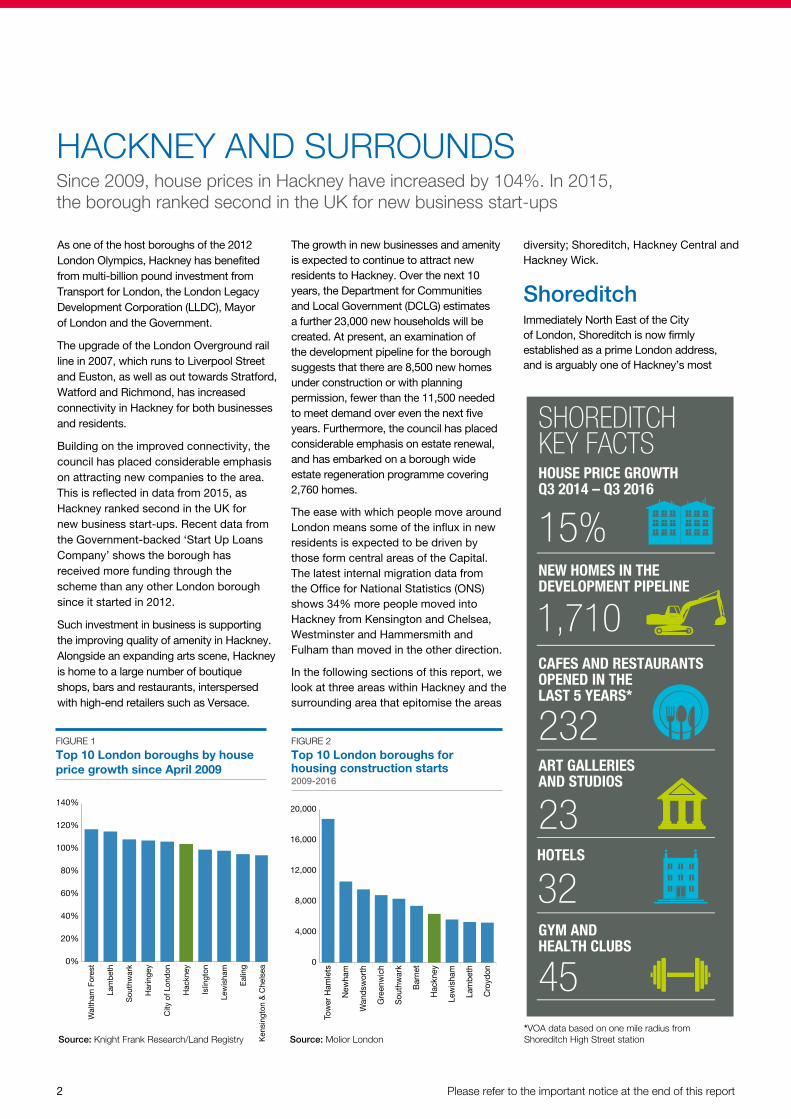
Building on the improved connectivity, the council has placed considerable emphasis on attracting new companies to the area. This is reflected in data from 2015, as Hackney ranked second in the UK for new business start-ups. Recent data from the Government-backed ‘Start Up Loans Company’ shows the borough has received more funding through the scheme than any other London borough since it started in 2012.
Such investment in business is supporting the improving quality of amenity in Hackney. Alongside an expanding arts scene, Hackney is home to a large number of boutique shops, bars and restaurants, interspersed with high-end retailers such as Versace.
The growth in new businesses and amenity is expected to continue to attract new residents to Hackney. Over the next 10 years, the Department for Communities and Local Government (DCLG) estimates a further 23,000 new households will be created. At present, an examination of the development pipeline for the borough suggests that there are 8,500 new homes under construction or with planning permission, fewer than the 11,500 needed to meet demand over even the next five years. Furthermore, the council has placed considerable emphasis on estate renewal, and has embarked on a borough wide estate regeneration programme covering 2,760 homes.
The ease with which people move around London means some of the influx in new residents is expected to be driven by those form central areas of the Capital. The latest internal migration data from the Office for National Statistics (ONS) shows 34% more people moved into Hackney from Kensington and Chelsea, Westminster and Hammersmith and Fulham than moved in the other direction.
In the following sections of this report, we look at three areas within Hackney and the surrounding area that epitomise the areas
HACKNEY AND SURROUNDSSince 2009, house prices in Hackney have increased by 104%. In 2015, the borough ranked second in the UK for new business start-ups
Wal
tham
For
est
Lam
beth
Sou
thw
ark
Har
inge
y
City
of L
ondo
n
Hac
kney
Islin
gton
Lew
isha
m
Eal
ing
Ken
sing
ton
& C
hels
ea
0%
20%
40%
60%
80%
100%
120%
140%
Source: Knight Frank Research/Land Registry
FIGURE 1
Top 10 London boroughs by house price growth since April 2009
Tow
er H
amle
ts
New
ham
Wan
dsw
orth
Gre
enw
ich
Sou
thw
ark
Bar
net
Hac
kney
Lew
isha
m
Lam
beth
Cro
ydon
0
4,000
8,000
12,000
16,000
20,000
Source: Molior London
FIGURE 2
Top 10 London boroughs for housing construction starts 2009-2016
KEY FACTS SHOREDITCH
HOUSE PRICE GROWTH Q3 2014 – Q3 2016
NEW HOMES IN THE DEVELOPMENT PIPELINE
15%
CAFES AND RESTAURANTS OPENED IN THE LAST 5 YEARS*
232ART GALLERIES AND STUDIOS
23HOTELS
32GYM AND HEALTH CLUBS
45
1,710
1
*VOA data based on one mile radius from Shoreditch High Street station
diversity; Shoreditch, Hackney Central and Hackney Wick.
Shoreditch Immediately North East of the City of London, Shoreditch is now firmly established as a prime London address, and is arguably one of Hackney’s most
3
FOCUS ON: HACKNEY AND SURROUNDS 2017 RESIDENTIAL RESEARCH
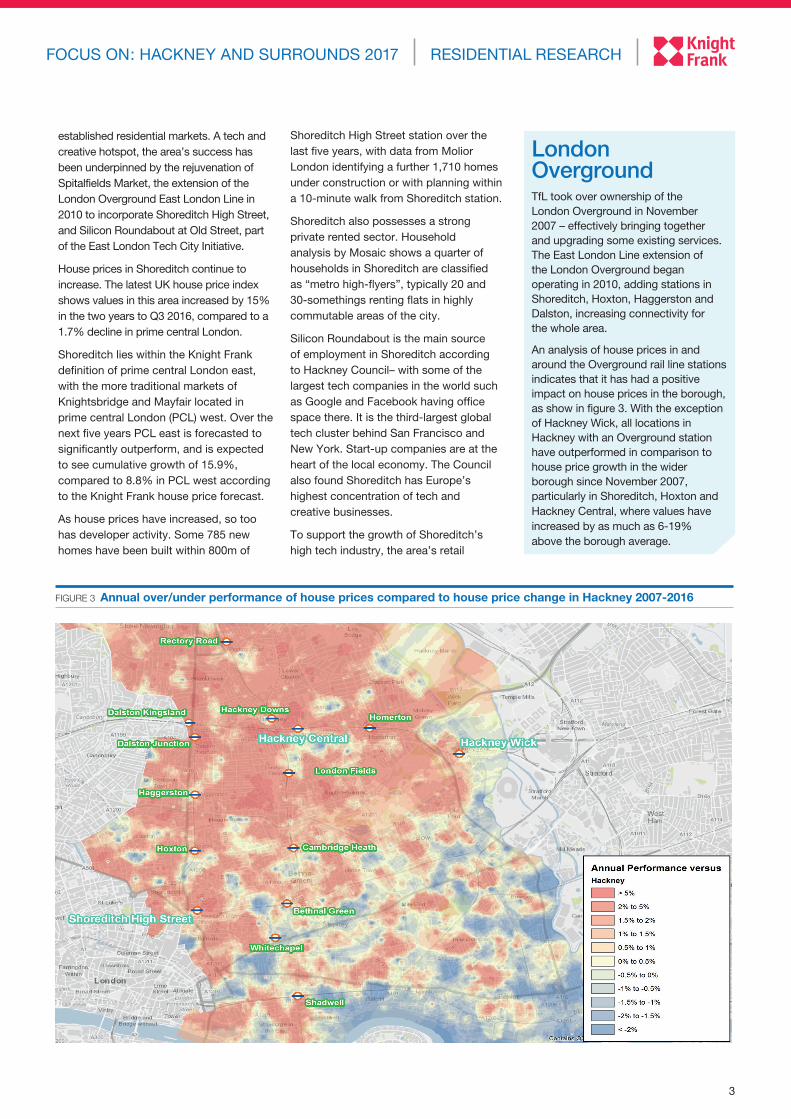
London OvergroundTfL took over ownership of the London Overground in November 2007 – effectively bringing together and upgrading some existing services. The East London Line extension of the London Overground began operating in 2010, adding stations in Shoreditch, Hoxton, Haggerston and Dalston, increasing connectivity for the whole area.
An analysis of house prices in and around the Overground rail line stations indicates that it has had a positive impact on house prices in the borough, as show in figure 3. With the exception of Hackney Wick, all locations in Hackney with an Overground station have outperformed in comparison to house price growth in the wider borough since November 2007, particularly in Shoreditch, Hoxton and Hackney Central, where values have increased by as much as 6-19% above the borough average.
FIGURE 3 Annual over/under performance of house prices compared to house price change in Hackney 2007-2016
established residential markets. A tech and creative hotspot, the area’s success has been underpinned by the rejuvenation of Spitalfields Market, the extension of the London Overground East London Line in 2010 to incorporate Shoreditch High Street, and Silicon Roundabout at Old Street, part of the East London Tech City Initiative.
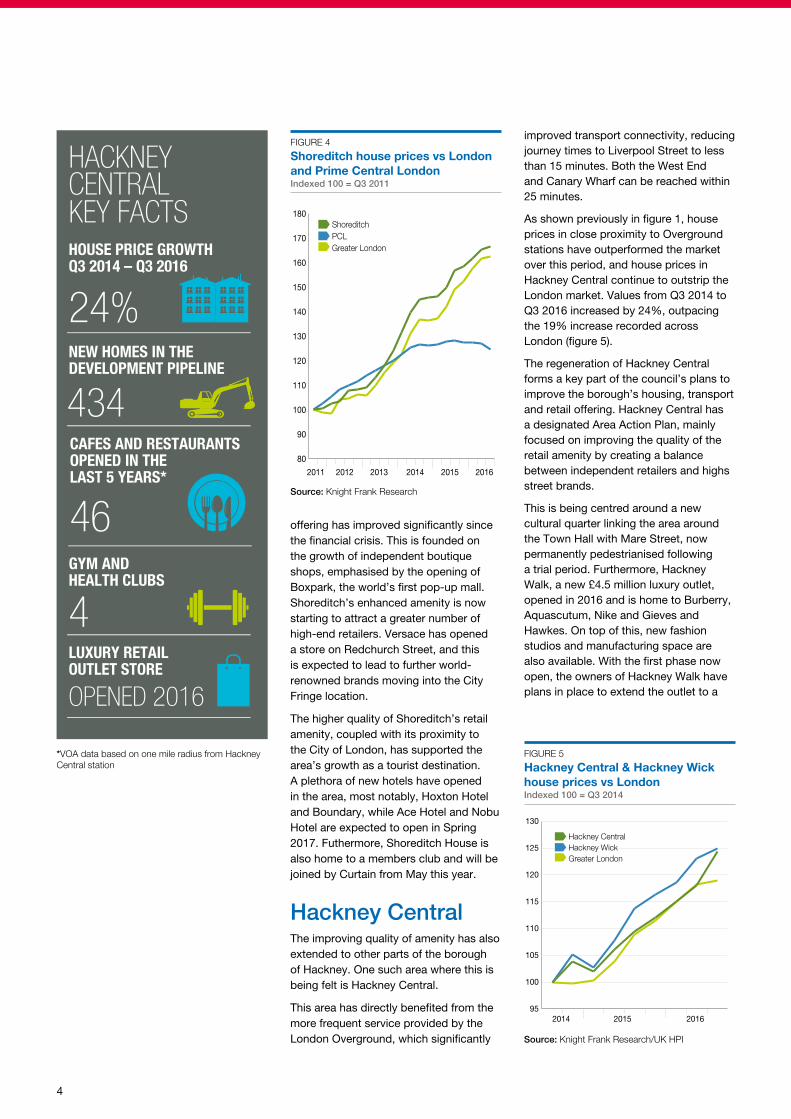
House prices in Shoreditch continue to increase. The latest UK house price index shows values in this area increased by 15% in the two years to Q3 2016, compared to a 1.7% decline in prime central London.
Shoreditch lies within the Knight Frank definition of prime central London east, with the more traditional markets of Knightsbridge and Mayfair located in prime central London (PCL) west. Over the next five years PCL east is forecasted to significantly outperform, and is expected to see cumulative growth of 15.9%, compared to 8.8% in PCL west according to the Knight Frank house price forecast.
As house prices have increased, so too has developer activity. Some 785 new homes have been built within 800m of
Shoreditch High Street station over the last five years, with data from Molior London identifying a further 1,710 homes under construction or with planning within a 10-minute walk from Shoreditch station.
Shoreditch also possesses a strong private rented sector. Household analysis by Mosaic shows a quarter of households in Shoreditch are classified as “metro high-flyers”, typically 20 and 30-somethings renting flats in highly commutable areas of the city.
Silicon Roundabout is the main source of employment in Shoreditch according to Hackney Council– with some of the largest tech companies in the world such as Google and Facebook having office space there. It is the third-largest global tech cluster behind San Francisco and New York. Start-up companies are at the heart of the local economy. The Council also found Shoreditch has Europe’s highest concentration of tech and creative businesses.
To support the growth of Shoreditch’s high tech industry, the area’s retail
4
improved transport connectivity, reducing journey times to Liverpool Street to less than 15 minutes. Both the West End and Canary Wharf can be reached within 25 minutes.
As shown previously in figure 1, house prices in close proximity to Overground stations have outperformed the market over this period, and house prices in Hackney Central continue to outstrip the London market. Values from Q3 2014 to Q3 2016 increased by 24%, outpacing the 19% increase recorded across London (figure 5).
The regeneration of Hackney Central forms a key part of the council’s plans to improve the borough’s housing, transport and retail offering. Hackney Central has a designated Area Action Plan, mainly focused on improving the quality of the retail amenity by creating a balance between independent retailers and highs street brands.
This is being centred around a new cultural quarter linking the area around the Town Hall with Mare Street, now permanently pedestrianised following a trial period. Furthermore, Hackney Walk, a new £4.5 million luxury outlet, opened in 2016 and is home to Burberry, Aquascutum, Nike and Gieves and Hawkes. On top of this, new fashion studios and manufacturing space are also available. With the first phase now open, the owners of Hackney Walk have plans in place to extend the outlet to a
KEY FACTS
HACKNEYCENTRAL
HOUSE PRICE GROWTH Q3 2014 – Q3 2016
NEW HOMES IN THE DEVELOPMENT PIPELINE
24%
GYM AND HEALTH CLUBS
4
OPENED 2016
434
LUXURY RETAIL OUTLET STORE
CAFES AND RESTAURANTS OPENED IN THE LAST 5 YEARS*
46
95
100
105
110
115
120
125
130
2014 2015 2016
Hackney CentralHackney WickGreater London
Source: Knight Frank Research/UK HPI
FIGURE 5
Hackney Central & Hackney Wick house prices vs London Indexed 100 = Q3 2014
80
90
100
110
120
130
140
150
160
170
180
2011 2012 2013 2014 2015 2016
ShoreditchPCLGreater London
Source: Knight Frank Research
FIGURE 4
Shoreditch house prices vs London and Prime Central London Indexed 100 = Q3 2011
offering has improved significantly since the financial crisis. This is founded on the growth of independent boutique shops, emphasised by the opening of Boxpark, the world’s first pop-up mall. Shoreditch’s enhanced amenity is now starting to attract a greater number of high-end retailers. Versace has opened a store on Redchurch Street, and this is expected to lead to further world-renowned brands moving into the City Fringe location.
The higher quality of Shoreditch’s retail amenity, coupled with its proximity to the City of London, has supported the area’s growth as a tourist destination. A plethora of new hotels have opened in the area, most notably, Hoxton Hotel and Boundary, while Ace Hotel and Nobu Hotel are expected to open in Spring 2017. Futhermore, Shoreditch House is also home to a members club and will be joined by Curtain from May this year.
Hackney CentralThe improving quality of amenity has also extended to other parts of the borough of Hackney. One such area where this is being felt is Hackney Central.
This area has directly benefited from the more frequent service provided by the London Overground, which significantly
*VOA data based on one mile radius from Hackney Central station
FOCUS ON: HACKNEY AND SURROUNDS 2017
5
BUILT 2011-2016
UNDERCONSTRUCTION
NOT STARTED
HACKNEY WICKHACKNEY CENTRALSHOREDITCH
41 UNITS646 UNITS785 UNITS
1039 UNITS 80 UNITS 164 UNITS
671 UNITS 354 UNITS 2986 UNITS
KEY FACTS HACKNEY WICK
HOUSE PRICE GROWTH Q3 2014 – Q3 2016
NEW HOMES IN THE DEVELOPMENT PIPELINE
24.9%
GYM AND HEALTH CLUBS
6
3,000 ART GALLERIES AND STUDIOS
38CAFES AND RESTAURANTS OPENED IN THE LAST 5 YEARS*
33
Source: Knight Frank Research/Molior London
FIGURE 6
Housing delivery and pipeline by location (800m from Overground station)
similar size as Bicester Village, a luxury outlet village in Oxfordshire.
As a result of this, Hackney Central is one of the most desirable addresses in the borough. Household analysis from Mosaic shows high earning city workers are renting in the area due to its proximity to central London.
Meanwhile, the area has proved popular with developers, with some 650 new homes built over the last five years within 800m of Hackney Central station, and the development pipeline showing a further 440 new homes with planning permission. Some 40% of these are expected to be affordable units, a sign of the council’s focus on achieving a borough-wide 50% affordable housing target.
Hackney WickHackney Wick is one of the more under-developed parts of Hackney. However, sitting on the edge of the OIympic Park and Lower Lea Valley Opportunity Area, considerable change is anticipated over the next five to ten years.
Over 3,000 new homes within 800m of Hackney Wick station have planning permission, though the majority are yet to
start construction. Tellingly, placemaking is at the heart of many of these developments. On top of the delivery of new homes, retail and commercial space, public squares and parks will also be built to form new communities.
Values in Hackney Wick have increased by 24.9% in the two years to Q3 2016, significantly higher than the borough and Greater London averages.
Like Hackney Central, an Area Action Plan has also been set up for Hackney Wick. While focused on facilitating the growth of cultural and creative industries within Hackney and across East London, establishing a town centre is at the heart of the action plan.
Hackney Wick Hub, with the Overground station as its fulcrum, will include improvement works to the wider public realm, and new space for shops, cafes, restaurants and bars. This will help to cement Hackney Wick’s place as a key access point to the Queen Elizabeth Park.
Due to its proximity to the QE Park, Hackney Wick is already benefiting from investment by the London Legacy Development Corporation (LLDC). With plans to turn the Park into a
business hub, the former media centre has been transformed into Here East; a 1.2 million sq ft complex which is home to BT Sport.
Hackney Wick has the world’s largest number of artists per square metre, according to the LLDC, in charge of developing the Olympic Park and the surrounding area that includes Hackney Wick. The area is one of the leading locations in the capital for the growing live-work space trend. To support the growing arts scene in East London, the LLDC is creating a cultural quarter that can already name the Victoria and Albert Museum, Sadler’s Wells Theatre and The University of Arts London as confirmed tenants. The quarter is expected to be open by 2021.
*VOA data based on one mile radius from Hackney Wick station
FOCUS ON: HACKNEY AND SURROUNDS 2017 RESIDENTIAL RESEARCH

The second half of 2016 was marked by a steady improvement in sales volumes as vendors lowered asking prices to reflect the changed regulatory backdrop in prime central London.
An analysis of sales volumes for this year shows that following a spike in March ahead of a stamp duty hike and fewer transactions in subsequent months as uncertainty around the EU referendum intensified, activity has risen steadily in recent months.
This pattern is in contrast to last year, when there was a pick-up following the May general election, as figure 2 shows.
In respect of the first eleven months of 2016, Knight Frank data shows November accounted for 14.1% of total sales, the second highest month after March. Indeed, the number of Knight Frank sales was higher in November 2016 than the same month in 2014 and 2015.
We observe a similar though less marked uptick in the wider London market, with November accounting for 10.1% of sales recorded on LonRes in the first eleven months of 2016, the
third highest figure after 10.8% in February and 18% in March.
Further analysis shows to what extent transactions have stabilised since the summer. While sales volumes were -38% lower in June compared to 2015, this gap had halved to -19% by November. The equivalent figure compared to 2014 narrowed to -18% from -45% over the same time period.
Whether strengthening sales volumes in the second half of 2016 will provide a reliable indicator for the first six months of 2017 remains to be seen. Political uncertainty is unlikely to subside in the early part of next year as the UK triggers the process to leave the European Union, Donald Trump potentially charts a new economic course in the US and ahead of elections in several European countries.
However, as the 2016 sales volumes data shows, sufficient pent-up demand has formed for buyers to act when they perceive value. Average values fell -6.3% in the year to December 2016, and we expect to see broadly flat price growth in 2017 as declines start to bottom out.
December 2016November was the second highest month for sales volumes in 2016 after a stamp duty spike in March
The number of Knight Frank sales in November was higher than the same month in 2014 and 2015
Year-on-year decline in sales volumes narrowed to -19% in November from -38% in June
Annual growth declined to -6.3% in December
Macro View: The difficulty of assumptions in 2017
“As the 2016 sales volumes data shows, sufficient pent-up demand has formed in the last two years for buyers to act when they perceive value” Follow Tom at @TomBill_KF
For the latest news, views and analysis on the world of prime property, visit Global Briefing or @kfglobalbrief
SALES VOLUMES STRENGTHEN IN NOVEMBER AS ASKING PRICES ADJUSTDespite a backdrop of political uncertainty, sales volumes are rising as lower asking prices release pent-up demand, says Tom Bill
RESIDENTIAL RESEARCH
PRIME CENTRALLONDON SALES INDEX
FIGURE 1 Price growth in prime central London
Source: Knight Frank Research Source: Knight Frank Research
FIGURE 2 Sales volumes increased in late 2016 Percentage of total sales, January to November
2015 2016TOM BILL
Head of London Residential Research
12-month change 6-month change Quarterly change Monthly change
-7%
-6%
-5%
-4%
-3%
-2%
-1%
0%
1%
2%
Dec-
15Ja
n-16
Feb-
16M
ar-1
6Ap
r-16
May
-16
Jun-
16Ju
l-16
Aug-
16Se
p-16
Oct-1
6No
v-16
Dec-
16
0%
5%
10%
15%
20%
25%
Jan
Feb
Mar Apr
May Jun Jul
Aug
Sep
Oct
Nov
RESIDENTIAL RESEARCH
2016 SURVEY RESULTS REGIONAL LENDING ANALYSED BREXIT FOCUS
RESIDENTIAL DEVELOPMENT FINANCE REPORT 2016/2017
The prime central London lettings market in 2016 was marked by high stock levels and falling rental values.
The trend was caused primarily by an uncertain outlook for price growth in the sales market following a series of tax changes, which meant more vendors decided to let their property until greater clarity emerged.
Despite the seasonal slowdown, November 2016 was the first month that marked a reversal of this trend, suggesting rental value declines may be starting to bottom out.
Annual rental value growth last peaked at 4.2% in May 2015, the month of the UK general election, and has been on a downwards trajectory since then.
However, November saw a minor improvement, with rental value growth of -5.1% compared to a figure of -5.2% in October.
Falling rental values coupled with impending tax changes that will affect landlords in 2017 have had a dampening effect on new supply.
The number of new properties placed on the
market in November fell -17% compared to the same month in 2015, which was the first year-on-year decline in 2016. If the rate of new stock continues to slow, there could be a stabilising effect on rental values at the start of 2017.
For now, however, prime central London remains a tenants’ market due to the high levels of stock that came onto the market in 2016, primarily in higher price brackets.
Activity levels remained high as the Christmas holiday period approached. The number of tenancies agreed in November was 34% higher than the same month in 2015, which compared to a rise of 23.6% over the first eleven months of the year (figure 2). The number of viewings rose 17.8% between January and November, while new prospective tenants increased 6.9%.
Furthermore, despite ongoing weaker demand among company executives due to the uncertain global economic backdrop, many markets experienced an uptick in viewings and new prospective tenants ahead of the holiday period among executives who delayed acting until after the US general election.
December 2016Annual rental value growth eased to -5.1% in December
The number of new instructions fell -17% in November, the first decline in 2016
The number of tenancies agreed in November was 34% higher than the same month in 2015
Average prime gross yield was 3.21%
Macro View: The difficulty of assumptions in 2017
“If the rate of new stock continues to slow, there could be a stabilising effect on rental values at the start of 2017”Follow Tom at @TomBill_KF
For the latest news, views and analysis on the world of prime property, visit Global Briefing or @kfglobalbrief
NEW SUPPLY SHOWS SIGNS OF RECEDING IN PRIME CENTRAL LONDON High stock levels continue to put downwards pressure on rental values but the trend is showing early signs of a reversal, says Tom Bill
RESIDENTIAL RESEARCH
PRIME CENTRALLONDON RENTAL INDEX
FIGURE 1 Rental value growth in prime central London
Source: Knight Frank Research
FIGURE 2 New supply falls while demand remains resilient 2016 versus 2015
TOM BILL Head of London Residential Research
12-month change 6-month change Quarterly change Monthly change
New
Prop
ertie
s On
Th
e M
arke
t
Tena
ncies
Ag
reed
New
Pros
pect
ive
Tena
nts
View
ings
24% 23%18%
7%
-17%
34%29%
10%
Source: Knight Frank Research
-6%
-5%
-4%
-3%
-2%
-1%
0%
1%
2%
Dec-
15Ja
n-16
Feb-
16M
ar-1
6Ap
r-16
May
-16
Jun-
16Ju
l-16
Aug-
16Se
p-16
Oct-1
6No
v-16
Dec-
16
Jan-Nov Nov
This report analyses the performance of single-unit rental properties in the second-hand prime central London market between £500 and £5,000-plus per week. For an analysis of the build-to-rent market and the institutional private rented sector in London and the rest of the UK, please see our Private Rented Sector Update report here.
TIMELINE OF TAX CHANGES
REFORMS IN DETAIL
PROPERTY CONSIDERATIONS
Residential Property Tax updateJANUARY 2017
Prime Central London Sales Index - Dec 2016
Residential Development Finance Report - 2016
Prime Central London Rental Index - Dec 2016
UK Tax Update - 2017
Important Notice © Knight Frank LLP 2017 – This report is published for general information only and not to be relied upon in any way. Although high standards have been used in the preparation of the information, analysis, views and projections presented in this report, no responsibility or liability whatsoever can be accepted by Knight Frank LLP for any loss or damage resultant from any use of, reliance on or reference to the contents of this document. As a general report, this material does not necessarily represent the view of Knight Frank LLP in relation to particular properties or projects. Reproduction of this report in whole or in part is not allowed without prior written approval of Knight Frank LLP to the form and content within which it appears. Knight Frank LLP is a limited liability partnership registered in England with registered number OC305934. Our registered office is 55 Baker Street, London, W1U 8AN, where you may look at a list of members’ names.
For the latest news, views and analysison the world of prime property, visit
KnightFrank.com/blog
KNIGHT FRANKINTELLIGENCE
RESIDENTIAL RESEARCH
David RamsdaleSenior Analyst +44 20 3866 8038 [email protected]
Gráinne Gilmore Head of UK Residential Research +44 20 7861 5102 [email protected]
LONDON RESIDENTIAL
Raul Cimesa Partner, City and East Residential Development +44 20 7718 5227 [email protected]
Nick Parr Partner, City & East Residential Development +44 20 7718 5224 [email protected]
Knight Frank Research provides strategic advice, consultancy services and forecasting to a wide range of clients worldwide including developers, investors, funding organisations, corporate institutions and the public sector. All our clients recognise the need for expert independent advice customised to their specific needs.
RECENT MARKET-LEADING RESEARCH PUBLICATIONS
UK Residential Market Update - Jan 2017
UK Private Rented Sector Update - Jan 2017
Economic and housing market overview The celebrations to see in the New Year had barely ended on January 3rd, but the Government was already issuing its second announcement of the year on housing. Its first was to highlight plans for new Garden Villages and Towns, and the second was the release of more detail on Starter Homes – new houses that will be sold at a 20% discount to qualifying first-time buyers. This scheme was first mooted in late 2014, but has yet to start.
RESIDENTIAL RESEARCH
UK RESIDENTIAL MARKET UPDATE
“ The data showing the growth in delivery of new homes in England is positive, and indicates that in the year to March 2017 the important 200,000 units-a-year barrier will be breached.”Follow Gráinne at @ggilmorekf
For the latest news, views and analysis on the world of prime property, visit Global Briefing or @kfglobalbrief
GRÁINNE GILMORE Head of UK Residential Research
HOUSING POLICY TAKES CENTRE STAGE Boosting the supply of housing is a key priority for policymakers, as a result anticipation is building for the Housing White Paper, due for release shortly, to see if the policies it contains can help unlock further housebuilding across the UK.
Key facts Jan 2017Average UK house prices rose by 0.8% in December, taking the annual increase to 4.5% according to data from Nationwide
Average prices in prime central London (PCL) fell by 6.3% in 2016, but with wide variations across sub-markets…
…while activity levels in PCL in November 2016 were higher than that in November 2015 and 2014
Average rents across Great Britain rose by 2.3% in the year to November 2016, rising by 2.4% in England alone
If the Government’s focus on boosting the delivery of new homes had not already been clear, this was a reminder. However, the real meat of the Government’s plans, the Housing White Paper, has yet to make an appearance.
There have been strong hints from the Housing Minister that some of the focus will be on increasing the supply of housing by looking at all forms of tenure, by encouraging new forms of development – such as modular building – and support for small and medium-sized developers.
The data on the delivery of new homes is positive – the most recent estimates of net supply of housing in England in the year
to the end of March 2016 was 189,650 – indicating that in the year to March 2017 the important 200,000 units-a-year barrier will be breached. Yet some estimate that we need many more houses every year than this – the Lords Economic Affairs Committee put the figure at 300,000.
But creating new homes where they are needed in the country is a complex task, with hurdles for developers in accessing land, some parts of the planning system and the increasing issue of affordability in some locations.
Household sentiment is also a key issue, and the performance of the UK economy has a bearing on this. In this regard, the UK economy performed better than many expected last year, and the IMF has just revised up its forecasts for growth this year. New data shows inflation starting to creep up. This will put a renewed focus on base rates, although the likelihood of the Bank of England making a sudden move is slim. For those who can access the housing market, mortgage rates remain near record lows.
Net additional dwellings, England
Source: Knight Frank Research/DCLG
0
50,000
100,000
150,000
200,000
250,000
2015
-16
2014
-15
2013
-14
2012
-13
2011
-12
2010
-11
2009
-10
2008
-09
2007
-08
2006
-07
Housing Transactions: UK
Source: Knight Frank Research/HMRC •estimate
0
200,000
400,000
600,000
800,000
1,000,000
1,200,000
1,400,000
1,600,000
1,800,000
2016
*
2015
2014
2013
2012
2011
2010
2009
2008
2007
2006
Initial data suggests that transaction levels remained fairly steady last year across the UK, although some parts of the market have been affected by successive stamp duty changes.
Sector Q1 2015 Q2 2015 Q3 2015 Q4 2015 Q1 2016 Q2 2016 Q3 2016 Q4 2016 Market SentimentLondon - Zone 1 (gross yields reported)Prime Central London (GIY)* 2.50% 2.50% 2.50% 2.50% 2.75% 2.75% 2.75%-3.00% 2.75%-3.00% STABLEZone 1 Prime (GIY) (Outside PCL)* 3.75% 3.50% 3.50% 3.50% 3.50% 3.50% 3.50%-3.75% 3.50%-3.75% STABLE
London and South EastZone 2 Prime (NIY) 3.75% 4.00% 4.00% 4.00% 4.00% 3.50%-3.75% 3.50%-3.75% 3.50%-3.75% STABLEZones 3-4 Prime (NIY) 3.75%-4.00% 3.75%-4.00% 3.75%-4.00% 3.75%-4.00% 3.75%-4.00% 3.75% 3.75% 3.75% STABLEGreater London Prime (NIY) 4.25% 4.00% 4.00% 4.00% 4.00% 4.00% 4.00% 4.00% POSITIVESouth East Prime (NIY) 4.50% 4.25% 4.25% 4.25% 4.25% 4.25% 4.25% 4.25% POSITIVE
Prime Regional CitiesPrime assets 4.25%-4.50% 4.25%-4.50% 4.25%-4.50% 4.25%-4.50% 4.25% 4.25% 4.25% 4.00-4.25% STABLEBirmingham (NIY) (prime assets) 4.75% 4.50% 4.50% 4.50% 4.50% 4.50% 4.25% 4.25% STABLEBristol (NIY) (prime assets) 4.25%-4.50% 4.25%-4.50% 4.25%-4.50% 4.25%-4.50% 4.25% 4.25% 4.25% 4.00-4.25% STABLELeeds (NIY) (prime assets) 5.25% 5.00%-5.25% 5.00%-5.25% 5.00%-5.25% 5.00% 5.00% 4.75%-5.00% 4.50-4.75% POSITIVEManchester (NIY) (prime assets) 4.75% 4.50% 4.50% 4.50% 4.25%-4.50% 4.25% 4.25% 4.25% STABLE
Secondary Regional CitiesPrime assets 5.50%-6.00% 5.50%-6.00% 5.25%-5.75% 5.25%-5.75% 5.00%-5.50% 5.00%-5.50% 5.00%-5.50% 5.00%-5.50% POSITIVE
Ground Rents10 Year RPI Uplifts 2.75% 2.75% 2.75% 2.75% 2.50% 2.50% 2.50% 2.50% STABLE25 Year Doubling Reviews 3.25% 3.25% 3.25% 3.25% 3.25% 3.25% 3.25% 3.25% STABLE
Bonds & RatesLibor 3 mth 0.56% 0.57% 0.58% 0.57% 0.59% 0.59% 0.38% 0.38%Base rate 0.50% 0.50% 0.50% 0.50% 0.50% 0.50% 0.25% 0.25%5 year swap rates 1.57% 1.54% 1.56% 1.47% 1.00% 0.95% 0.49% 0.95%10 yr gilts redemption yield 1.92% 2.04% 1.92% 1.91% 1.46% 1.39% 0.70% 1.44%
KnightFrank.co.uk
Based on rack rented properties and disregards bond type transactions.NIY - Where reported we have assumed an appropriate discount for operating costs.This yield guide is for indicative purposes only and was prepared on 18 January 2017.*Our PCL yield is based on tenanted blocks with a minimum of 6 units, covering locations such as Mayfair, Knightsbridge, Kensington etc, situated within Knight Frank's definition of Prime Central London. Yields in the PCL and Zone 1 Prime categories are reported gross in line with market practice and no allowance has been made for operating costs within this yield guide.Yields in the London and South East categories are reflective of income-focused transactions of institutional assets.Regional locations: We have provided an indication of yields in respect of a number of example locations, illustrating the spread of yields in this classification. These yields are reported in respect of institutional quality, stabilised assets.
Knight Frank Research Reports are available at KnightFrank.com/Research
UK Housing Market Forecast - Nov 2016
The Southbank Review - 2017
RESIDENTIAL RESEARCH
UK RESIDENTIAL MARKET FORECAST
“ The UK housing market has so far outperformed expectations following the referendum, however, price growth is expected to moderate next year as economic uncertainty and tax reforms impact on consumer confidence.”
For the latest news, views and analysis on the world of prime property, visit Global Briefing or @kfglobalbrief
SUBDUED OUTLOOK FOR PRICE GROWTHWhile the UK economy and housing market have held up far better than expected following the Brexit vote, the outlook for both remains uncertain.
Headlines November 2016Both the London and wider UK housing markets have outperformed expectations following the EU Referendum
Price growth in 2017 is expected to be notably slower than this year, in all regions
However, the fundamentals of the UK housing market remain largely unchanged
Between 2017 and 2021 UK house prices are forecast to rise by 14.2% cumulatively
Knight Frank Residential Market Forecasts
2016
2017
2018
2019
2020
2021
2017-2021Mainstream residential sales markets
UK 5.0% 1.0% 2.5% 3.0% 3.0% 4.0% 14.2%London 7.0% -1.0% 2.0% 2.5% 3.0% 5.5% 12.5%North East 0.0% 0.5% 2.5% 2.5% 2.0% 1.5% 9.3%North West 4.0% 0.5% 2.0% 2.5% 3.0% 2.0% 10.4%Yorks & Humber 3.5% 1.0% 3.0% 3.5% 3.0% 2.0% 13.1%
East Midlands 5.5% 1.5% 3.0% 3.5% 4.0% 4.5% 17.6%West Midlands 4.5% 1.5% 3.0% 4.0% 4.0% 4.0% 17.6%East 7.5% 1.5% 2.5% 4.0% 3.5% 5.5% 18.1%South East 8.0% 1.0% 2.0% 4.0% 4.0% 5.0% 17.0%South West 4.5% 2.0% 2.0% 3.5% 3.5% 4.5% 16.5%Wales -0.5% 0.0% 2.0% 2.5% 2.0% 2.0% 8.8%Scotland 2.0% 0.1% 2.3% 2.7% 2.8% 2.8% 11.0%
Prime residential sales markets
Prime Central London East* 1.0% 1.0% 3.5% 3.0% 3.5% 4.0% 15.9%
Prime Central London West** -7.0% 0.0% 1.0% 1.5% 3.0% 3.0% 8.8%
Prime Outer London -1.5% -1.5% 2.5% 3.0% 3.0% 4.0% 11.4%
Residential rental markets
UK 1.2% 1.4% 2.0% 2.0% 2.0% 2.0% 9.8%
Prime Central London East* -2.5% 0.0% 2.0% 3.5% 3.0% 3.0% 12.0%
Prime Central London West** -6.5% -2.0% 1.0% 2.0% 2.0% 2.0% 5.0%
Prime Outer London 1.5% 2.0% 3.0% 3.5% 3.0% 3.0% 15.4%
Both the London and wider UK housing markets outperformed expectations following the referendum. After a sharp dip in confidence just after the vote, conditions have improved into the autumn. On most measures the mainstream UK market continues to perform strongly – with annual price growth likely to end this year at 5%.
Most regional markets have seen positive growth, the exception being Wales. The ripple of price growth from London continued in 2016 and we expect the end of year position to be that the East of England and the South East will both see stronger growth than that in Greater London.
Looking into next year we believe that the slowdown in prices which has been evident in central London over the past 12-months will spread to the wider region, with Greater London prices down marginally in 2017. This slowdown in the capital will likely be experienced across the rest of the country with price growth down notably on 2016 levels.
The main drivers for weaker market performance relate to economic uncertainty surrounding the Brexit process, which we believe will impact negatively on consumer confidence in the run up to and just after the serving of the formal “notice to quit” the EU. In addition the impact of reforms to the taxation of landlords will reduce demand from
investors which will limit upwards pressure on prices.
Looking at the prime London market, we believe that a 7% fall in prices across the western part of central London in 2016 means that we are close to the bottom in terms of price adjustment in this market. Although there could be some further adjustment downwards in prime outer London markets through 2017.
For rental markets – it has been a mixed year for landlords in central London, demand from tenants has been strong, but this has been offset by a strong supply of rental properties. In our view there is a risk of further rental falls next year but not on the scale of the adjustments seen this year. The wider UK rental market looks relatively positive with modest rental growth expected. Rents could rise further if landlords begin to sell properties in an effort to offset to the impact of tax rises.
Source: Knight Frank Research *City & Fringe, Islington, Tower Bridge, King’s Cross and Riverside**Notting Hill, Kensington, South Kensington, Chelsea, Knightsbridge, Belgravia, Hyde Park, Marylebone, Mayfair, St John’s Wood
RESIDENTIAL RESEARCH
DEVELOPMENT PIPELINE PRICE PERFORMANCE ANALYSIS INVESTMENT POTENTIAL
FOCUS ON: SOUTHBANK 2016
ENFIELD
HARINGEY
HACKNEY
TOWERHAMLETS
BARNET
CAMDEN
HARROW
HILLINGDON
BARKING &DAGENHAM
HAVERING
WALTHAMFOREST
NEWHAMEALING
BRENT
HOUNSLOW
RICHMOND-UPON-THAMES
WANDSWORTH
MERTON
SUTTON CROYDON
BROMLEY
BEXLEY
GREENWICH
LEWISHAM
SOU
THW
ARK
ISLING
TON
LAMB
ETH
KINGSTON-UPON-THAMES
HF
KC
CW CL
REDBRIDGE
FIGURE 8London boroughs’ housing supply: % of total delivery 2016-2025
Source: Knight Frank Research / Molior London
ENFIELD
HARINGEY
HACKNEY
TOWERHAMLETS
BARNET
CAMDEN
HARROW
HILLINGDON
BARKING &DAGENHAM
HAVERING
WALTHAMFOREST
NEWHAMEALING
BRENT
HOUNSLOW
RICHMOND-UPON-THAMES
WANDSWORTH
MERTON
SUTTON CROYDON
BROMLEY
0% - 1%
5% - 6%
10% - 11%
BEXLEY
GREENWICH
LEWISHAM
SOU
THW
ARK
ISLING
TON
LAMB
ETH
KINGSTON-UPON-THAMES
HF
KC
CW CL
REDBRIDGE
HF
KC
CW
CL
Hammersmith & Fulham
Kensington & Chelsea
City of Westminster
City of London
KEY FACTS
HACKNEYCENTRAL
HOUSE PRICE GROWTH Q3 2014 – Q3 2016
NEW HOMES IN THE DEVELOPMENT PIPELINE
24%
GYM AND HEALTH CLUBS
4
OPENED 2016
434
LUXURY RETAIL OUTLET STORE
CAFES AND RESTAURANTS OPENED IN THE LAST 5 YEARS*
46
HF
KC
CW
CL
Hammersmith & Fulham
Kensington & Chelsea
City of Westminster
City of London
FIGURE 7
Hackney and surrounding area
Source: Knight Frank Research


![Descendants of Joseph Hackney · Descendants of Joseph Hackney 1 Joseph Hackney 1651 ... [58] Davie Adeline Edwards 1874 ... John Franklin Estes 1920 ...](https://static.documents.pub/doc/80x56/5b09b9617f8b9a992a8e276e/descendants-of-joseph-of-joseph-hackney-1-joseph-hackney-1651-58-davie-adeline.jpg)


