This presentation, including any supporting materials, is owned by Gartner, Inc. and/or its affiliates and is for the sole use of the intended Gartner audience or other intended recipients. This presentation may contain information that is confidential, proprietary or otherwise legally protected, and it may not be further copied, distributed or publicly displayed without the express written permission of Gartner, Inc. or its affiliates. © 2015 Gartner, Inc. and/or its affiliates. All rights reserved.
Focus on These Six Key Financial Metrics to Help Determine Vendor Viability
Gary Spivak
Gartner Data Center, Infrastructure & Operations Management Conference
7–10 December 2015 | Las Vegas, NV
1 © 2015 Gartner, Inc. and/or its affiliates. All rights reserved.
Would You Trust This Vendor?
Would You TrustThis Vendor?
But What If They Looked Like This?
Should I trust
this guy?
2 © 2015 Gartner, Inc. and/or its affiliates. All rights reserved.
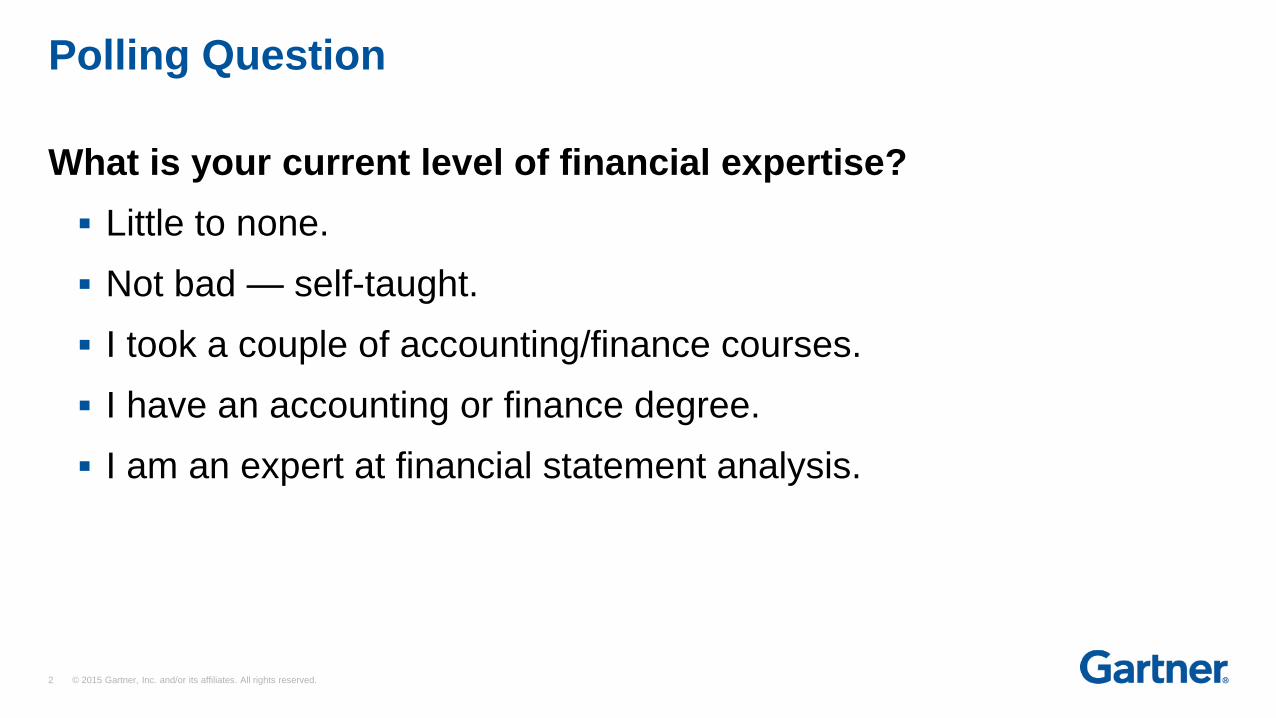
What is your current level of financial expertise?
Little to none.
Not bad — self-taught.
I took a couple of accounting/finance courses.
I have an accounting or finance degree.
I am an expert at financial statement analysis.
Polling Question
3 © 2015 Gartner, Inc. and/or its affiliates. All rights reserved.
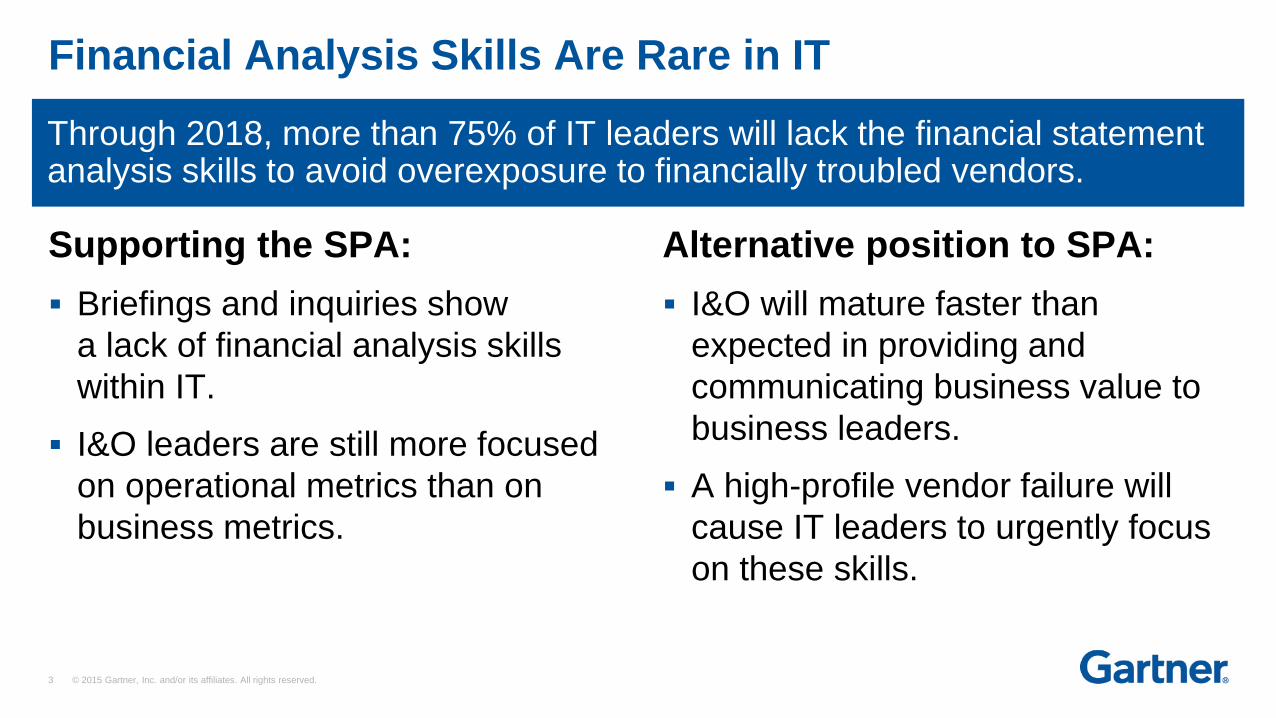
Through 2018, more than 75% of IT leaders will lack the financial statement analysis skills to avoid overexposure to financially troubled vendors.
Financial Analysis Skills Are Rare in IT
Supporting the SPA:
Briefings and inquiries show
a lack of financial analysis skills
within IT.
I&O leaders are still more focused
on operational metrics than on
business metrics.
Alternative position to SPA:
I&O will mature faster than
expected in providing and
communicating business value to
business leaders.
A high-profile vendor failure will
cause IT leaders to urgently focus
on these skills.
4 © 2015 Gartner, Inc. and/or its affiliates. All rights reserved.
Key Issues
1. Why should you care about the financial status of strategic vendors?
2. What are the most critical ratios and metrics to use in advanced
vendor financial statement analysis?
5 © 2015 Gartner, Inc. and/or its affiliates. All rights reserved.
Key Issues
1. Why should you care about the financial status of strategic vendors?
2. What are the most critical ratios and metrics to use in advanced
vendor financial statement analysis?
6 © 2015 Gartner, Inc. and/or its affiliates. All rights reserved.
You Need Credible, Viable Solutions!
30+ Years
7 © 2015 Gartner, Inc. and/or its affiliates. All rights reserved.
Supplied by MANY Vendors
8 © 2015 Gartner, Inc. and/or its affiliates. All rights reserved.
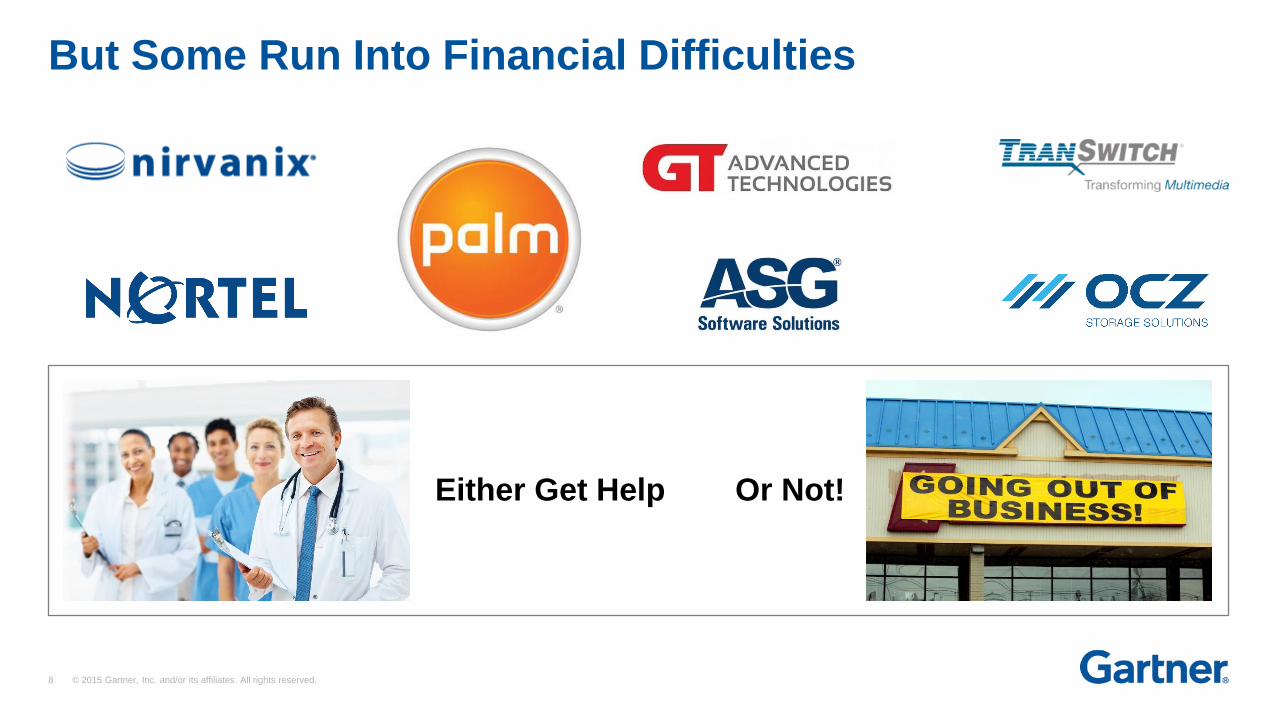
But Some Run Into Financial Difficulties
Or Not!Either Get Help
9 © 2015 Gartner, Inc. and/or its affiliates. All rights reserved.
How often are your strategic vendors evaluated on their
ability to remain viable?
Never.
Once a year.
Every two or three years.
Before every contract renewal.
Don't know.
Polling Question
10 © 2015 Gartner, Inc. and/or its affiliates. All rights reserved.
Key Issues
1. Why should you care about the financial status of strategic vendors?
2. What are the most critical ratios and metrics to use in advanced
vendor financial statement analysis?
11 © 2015 Gartner, Inc. and/or its affiliates. All rights reserved.
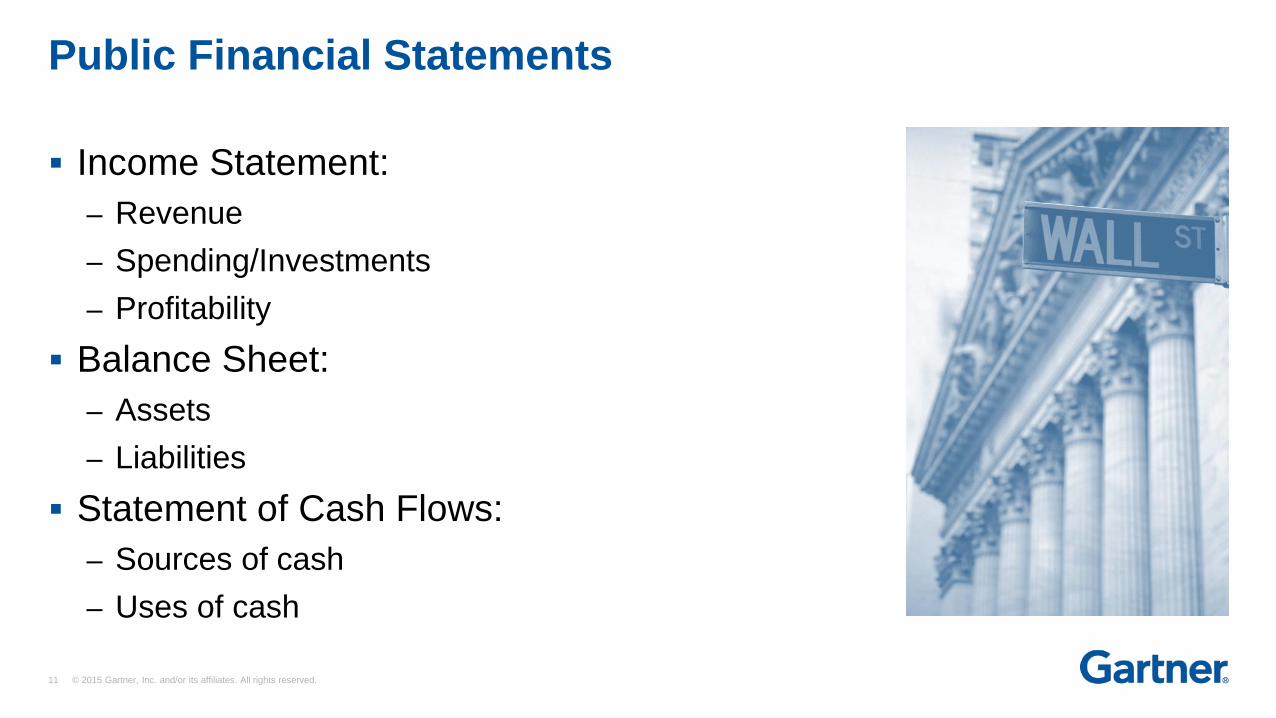
Income Statement:
– Revenue
– Spending/Investments
– Profitability
Balance Sheet:
– Assets
– Liabilities
Statement of Cash Flows:
– Sources of cash
– Uses of cash
Public Financial Statements
12 © 2015 Gartner, Inc. and/or its affiliates. All rights reserved.
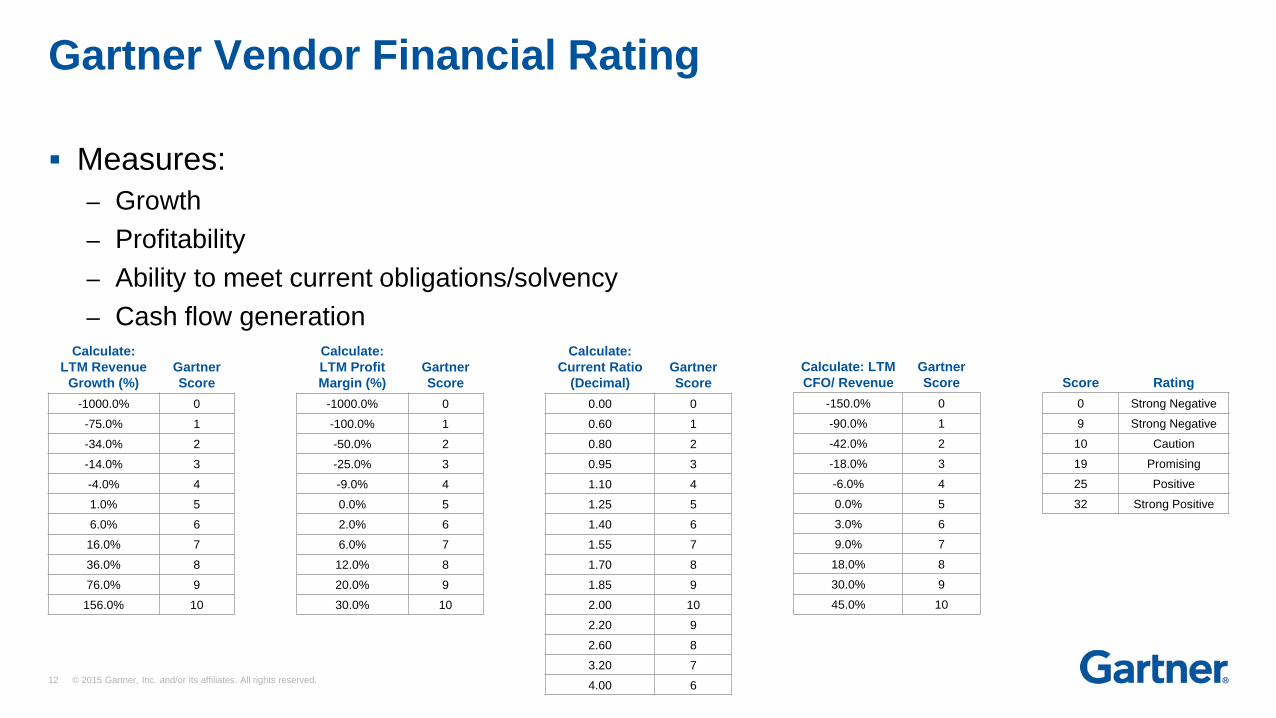
Measures:
– Growth
– Profitability
– Ability to meet current obligations/solvency
– Cash flow generation
Gartner Vendor Financial Rating
Calculate:
LTM Revenue
Growth (%)
Gartner
Score
-1000.0% 0
-75.0% 1
-34.0% 2
-14.0% 3
-4.0% 4
1.0% 5
6.0% 6
16.0% 7
36.0% 8
76.0% 9
156.0% 10
Calculate:
LTM Profit
Margin (%)
Gartner
Score
-1000.0% 0
-100.0% 1
-50.0% 2
-25.0% 3
-9.0% 4
0.0% 5
2.0% 6
6.0% 7
12.0% 8
20.0% 9
30.0% 10
Calculate:
Current Ratio
(Decimal)
Gartner
Score
0.00 0
0.60 1
0.80 2
0.95 3
1.10 4
1.25 5
1.40 6
1.55 7
1.70 8
1.85 9
2.00 10
2.20 9
2.60 8
3.20 7
4.00 6
Calculate: LTM
CFO/ Revenue
Gartner
Score
-150.0% 0
-90.0% 1
-42.0% 2
-18.0% 3
-6.0% 4
0.0% 5
3.0% 6
9.0% 7
18.0% 8
30.0% 9
45.0% 10
Score Rating
0 Strong Negative
9 Strong Negative
10 Caution
19 Promising
25 Positive
32 Strong Positive
13 © 2015 Gartner, Inc. and/or its affiliates. All rights reserved.
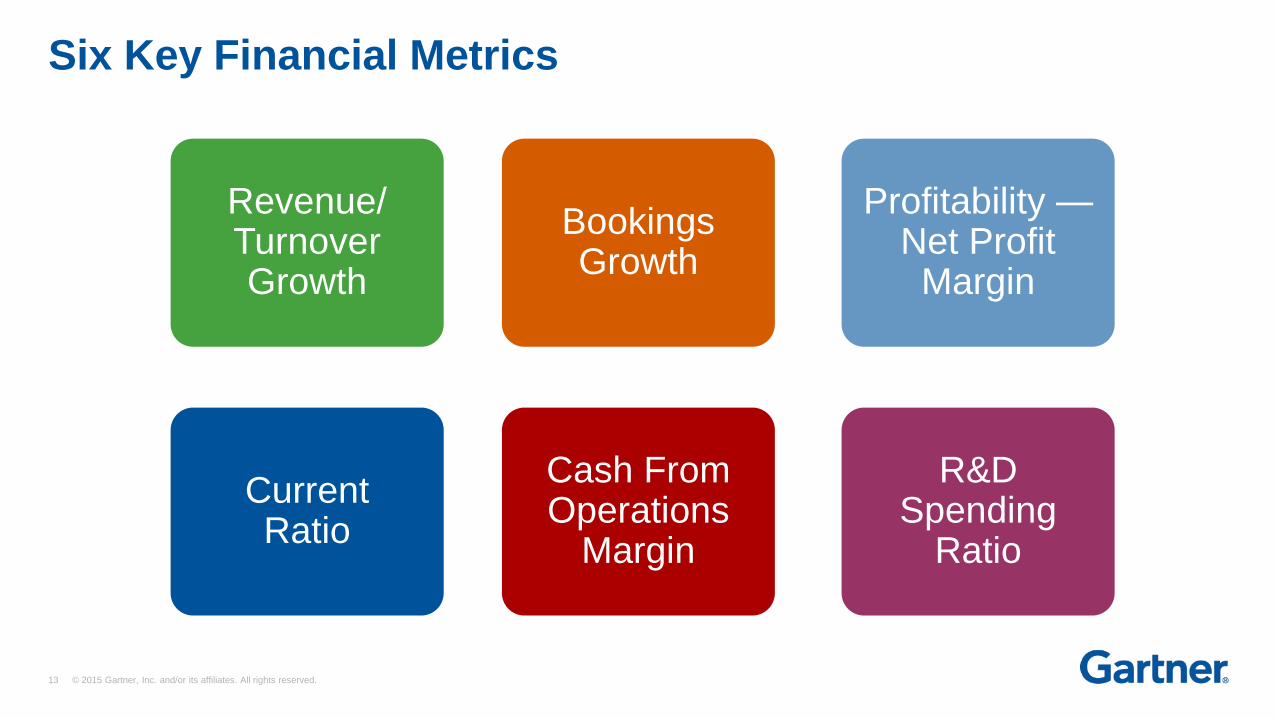
Six Key Financial Metrics
Revenue/TurnoverGrowth
Bookings Growth
Profitability —Net Profit
Margin
CurrentRatio
Cash From Operations
Margin
R&DSpending
Ratio
14 © 2015 Gartner, Inc. and/or its affiliates. All rights reserved.
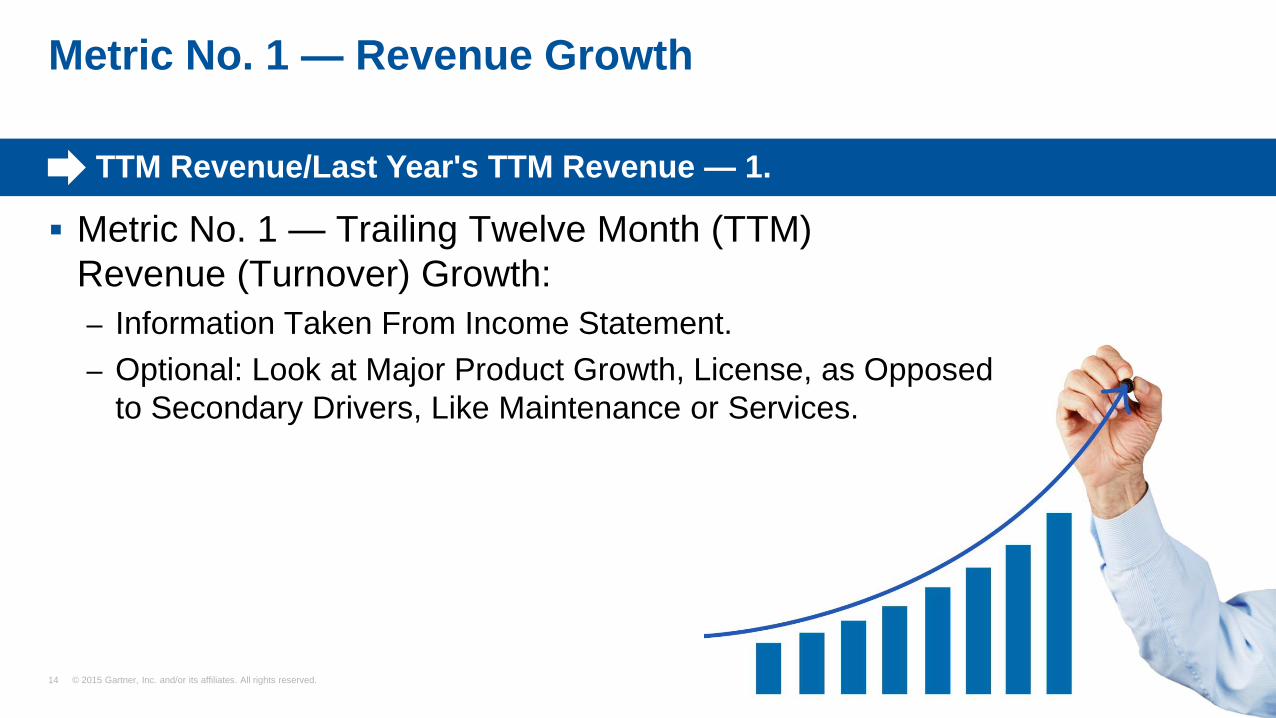
Metric No. 1 — Trailing Twelve Month (TTM)
Revenue (Turnover) Growth:
– Information Taken From Income Statement.
– Optional: Look at Major Product Growth, License, as Opposed
to Secondary Drivers, Like Maintenance or Services.
Metric No. 1 — Revenue Growth
TTM Revenue/Last Year's TTM Revenue — 1.
15 © 2015 Gartner, Inc. and/or its affiliates. All rights reserved.
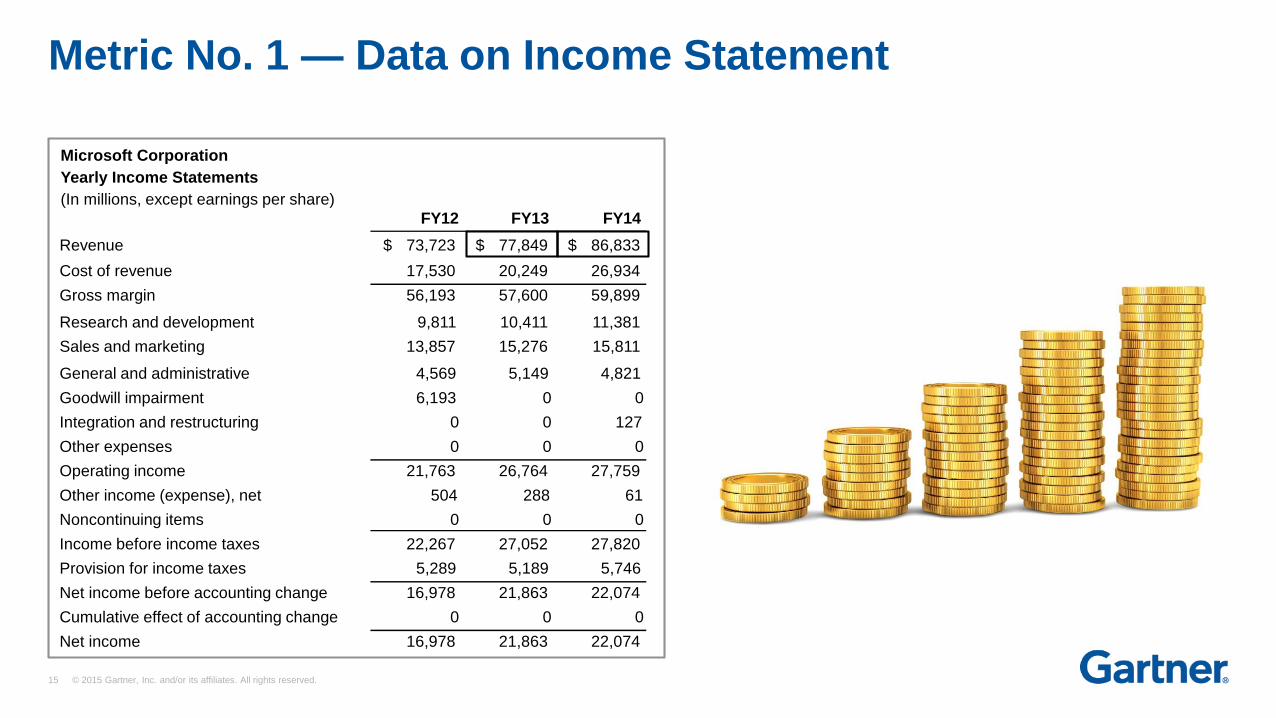
Metric No. 1 — Data on Income Statement
Microsoft Corporation
Yearly Income Statements
(In millions, except earnings per share)
FY12 FY13 FY14
Revenue 73,723$ 77,849$ 86,833$
Cost of revenue 17,530 20,249 26,934
Gross margin 56,193 57,600 59,899
Research and development 9,811 10,411 11,381
Sales and marketing 13,857 15,276 15,811
General and administrative 4,569 5,149 4,821
Goodwill impairment 6,193 0 0
Integration and restructuring 0 0 127
Other expenses 0 0 0
Operating income 21,763 26,764 27,759
Other income (expense), net 504 288 61
Noncontinuing items 0 0 0
Income before income taxes 22,267 27,052 27,820
Provision for income taxes 5,289 5,189 5,746
Net income before accounting change 16,978 21,863 22,074
Cumulative effect of accounting change 0 0 0
Net income 16,978 21,863 22,074
16 © 2015 Gartner, Inc. and/or its affiliates. All rights reserved.
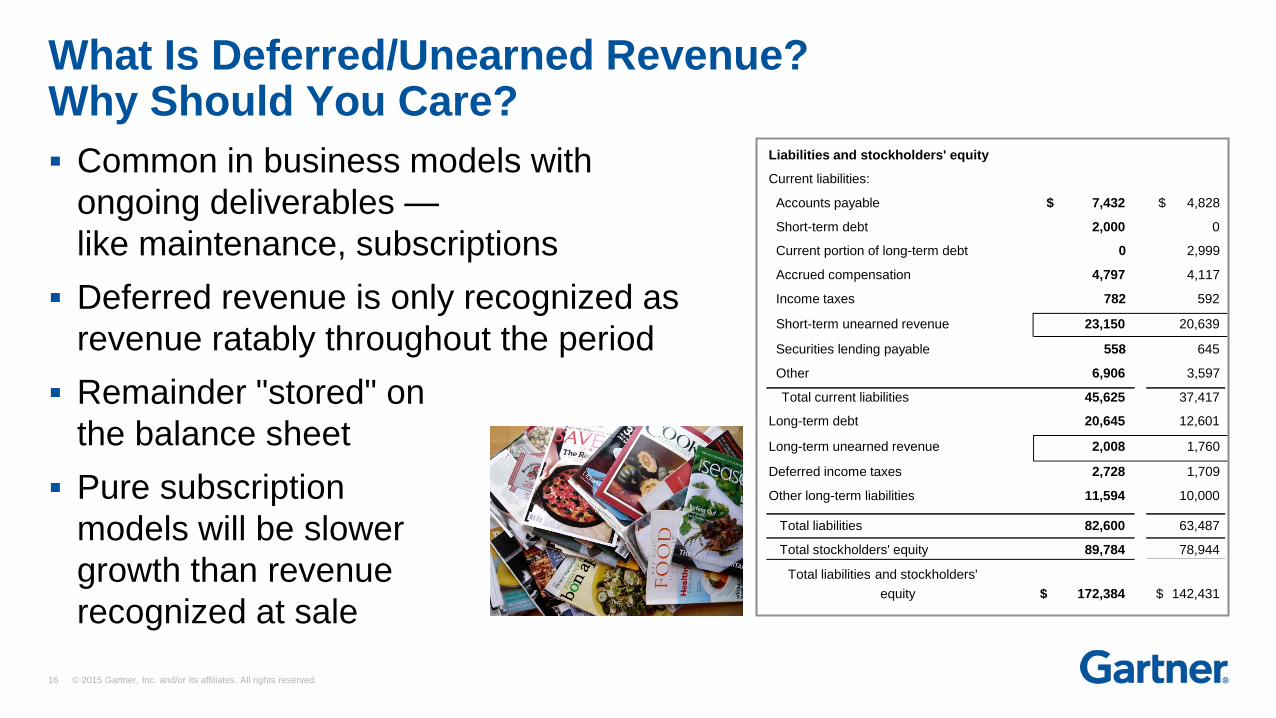
Common in business models with
ongoing deliverables —
like maintenance, subscriptions
Deferred revenue is only recognized as
revenue ratably throughout the period
Remainder "stored" on
the balance sheet
Pure subscription
models will be slower
growth than revenue
recognized at sale
What Is Deferred/Unearned Revenue?Why Should You Care?
Liabilities and stockholders' equity
Current liabilities:
Accounts payable 7,432$ 4,828$
Short-term debt 2,000 0
Current portion of long-term debt 0 2,999
Accrued compensation 4,797 4,117
Income taxes 782 592
Short-term unearned revenue 23,150 20,639
Securities lending payable 558 645
Other 6,906 3,597
Total current liabilities 45,625 37,417
Long-term debt 20,645 12,601
Long-term unearned revenue 2,008 1,760
Deferred income taxes 2,728 1,709
Other long-term liabilities 11,594 10,000
Total liabilities 82,600 63,487
Total stockholders' equity 89,784 78,944
Total liabilities and stockholders'
equity 172,384$ 142,431$
17 © 2015 Gartner, Inc. and/or its affiliates. All rights reserved.
Bookings is nonstandard — it is not defined the same way by
every company.
Bookings = Revenue + change in deferred revenue.
Metric No. 2 — "Bookings" Growth
Bookings growth = (TTM bookings)/(the year ago TTM bookings) — 1
18 © 2015 Gartner, Inc. and/or its affiliates. All rights reserved.
Why Is Profitability Important?
19 © 2015 Gartner, Inc. and/or its affiliates. All rights reserved.
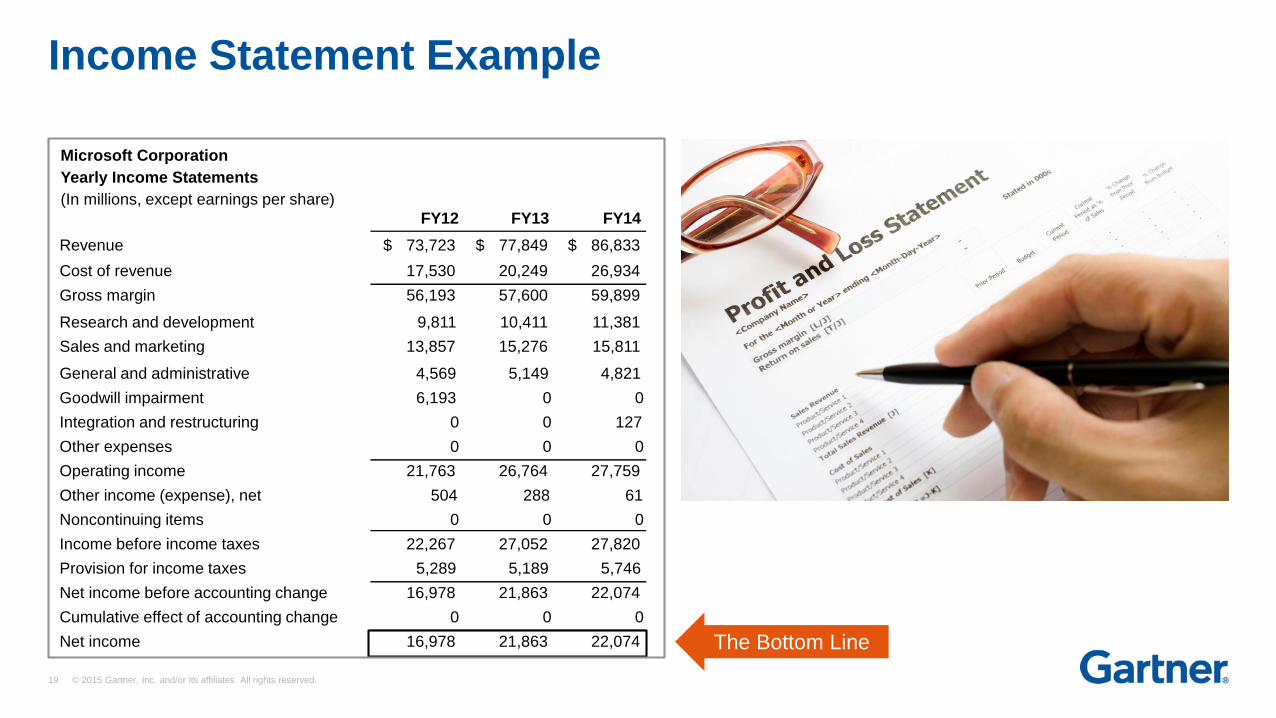
Income Statement Example
The Bottom Line
Microsoft Corporation
Yearly Income Statements
(In millions, except earnings per share)
FY12 FY13 FY14
Revenue 73,723$ 77,849$ 86,833$
Cost of revenue 17,530 20,249 26,934
Gross margin 56,193 57,600 59,899
Research and development 9,811 10,411 11,381
Sales and marketing 13,857 15,276 15,811
General and administrative 4,569 5,149 4,821
Goodwill impairment 6,193 0 0
Integration and restructuring 0 0 127
Other expenses 0 0 0
Operating income 21,763 26,764 27,759
Other income (expense), net 504 288 61
Noncontinuing items 0 0 0
Income before income taxes 22,267 27,052 27,820
Provision for income taxes 5,289 5,189 5,746
Net income before accounting change 16,978 21,863 22,074
Cumulative effect of accounting change 0 0 0
Net income 16,978 21,863 22,074
20 © 2015 Gartner, Inc. and/or its affiliates. All rights reserved.
Revenue Growth Is Important —
but Ultimately, MUST HAVE Profitability.
Displays the Ability to Generate
Shareholder Value From the Business.
Measures:
– Gross Margin.
– Operating Margin.
– Net Profit Margin = THE BOTTOM LINE!
Measurements of Profitability
21 © 2015 Gartner, Inc. and/or its affiliates. All rights reserved.
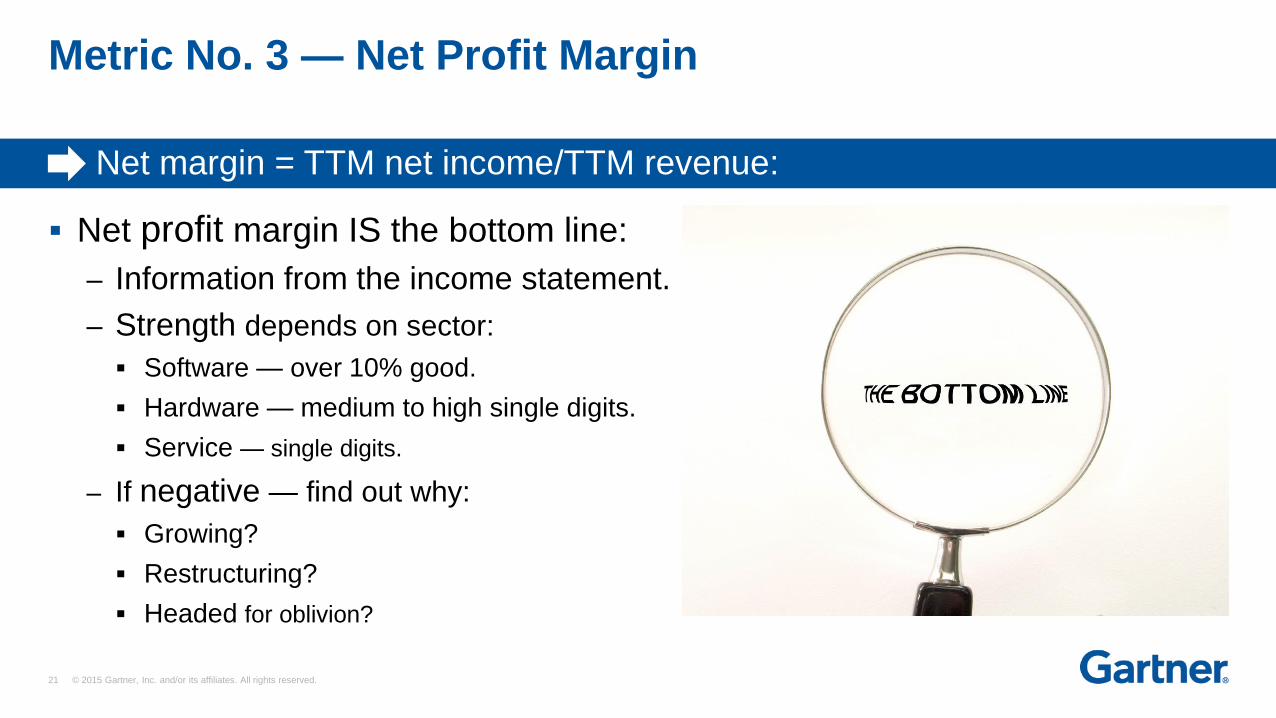
Metric No. 3 — Net Profit Margin
Net margin = TTM net income/TTM revenue:
Net profit margin IS the bottom line:
– Information from the income statement.
– Strength depends on sector:
Software — over 10% good.
Hardware — medium to high single digits.
Service — single digits.
– If negative — find out why:
Growing?
Restructuring?
Headed for oblivion?
22 © 2015 Gartner, Inc. and/or its affiliates. All rights reserved.
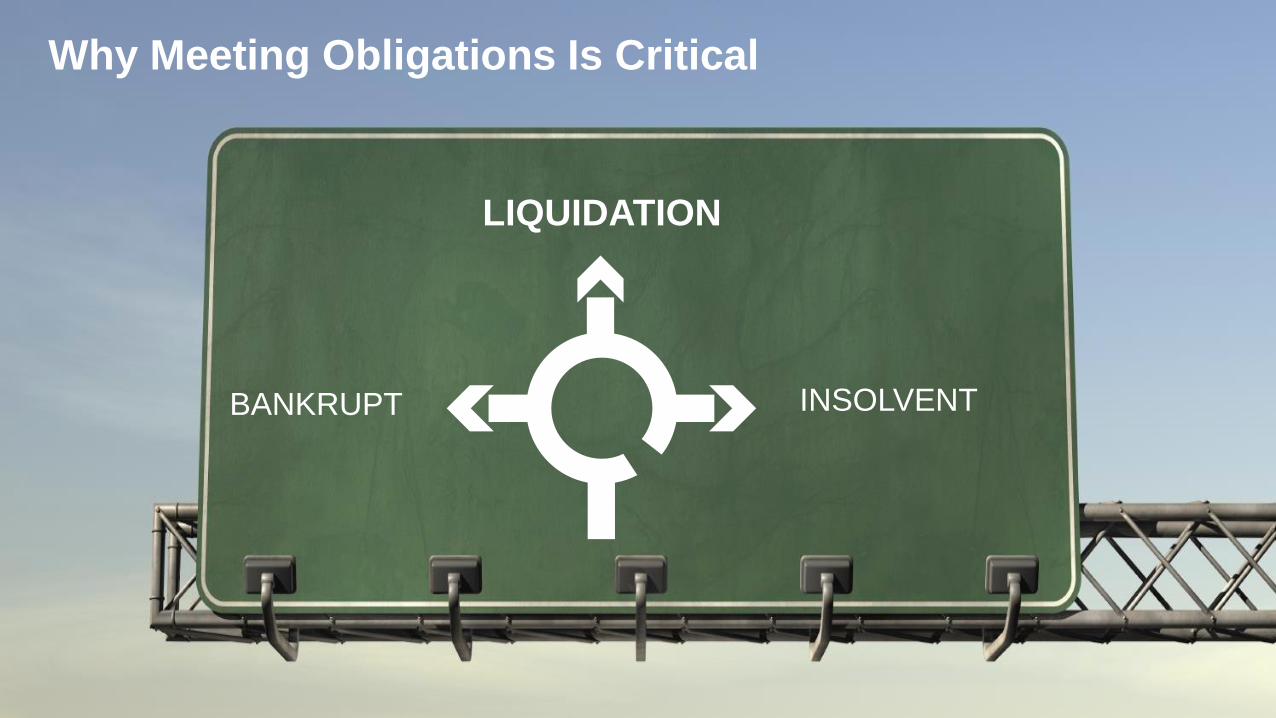
LIQUIDATION
BANKRUPT INSOLVENT
Why Meeting Obligations Is Critical
23 © 2015 Gartner, Inc. and/or its affiliates. All rights reserved.
Balance Sheet
Current obligations MUST be met.
If not, results could be default,bankruptcy, liquidation!
Microsoft Corporation Balance Sheets
(in Millions)
June 30
2014
June 30
2013
Assets
Current assets:
Cash and cash equivalents 8,669$ 3,804$
Short-term investments
(including securities loaned of $541 and $579) 77,040 73,218
Total cash, cash equivalents and
Short-term investments 85,709 77,022
Accounts receivable, net of allowance
for doubtful accounts of $301 and $336 19,544 17,486
Inventories 2,660 1,938
Deferred income taxes 1,941 1,632
Other 4,392 3,388
Total current assets 114,246 101,466
Property and equipment, net
of accumulated
depreciation of $14,793and $12,513 13,011 9,991
Equity and other investments 14,597 10,844
Goodwill 20,127 14,655
Intangible assets, net 6,981 3,083
Other long-term assets 3,422 2,392
Total assets 172,384$ 142,431$
Liabilities and stockholders' equity
Current liabilities:
Accounts payable 7,432$ 4,828$
Short-term debt 2,000 0
Current portion of long-term debt 0 2,999
Accrued compensation 4,797 4,117
Income taxes 782 592
Short-term unearned revenue 23,150 20,639
Securities lending payable 558 645
Other 6,906 3,597
Total current liabilities 45,625 37,417
Long-term debt 20,645 12,601
Long-term unearned revenue 2,008 1,760
Deferred income taxes 2,728 1,709
Other long-term liabilities 11,594 10,000
Total liabilities 82,600 63,487
Total stockholders' equity 89,784 78,944
Total liabilities and
stockholders' equity 172,384$ 142,431$
24 © 2015 Gartner, Inc. and/or its affiliates. All rights reserved.
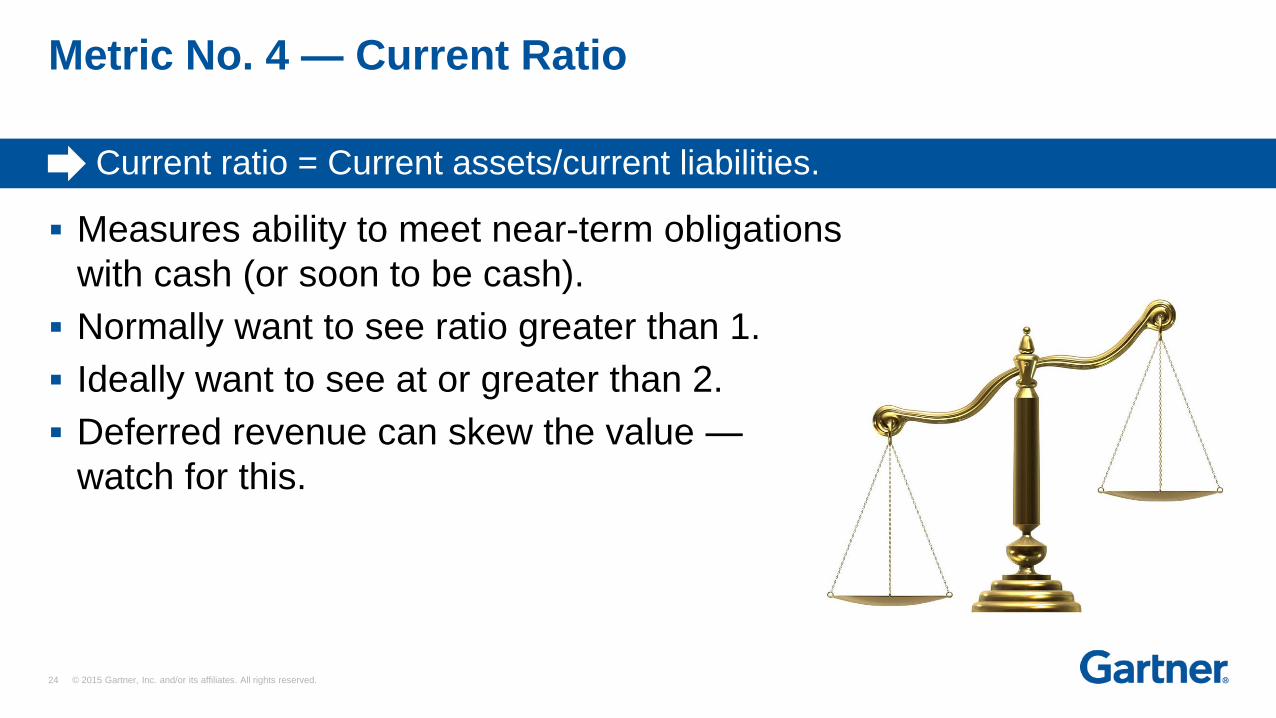
Metric No. 4 — Current Ratio
Current ratio = Current assets/current liabilities.
Measures ability to meet near-term obligations
with cash (or soon to be cash).
Normally want to see ratio greater than 1.
Ideally want to see at or greater than 2.
Deferred revenue can skew the value —
watch for this.
25 © 2015 Gartner, Inc. and/or its affiliates. All rights reserved.
Why Is Cash Flow Important?
26 © 2015 Gartner, Inc. and/or its affiliates. All rights reserved.
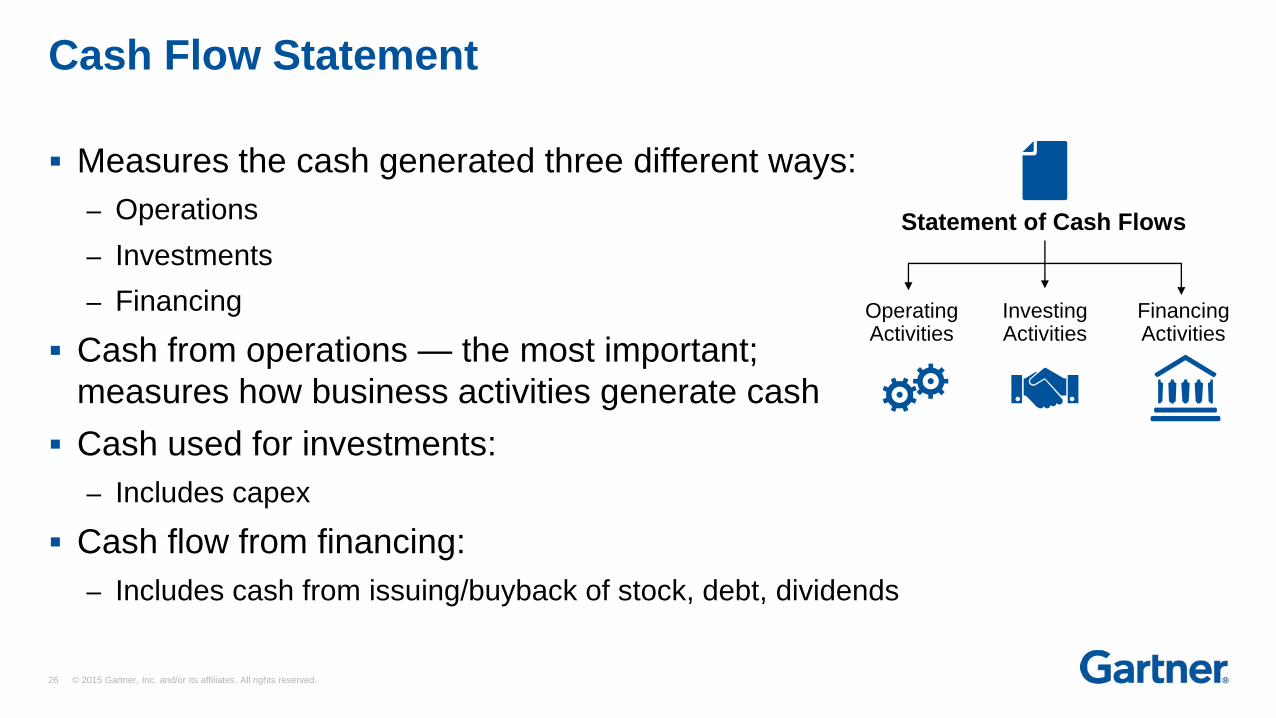
Measures the cash generated three different ways:
– Operations
– Investments
– Financing
Cash from operations — the most important;
measures how business activities generate cash
Cash used for investments:
– Includes capex
Cash flow from financing:
– Includes cash from issuing/buyback of stock, debt, dividends
Cash Flow Statement
Operating Activities
Investing Activities
Financing Activities
Statement of Cash Flows
27 © 2015 Gartner, Inc. and/or its affiliates. All rights reserved.
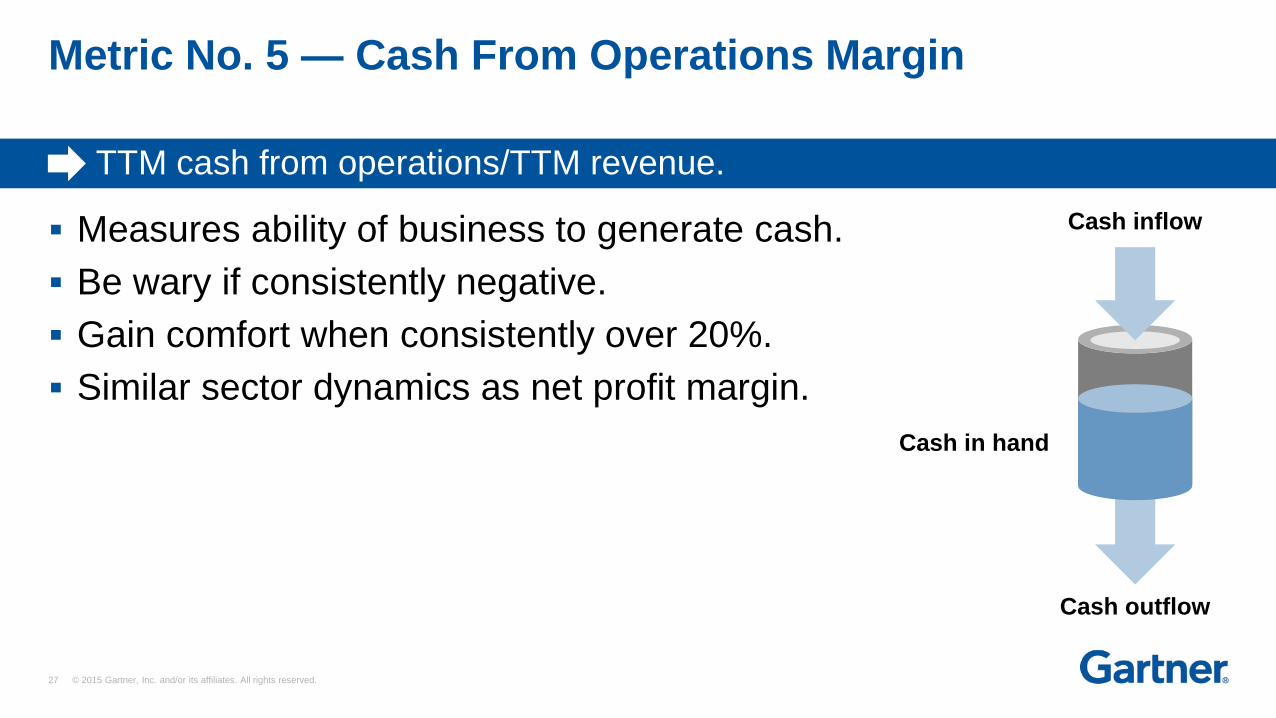
TTM cash from operations/TTM revenue.
Measures ability of business to generate cash.
Be wary if consistently negative.
Gain comfort when consistently over 20%.
Similar sector dynamics as net profit margin.
Metric No. 5 — Cash From Operations Margin
Cash inflow
Cash outflow
Cash in hand
28 © 2015 Gartner, Inc. and/or its affiliates. All rights reserved.
Source: Gartner (November 2015)
TTM R&D expense/
TTM revenue.
Monitor spending on research and
development to gauge vendor
commitment to product enhancements.
Metric No. 6 — R&D Spending
Microsoft Corporation
Yearly Income Statements
(In millions, except earnings per share)FY12 FY13 FY14
Revenue 73,723$ 77,849$ 86,833$
Cost of revenue 17,530 20,249 26,934
Gross margin 56,193 57,600 59,899
Research and development 9,811 10,411 11,381
Sales and marketing 13,857 15,276 15,811
General and administrative 4,569 5,149 4,821
Goodwill impairment 6,193 0 0
Integration and restructuring 0 0 127
Other expenses 0 0 0
Operating income 21,763 26,764 27,759
Other income (expense), net 504 288 61
Noncontinuing items 0 0 0
Income before income taxes 22,267 27,052 27,820
Provision for income taxes 5,289 5,189 5,746
Net income before accounting change 16,978 21,863 22,074
Cumulative effect of accounting change 0 0 0
Net income 16,978 21,863 22,074
Sector
R&D as a
percentage
of Revenue
Communications Equipment Average 14.9%
Technology Hardware, Storage and Peripherals Average 12.7%
Diversified Telecommunication Services Average 1.9%
Internet Software and Services Average 16.8%
IT Services Average 3.5%
Semiconductors and Semiconductor Equipment Average 12.0%
Software Average 18.8%
Wireless Telecommunication Services Average 0.4%
Electronic Equipment, Instruments and Components Average 11.2%
29 © 2015 Gartner, Inc. and/or its affiliates. All rights reserved.
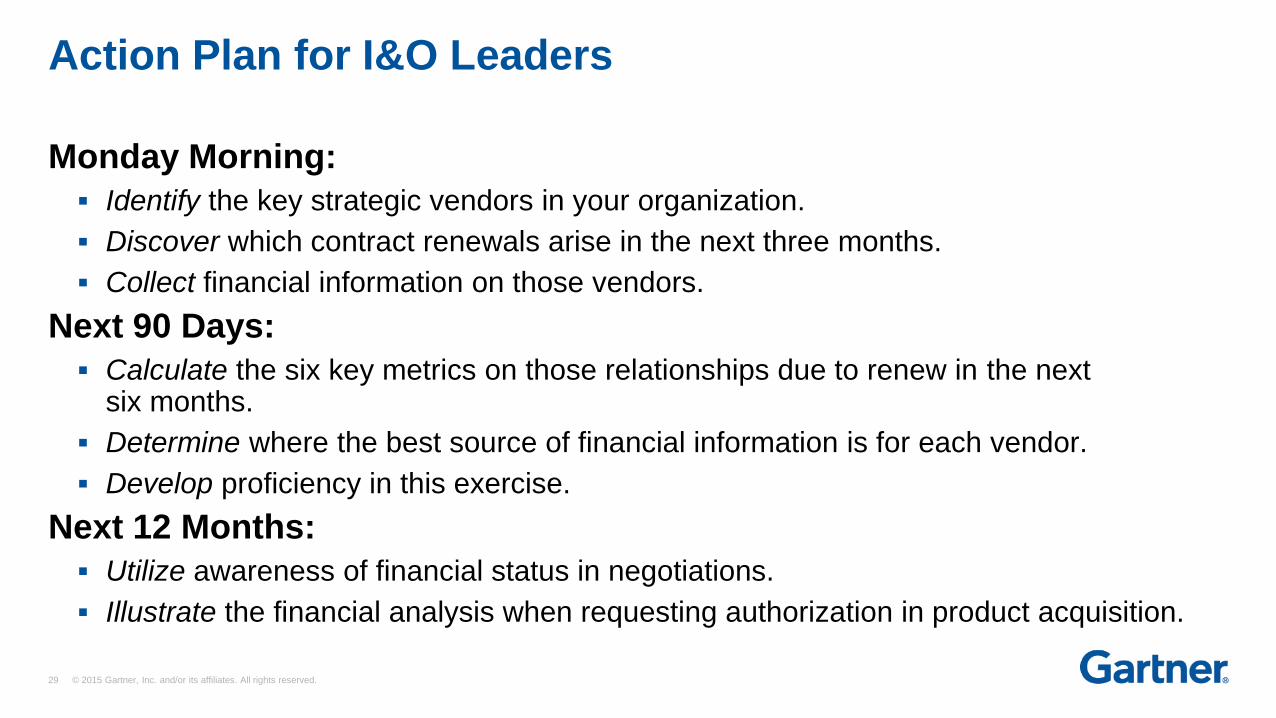
Action Plan for I&O Leaders
Monday Morning:
Identify the key strategic vendors in your organization.
Discover which contract renewals arise in the next three months.
Collect financial information on those vendors.
Next 90 Days:
Calculate the six key metrics on those relationships due to renew in the next six months.
Determine where the best source of financial information is for each vendor.
Develop proficiency in this exercise.
Next 12 Months:
Utilize awareness of financial status in negotiations.
Illustrate the financial analysis when requesting authorization in product acquisition.
30 © 2015 Gartner, Inc. and/or its affiliates. All rights reserved.
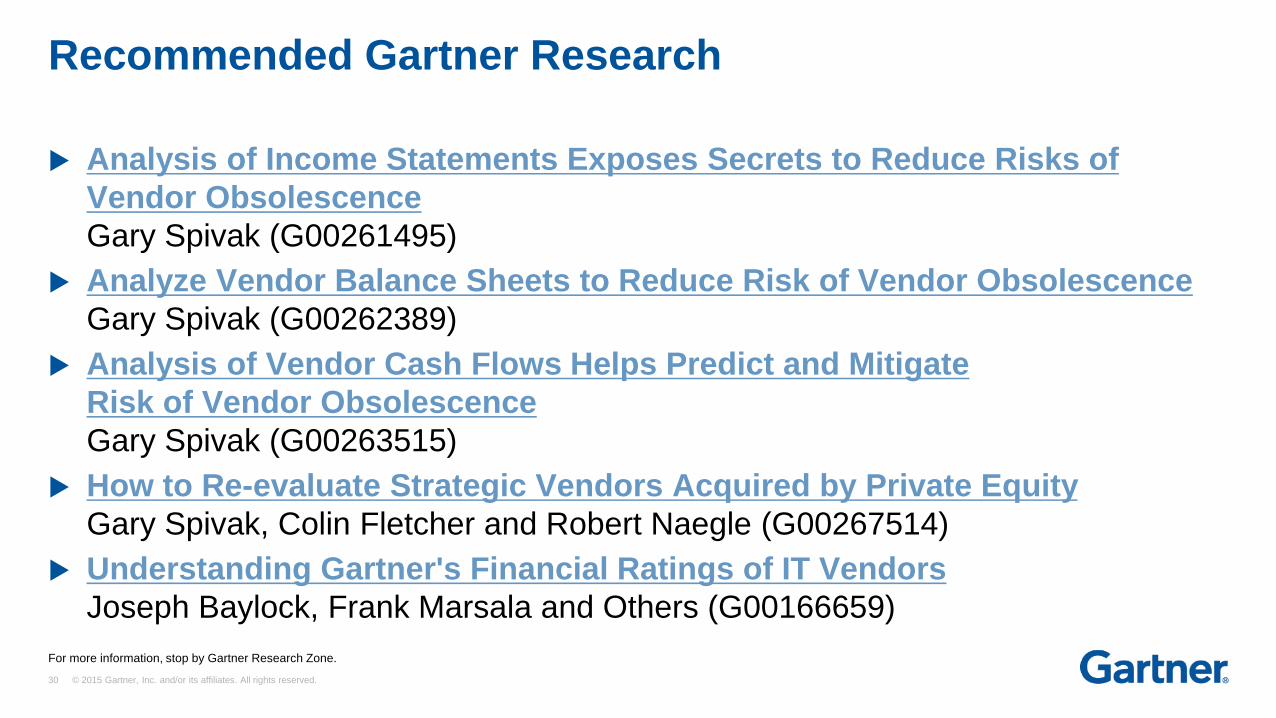
Recommended Gartner Research
Analysis of Income Statements Exposes Secrets to Reduce Risks of
Vendor Obsolescence
Gary Spivak (G00261495)
Analyze Vendor Balance Sheets to Reduce Risk of Vendor Obsolescence
Gary Spivak (G00262389)
Analysis of Vendor Cash Flows Helps Predict and Mitigate
Risk of Vendor Obsolescence
Gary Spivak (G00263515)
How to Re-evaluate Strategic Vendors Acquired by Private Equity
Gary Spivak, Colin Fletcher and Robert Naegle (G00267514)
Understanding Gartner's Financial Ratings of IT Vendors
Joseph Baylock, Frank Marsala and Others (G00166659)
For more information, stop by Gartner Research Zone.
31 © 2015 Gartner, Inc. and/or its affiliates. All rights reserved.