140
Annual Report 2020 Focusing on sustainable REVITALIZATION

Annual Report 2020
Focusing on sustainable REVITALIZATION


ContentsVision and Mission 04Corporate Information 06Company Profile 10Core Values 14Code of Conduct 15Corporate Strategy 16Major Milestones 18Management Structure 20Critical Performance Indicators 21Board of Directors 22Geographical Presence 26Group Structure 27Sugar Industry Overview 28Cane Crushing History 32Engaging with our Growers 33Our Employees 36Our Health, Safety & Environment 37SWOT Analysis 38Risk Management 39
Annual Events 40Corporate Social Responsibility 42DuPont Analysis 43Statement of Value Added 44Investor Information - Six Years 45Horizontal and Vertical Analysis 46Quarterly Performance Analysis 48Graphs 49Chairman’s Review Report 52Directors’ Report 53Directors’ Report (Urdu) 67Review Report 68Statement of Compliance 70Independent Auditors’ Report 72Financial Statements 76Notice of Annual General Meeting 128Pattern of Shareholders 132Categories of Shareholding 133Form of Proxy

Focusing onQUALITY Improve the quality of our product
2 Faran Sugar Mills Limited

Focusing onQUALITY
3Annual Report 2020

Faran Sugar Mills Limited strives to fulfill its commitments to the society. Our strategic business vision, sound business principles are aimed at quality production with maximum operating efficiency that eventually contribute towards national economy and social well-being of all the stakeholders. Pride in our heritage and a strong sense of community is reinforced by proactive planning and enhanced by effective management.
Mission
Faran Sugar Mills Limited will thrive as a proactive partner in prosperity of the nation, recognized as a center for state-of-the-art industrial facilities. Above all, Faran Sugar Mills will strive to be a model business entity where all primary stakeholders are intricately woven in progressive pattern, imperative for the economic growth of the nation.
Vision
4 Faran Sugar Mills Limited

5Annual Report 2020

Date of IncorporationNovember 3, 1981
Date of Commencement of BusinessNovember 25, 1981
Board of DirectorsMuhammad Omar Amin Bawany (Chairman)Ahmed Ali Bawany (Chief Executive)Hamza Omar BawanyBilal Omar BawanyMuhammad Altamash BawanyAhmed Ghulam HussainIrfan Zakaria BawanySheikh Asim Rafiq (NIT)
Audit CommitteeIrfan Zakaria Bawany (Chairman)Muhammad Omar Amin Bawany (Member)Hamza Omar Bawany (Member)
Human Resource & Remuneration CommitteeIrfan Zakaria Bawany (Chairman)Ahmed Ali Bawany (Member)Hamza Omar Bawany (Member)
AuditorsRahman Sarfaraz Rahim Iqbal RafiqChartered Accountants
Chief Financial Officer & Company SecretaryMuhammad Ayub
Legal AdvisorGhulam Rasool Korai
Bankers (Islamic Banking Division) Bank AL-Habib LtdAL-Baraka Islamic Bank Ltd Bank AL-Falah LtdDubai Islamic Bank Ltd MCB Islamic Bank LtdHabib Metropolitan Bank Ltd Meezan Bank Ltd.United Bank Ltd. Habib Bank Ltd. Askari Bank Ltd. Faysal Bank Ltd.
Share RegistrarC&K Management Associates (PVT.) Ltd.404, Trade Tower, Abdullah Haroon Road,Near Metropole Hotel, Karachi.Tel: (92-21) 35687639, 35685930
Corporate Information
6 Faran Sugar Mills Limited

Registered Office43-1-E (B), P.E.C.H.S. Block 6, off Razi Road, Karachi Phone: (92-21) 34322851-54UAN: 111-229-269Fax: (92-21) 34322864
MillsShaikh Bhirkio,Distt. Tando M. Khan.
E-mail & [email protected]
Stock Exchange SymbolFRSM
Registration NumberCompany Registration Number - K-161/6698 National Tax Number – 0710379-4Sales Tax Number – 01-01-2303-005-82
7Annual Report 2020

we motivate and train our workforce
Focusing onTRAINING
8 Faran Sugar Mills Limited

Focusing onTRAINING
9Annual Report 2020
Faran Sugar Mills Limited is an agri-based company, engaged in the business of manufacturing and selling of refined sugar. The company is a part of Amin Bawany Group which is a leading business group having interest in diversified businesses such as Sugar, Insurance, Modaraba, Particle Board, Ethanol production, Trading, Power, Digital Marketing, Food and other important business sectors of Pakistan.
Having a legacy of diversified experience in industrial sector, FARAN SUGAR MILLS LIMITED, commenced its operation in 1981 with an aim to be one of the best sugar mills in the industry.
The mill is located at Shaikh Bhirkio District Tando M. Khan which is considered as a suitable sugarcane growing area. The plant commenced commercial production in 1983 with installed cane crushing capacity of 2,000 TCD which, after successive capacity enhancements, has now been reached above 10,500 TCD.
Al-Hamdulillah, Faran Sugar is ranked amongst top sugar mills operating in the province of Sindh in terms of production. The diversified portfolio of our customers includes the manufacture of cereals, confectionary, syrups, drinks, ice creams, biscuits, and so on. Having one of the most efficient sugarcane processing facilities, We strive to take market leading position through anticipating all the important factors that affect our business verticals. We are committed towards achieving the highest standards of quality and environmental care.
SANHA Halal Associates Pakistan Pvt Limited has renewed ‘HALAL CERTIFICATION’ . Halal certification is a process which ensures the features and quality of the products according to the rules established by the Islamic Council and signifies that our product is allowed to be consumed or used by humans according to Shariah / Islamic Law. The SANHA certificate thus serves as an authoritative testimony to the Halal suitability of a product.
VIS-Credit Rating Company Limited has maintained ‘A- / A-2’ (A minus / A – Two) The long term rating of ‘A –‘signifies good credit quality with adequate protection factors. Risk factors are considered variable if changes occur in the economy. Short term rating of ‘A-2’ depicts good certainty of timely payment. Liquidity factors and company fundamentals are sound with good access to capital markets, risk factors are small and outlook on the assigned rating is ‘Stable’.
Company Profile
10 Faran Sugar Mills Limited

The company has made long-term investment in distillery unit namely, Unicol Limited which was formed in accordance with the terms of a Joint Venture agreement amongst the three leading sugar mills of Sindh. It is one of Pakistan largest ENA Ethanol producer and leading food grade CO2 supplier. It was ranked amongst the top 100 exporters of Pakistan for the year 2018. It has designed production capacity of 200,000 liters or 160 M. Tons of Ethanol from sugarcane molasses per day. Presently 100% of its Ethanol is being exported, majority of which is destined for Europe, Middle East, Africa and Far East Markets. It also has invested in purification and liquification of CO2 which is a by-product. Its plant has a capacity of 72 M. tons of CO2 per day. Its certification endorse product quality and good manufacturing practices in line with its vision, these certification includes ISO-9001, ISO 14001, ISO-FSSC-22000, OHSAS-18001, GMP
Pakistan has a strong and increasing customer base and has a great potential for expansion in bakery and food industry. As part of a long term diversification strategy, FSML has invested in “UniFood Industries Limited” which is engaged in food business under Joint Venture arrangement with leading sugar mills. The project is located at Tehsil Hub District, Lasbella, Baluchistan and commenced commercial production in March 2018 of its signature brand “GOOD GOODIES”, with a wide range of Long cakes and Cupcakes.
Alhamdulillah, Faran Sugar is managing its working capital as well as long-term financing requirements through Shariah compliant financial modes. We are proud to say that FSML is a RIBA / INTEREST FREE CORPORATE ENTITY.
We continued our focus on rehabilitation/ modernization of our manufacturing facilities and equipment for long-term sustainability. We take guidance from renowned local and foreign technical consultants of various engineering fields to improve the overall efficiency of our plant with object to create sustainable future growth.
We are proud to say that FSML is a RIBA / INTEREST FREE CORPORATE ENTITY.
11Annual Report 2020

Upgrade and enhanced our equipment
Focusing onRE ENERGZING
12 Faran Sugar Mills Limited

Focusing onRE ENERGZING
13Annual Report 2020

Core Values
INNOVATIONWe believe in relentless commitment to continuous improvement and encourage ideas from all stakeholders. For this, we define quality, as understanding the customers’ expectation.
LEADERSHIPManagerial and professional competence is vital for our success, therefore we value leadership qualities coupled with drive to challenge the status quo.
EXCELLENCEWe are committed to excellence in all spheres of performance and have firm belief that our core values emerges from satisfying our customers’ needs of quality management.
ETHICS & INTEGRITYWe constantly strive to establish and maintain highest professional and ethical standards and strongly believe that honesty, ethical behavior and integrity are the land mark of our success. Choosing the course of the highest integrity has always been our intent.
EMPLOYEES’ GROWTH & DEVELOPMENTOur philosophy is to create a congenial working environment where dignity and value of the personnel is considered as top responsibility. We focus on encouraging and empowering employees to contribute to the company’s success.
PROFITABILITYWe have developed an attitude to successfully discharge our responsibilities to maximize returns to our stakeholders by constantly meeting their expectations.
TEAMWORKHigh performance teams can accomplish what individuals cannot. Therefore, we strive to develop a team of professionals having relevant specialization in respective domain.
14 Faran Sugar Mills Limited
Code of Conduct“Our focus on finding every opportunity which reduces cost while improving operations based on ethical conduct remains crucial to our continued success”.
Company’s code of conduct set out the minimum standards expected from the entire team. By this, we are able to maintain excellent eminence amongst all of business partners in a professional manner. We have a firm conviction that employees have an obligation to themselves and to the company to raise any matter of business conduct or ethics that cause concern. No one is allowed to commit an illegal or unethical act.
It is the company’s policy to conduct its operations in accordance with the highest business ethical considerations to comply with all statutory regulations and to confirm to the best-accepted standards of good corporate citizenship. The policy applies to all directors and employees of the company regardless of function grade or standing.
In general, we treat our personnel as company’s ambassadors to all our stakeholders therefore expected to promote the company’s best interest maintaining integrity and confidentiality in all dealings.
Business ethics help protect both the employees and the company from unfounded indictment of pretext or deception and fraud. Further ensures, any fraud that has or might have taken place, must be properly investigated and dealt with in a timely manner.
The company’s activities and operations are carried out in strict compliance of all applicable laws and highest ethical standards. While dealing with stakeholders, the company is strictly prohibited to be engaged, directly or indirectly, in any malpractices.
Corporate funds and assets will be utilized solely for the company’s objectives in a lawful manner.
We will support a precautionary approach to environmental challenges and within the company’s sphere of influence, undertake initiatives to promote greater environmental safety and encourage the development and diffusion of environmental friendly technology.
Employees are expected to safeguard confidential information and must not without authority; disclose such information about company activities to any outside source that are not entitled to such information.
Any dealings between staff and outside organization in which they have a direct, indirect, or family connection must be fully disclosed to the management.
We will not discriminate against any employee for any reason such as race, religion, political conviction, or gender, and will treat everyone with full dignity and with respect for their private lives.
Any violation of this conduct shall be promptly reported to the management by any employee having knowledge thereof.
15Annual Report 2020

Corporate Strategy
16 Faran Sugar Mills Limited
Our unique corporate strategy gets aligned with the resource allocation system and flow down to the operational levels, thus ensuring its implementation at all levels along with the achievement of the intended results.
FinancialTo reduce cost and time over runs which results in improved financial result. To maximize profits by investing surplus funds in profitable avenues. To make investment decisions by ranking projects on the basis of best economic indicators. Growth and superior return to all stake holders.
Learning and GrowthMotivate and train our workforce, revitalize our equipment base and attain full autonomy in financial and decision making matters. To enhance the technical and commercial skills through modern HR management practices. Continuously develop technical and managerial skills at all levels and stay abreast of latest technologies and high performing human resources.
CustomerImprove the quality of our product to make delightful customers & to be perceived as a Reliable and Efficient company. To provide most reliable supplies to the customers through cost effective means.
Internal ProcessTo set up task forces with representation from all relevant departments to improve internal business decision making and strategic planning. Availability of updated information to the shareholders and customers. To use most effective business practices and formulation to the shareholders and customers. To use most effective business practices and formulation to the shareholders and customers. To use most effective business practices and formulate a framework of synergic organization with the change in culture.

17Annual Report 2020

1981 1984 1990 2004
1983 1988 1994
Incorporation of the company
Listed on Karachi & Lahore stock exchanges
Crushing capacity further increased to 3,700 TCD
De-Bottle Necking at Mill I & II to increase capacity to
7,500 TCD. Investment in Unicol
Limited, a distillery unit estabished as Joint venture with two other sugar millers
Major Milestones
Commencement of commercial production at
Mill 1 with 2,000 TCD
Crushing capacity enhanced to 2,700 TCD
Second line started and capacity enhanced to
6,500 TCD
1981
1983 1988 1994
1984 1990 2004
18 Faran Sugar Mills Limited

1981 1984 1990 2004
1983 1988 1994
Successfully Deployed Enterprise
Resource (ERP).
Record-breaking recovery rate 11.137%
Highest dividend announced Rs. 6.75 /
share
Achieved Highest Crushing of 993,309 M.Ton
Highest ever production of 106,318 M. Tons
Assigned ‘A- / A-2’ (A minus / A – Two) Credit
Rating by JCR Awarded HALAL Certificate by
SANHA Halal Associates Pakistan Pvt Limited
Completed Modernization and Expansion of plant initiated in 2011 which
enhanced crushing capacity to 9,000 TCD.
Highest ever Turnover of Rs. 6.9 Billion
Highest ever Profitability of Rs. 482.6 Million
Highest ever EPS of Rs. 19.30 per share
Achived Highest Export Sale of Sugar
89,761 M.Tons
2008
2012 2016 2018
2015 2017 2019
19Annual Report 2020

Chairman
ChiefExecutive
Officer
HR andAdministration
Internal Audit
Corporateand
Legal Affairs
InformationTechnology
Production Technical Supply ChainManagementSales
Finance and
Accounts
Director Operations Altaf Waheed
Resident DirectorRiaz Jawed Suleri
Key Management Positions
Chief Operating OfficerKhalid Hayat Khan
CFO & CompanySecretary
Muhammad Ayub
Management Structure
20 Faran Sugar Mills Limited

Critical Performance Indicators
2020 20202020
2020 20202020
Sugar Recovery
Rate%
10.90
SugarProductionM.Tons
65,739
73,696 2019
11.012019
GrossSale
Rs. in Million
6,563
5,147 2019Earning / (Loss)
per Share (EPS) after tax
Rs. (6.85)
380 2019
Net Profit / (Loss) after
TaxRs. in Million
(171)
15.21 2019
Dividend per Share
Rs.
-
1.00 2019
21Annual Report 2020

Muhammad Omar Amin Bawany Chairman
Mr. Muhammad Omar Bawany acquired his education from Karachi American School and then went to American College of Switzerland and obtained Associate Degree. Under his wise management, Annoor Textile Mills operated successfully. He is on the Board of Director of Faran Sugar Limited since 1984 and currently he is the Chairman of Faran Sugar Mills and Faran Power Ltd. He is also the Chief Executive of B.F Modaraba managed by E.A Management and is on the Boards of Reliance Insurance Company, Unicol Limited and Uni-Food Industries Ltd.
Ahmed Ali BawanyChief Executive
Mr. Ahmed Ali Bawany is on the Board of Directors of the Faran Sugar Mills since 1995. He got his schooling from CAS, Karachi. For pursuing further education, he went to USA and got degree in business entrepreneurship from University of Southern California. Currently, he is the Chief Executive of Faran Sugar Mills Ltd and Faran Power Ltd. He has also served as Chairman of Pakistan Sugar Mills Association-Sindh Zone in the year 2014. Besides Faran Sugar, he is actively involved in Unicol Ltd in the capacity of director, which is a Joint Venture engaged in the production and marketing of Ethanol and food grade C02. He is also on the Board of Reliance Insurance Company, UniEnergy and is the Chairman of B.F Modaraba and Uni-Food Industries Ltd.
Board of Directors
22 Faran Sugar Mills Limited

Hamza Omar Bawany Director
Mr. Hamza Omar Bawany is the Founding CEO of UniFood Industries Ltd. which was established in 2017. As CEO, he played a pivotal role in starting the food business and launching the brand Good Goodies. Mr. Hamza has a diverse working experience in various fields such as Manufacturing, FMCG and Islamic Banking. For over 10 years he has served as Chief Operating Officer of Sind Particle Board Mills Ltd. He acquired his BBA and MBA degree in Marketing and Finance from IBA, Karachi in 2002 and was awarded Certificate of Director Education by Pakistan Institute of Corporate Governance in 2017. He has also served as Director on Boards of Reliance Insurance Company Ltd and B.F. Modaraba.
Bilal Omar Bawany Director
Mr. Bilal Bawany completed his primary schooling from CAS school and did his A’ levels from Karachi Grammar School. He then went on to pursue Bachelors in Electrical Engineering from the American University of Sharjah, graduating with honors, and an MBA from IBA. He has worked with leading companies in Abu Dhabi, Scotland and Pakistan including Baker Hughes and Avanceon. He joined Faran Sugar Mills in 2010 and brought with him a rich technical experience which helped Faran Sugar in reaching new levels of efficiency, optimization and expansion. He joined Board of Directors of Faran Sugar Mills in 2015 and is also an active Board member of UniEnergy, which is a Joint Venture for Wind Power Generation.
23Annual Report 2020

Board of Directors
Mr. Mohammed Altamash BawanyDirector
Mr. Mohammed Altamash Bawany has joined the Board of Directors in 2016. He holds a Bachelor’s of Science degree in Mechanical Engineering from the American University in Dubai and The Georgia Institute of Technology in the United States. While having worked for the KS&EW under the Ministry of Defense in Pakistan, he has gained extensive hands-on experience in mechanical design and manufacturing. Furthermore, he has worked on multiple large-scale projects with a focus on new technologies and disruptive innovation in the U.A.E. As the Business Development Manager and founding member at one of the most promising technology startups in Middle East, he has further polished his skills in strategic consulting, and business development techniques and tactics.
Mr. Irfan Zakaria Bawany Director
Mr. Irfan Zakaria Bawany has been serving the board since March 2013. He was re-elected as independent non-executive director in March 2019 for tenure of three years. He is also a non-executive director of Reliance Insurance Company Limited since 1991. He is CEO of Anam Fabrics (Pvt.) Limited. He has served on the Board of Pioneer Cables Limited from 1983 to 1991. He has diversified experience in electrical Cable Manufacturing and textile made up business. After receiving a B.B.A (Accounting) from the University of Houston, USA, he was certified as a Fellow Member of the Texas Society of Certified Public Accountants. He is a certified director from Pakistan Institute of Corporate Governance (P.I.C.G).
24 Faran Sugar Mills Limited

Mr. Ahmad Ghulam HussainDirectorMr. Ahmad Ghulam Hussain: is currently the CEO of Agro Processors and Atmospheric Gases Pvt ltd. (APAG) since 1990 after completing his Bachelors of Economics and MPA from the University of Southern California (USA). He has worked under the Mayor of Los Angeles in the City Economic Development Office. After joining APAG, he immediately and enthusiastically became involved in the inception and launch of Soya Supreme (a household name in Pakistan), successfully lunching the brand in 1991. He headed the Sales and Marketing Dept. and has been responsible for professionalizing the department and setting up a complete network of distribution. Under his leadership, the company has also started manufacturing and marketing sauces like mayonnaise and ketchup under the brand name of SMART. He is also a Director of APAG Oil Pvt. limited.
Mr. Ahmad Ghulam Hussain is currently a voluntary active member and has been the former President of Rotary Club Sunset Millennium, Karachi & former Assistant Governor of Rotary District and hence, headed the various community uplifting projects of the club. He has also worked voluntarily as Director, Aga Khan Education Services Pakistan for six years and he also remained Director of Focus Humanitarian Assistance for 4 years.
Mr. Sheikh Asim Rafiq DirectorMr. Sheikh Asim Rafiq is NIT’s Head of Internal Audit and is responsible for the internal audit of all central functions as well as the twenty three branches of the company spread all over Pakistan. Mr. Rafiq also represents NIT as Nominee Director on the Boards of various listed companies. Prior to joining NIT in 2009 as Head of Internal Audit, he worked for Arif Habib Investments Management Limited as Senior Vice President- Head of Funds Accounting & Operations. He qualified as Chartered Accountant from the Institute of Chartered Accountants of Pakistan in 2004 with training from A.F. Ferguson & Co. (a member firm of PWC network).
25Annual Report 2020

Head Office43-1-E(B), P.E.C.H.S., Block 6,off Razi Road, Shahrah-e-Faisal,Karachi
Sugar MillsShaikh Bhirkio, District Tando Mohd. Khan, Sindh
SINDH
BALOCHISTAN
PUNJAB
KASHMIRKPK
Geographical Presence
26 Faran Sugar Mills Limited
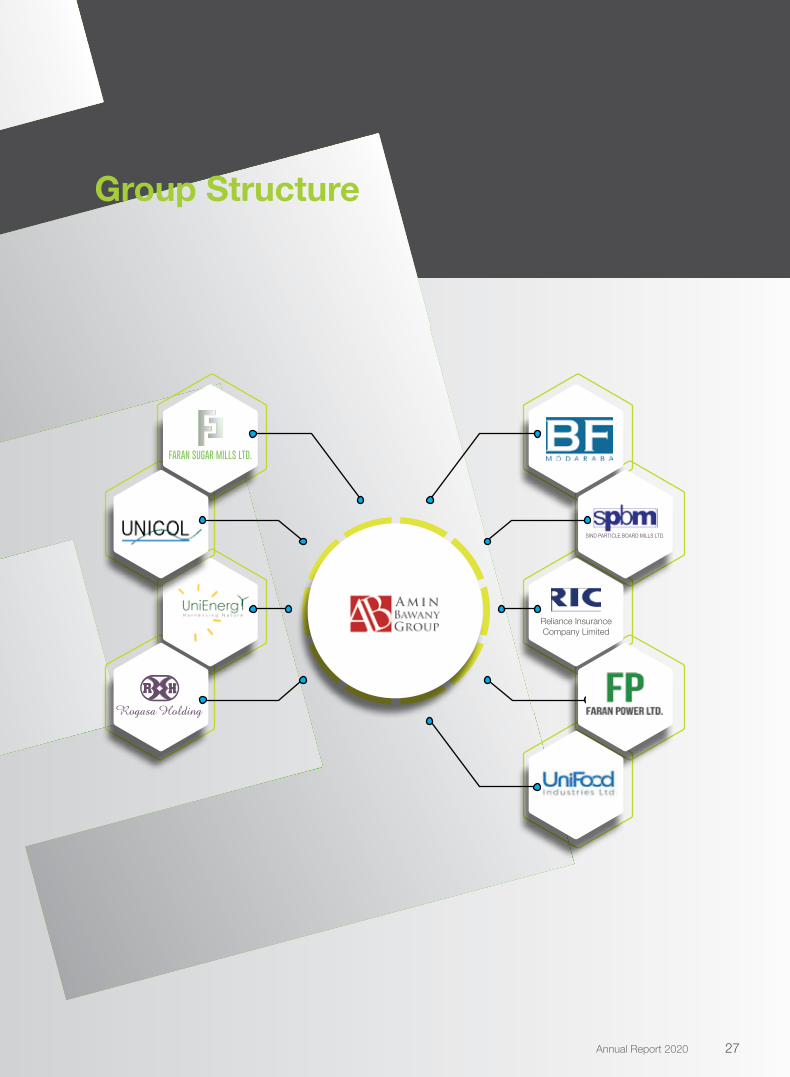
Group Structure
SIND PARTICLE BOARD MILLS LTD.
Reliance Insurance Company Limited
FARAN SUGAR MILLS LTD.
27Annual Report 2020

Currently, about 110 countries produce sugar from either sugar cane or beet, and eight countries produce sugar from both cane and beet. Sugarcane, on average, accounts for nearly 80% of global sugar production. The remaining 20% comes from sugar beets, which are grown mostly in the temperate zones of the Northern Hemisphere. Beet sugar is primarily produced in northern Europe, including northern France, Belgium, the Netherlands, Germany, and Poland.
The world’s largest sugar producer by far is Brazil followed by India. In 2019-20, World Sugar’s production was amounted around 166 million tons. Brazil was the largest sugar-producing country in the world, yielding approximately 30 million metric tons of sugar followed by India which produced around 28.9 million metric tons according to the USDA – Sugar: World Markets
Pakistan is the 8th largest country in the world in terms of sugar production and world’s 5th largest producer of sugarcane. Sugarcane is the primary raw material for the production of sugar. Among the provinces, Punjab accounts for around 65 percent of sugarcane area, Sindh around 25 percent, and Khyber Pakhtunkhwa around 10 percent.
The sugar industry in Pakistan is the 2nd largest agro based industry comprising 90 sugar mills with annual crushing capacity of over 65-70 million tones. Sugarcane farming and sugar manufacturing contribute significantly to the national exchequer in the form of various taxes and levies. Sugar manufacturing and its by-products have contributed significantly towards the foreign exchange resources through export/import substitution.
Pakistan has experienced surplus production in the past years in comparison to its domestic’s consumption. But since last year, sugarcane area and production are on a decreasing trend due to multiple factors. Sugar production of the country for the season 2019-20 was also reported to down by 7% to 4.8% million metric tons from 5.26 million metric tons produced in the previous season
KEY ATTRIBUTESDYNAMICS OF SUGAR INDUSTRY 2019-20
World Sugar Production166 million tons:
Listed Sugar Companies:
23
Sugar CaneCrushing:
48.717 million tons
Sugar Cane Area(In Hectares Avg.):
1,060,000
Sugar Production: 4.819 million tons
Province Mills OperatedPunjab 46 41Sindh 38 32KPK 6 6
Sugar Cane Production: 67.769 million tons
Sugar Consumption: 5.6 million tons
Sugar Industry Overview
Number of Mills: 90 Operated: 79
28 Faran Sugar Mills Limited

2018-19 as per provisional data of Pakistan Sugar Mills Association (PSMA). As per provisional data of PSMA, the mills operating in the Sindh zone crushed 14.28 million metric tons of sugar cane against 15.930 million metric tons in the previous season 2018-19, down by 10% and produced 1.459 million metric tons of sugar with average recovery of 9.89% against 1.719 million metric tons produced with average recovery 10.47% in the previous season 2018-19.
The country exported a huge quantity in previous seasons due to surplus production earned precious foreign exchange for the country. But the government had to import sugar in last quarter of 2020 due to shortage of sugar and decided to import another 0.5 million tons of sugar in the ongoing season 2020-21 to overcome the shortage of refined sugar. Sugarcane Area and Production by Province:
Province Area (‘000' Hectares) Production (‘000' Tons)
2017-2018 2018-2019 2019-2020 2017-2018 2018-2019 2019-2020Punjab 860 735 N/A 55,070 43,896 44,130Sindh 332 334 N/A 20,610 17,670 18,010KPK 148 111 N/A 7,610 5,394 5,624Baluchistan - - N/A - - -Total 1,340 1,180 1,060 83,290 66,960 67,769
N/A - Not AvailableSources: MNFSR & Pakistan Sugar Mills Association (PSMA)
Cane Crushing, Production and Recovery & Molasses Production in Pakistan:
Period Sugar MolassesCane Crushing Production Recovery Production
M.T M.T % M.T2019-20 48,717,544 4,819,793 9.89 2,191,9202018-19 49,768,113 5,210,744 10.47 2,239,5652017-18 65,615,550 6,576,534 10.16 2,954,6222016-17 70,989,948 7,005,678 9.87 3,077,9622015-16 50,042,249 5,082,110 10.16 2,246,5402014-15 50,795,218 5,139,566 10.12 2,247,1372013-14 56,460,524 5,587,568 9.90 2,524,202
Source: Pakistan Sugar Mills Association (PSMA)
Sugar Cane Indicative Price per 40 kg in comparison with Season’s Avg. Retail Price per kg:
PeriodSugar price (Rs.) Season Avg.
retail/kg (Rs.)Sindh Punjab KPK2020-2021 202 200 200 N/A2019-2020 192 190 190 N/A2018-2019 182 180 180 58.802017-2018 182 180 180 53.572016-2017 182 180 180 61.432015-2016 172 180 180 63.76
Source: Pakistan Bureau of Statistics (PBS), Government of Pakistan / PSMAN/A - Not Available
29Annual Report 2020

Production Share of Top Players
S.No. Sugar Mill RegionProduction
in 2020 (M.T.)
RankingProduction
in 2019 (M.T.)
Ranking
1 JDW Punjab & Sindh 548,220 1 640,278 12 Tandlianwala Punjab 265,420 2 255,375 23 Hamza Punjab 189,479 3 231,006 34 Etihad Punjab 185,211 4 183,332 45 Sheikoo Punjab 153,620 5 146,505 86 Chasma KPK 151,013 6 166,252 57 R.Y.K Punjab 149,200 7 155,186 68 A.K.T Sindh 147,575 8 - -9 Deharki Sindh 122,831 9 147,213 710 Layyah Punjab 113,693 10 130,627 1011 Two Star Punjab 102,492 - 131,553 9
Source: Pakistan Sugar Mills Association (PSMA)
10 Largest Sugar Producers & Consumers in the World based on 2017-18
S.No. 10 Largest Sugar Producers 10 Largest Sugar ConsumersName Production (in
Million M.T)Name Consumption (in
Million M.T)1 Brazil 29.925 India 27.0002 India 28.900 European Union 18.3003 European Union 17.003 China 15.4004 China 10.400 USA 11.1005 Thailand 8.294 Brazil 10.6506 USA 7.393 Indonesia 7.3567 Russian Federation 7,800 Russian Federation 6.1008 Mexico 5.596 Pakistan 5.6009 Pakistan 5.260 Mexico 4.34910 Australia 4.285 Egypt 3.250
Source: Pakistan Sugar Mills Association (PSMA)
Sugar Industry – Outlook for Season 2020-21
Global Sugar Production for Marketing Year (MY) 2020/21 is estimated up 16 million metric tons
raw value (tons) to 182 million; Higher in United States, India, and Brazil Up 10 to 40 PercentWorld largest sugar producer Brazil’s is expected to increase by over 40% to more than 42 million
tons and India, 2nd largest producer in the world, is forecast to rebound 17 percent to 33.8 million tons on higher yields and area.
Sugar production in the EU and Thailand is projected to decline.Global sugar consumption is forecast to increase in the 2020/21 season by 6.2 metric tons to
approximately 177 MMT compared to the 2019/20 season
Sugar Industry Overview
30 Faran Sugar Mills Limited

Farmer Sugar Mill
Distributor / Industrial Consumers
Retail Stores
End Consumers
Pakistan’s Marketing Year (MY) 2020/21 sugar production is forecast at 5.9 million metric tons (MMT), a six percent increase from the current year’s revised estimate due to an expected increase in sugarcane area. But local estimation is around between 5 to 5.2 million tons
SUPPLY CHAIN
31Annual Report 2020

2012 - 2013
2011 - 2012
2010 - 2011
2009 - 2010
2008 - 2009
2007 - 2008
2006 - 2007
2005 - 2006
2004 - 2005
2003 - 2004
2002 - 2003
2001 - 2002
2000 - 2001
1999 - 2000
1998 - 1999
1997 - 1998
1996 - 1997
1995 - 1996
1994 - 1995
1993 - 1994
1992 - 1993
1991 - 1992
1990 - 1991
1989 - 1990
1988 - 1989
1987 - 1988
1986 - 1987
1985 - 1986
1984 - 1985
1983 - 1984
2013 - 2014
2014 - 2015
2015 - 2016
2016 - 2017
2019 - 2020
2018 - 2019
2017 - 2018
255,293
Cane Crushing Recovery (%)(MT)
0
2000
00
4000
00
6000
00
8000
00
1000
000
1200
000
645,771
874,823
752,380
533,671
604,667
622,293
609,962
651,701
526,024
445,909
475,746
653,605
523,694
491,975
409,619
753,025
597,428
781,505
643,061
685,778
890,592
733,065
579,693
480,072
807,412
627,726
561,861
660,237
897,803
6515,34
764,025
789,656
993,389
959,378
670,581
601,936
9.98%
10.05%
10.20%
9.65%9.16%
8.47%9.41%
9.59%
10.08% 8.78%
8.78%
9.19%9.87%
10.50%
10.18% 9.13%
9.36%
9.44%
9.07%
9.55%
9.19%
9.65%
9.65%
9.00%
8.90%
9.26%
9.72%
9.73%
9.54%10.68%
10.34%11.13%
11.01%
11.01%10.70%
11.01%
10.90
Cane Crushing History
32 Faran Sugar Mills Limited

Pakistan is ranked 5th in the world on the basis of the overall area under cultivation but in terms of sugar production we are at 9th position. Our team of experienced professionals remain in contact with the farmers throughout the year. We continued to promote 3L (Land Laser leveling) and leveled around 11,743 acres and 54,082 acres land laser leveled during the project period of 5 years (2015-16 to 2019-20). Besides higher crop productivity, 3L provides further benefits like better distribution and saving of precious water, improve efficiencies in nutrient uses and precision farming. Our Solar Energy tube well program is running successfully and we have already installed 121 solar tube wells up to season 2019-20 as compared to 64 tube wells in 2017-18. Besides above, 27 new Promising lines of different Sugar Cane Institutes are under trials.
Resultantly average yield per acre increased to 945 Mds per acre at our FSML Farm and 690 Mds per Acre in overall Zone Area of around 25000 acres. We also enhanced our Biological control program and applied 0.713 million Bio Cards in cane fields. Trainings program continued for farmers & field Staff with the co-ordination of Government, agricultural research institutes and agro based private companies as we conducted more than 69 coordinated village meetings on different topics. 21 field demonstrations plots with introduction of mechanized sugarcane planter, ring pit planting methods at different locations with excellent results.
Engaging with our Growers
33Annual Report 2020

Biological control based sugarcane Integrated Pest Management (IPM) Program in collaboration with the internationally acclaimed scientist, Dr. A.I Mohiuddin and his team of agricultural technologists was implemented at Faran Sugar Mills Limited‘s cane procurement area. We have been the pioneer organization that patronized this environment-friendly technology in the sugar industry. Because of uninterrupted operation of the biological based Sugarcane IPM Program since 1989, FSML has been protected from any catastrophe such as sudden fare-up of the insect pests.
Our decade old facility of Biological Control Laboratory assists in fighting all sorts of crop deceases organically by actively monitoring, careful targeting of pesticides and herbicides, avoiding ‘blanket’ treatments and reducing environmental loading Because of regular field monitoring and pest scouting, almost all the imminent threat of pests’ fare-up were timely handled by the biological lab system with appropriate action. In addition to this, among several other factors responsible for increasing or at least sustaining the sugar recovery, biological control program has also been an important contributor.
We have been providing RD & E services to our farmers since last 17 years. Our goal is to develop sustainable Sugarcane quality crop production in operational area of Faran Sugar Mill Ltd. We along with our farmers are working Co-Operatively to build a comprehensive Research Development & Extension (RD&E) long term relation, having numerous benefits for both.
Delivering Value Through Research and Development
Biological Control Activities
34 Faran Sugar Mills Limited

Cane Research Development and Extension Program (RD & EP)
Over the past several years, our cane team of experienced professionals remain in contact with farmers and work on sustainable sugarcane production and identify the Gaps in Agronomical practices. Our extensive Cane Development program covered these below mentioned points Sustainable sugarcane quality production- Multiplication of high yielding / high sucrose and drought resistant varieties- High Efficiency Irrigation System (HEIS) Introduction of 3L Technology-Latest Agro Farm Machinery Inter cropping technology Integrated pest management program (IPM) and Mechanized Cultivation of sugarcane. The main objective of Cane Development is to facilitate the cane growers in adoption of Latest Crop Production Technology (LCPT), efficient use of available resources to overcome the prevailing challenges and increasing the production per unit area which ultimately will boost up growers economy.
Introduction of Sugarcane Trash MulchingEvery hectare of sugarcane harvested leaves behind about 10 tons of dried leaves of sugarcane. Our R & D introduced Trash Mulching machines. Trash mulching plays an important role in reducing borers infestation and is a good source of organic matter which is helpful for soil health and improve soil fertility.
35Annual Report 2020

“We are committed to create a culture, comprising of best working environment, remuneration, incentives and opportunities for personal growth, which induces highly qualified professionals to be retained and associated with the company for a significant period”.
Employees are the lifeblood of our organization, and ensuring their job satisfaction leads to increased productivity and profits. When staff members are happy, they tend to have a positive attitude, a better ability to focus, are more apt to collaborate with others and have greater interest in their work.
At Faran, we plan, develop and implement strategies aimed at increasing the level of employee engagement across our business and build a better internal communication system.
We firmly believe in equality of opportunity for all regardless of gender, age, race, physical ability, religion and political conviction as laid down in company’s code of conduct and Ethics. The company seriously takes its obligation to the disabled and seeks not to discriminate against current or prospective employees because of any disability.
We encourage our employees to get education through our Education Assistance Scheme. This scheme provides financial assistance towards the costs of education and aimed at providing self-development and improved qualifications that benefit the employee and our business.
We arrange appropriate training programs and also send our executives / staff members to different workshops / trainings programs relating to their roles in the Company
Quality management system (QMS) training for the concerned was arranged during the year which defined a formalized system to documents processes, procedures, and responsibilities for achieving quality policies, objectives and improving processes.
FSM enjoys the Blessing to send employees for Hajj annually since its inception. Five employees were sent to perform Hajj during the year.
Our Employees
36 Faran Sugar Mills Limited

“The company conducts its business with the highest concern for the health and safety of its employees, contractors, customers, neighbors and the general public, and for the environment in which it operates”.
Health and Safety of our employees has been the hallmark of Faran Sugar Mills Ltd. The company ensures that employees and where applicable contractors, are aware of potential hazards and of the company’s requirements for health, safety and environmental friendly working practices. Safety drills are carried out regularly to ensure that the state of preparedness and emergency response time remain within established limits.
FSML recognizes that safe operations depend not only on technically sound plant and equipment but also on competent people and an active HSE strategy. We firmly believe that all our operational activities must adhere to our safety policies.
Our Health and Safety Department focuses on ensuring that the needs of the injured person are met at all costs in conjunction with the medical practitioners and sound rehabilitation procedures.
The company has well defined health and safety polices and seeks to identify and eliminate occupational health hazards, and is committed to providing a safe workplace for all its employees and strives for zero injuries.
Policies are regularly reviewed to ensure that the standards set are linked to industry’s best practices. Health and safety training is provided to employees to ensure that they perform their work in accordance to the laid down policies. In this respect, in-house training sessions for free safety, first aid, defensive driving and occupational health and safety are carried out routinely.
In House safety and fire drill trainings were conducted in-house during the year that enables the management to ensure a safe and healthy work environment. It also helps the employees to recognize safety hazards and correct them. FSML also arrange a fire drill for practicing how a building would be evacuated in the event of a fire or other emergencies.
Our Health, Safety and Environment
37Annual Report 2020

SWOT Analysis is a strategic planning tool used to evaluate the Strengths, Weaknesses, Opportunities and Threats, involved in a project or in a business venture. It involves specifying the objectives of the business venture or project and identifying the internal and external factors that are favourable and unfavourable to achieve that objectives.
STRENGTH• In house power generation• Basic essential food• No homogeneous commodity• Ample human resource deployment sector
WEAKNESSES• High volatility in sugar-cane price and refine sugar • Minimum support price for sugar cane and no minimum
selling price for refine sugar• No comprehensive policy for sugar industry and an ad-hoc
policy is changed from time to time without thorough study
OPPORTUNITIES• Growth in consumption to drive the demand for sugar• Value addition in by-product to earn additional income• Alternative power generation at cheap rate• Improvement in sugar yield (sucrose recovery) R&D resulting
reduction in cost of production
THREATS• Government regulations are key risks to the industry• Government’s attempt to control inflation by curbing sugar prices• Diversion of cane area to alternative crops for better earning by
growers• Fall in the sugar price in both the international and domestic market• Intervention by the State Bank of Pakistan by imposing certain
conditions for short term borrowings (working capital loan)• Relaxing government levies on import of refined sugar and absence
of permanent policy of export of refined / raw sugar• The unstable political and economic scenario of Pakistan • Natural climates: sugar cane crop requires huge quantity of water
and inadequate rain causes shortage of water resulting acute shortage of cane cultivation
• Sugarcane varieties are prone to diseases that hamper the crop yield
SWOT Analysis
38 Faran Sugar Mills Limited
Faran sugar’s business activities are subject to significant risk factors that could have a material impact on strategic, operational, financial performance and compliance. Hence Board has established a structured approach by adopting effective risk corrective actions to mitigate these risks to acceptable levels. Our senior management is involved in identification of risks, implementation of corrective measures and monitoring of controls. Following is the outline of some of the material risks being faced by our company:
Sugarcane DevelopmentGiven the huge competition for sugarcane following capacity expansion to above 10,000 TCD of the mills, FSML efforts in terms of cane development activities has a key bearing on cane availability.
Procurement PlanningTypically, FSML co-ordinate with about 1,700 to 1,800 growers/farmers for procurement of sugarcane. Since area allotted to factory is termed as in-zone around 50 miles radius, so as to ensure consistent supply of cane, it becomes very important to develop harmonious and good relations with these growers so that they do not switch to alternate cash crops to other millers.
Price RiskBefore start of season, Govt. issues notification of sugarcane rate. Factory offers this rate to growers, in case of bumper crop at notified rate and in case of shortage of cane; rate may go well above notified rate. The rates are fluctuated through out the season to procure more and more cane. If cane is short, millers offers special subsidies (price & transport) to procure more cane. This factor affects the cost of sugar.
Maintenance Before start of the season every miller exerts efforts to minimize the stoppages due to technical grounds.
Recovery RiskSugar content extraction made possible by efficient milling and minimization of losses.
Given the huge competition for sugarcane following capacity expansion to above 10,000 TCD of the mills, FSML efforts in terms of cane development activities has a key bearing on cane availability.
Risk Management
39Annual Report 2020

Annual Events
Hajj BallotingFSM enjoys the Blessing to send three employees for Hajj every year since its inception, 85 Employees have since been selected through on open balloting process. In the current year one additional employee will be sent for umrah.
Free Eye Camp for General PublicArrangement of free Eye Camp at the Mill premises have been a regular event for the last 14 years. Elaborate arrangements are made at the premises and the camps are being attended by prominent Eye Surgeons equipped with Pheco Mulcification technology and all other relevant equipment and surgical instruments, Lenses, Spectacles, Medicines are also provided, in collaboration with Blind Association of Pakistan, which provide technical assistance. 11,793 Patients attended the camps and 1,476 Operations were conducted successfully. Follow up examinations are also conducted with provision of medicines to all and sundry.
Medical Care FacilitationMedical care of FSM employees is a prominent feature amongst the facilities being provided to FSM employee’s, salient features of the program envisages:i. Regular Medicine Medical Check-up.ii. Provision of Medicines, hospitalization and
Ambulance Facilities.iii. Full fledged Dispensary Equipped with qualified
Doctor and Dispensers, with all type of standardized Medicines available in addition to social security department coverage.
iv. Hepatitis B, screening of all employees including their families and contractor labour, with 3 monthly vaccinations doze to non-defected persons.
v. Hepatitis C, screening +ve cases treated with 6 months course.
vi. Blood grouping and HIV / AIDs (secret screening) and treatment thereof.
vii. Employee’s children studying at FSM School are also provided all type of vaccination and medical examination.
2019-2020
40 Faran Sugar Mills Limited

Free Medical CampsFSM is known in the vicinity, in providing free of charge medical care. Regular free medial camps are arranged with the specialist Doctors availability. Every year four medical camps are arranged in different area ranging from 2 kilometers to 25 kilometers, five thousand to five thousand five hundred patients are being provided specialist services, provision of standardized medicines. Mills Dispensary is open for general public on every Friday for medical consultation, with provision of free medicines.
Sports ActivitiesEngaging employees and their children in healthy activities have always been the preference of FSM Management. Establishment of officers and workers clubs, play grounds, provision of Sports goods, Snooker Table, Table Tennis Table, Badminton and volley Ball Nets. Proper Cricket and Football Grounds under elaborate arrangement of Pavilion, Cemented Pitch, Flood Lights are some of the main features.
Annual sport tournament of Cricket, Volley Ball, Badminton, Tug of War, Races are being arranged amongst both Officers and Workers Clubs. Prize Distribution Ceremonies are arranged after every Tournament during Off-Season.
Sports activities at FSM School are also arranged at a big grassy playground. Provision of sports grounds and annual sports day are some regular events at school.
41Annual Report 2020

“The benefits of a corporate social responsibility program are clear: higher productivity among employees, enhanced reputation in the marketplace, more robust communities and successful businesses contributing to the strength of the economy”.
At Faran Sugar, we have always been supportive in efforts to improve the literacy rate in the vicinity of our mills. We are successfully running a secondary school in Sheikh Bhirkio, where approximately 900 plus students are being prepared to be good citizens by gaining high standard of education.
To achieve one of the company’s health and wellbeing objectives, we regularly organize medical camps at our mills in which highly experienced team of Doctors, Child specialist & physicians examine the poor patients and provide free of cost medicines to everyone. FSML has been arranging eye camp for the last 13 years and adequate arrangements are made at premises and the camps are being attended by prominent Eye Surgeons equipped with Pheco Mulcification technology and all other relevant equipment and surgical instruments, Lenses, Spectacles, Medicines are also provided, in collaboration with Blind Association of Pakistan, which provide technical assistance. 11,162 Patients attended the camps and 1,374 Operations were conducted successfully. Follow up examinations are also conducted with provision of medicines to all and sundry.
FSML is known in the vicinity, in providing free of charge medical care. Regular free medial camps are arranged with the specialist Doctors availability. Every year four medical camps are arranged in different area ranging from 2 kilometers to 25 kilometers, four to five thousand patients are being provided specialist services, provision of standardized medicines. Mills Dispensary is open for general public on every Friday for medical consultation, with provision of free medicines.
During the year FSML also arrange a Tree Plantation Campaign, where various type of trees were planted by employees on MILL Site and surrounding areas, which create clean and healthy environment.
Medical care of FSM employees is a prominent feature amongst the facilities being provided to FSML employee’s, salient features of the program envisages:
1. Regular Medicine Medical Check-up.
2. Provision of Medicines, hospitalization and Ambulance Facilities.
3. Full-fledged Dispensary Equipped with qualified Doctor and Dispensers, with all type of standardized Medicines available in addition to social security department coverage.
4. Hepatitis B, screening of all employees including their families and contractor labor, with 3 monthly vaccinations doze to non-defected persons.
5. Hepatitis C, screening +ve cases treated with 6 months course.
6. Blood grouping and HIV / AIDs (secret screening) and treatment thereof.
7. Employee’s children studying at FSM School are also provided all type of vaccination and medical examination.
Corporate Social Responsibility
42 Faran Sugar Mills Limited

Gross Revenue 6,562,799,924
Net Revenue indirect Taxes 5,751,429,749 Govt Levies 811,370,175 Net (Loss)
(171,317,136)Net Profit
Cost of Sales Margin Admin, Selling & Total Cost -2.98%Other Expenses Including Taxes Return on 5,664,836,180 5,985,678,536 Assets
Net Revenue -3.75%Finance Cost 5,751,429,749 301,324,109 Other Income
21,771,141
Share in Profit from Equity accounted
investments 41,160,510
Net Revenue Return on 5,751,429,749 Asset Turnover Equity
1.26 -8.06%Current Assets 1,526,364,443
Total Assets 4,563,154,975
Owners Equity 2,124,463,912Non Current
Assets 3,036,790,532 Ownership
Ratio 46.56%
Current Liabilites Total Assets 1,916,239,959 4,563,154,975
Total Liabilites 2,438,691,063Non Current
Liabilites 522,451,104
DuPont Analysis
Direct Taxes 19,518,247
43Annual Report 2020
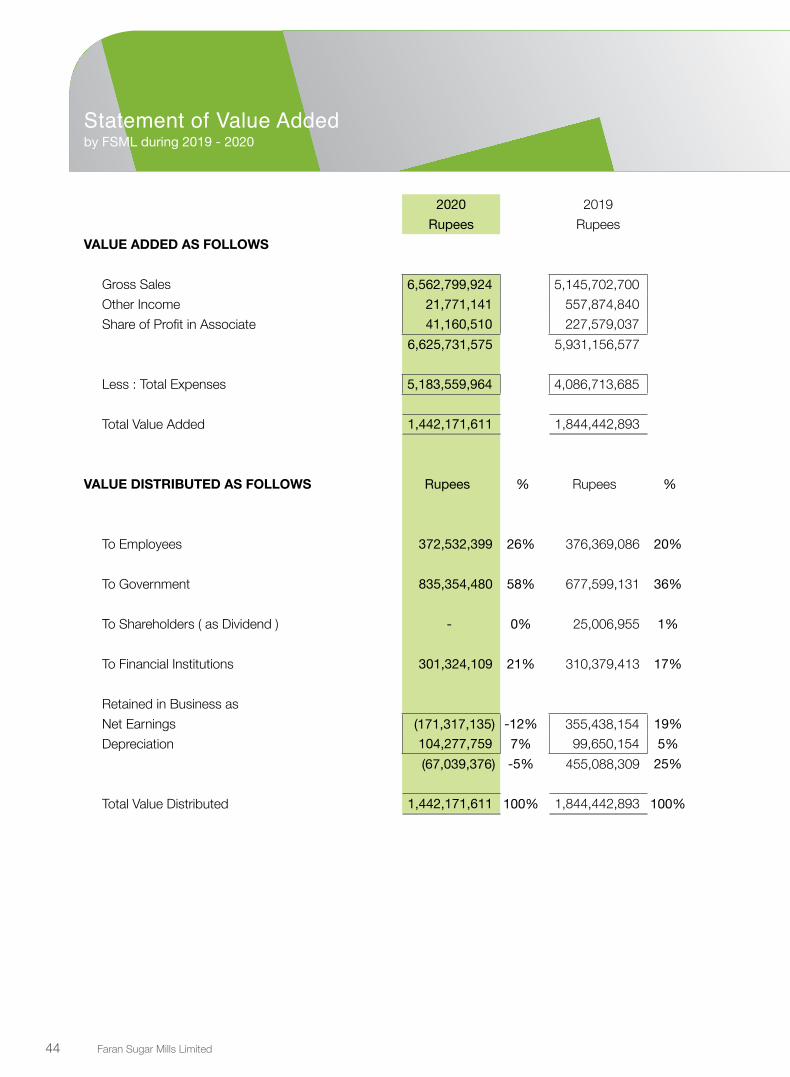
2020 2019Rupees Rupees
VALUE ADDED AS FOLLOWS
Gross Sales 6,562,799,924 5,145,702,700 Other Income 21,771,141 557,874,840 Share of Profit in Associate 41,160,510 227,579,037
6,625,731,575 5,931,156,577
Less : Total Expenses 5,183,559,964 4,086,713,685
Total Value Added 1,442,171,611 1,844,442,893
VALUE DISTRIBUTED AS FOLLOWS Rupees % Rupees %
To Employees 372,532,399 26% 376,369,086 20%
To Government 835,354,480 58% 677,599,131 36%
To Shareholders ( as Dividend ) - 0% 25,006,955 1%
To Financial Institutions 301,324,109 21% 310,379,413 17%
Retained in Business asNet Earnings (171,317,135) -12% 355,438,154 19%Depreciation 104,277,759 7% 99,650,154 5%
(67,039,376) -5% 455,088,309 25%
Total Value Distributed 1,442,171,611 100% 1,844,442,893 100%
Statement of Value Addedby FSML during 2019 - 2020
44 Faran Sugar Mills Limited

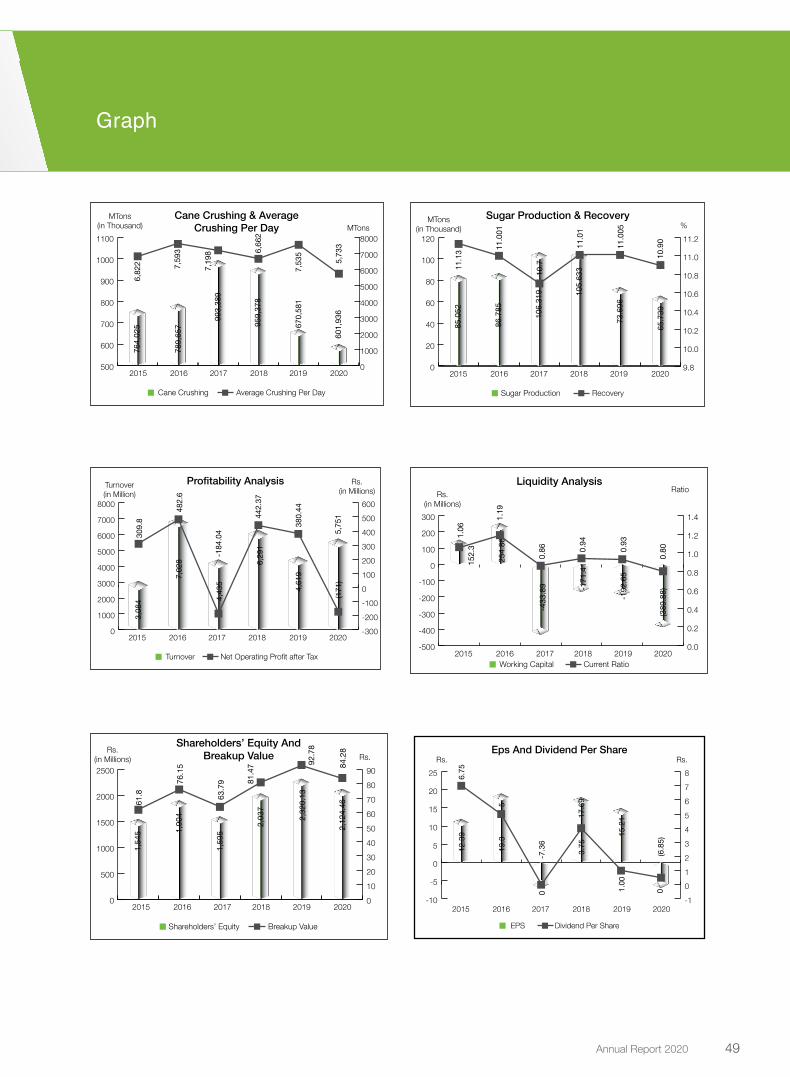
2015 2016 2017 2018 2019 2020OPERATIONAL
Cane Crushing M.tons 764,025 789,657 993,389 959,378 670,581 601,936 Processing-Raw Sugar M.tons - - - - - - Sugar Production M.tons 85,052 86,785 106,318 105,633 73,696 65,739 Molasses Production M.tons 38,235 35,825 49,347 52,081 31,459 27,475 Sugar Recovery % 11.13 11.00 10.70 11.01 11.005 10.90 Molasses Recovery % 5.00 4.54 4.97 5.42 4.69 4.56 Average Crushing / Day M.tons 6,822 7,593 7,198 6,662 7,535 5,733 Season Commenced Date 8-Dec-14 24-Nov-15 14-Nov-16 28-Nov-17 13-Dec-18 25-Nov-19Season Ended Date 29-Mar-15 6-Mar-16 31-Mar-17 20-Apr-18 11-Mar-19 8-Mar-20Duration of season ( days ) Days 112 104 138 144 89 105
PROFIT & LOSS ACCOUNT
Sales Revenue Rs. In Million 3,084.63 7,028.13 4,758.79 6,447.84 5,145.70 6,562.80 Net Revenue Rs. In Million 2,938.40 6,529.70 4,435.67 6,291.20 4,619.07 5,751.43 Gross Profit Rs. In Million 323.24 687.32 (97.05) 548.21 282.98 268.54 Selling & Admin Exp. Rs. In Million 113.15 134.72 155.06 347.71 198.12 175.65Operating Profit Rs. In Million 305.70 552.61 (252,78) 200.50 84.86 92.89 Profit before Tax Rs. In Million 296.54 630.77 (178.61) 624.38 521.23 (151.80)Profit after Tax Rs. In Million 309.77 504.84 (184.05) 442.37 380.45 (171.32)Earning before interest & Tax Rs. In Million 401.19 668.86 (37.80) 780.45 831.61 149.53
BALANCE SHEET
Share Capital Rs. In Million 250.07 250.07 250.07 250.07 250.07 250.07 Reserves Rs. In Million 1,295.38 1,654.26 1,345.25 1,787.43 2,070.06 1,874.39 Shareholders’ Equity Rs. In Million 1,545.45 1,904.33 1,595.32 2,037.38 2,320.13 2,124.46 Property Plant and Equipment Rs. In Million 1,257.18 1,530.27 1,570.41 1,730.37 1,874.59 1,884.93 Working Capital Rs. In Million 152.35 254.86 (433.90) (171.54) (192.65) (389.88)Long Term Loan Rs. In Million 166.57 252.24 204.23 309.31 242.88 247.80
CASH FLOW ANALYSISNet cash generated from operating activites Rs. In Million (102.27) 1,269.55 (2,063.79) 306.72 951.78 (163.93)Net cash used in investing activites Rs. In Million (285.35) (340.67) (226.93) (230.94) (82.82) 76.43 Net cash generated from / (used in) financing activites Rs. In Million 427.97 (544.91) 1,828.15 (33.19) (497.25) (147.86)
PROFITABILITY RATIOS
Gross Profit Ratio % 11.00 10.53 (2.19) 8.71 6.13 4.67 Net Profit / Ratio % 10.54 7.73 (4.15) 7.03 8.24 (2.98)Earning before Interst & Tax Margin % 13.65 10.24 (0.85) 12.41 18.00 2.60 Operating Leverage Ratio % (93.90) 54.59 329.45 5,174.87 24.64 334.57 Return on Share Holder Equity % 20.04 26.51 (11.54) 21.71 16.40 (8.06)Return on Capital Employed % 23.43 31.02 (2.10) 33.26 32.45 6.30
LIQUIDITY RATIOS
Current Ratio Times 1.06 1.19 0.86 0.94 0.93 0.80 Quick Ratio Times 0.03 0.33 0.05 0.09 0.20 0.18 Cash to Current Liabilites Times 0.02 0.33 0.02 0.03 0.15 0.08 Cash flow from Operations to Sales Times 0.01 0.21 (0.42) 0.09 0.29 0.05
Activity / Turnover Ratios
Inventory turnover ratio Times 1.82 4.28 3.38 3.48 3.67 7.54 No. of days in inventory Days 200.55 85.23 107.94 104.84 99.57 48.43 Debtors turnover raio Times 202.31 433.84 103.65 46.19 29.01 36.94 No of days in receviables Days 1.80 0.84 3.52 7.90 12.58 9.88 Creditors turnover ratio Times 7.03 11.40 9.83 9.31 4.51 8.14 No of days in payables Days 51.95 32.02 37.13 39.18 81.01 44.86 Operating cycle Days 150.40 54.05 74.33 73.55 31.14 13.45 Total Asset Turnover Times 0.64 1.68 0.86 1.09 0.82 1.26 Fixed Asset Turnover Times 2.34 4.27 2.82 3.64 2.46 3.05
INVESTMENT/ MARKET RATIOS
Earning per Share After Tax Rs. 12.39 20.19 (7.36) 17.69 15.21 (6.85)Earning per Share Before Tax Rs. 11.86 25.22 (7.14) 24.97 20.84 (6.07)Market value per share (year end) Rs. 80.00 144.00 79.07 75.00 36.5 50.00 Break-Up Value per Share Rs. 61.80 76.15 63.79 81.47 92.78 84.95 Price earning ratio (P/E) Times 6.46 7.13 (10.74) 4.24 2.40 (7.30)Cash Dividend per share Rs. 6.75 5.00 - 3.75 1.00 - Stock Dividend per share % 0% 0% 0% 0% 0% 0%Dividend payout % 54% 25% 0% 21% 7% 0%Dividend yeild % 8% 0.03 0.06 0.05 0.03 - Dividend cover Times 1.84 4.04 (1.47) 4.72 15.21 -
CAPITAL STRUCTURE RATIOS
Financial Leverage Ratio Times 43.13% 13.25% 143.75% 1.10 0.76 0.77 Weighted average Cost of Debt % 8.28 6.21 6.32 7.33 11.35 12.25 Debt to Equity Ratio % 10.78% 13.25% 12.80% 15.18% 0.10 0.12 Interest Cover Times 3.83 17.56 (0.27) 5.00 2.68 0.50
Investor Information - Six Year
45Annual Report 2020

2015 2016 2017 2018 2019 2020
Assets --------------------------------------------- Rs. In Thousands----------------------------------------
Non Current Assets 1,918,536 2,305,885 2,541,306 2,921,648 3,169,107 3,036,791 Current Assets 2,676,338 1,592,115 2,612,328 2,852,011 2,467,791 1,526,364 Total 4,594,874 3,898,000 5,153,634 5,773,659 5,636,898 4,563,155
Equity and Liabilities
Share Holder Equity 1,545,445 1,904,333 1,595,317 2,037,501 2,320,130 2,124,464 Non Current Liabilities 119,464 179,135 126,954 224,485 154,624 126,929 Deffered Liabilities 405,974 477,281 385,137 488,243 501,703 395,522 Current Liabilities 2,523,991 1,337,251 3,046,226 3,023,430 2,660,441 1,916,240 Total 4,594,874 3,898,000 5,153,634 5,773,659 5,636,898 4,563,155
VERTICAL ANALYSIS% of balance Sheet total 2015 2016 2017 2018 2019 2020
Assets
Non Current Assets 42% 59% 49% 51% 56% 67%Current Assets 58% 41% 51% 49% 44% 33%Total Assets 100% 100% 100% 100% 100% 100%
Equity and Liabilities
Share Holder Equity 34% 49% 31% 35% 41% 46.56%Non Current Liabilities 3% 5% 3% 4% 3% 2.78%Deffered Liabilities 9% 12% 7% 9% 9% 8.67%Current Liabilities 55% 34% 59% 52% 47% 41.99%Total Equity and Liabilities 100% 100% 100% 100% 100% 100%
HORIZONTAL ANALYSIS 2015 2016 2017 2018 2019 2020Year on Year over over over over over over
2014 2015 2016 2017 2018 2019Assets
Non Current Assets 20% 20% 10% 15% 8% -4%Current Assets 110% -41% 64% 9% -13% -38%Total Assets 60% -15% 32% 12% -2% -19%
Equity and Liabilities
Share Holder Equity 19% 23% -16% 28% 14% -8%Non Current Liabilities 103% 50% -29% 77% -31% -18%Deffered Liabilities 6% 18% -19% 27% 3% -21%Current Liabilities 125% -47% 128% -1% -12% -28%Total Equity and Liabilities 60% -15% 32% 12% -2% -19%
Composition of Balance Sheet - Assets
Property plant and equipment
Long Term Investments
Long Term Deposite
Stores and spares
Stock in Trade
Trade Debts
Shorts Term Investment
Loans, Advances and otherReceivables
Taxation - Net
Cash and bank balances
4%0%
1% 4%
15%
41%
25%
0%
8%
2%
2020
Composition of Balance Sheet - Shareholders Equity and Liabilities
Share Holder Equity
Non Current Liabilities
Deferred Liabilities
Current Liabilities
42%
46%
3%
9%
2020
Horizontal & Vertical AnalysisBalance Sheet
46 Faran Sugar Mills Limited

2015 2016 2017 2018 2019 2020
--------------------------------------------- Rs. In Thousands----------------------------------------
Net Sales 2,950,658 6,529,699 4,435,671 6,291,202 4,619,072 5,751,430 Cost of Sales (2,615,166) (5,842,377) (4,533,389) (5,742,988) (4,336,087) (5,482,886)Gross Profit 335,492 687,322 (97,718) 548,213 282,984 268,544 Operating Expenses (113,145) (134,716) (155,060) (347,713) (198,122) (175,651)Other Operating Expenses (69,035) (39,180) (11,377) (40,378) (38,708) (6,299)Other Operating Income 154,523 17,005 136,050 324,826 557,875 21,771 Operating Profit 307,835 530,430 (128,105) 484,948 604,030 108,365 Share in profit of associate 95,494 116,258 90,305 295,537 227,579 (301,324)Finance Cost (104,656) (38,095) (140,807) (156,099) (310,379) 41,161 Profit / (Loss) before taxation 298,673 608,594 (178,607) 624,387 521,229 (151,799)Taxation 13,227 (125,930) (5,439) (182,016) (140,784) (19,518)Profit / (Loss) after taxation 311,900 482,663 (184,046) 442,371 380,445 (171,317)
VERTICAL ANALYSIS 2015 2016 2017 2018 2019 2020% of Sales
Net Sales 100.00% 100.00% 100.00% 100.00% 100.00% 100.00%Cost of Sales -88.63% -89.47% -102.20% -91.29% -93.87% -95.33%Gross Profit 11.37% 10.53% -2.20% 8.71% 6.13% 4.67%Operating Expenses -3.83% -2.06% -3.50% -5.53% -4.29% -3.05%Other Operating Expenses -2.34% -0.60% -0.26% -0.64% -0.84% -0.11%Other Operating Income 5.24% 0.26% 3.07% 5.16% 12.08% 0.38%Operating Profit 10.43% 8.12% -2.89% 7.71% 13.08% 1.88%Share in profit of associate 3.24% 1.78% 2.04% 4.70% 4.93% -5.24%Finance Cost -3.55% -0.58% -3.17% -2.48% -6.72% 0.72%Profit / (Loss) before taxation 10.12% 9.32% -4.03% 9.92% 11.28% -2.64%Taxation 0.45% -1.93% -0.12% -2.89% -3.05% -0.34%Profit / (Loss) after taxation 10.57% 7.39% -4.15% 7.03% 8.24% -2.98%
HORIZONTAL ANALYSIS 2015 2016 2017 2018 2019 2020Year on Year over over over over over over
2014 2015 2016 2017 2018 2019
Net Sales -35.32% 121.30% -32.07% 41.83% -26.58% 24.51%Cost of Sales -38.47% 123.40% -22.21% 26.70% -24.50% 26.45%Gross Profit 7.51% 104.87% -114.22% -664.90% -48.38% -5.10%Operating Expenses -29.02% 19.07% 15.10% 124.24% -43.02% -11.34%Other Operating Expenses 226.69% -43.25% -70.96% 254.91% -4.14% -83.73%Other Operating Income 31.05% -88.99% 700.03% 139.94% 71.75% -96.10%Operating Profit 23.40% 72.31% -124.15% -478.55% 24.56% -82.06%Share in profit of associate 85.59% 21.74% -22.32% 227.27% -22.99% -232.40%Finance Cost 24.55% -63.60% 269.62% 10.86% 98.84% -113.26%Profit / (Loss) before taxation 37.71% 103.77% -129.35% -449.59% -16.52% -129.12%Taxation -122.53% -1052.07% -95.68% 3246.39% -22.65% -86.14%Profit / (Loss) after taxation 97.19% 54.75% -138.13% 340.36% -14.00% -145.03%
Horizontal & Vertical AnalysisProfit and Loss Account
47Annual Report 2020

Variance Analysis of Quarterly Profit and Loss Account 1st Qtr 2nd Qtr 3rd Qtr 4th Qtr 2nd Qtr over
1st Qtr3rd Qtr over
2nd Qtr4th Qtr over
3rd Qtr-----------------------------------Rupees-----------------------------------
Sales-Net 1,517,870,795 994,420,883 1,362,676,003 1,876,462,068 34.49% 37.03% 37.70%
Cost of Sales (1,434,321,654) (1,071,203,711) (1,215,538,867) (1,761,821,930) 25.32% 13.47% 44.94%
Gross Profit 83,549,141 (76,782,828) 147,137,136 114,640,138 191.90% -291.63% -22.09%
Operating Expenses (44,286,088) (52,363,229) (31,966,738) (47,035,157) -18.24% -38.95% 47.14%
Other Expenses (3,905,809) (2,639,183) 236,744 9,443 32.43% -108.97% -96.01%
Finance Cost (39,580,335) (94,159,298) (103,887,231) (63,697,245) -137.89% 10.33% -38.69%
Other Income 5,816,276 6,826,014 2,110,280 7,018,571 -17.36% -69.08% 232.59%
Share in Profit form equity accounted investment-net 58,691,667 (67,857,162) 83,571,667 (33,245,661) 215.62% -223.16% -139.78%
Profit before taxation 60,284,852 (286,975,686) 97,201,858 (22,309,911) 576.03% -133.87% -122.95%
Taxation (19,880,762) 111,785,451 (34,707,883) (76,715,054) 662.28% -131.05% 121.03%
Profit after taxation 40,404,090 (175,190,235) 62,493,975 (99,024,965) 533.60% -135.67% -258.46%
Interim Result with Annual Result As on Dec-31, 2019
As on Mar-31, 2020
As on Jun-30, 2020
As on Sep-30, 2020
% Variance in Annual from
1st Qtr 2nd Qtr 3rd Qtr
-----------------------------------Rupees-----------------------------------
Sales-Net 1,517,870,795 2,512,291,678 3,874,967,681 5,751,429,749 278.91% 128.93% 48.43%
Cost of Sales (1,434,321,654) (2,505,525,365) (3,721,064,233) (5,482,886,163) 282.26% 118.83% 47.35%
Gross Profit 83,549,141 6,766,313 153,903,448 268,543,586 221.42% 3868.83% 74.49%
Operating Expenses (44,286,088) (96,649,317) (128,616,055) (175,651,212) 296.63% 81.74% 36.57%
Other Expenses (3,905,809) (6,544,992) (6,308,248) (6,298,805) 61.27% -3.76% -0.15%
Finance Cost (39,580,335) (133,739,633) (237,626,864) (301,324,109) 661.30% 125.31% 26.81%
Other Income 5,816,276 12,642,290 14,752,570 21,771,141 274.31% 72.21% 47.58%
Share in Profit form equity accounted investment 58,691,667 (9,165,495) 74,406,171 41,160,510 -29.87% -549.08% -44.68%
Profit before taxation 60,284,852 (226,690,834) (129,488,978) (151,798,889) -351.80% -33.04% 17.23%
Taxation (19,880,762) 91,904,689 57,196,807 (19,518,247) -1.82% -121.24% -134.12%
Profit after taxation 40,404,090 (134,786,145) (72,292,171) (171,317,136) -524.01% 27.10% 136.98%
1st Qtr 2nd Qtr 3rd Qtr 4th Qtr
Sales-Net
Rs. i
n M
illion
s
Gross Profit Profit before taxation Profit after taxation
(250)
0
250
500
750
1,000
1,250
1,500
1,750
2,000
2,250
Quarterly Performance Analysis
48 Faran Sugar Mills Limited
0
1000
2000
3000
4000
5000
6000
7000
8000
2015 2016 2017 2018 2019 2020
Profitability Analysis
309.
8
482.
6
-184
.04
442.
37
380.
44
5,7
51
3,08
4
7,02
8
4,43
5
6,29
1
4,61
9
(171
)
Turnover(in Million)
Rs.(in Millions)
Turnover Net Operating Profit after Tax
-300
-200
-100
0
100
200
300
400
500
600
-500
-400
-300
-200
-100
0
100
200
300
2015 2016 2017 2018 2019 2020
Liquidity Analysis15
2.3
254.
86
-433
.89 -1
71.4
1
-192
.65
(389
.88)
1.06
1.19
0.86 0.
94
0.93
0.8
0
Rs.(in Millions)
Ratio
Working Capital Current Ratio
0.0
0.2
0.4
0.6
0.8
1.0
1.2
1.4
0
500
1000
1500
2000
2500
0
10
20
30
40
50
60
70
80
90
2015 2016 2017 2018 2019 2020
Shareholders’ Equity AndBreakup Value
1,54
5 1,90
4
1,59
5
2,03
7
2,32
0.13
2,1
24.4
6 61.8
76.1
5
63.7
9 81.4
7 92.7
8
84.
28 Rs.
(in Millions) Rs.
Shareholders’ Equity Breakup Value
-10
-5
0
5
10
15
20
25Rs. Rs.
-1
0
1
2
3
4
5
6
7
8
2015 2016 2017 2018 2019 2020
Eps And Dividend Per Share
6.75
5
0 1.00
0
12.3
9
19.3
-7.3
6
3.75
17.6
9
15.2
1
(6.8
5)
EPS Dividend Per Share
500
600
700
800
900
1000
1100
0
1000
2000
3000
4000
5000
6000
7000
8000
2015 2016 2017 2018 2019 2020
Cane Crushing & AverageCrushing Per Day
764,
025
993,
389
789,
657 95
9,37
8
670,
581
601
,936
6,66
2
7,53
5
5,7
33
7,19
8
7,59
3
6,82
2
MTons(in Thousand) MTons
Cane Crushing Average Crushing Per Day
0
20
40
60
80
100
120
MTons(in Thousand)
9.8
10.0
10.2
10.4
10.6
10.8
11.0
11.2
2015 2016 2017 2018 2019 2020
Sugar Production & Recovery
85.0
52
86.7
85
106.
319 10
5.63
3
73.6
96
65.7
39
11.0
1
11.0
05
10.9
0
10.711
.13 11
.001
%
Sugar Production Recovery
Graph
49Annual Report 2020
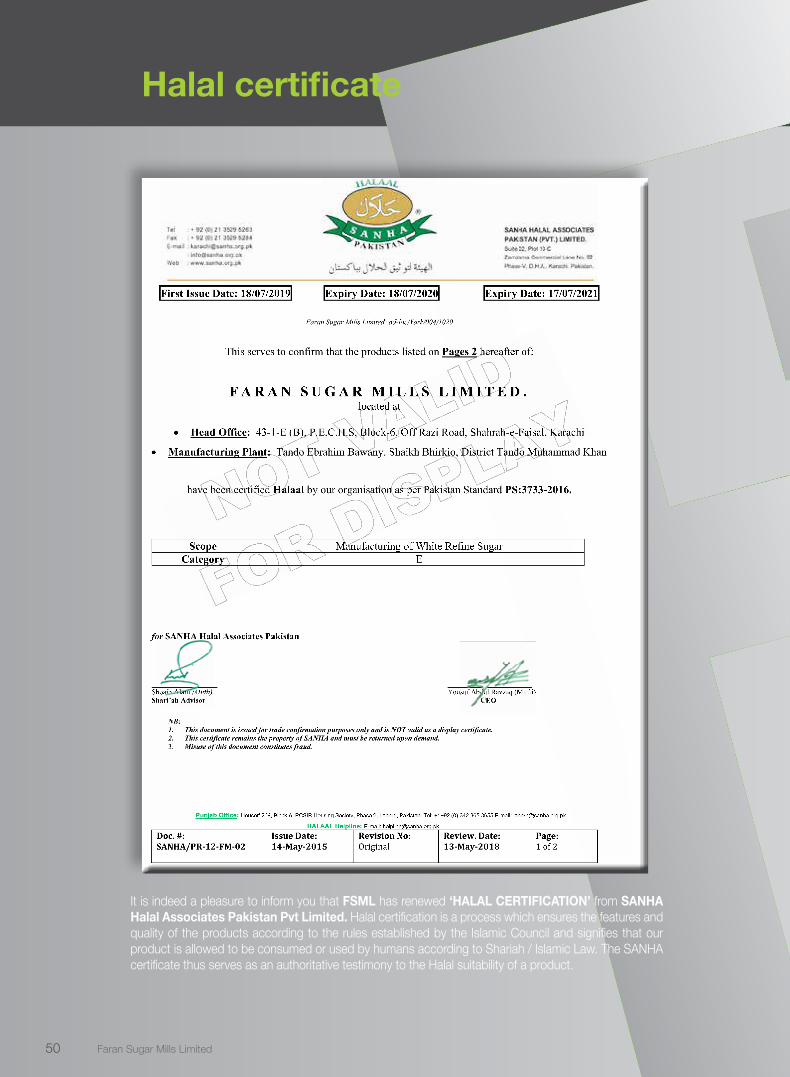
First Issue Date: 18/07/2019 Expiry Date: 18/07/2020 Expiry Date: 17/07/2021
Faran Sugar Mills Limited: ad-loc/Yark/004/1020
Doc. #: SANHA/PR-12-FM-02
Issue Date: 14-May-2015
Revision No: Original
Review. Date: 13-May-2018
Page: 1 of 2
Punjab Office: House# 269, Block A, PCSIR Housing Society, Phase 2, Lahore, Pakistan. Tel: +: +92 (0) 342 365 3655 E-mail: [email protected] HALAAL Helpline: E-mail: [email protected]
This serves to confirm that the products listed on Pages 2 hereafter of:
F A R A N S U G A R M I L L S L I M I T E D . located at
• Head Office: 43-1-E (B), P.E.C.H.S, Block-6, Off Razi Road, Shahrah-e-Faisal, Karachi
• Manufacturing Plant: Tando Ebrahim Bawany, Shaikh Bhirkio, District Tando Muhammad Khan
have been certified Halaal by our organisation as per Pakistan Standard PS:3733-2016.
NB: 1. This document is issued for trade confirmation purposes only and is NOT valid as a display certificate. 2. This certificate remains the property of SANHA and must be returned upon demand. 3. Misuse of this document constitutes fraud.
Scope Manufacturing of White Refine Sugar Category E
It is indeed a pleasure to inform you that FSML has renewed ‘HALAL CERTIFICATION’ from SANHA Halal Associates Pakistan Pvt Limited. Halal certification is a process which ensures the features and quality of the products according to the rules established by the Islamic Council and signifies that our product is allowed to be consumed or used by humans according to Shariah / Islamic Law. The SANHA certificate thus serves as an authoritative testimony to the Halal suitability of a product.
Halal certificate
50 Faran Sugar Mills Limited

VIS Credit Rating Company Limited www.vis.com.pk
RATING REPORT
Faran Sugar Mills Limited REPORT DATE: March 20, 2020 RATING ANALYSTS: Talha Iqbal [email protected] Madeeh Ahmed [email protected] COMPANY INFORMATION
Incorporated in 1981 External auditors: M/s Rahman Sarfaraz Rahim Iqbal Rafiq Chartered Accountants
Public Listed Company Chairman: Muhammad Omar Amin Bawany Key Shareholders : Chief Executive Officer: Ahmed Ali Bawany Ahmed Ali Bawany - 16.10% Rukhsana Omar - 8.52% National Investment Unit Trust - 8.48% Shahdia Amin - 8.15% Ayesha Amin - 7.02% Gulshanara Amin - 5.94% Roshan Ara Mohd Amin - 5.50% APPLICABLE METHODOLOGY(IES) Applicable Rating Criteria: Corporates (May, 2016) https://www.vis.com.pk/kc-meth.aspx
RATING DETAILS
Rating Category Latest Rating Previous Rating
Long-term
Short-term
Long-term
Short-term
Entity A- A-2 A- A-2 Rating Outlook Stable Stable Rating Date March 20 , 2020 February 15, 2019
V I S Credit Rating Company Limited performed credit rating of FSML and assigned ‘A- / A-2’ (A minus / A – Two). The long term rating of ‘A –‘signifies good credit quality with adequate protection factors. Risk factors are considered variable if changes occur in the economy. Short term rating of ‘A-2’ depicts good certainty of timely payment. Liquidity factors and company fundamentals are sound with good access to capital markets, risk factors are small and outlook on the assigned rating is ‘Stable’.
Credit Rating
51Annual Report 2020

Chairman’s Review ReportFor the year ended September 30, 2020
It is my pleasure to present to the shareholders, the review of the financial performance of the Company and overall performance of the Board and the effectiveness of its role to attain the organization’s aims and objectives.
The outbreak of the Covid-19 pandemic had a major impact on our economy, but it did not affect operation activities of sugar industry, however, sugar demand remained sluggish as well as selling price remained under pressure. In view of the COVID-19 pandemic, the State Bank of Pakistan (SBP) launched numerous financing schemes to minimize impact of COVID-19 pandemic to local economy.
We have also availed pay-roll financing and Temporary Economic Refinance Facility (TERF) under these concessionary SBP financing schemes and reviewing further cost saving projects for sustainability of the business and long term benefits of the Company.
The season 2019-20 was very stressful and challenging due to shortage of cane, exorbitant cane rate due to lower crop size and subdued sugar price. However, sugar price jumped in last quarter of the year under reviewed due to supply and demand gap. Hence, we, enabled to curtail our loss despite of these difficult business conditions.
The composition of the Board of Directors reflects mix of varied backgrounds and rich experience in the fields of business, finance, banking and regulations. The Board carried out the annual review of its effectiveness and performance on a self-assessment basis. The Board also ensures compliance of all regulatory requirements by the Management. The Board is ably assisted by its Committees. The Audit Committee reviews the financial statements and ensures that the accounts fairly represent the financial position of the Company. It also ensures effectiveness of internal controls. The HR Committee overviews HR policy framework and recommends for selection and compensation of senior management team.
On behalf of the board of Directors, I wish to acknowledge the contribution of all our staff members in the success of the Company.
Muhammad Omar Amin BawanyChairman
Karachi, January 28, 2021
52 Faran Sugar Mills Limited

Directors’ ReportFor the year ended September 30, 2020
Dear Shareholders,
In the name of ALLAH, the most gracious and most merciful, your directors present Annual Report and Audited Financial Statements of the Company for the year ended September 30, 2020.
Financial Performance:The outbreak of the Covid-19 pandemic had a major impact on the global economy, including Pakistan, as economic activities were significantly impaired. Sugar demand also remained sluggish as well as selling price remained under pressure. The government intervention to sugar sector also made situation worst. However, demand and selling price improved in last quarter of the year under review due to demand supply gap.
Financial results are summarized as follows:2020 2019
Rs. '000 Rs. '000Local Sales 5,940,734 4,653,414Export Sales 622,065 492,288Gross sales 6,562,799 5,145,702(Loss) / Profit before taxation (192,959) 293,650Share in profit from equity accounted investments-Net 41,160 227,579
(151,799) 521,229Less: TaxationCurrent (124,777) (99,508)Prior year (1,573) (5,896)Deferred asset / (tax ) 106,832 (35,380)
(19,518) (140,784)(Loss) / Profit after Taxation (171,317) 380,445(Loss) / Earnings per Share (6.85) 15.21
Gross sales during the period were Rs. 6.562 billion including export sale of Rs 622 million vis-à-vis Rs. 5.145 billion including export sale of Rs. 492.288 for the corresponding period of 2018-19; increase by 27 % mainly due to higher selling price as compared to previous year. But higher selling price did not offset overall cost of production which remained high mainly due to exorbitant rate of sugar-cane.The industry ended up paying extremely high competitive rates for sugarcane due to supply and demand gap as crop size was shorter in this season-2019-20. The profitability of sugar sector is driven mainly by the margin between cane price, main raw material and refined sugar. And, there is a certain level of prices volatility involved given their cyclical nature. Finance cost was very high due to massive short-term borrowing as well as increase in financing rate, but remained almost at same level of previous year. Huge financing obtained during the year due to sluggish sales and stuck up export subsidy. Domestic selling price of refined sugar was very depressed during the crushing season 2019-20. Covid-19 Pandemic has also slowed down the whole economy and caused to sluggish sale of sugar in the domestic market. The distribution & selling expenses decreased significantly as compared to last year due to decrease in export related cost. Hence, the company sustained loss due to factors narrated above.
Unicol Limited did not continue its momentum and showed moderate profitability due to delay in shipments. Uni-Food limited reported a loss as projected due to its limited operation and continuous investment in creating a brand image and its distribution network in order to increase its sales volume.
53Annual Report 2020

Directors’ ReportFor the year ended September 30, 2020
Operational Performance:
For season 2019-20, the support prices were fixed at Rs190 for per 40 kg for Punjab and Khyber Pukhtunkhwa and Rs192 for per 40 kg for Sindh; again higher price of sugarcane (controlled by Government) with no mechanism for corresponding fluctuation in the prices of sugar. We had to pay very high competitive price of cane rather to pay support price of Rs.192 per 40 kg as fixed by the Sindh Government to run our mills at optimal capacity.
The season 2019-20 was very stressful and challenging due to shortage of cane and high volatility in cane rate due to lower crop size. Hike in selling price of refined sugar mainly attributed to expensive cane bought by millers at average exorbitant rate of cane Rs250- 280 per 40kg.
Pakistan has experienced surplus production in the past years in comparison to its domestic consumption. But since last year, sugarcane area and production are on a decreasing trend due to multiple factors. Sugar production of the country for the season 2019-20 was also reported to down by 7% to 4.8% million metric tons from 5.26 million metric tons produced in the previous season 2018-19. The mills operating in the Sindh zone crushed 14.28 million metric tons of sugar cane against 15.930 million metric tons in the previous season 2018-19, down by 11% and produced 1.459 million metric tons of sugar with average recovery of 9.89% against 1.719 million metric tons produced with average recovery 10.47% in the previous season 2018-19.
We started our mills on 25 November 2019, but majority of mills of Sindh Zone had to shut down due to non-supply/ insufficient quantum of cane. FSML also stopped cane crushing on 21st December 2019 due to inadequate supplies of cane at very high rate. We resumed our mills on 31st December 2019, but our mills’ cane crushing and sugar production were also down by around 10% due to insufficient availability of cane. The comparative summarized operating result of your mills for season-2019-20 is as follows:
Season 2019-20 Season 2018-19Season commenced Date 25 - November – 2019 13 – December - 2018Season end Date 08 – March - 2020 11 – March - 2019Duration of Operation Days 105 89Sugar-cane Crushed Metric tons 601,936 670,581Sugar Production Metric tons 65,739 73,696Recovery % 10.900 11.005Minimum Support Price Per 40 kg 192 182
Considering the shortage of sugar in the month of October / November 2020, the Federal government allowed import of sugar to private sector and also abolished all import levies on import of sugar in order to maintain and control domestic market price and allowed to import 300,000 tons refined sugar through TCP with exemption of sales tax and income tax and 300,000 tons with concessional withholding tax of 0.25% and 1% sales tax in a bid to lower its domestic prices. But price of sugar remained higher after the import of sugar due to supply and demand gap and traders taken full advantages of exemption/ relaxation in import duties / taxes; but local producer had to pay all local taxes that may collapse local industry due to this discrimination.
SANHA Halal Associates Pakistan Pvt. Limited has renewed ‘HALAL CERTIFICATION’. Halal certification is a process which ensures the features and quality of the products according to the rules established by the Islamic Council and signifies that our product is allowed to be consumed or used by humans according to Shariah / Islamic Law. The SANHA certificate thus serves as an authoritative testimony to the Halal suitability of a product.
54 Faran Sugar Mills Limited

Liquidity management and capital structure:
Your Company has been resorting all its financial needs since financial year 2004-05 through only Shariah Compliant Products from prominent Islamic banks and providing HALAL earnings to its stakeholders. The Company has substantial approved finance facilities limit around 5 billion under various products of Islamic financing to meets its huge working capital needs as well as long term financing. In view of the COVID-19 pandemic, the State Bank of Pakistan (SBP) has taken number of decisions and announced variety of financing schemes to bolster the economy to minimize impact of Covide-19 pandemic to local economy which included concessional financing, gradually decrease in policy/ discount rate, relaxation in certain rules, deferral in loan repayment, procedures facilitation paper-based clearing operations and waiving charges for online fund transfers etc. We have also availed pay-roll financing and Temporary Economic Refinance Facility (TERF) under these concessionary SBP financing schemes under Islamic products. Alhamdulillah, we are RIBA / INTEREST FREE COPORATE ENTITY. Huge financing was obtained during the year due to sluggish sales and stuck up export subsidy. Nevertheless, we managed efficiently our financing requirements to ensure to discharge all obligations timely.
During the year, V I S Credit Rating Company Limited performed credit rating and maintained assigned rating of previous year i.e. ‘A- / A-2’ (A minus / A – Two). The long term rating of ‘A –‘signifies good credit quality with adequate protection factors. Risk factors are considered variable if changes occur in the economy. Short term rating of ‘A-2’ depicts good certainty of timely payment. Liquidity factors and company fundamentals are sound with good access to capital markets, risk factors are small and outlook on the assigned rating is ‘Stable’. Expansion and Modernization Projects:
The Company cautiously review its required capital expenditure and expending only in selective area of cost saving projects or major necessary overhauling on the basis of projected future cash inflows and IRR for sustainability of the business and long term benefits of the Company. The Company has been extended approval of long term financing of 600 million under Temporary Economic Refinance Facility (TERF), concessional financing scheme of SBP, for various cost saving projects and considering to avail further financing to achieve same objectives.
Unicol Limited - Distillery Project:
During the year, the sales revenue of the Ethanol segment recorded at Rs. 5.70 billion (2019: Rs. 5.31 billion) which is 7.34% higher than the last year. This was mainly due to the significant appreciation of US Dollar against Pak Rupee. The sales revenue of CO2 segment recorded at Rs. 119.30 million (2019: Rs. 192.69 million) which is 38.09% lower than the last year. This was mainly due to the demand and supply imbalance in the market. The gross sale recorded at 5.82 billion (2019: Rs. 5.50 billion) which is 5.85% higher than the last year. The cost of sales recorded to Rs. 4.70 billion (2019: Rs. 3.79 billion) which is 23.86% higher than the last year. The gross profit margin for the year recorded at 19% (2019: 31%) which is 12% lower as compared to last year. After taking into consideration various expenses and taxes the Company was able to post an after tax profit of Rs. 523.76 million (2018-19: Rs. 1,109.76 million), out of which our shares of profit of Rs. 174.5 million (2018-19: Rs.369.9 million) has been reflected in shares of profit from equity accounted investees-net.
The Board of Directors of Unicol at its meeting held on December 08, 2020 has proposed a final cash dividend @12.5% (Rs.1.25 per share) for the year ended September 30, 2020. This is in addition to the interim cash dividends already paid @ 45% (Rs. 4.5per share) aggregated to 57.5%.
Faran Power Limited- 26.5 MW bagasse base High Pressure power project had achieved major milestones- Tariff approval, LOS and generation license. But project has been halted due to CPPA
55Annual Report 2020

Directors’ ReportFor the year ended September 30, 2020
denial to sign IA and PPA. The Company is taking appropriate action to initiate the Project.
UniEnergy Limited – a joint venture 50MW wind power project, has been granted Letter of Intent and formally allotted land for setting up the project at Jhimpir, district Thatta The Company is in the start-up phase and has not yet commenced its operations, the principal activity of UEL will be to build, operate and maintain wind power generating project of 50 Mega Watts for the generation and supply of electric power in relation thereof. The Company obtained Letter of Intent from Alternative Energy Development Board on October 16, 2015, which was extended upto April 25, 2019. Uni-Energy has applied for further extension, and the management is hopeful that it will be extended in due course. FSML has made an equity investment of Rs. 19.99 million.
Uni-Food Industries Limited (UFIL) - Uni-Food Industries Limited (UFIL) - joint venture food project has started its commercial production in March 2018 of its signature brand “GOOD GOODIES”. The company reported Rs. 387.7 million loss for its financial year ended 30th June 2020 (2018-19: Rs Rs.417 million), out of which our adjusted shares of loss of Rs. 133.664 (2018-19: Rs.142.413 million) has been reflected in shares of loss from equity accounted investees-net. Presently, the Company is facing immense competition from the existing market players and marketing challenges due to COVID/lockdown situation in the country. However, rigorous efforts are being made to establish a nationwide distribution network & a brand image and add new products to achieve better in sale volume and to reduce cost.
We are eagerly pursuing these projects, but, our focus will never divert from our base / core operations.
Financial Reporting Frame Work:In compliance with the requirements of Revised Code of Corporate Governance 2019, your Directors’ report that:
vThe financial statements prepared by the management present fairly its state of affairs, the result of its operation, cash flows and changes in equity.
vThe company has maintained proper books of accounts as required by the law.
vAppropriate accounting policies have been consistently applied in preparation of financial statements and accounting estimates are based on reasonable and prudent judgment.
vThe accounting policies and disclosures are in accordance with the International Financial Reporting Standards (IFRS) as applicable in Pakistan, unless otherwise disclosed.
vThe system of internal control is sound in design and effectively implemented and being monitored.
vThere is no significant doubt as to the ability of the Company to continue as a going concern.
vThere has been no material departure from the best practices of corporate governance, as detailed in the listing regulations.
vThe summary of key operating and financial data and graphic presentation of the important statistics for last six year annexed.
vInformation against outstanding duties, levies and charges is given in the notes to the Accounts
vThe Company operates funded Provident fund scheme. The fair value of assets based on latest un- audited accounts of the fund amounted to Rs 59.31 million.
56 Faran Sugar Mills Limited
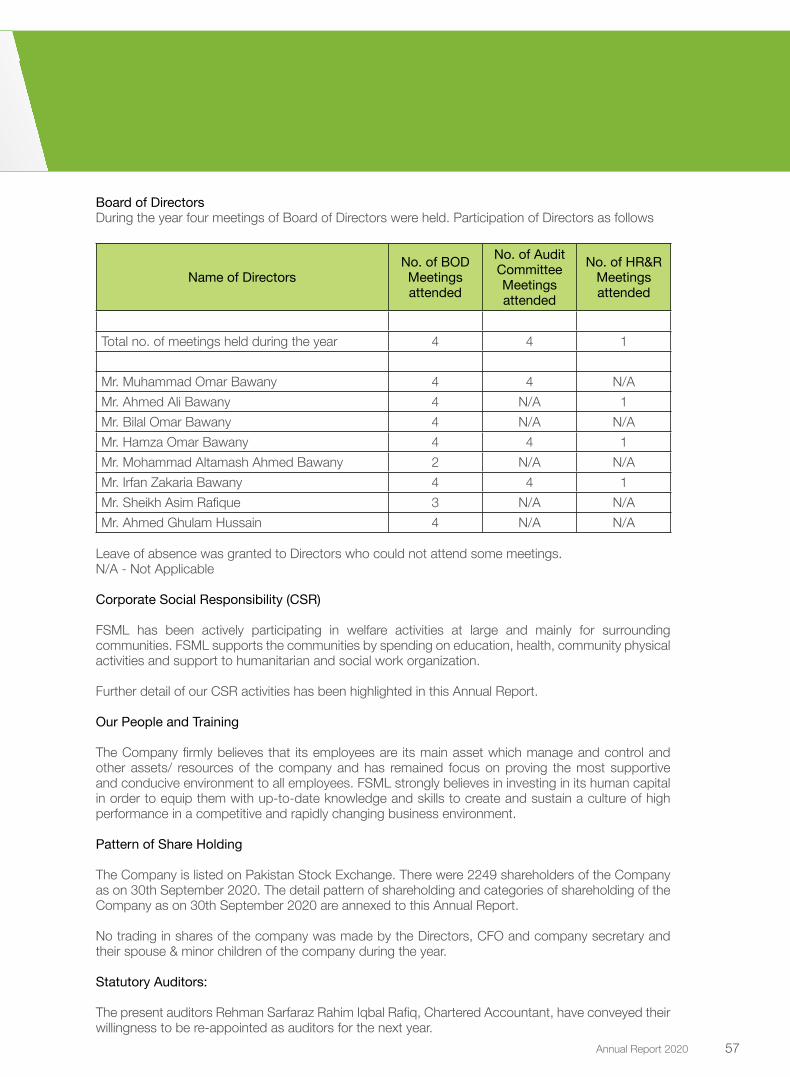
Board of DirectorsDuring the year four meetings of Board of Directors were held. Participation of Directors as follows
Name of DirectorsNo. of BOD Meetings attended
No. of Audit Committee Meetings attended
No. of HR&R Meetings attended
Total no. of meetings held during the year 4 4 1
Mr. Muhammad Omar Bawany 4 4 N/AMr. Ahmed Ali Bawany 4 N/A 1Mr. Bilal Omar Bawany 4 N/A N/AMr. Hamza Omar Bawany 4 4 1Mr. Mohammad Altamash Ahmed Bawany 2 N/A N/AMr. Irfan Zakaria Bawany 4 4 1Mr. Sheikh Asim Rafique 3 N/A N/AMr. Ahmed Ghulam Hussain 4 N/A N/A
Leave of absence was granted to Directors who could not attend some meetings.N/A - Not Applicable
Corporate Social Responsibility (CSR)
FSML has been actively participating in welfare activities at large and mainly for surrounding communities. FSML supports the communities by spending on education, health, community physical activities and support to humanitarian and social work organization.
Further detail of our CSR activities has been highlighted in this Annual Report.
Our People and Training
The Company firmly believes that its employees are its main asset which manage and control and other assets/ resources of the company and has remained focus on proving the most supportive and conducive environment to all employees. FSML strongly believes in investing in its human capital in order to equip them with up-to-date knowledge and skills to create and sustain a culture of high performance in a competitive and rapidly changing business environment.
Pattern of Share Holding
The Company is listed on Pakistan Stock Exchange. There were 2249 shareholders of the Company as on 30th September 2020. The detail pattern of shareholding and categories of shareholding of the Company as on 30th September 2020 are annexed to this Annual Report.
No trading in shares of the company was made by the Directors, CFO and company secretary and their spouse & minor children of the company during the year.
Statutory Auditors:
The present auditors Rehman Sarfaraz Rahim Iqbal Rafiq, Chartered Accountant, have conveyed their willingness to be re-appointed as auditors for the next year.
57Annual Report 2020

Directors’ ReportFor the year ended September 30, 2020
Contribution towards Economy:
Your company is a noteworthy contributor to the national economy. The Company has contributed to the national exchequer Rs.835 million (2018-19 Rs. 678 million ) on account of Sales tax / Federal excise duty, Income Tax and other statutory levies which are 58% of value generated by the Company.
DividendIn light of company financial and cash flow position, future projected inflows and keeping in mind the upcoming projects, we have decided to recommend no cash dividend / stock dividend for the year under reviewed.
Post Balance Sheet Events
There has been no material events since September 30, 2020 to the date of this report except:
- orders passed in terms of section 122(1) of the Income tax ordinance 2001 creating exaggerated income tax demand of Rs. 19.21 billion for four tax years on frivolous and flimsy grounds without applying judicial mind and due process of law as disclosed in detail in Note 20.1 of Audited Accounts under reviewed and;
- Declaration of final cash dividend disclosed in notes to the Accounts, if any. The effect of such declaration shall be reflected in next year’s financial statements.
Next Season and Future Outlook
Pakistan has experienced surplus production in the past many years in comparison to its domestic’s consumption. But since last two years, sugarcane area and production are on a decreasing trend due to multiple factors and carry forward stock also exhausted in the country. The country exported a huge quantity in previous seasons due to surplus production and earned precious foreign exchange for the country. But government had to import sugar in last quarter of 2020 due to shortage of sugar. The government has decided to import another 0.5 million tonnes of sugar in the ongoing season 2020-21 to overcome the shortage of refined sugar. The government is also mulling to exempt commercial import of sugar from duties and taxes by invoking food security provisions. However, provisional estimates suggest that local production of sugar will be higher than last season. But owing to low carryover stocks, TCP, in consultation with provinces, will be advised to initiate imports early and provinces may be advised to release this sugar at retail stage at subsidised and control rates.
The sugar industry is regulated and the Company operates in regulated environment. The Government policies and regulations affect our operations and profitability to a large extent. The support prices for the sugarcane are fixed by the provincial governments every year and it is increased without anticipating refined sugar price. Sugarcane is the main ingredient of sugar industry and comprise 80-85% of the total cost of production. High government taxes also contributes in enhancing the cost. For ongoing season 2020-21, the support prices have been fixed at Rs. 200 for per 40 kg for Punjab and Khyber Pakhtunkhwa and Rs. 202 for per 40 kg for Sindh; again higher price of sugarcane (controlled by Government) with no mechanism for corresponding fluctuation in the prices of sugar.
Majority of sugar Industry started its crushing in November 2020 to overcome shortage of sugar in the country. We started our mills on 23 November 2020. But growers were not willing to supply at support price and asking very high price and millers are paying very exorbitant rate to run their mill at optimum capacity and there is no any government agency to control this cane price which will ultimately result in hefty cost of refined sugar.
58 Faran Sugar Mills Limited

In ongoing season 2020-21, the Federal Board of Revenue (FBR) had deputed again its staff under section 40B of Sales Tax Act 1990 in factory premises to keep surveillance to confirm actual production and stock position of all sugar mills of the country. With willingness and support of Pakistan Sugar Mills Association (PSMA), the FBR initiated to implement Video Analytical System (VAS) for electronic monitoring sugar production in real time under section 40C of Sales Tax Act 1990 read with S.R.O 889(I)/2020 dated 21st September 2020.
As there is also improvement in domestic selling price of refined sugar in response to higher production cost of refined sugar due to tremendous cost of cane, and decline in KIBOR rate, initiate of cost saving projects as well as anticipation of improvement in Unicol profitability, we expect, Insha Allah, the bottom line to show better results on year-to-year basis
Acknowledgement
The Board of Directors places on record its appreciation for the support by its shareholders, valued customers, growers and financial institutions. Our management team, staff members and workers also deserve a vote of thanks for all of their continued dedication and hard work.
May Allah SWT bestow the strength upon us to overcome these abnormal situations successfully, AMEEN!
On behalf of the Board of Directors
Ahmed Ali Bawany Chief Executive
Karachi: January 28, 2021
59Annual Report 2020

س�ال �اء�اللہ، ش
�ن�ا� کریں، توقع کی بہتری میں منافع یونیکول س�اتھ س�اتھ کے کرنے شر�وع منصوبے کے بچت کی
تلاگ� ہے، بہتری بھی میں قیمت
ہیں- پر�امید لئے کے کرنے ہ�ر �ا�ظ
� نتائج بہتر پر بنیا�د�وں س�ال بہ
�اعتر�اف
ہما�ری ہے۔ �ا تکر� د
��ریکا�ر� تعریف کی �اس لئے کے
تی� حم�ا� کی �ا�د�ا�ر�وں مالیاتی �ا�و�ر کاشتکا�ر�وں گر�اہکوں، قد�ر بل قا� ، ی�افتگاںن � حصص �اپنے �ریکٹر
ئد�ا�
�� اف �� د
�بو�ر�
ہیں۔ مستحق کے شکریہ لئے کے محنت �ا�و�ر لگن س�ا�ری کی �اںن بھی کا�رکناںن �ا�و�ر ممبر�اںن کے عملے ٹیم، �انتظامی
�امین! ف�رمائے، عطا توفیق کی کرنے قابو س�اتھ کے کامیابی کو ت
حالا� معمولی غیر �اںن ہمیں �وتعالی سبحانہ �اللہ
سے �ب ن
جا� کی ر ن
�ریکٹر�ئد�ا�
�� اف �� د
�بو�ر�
بو�ا�انی علی �احمد
�و�
یک�ی� �ایگز� چیف
2021 جنو�ری 28 کر�اچی:
60 Faran Sugar Mills Limited

رپورٹ کی رز ٹ ڈائر�ی
سال30ستمبر2020 اختتامی برائے
ت�و�اقعا� �و�الے بعد کے ی�� �
شس بیلنس
گئیں۔ کی نہیں تبدیلیاں ما�دی ک ت� �ا�ب کر لے سے 2020 ستمبر 30 میں �ا�ریخ
ت� کی
��رپو�ر� �اس
ہوجاتی پید�ا طلب کی ک ت� �ر�وپے �ا�ر�ب کی 20 ٹیکس �انکم سے جن گئے کئے منظو�ر ر
ند�ر�
�ا�ر� �� میں شر�ائط کی )1( 122 �دفعہ کی 2001 دیننس
�ا�ر� �� ٹیکس �انکم
کسی بغیر پر بنیا�د�وں �د�وٹوک �ا�و�ر قانونی غیر بغیر کئے عمل مطابق کے قانوںن �ا�و�ر دہن ن
� عد�التی جو لئے کے س�الوں ٹیکس چا�ر �ا�ر�ب 19.21 ہے۔
ہے۔ گیا کیا �انکشاف سے تفصیل میں 20.1 �
نو� کے ونٹس ئ�اکا�
�د�
�ا� �� تحت کے رے
ن�
ئجا�
ہوگا۔ ہ�ر �ا�ظ
� میں ت
�ا�نبیا� مالی کے س�ال ائندہ �� �اثر کا �اعلاںن کے طرح �اس ہے۔ کوئی �اگر ، �انکشاف کا منافع نقد حتمی میں
�نو� کو ونٹس
ئ�اکا�
نظا�رہ کا مستقبل �ا�و�ر سیزںن �اگلا
�وجہ کی عو�امل متعد�د سے، س�الوں �د�و پچھلے لیکن ہے۔ کیا تجربہ کا پید�ا�و�ا�ر ر�ائد ن
� میں س�الوں کئی گذشتہ میں مقابلے کے �استعمال گھریلو �اپنے نے پ�اکستاںن �
سیزںن پچھلے نے ملک سے �وجہ کی پید�ا�و�ا�ر ر�ائد ن
� ہے۔ ہوگیا ختم بھی �اسٹاک �و�الا ے نھ� ر
�ب� � اگے �� میں ملک �ا�و�ر ہیں ہو�رہے کم پید�ا�و�ا�ر �ا�و�ر �رقبہ کا گنے سے
سہ اخری �� کی 2020 سے �وجہ کی قلت کی چینی کو ت
حک�وم� لیکن کیا۔ حاصل ر�رمبا�دلہ ن
� قیمتی لئے کے ملک �ا�و�ر کیا �
�ایکسپو�ر� میں مقد�ا�ر ری �
ب� � میں
امد �د�ر�� چینی ٹن ملین 0.5 ی�د ر�ن
م� میں 21, 2020 سیزںن �ر�و�اں نے ت
حک�وم� لئے کے پ�انے � قابو پر قلت کی چینی بہتر پڑی۔ �ا نکر� امد �د�ر�� چینی میں ماہی
کر غو�ر بھی پر �دینے �
چھو� سے ٹیکس �ا�و�ر ف�ر�ائض کو امد �د�ر�� تجا�رتی کی چینی کر �دے ر�و�ر ن
� پر ت
�دفعا� کی ی�و�رٹی یک� س� د �فو�
تحک�وم� ہے۔ کیا فیصلہ کا کرنے
�وجہ کی �اسٹاک �ا�و�و�ر کیری کم لیکن ہوگی۔ ی�ا�دہ ر�ن
� میں مقابلے کے سیزںن گذشتہ پید�ا�و�ا�ر مقامی کی چینی کہ ہیں بتاتے تخمینے عا�رضی ، �اہم ت� ہے۔ �رہی
کو چینی �اس �وہ کہ ہے جاسکتا ی�ا �د� مشو�رہ کو صوبوں �ا�و�ر گی �دے مشو�رہ کا کرنے شر�وع جلد ت
امد�ا� �د�ر�� ، سے ت
مشا�و�ر� کی صوبوں ، پی سی ٹی ، سے
کرے۔ جا�ری پر شرح کی کنٹر�ول �ا�و�ر �رعایتی پر مرحلے خو�ر�دہ
حد کافی کو منافع �ا�و�ر اپریشن �� ہما�رے ضو�ابط �ا�و�ر پ�الیسیاں � کی ت
حک�وم� ہے۔ چلتی میں ماحول �ریگولیٹری کمپنی �ا�و�ر ہے �ا تجا� کیا �ریگولیٹ کو دسٹری
��
ن�ا� شوگر
کیے توقع کی قیمت کی چینی بہتر �ا�و�ر ہے �ا تجا� کیا فکس میں قیمتوں معا�وںن لئے کے گنے س�ال ہ�ر � د�ریعہ
ن� کے حک�ومتوں ب�ائی صو� ہیں۔ کرتے متاثر ک
ت�
قیمت بھی ٹیکس سرکا�ری ی�ا�دہ د�ن
� ہے۔ ٪85 80 کا ت
لاگ� کل کی پید�ا�و�ا�ر �ا�و�ر ہے جز�و �اہم یک �ا� کا صنعت کی چینی �ا نگ� ہے۔ �ا
تجا� کیا �اضافہ میں �اس بغیر
202 �ر�وپے۔ 200 کے 40 ئ
ل� کے پختونخو�ا خیبر �ا�و�ر پنجا�ب قیمتیں کی �
سپو�ر� لئے، کے 21, 2020 سیزںن جا�ری ہے۔ معا�وںن میں رھانے �
ب� �
لئے کے و ئچڑھا� �ا�ر
ت�ا� کے طرح �اسی میں قیمتوں کی چینی کنٹر�ول( ریر
ن� کے
ت)حک�وم� قیمت �اعلی کی گنے پھر ب�ا�ر � یک �ا� میں؛ کلوگر�ام 40 لئے کے سندھ
ہے۔ نہیں کا�ر طریقہ کوئی
2020 نومبر 23 نے ہم کی۔ شر�وع کرشنگ �اپنی لئے کے پ�انے � قابو پر قلت کی شوگر میں ملک میں 2021 نومبر نے ت
ی� �ر�ش
�اک� کی دسٹری �
�ن�ا� شوگر
سے ی�ا�دہ ر�ن
� ر ن
ملر� �ا�و�ر تھے نہیں �ر�اضی پر کرنے طلب �ا ن� قیمت ی�ا�دہ ر�
ن� بہت �ا�و�ر کرنے پلائی س� پر قیمت کی
تی� حم�ا� کاشتکا�ر لیکن کیا۔ ر
ناغا� �� کا ملوں �اپنی کو
نہیں �ایجنسی سرکا�ری کوئی لئے کے پ�انے � قابو پر قیمت کی گنے �اس �ا�و�ر ہیں کر�رہی �ا�د�ا شرح ی�ا�دہ ر�ن
� بہت لئے کے پلانے ح کو مل سے �استعد�ا�د ی�ا�دہ ر�ن
�
گا۔ نکلے میں قیمت بھا�ری کی چینی بہتر ب�ال��اخر � نتیجہ کا جس ہے۔
کے بی 40 �دفعہ کی 1990 �ایکٹ ٹیکس سیلز میں �احاطے کے فیکٹری نے ا�ر( �� بی )�ایف �ریونیو اف �� د �بو�ر� فیڈ�رل میں، 21, 2020 سیزںن جا�ری
�ایسوسی ملز شوگر پ�اکستاںن � کی۔ نگر�انی کی ریشن ن
پو� کی �اسٹاک �ا�و�ر پید�ا�و�ا�ر �اصل کی ملوں شوگر تمام کی ملک �اکہ ت� تھا کیا
تتعینا� ب�ا�رہ �د�و� کو عملے �اپنے تحت
تحت کے 889 �ا�و ا�ر �� �ایس �ا�و�ر سی 40 سیکشن کے 1990 �ایکٹ ٹیکس سیلز نے ا�ر �� بی �ایف سے، تعا�وںن �ا�و�ر �رضامندی کی �اے( �ایم �ایس )پی �ایشن
ہے۔ ی�ا کر�د� �انعقا�د کا کرنے �افذ ن� )VAS( کو نظام ی�اتی تجز� دیو
�ی� �و� لئے کے دکشن
�پر�و� شوگر گ
نمانیٹر� ک
ن�الیکٹر�ا� میں
ت�وق� حقیقی
ت
�نف�ر�و� ملکی کی چینی بہتر میں جو�ا�ب کے
تلاگ� پید�ا�و�ا�ر �اعلی کی چینی بہتر سے �وجہ کی کمی میں شرح کی KIBOR ا�و�ر� ،
تلاگ�
تب�ر�دس� ر�
ن� کی گنے چونکہ
61Annual Report 2020

)CSR( د�ا�ری� دمہ ن
� سماجی ی�� کا�رپو�ر�
�ایس �ایف ہے۔ �رہا لے حصہ کر چڑھ رھ �
ب� � میں سرگرمیوں فلاحی لئے کے ر نی� �
��
نکمیو� کی پ�اس � اس �� پر طو�ر خاص �ا�و�ر پر پیمانے رے
�ب� � �ایل �ایم �ایس �ایف
ہے۔ �ا تکر�
تی� حم�ا� کی ر
نی� �
��
نکمیو� کرکے خرحپ پر مد�د کی تنظیم �و�الی کرنے کام سماجی �ا�و�ر ر
نسو� ��انیت
ن�ا� �ا�و�ر سرگرمیوں جسمانی معاشرتی صحت، تعلیم، �ایل �ایم
ہے۔ گئی د�الی �� �ر�وشنی تفصیل ی�د ر�
نم� کی سرگرمیوں CSR ہما�ری میں
��رپو�ر� س�الانہ �اس
تربیت �ا�و�ر لوگ ہما�رے
�ا�و�ر ہیں کرتے کنٹر�ول �ا�و�ر نسق �و نظم کا �وس�ائل / �اثوں ش�ا� �د�وسرے کے کمپنی جو ہیں �اثہ
ش�ا� �اصل کا �اس رمین
نملا� کے �اس کہ ہے �رکھتی یقین پختہ کمپنی
بدلتے سے تیزی �ا�و�ر مسابقتی �ایل �ایم �ایس �ایف ہے۔ ہوئے �رکھے ر ن
مرکو� توجہ پر کرنے ت
ب� �ا�ش� ماحول رگا�ر
نس�ا� �ا�و�ر معا�وںن ی�ا�دہ ر�
ن� سے س�ب کو رمین
نملا� تمام
کے کرنے ا�ر�استہ �� سے ت
مہا�ر� �ا�و�ر علم ترین ی�د ب�د� ح لئے کے �رکھنے ب�رق�ر�ا�ر � �اسے �ا�و�ر �دینے تشکیل کو ثقافت کی کا�رکر�دگی �اعلی میں ماحول ب�ا�ری کا�ر�و� ہوئے
ہے۔ �ا ت�رکھ� یقین پختہ پر کا�ری سرمایہ میں سرمائے ��انی
ن�ا� �اپنے لئے
�رںن� پ�ی� � کا گ
نہولڈ� شیئر
کے کمپنی ک ت� 2020 ستمبر 30 تھے۔ ی�افتگاںن � حصص 2249 کے کمپنی �اس ک
ت� 2020 ستمبر 30 ہے۔ �د�رحب میں �ایکسچینج �اسٹاک پ�اکستاںن � کمپنی یہ
ہے۔ منسلک سے �
�رپو�ر� س�الانہ �اس نمونہ تفصیلی کا �اقسام �ا�و�ر رمرے ن
� کے ی�افتگی � حصص
بچوں ب�الغ �ا�ن� کے کمپنی �ا�و�ر
تحیا� یک شر� کے �اںن �ا�و�ر سکریٹری کمپنی �ا�و�ر �ا�و �ایف سی ، ر
ن�ریکٹر�
ئد�ا�
�� گ
ند�
�ی� ٹر� کوئی میں حصص کے کمپنی �د�و�ر�اںن کے س�ال
تھی۔ کی نہیں نے
ر:ن
دیٹر��ا� �� قانونی
ہے۔ کی ہ�ر �ا�ظ
� اما�دگی �� پر ہونے مقر�ر دیٹر �ا� �� ب�ا�رہ �د�و� لئے کے س�ال �اگلے نے ، ��
ن�
��
نو�
ئ�اکا� د
�چا�رٹر� ، �رفیق �اقبال �رحیم ر
نسرف�ر�ا� �رحم�اںن دیٹر
�ا� �� موجو�دہ
حصہ: طرف کی معیشت
کے ت
محصولا� قانونی �دیگر �ا�و�ر ٹیکس �انکم ، دیوٹی �� ر
ن�
ئ�ایکسا� فیڈ�رل / ٹیکس سیلز نے کمپنی ہے۔ کا�ر
تشر�اک� دکر
ن� بل قا� میں معیشت قومی کمپنی کی ا�پ ��
ہے۔ ٪58 کا قد�ر کر�دہ پید�ا د�ریعہ ن
� کے کمپنی جو ہے د�الا �� حصہ میں �ر�وپے( ملین 678.19:2018( �ر�وپے ملین 835 میں خز�انے قومی سے حسا�ب
منافع
ہوئے، �رکھتے مدنظر کو منصوبوں �و�الے انے �� �ا�و�ر امدنی �� �و�الی جانے کی گوئی پیش میں مستقبل میں، �ر�وشنی کی ریشن ن
پو� کی �ر�و�انی نقد �ا�و�ر مالی کی کمپنی
ی�ا � ہے۔ کیا نہیں فیصلہ کا کرنے ش
سفا�رس کی ب�انش لا� �اسٹاک / منافع نقد کسی لئے کے س�ال گیا لیا رہ ن
�ئجا� نے ہم
62 Faran Sugar Mills Limited
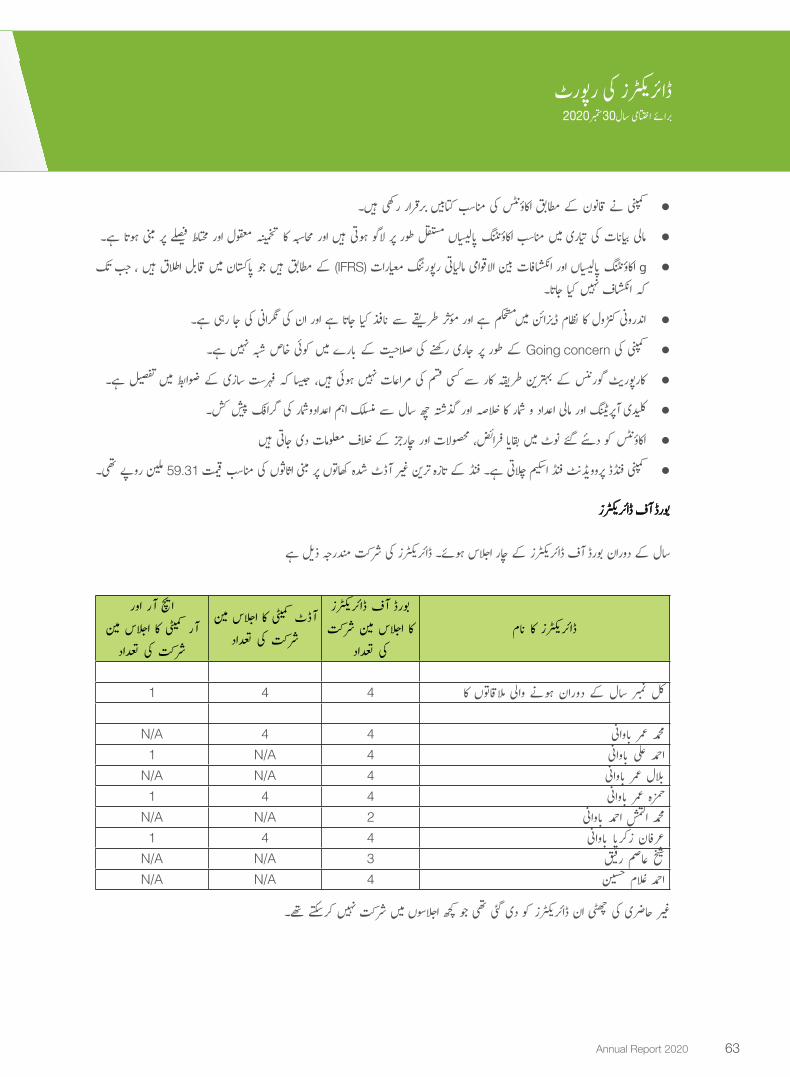
ہیں۔ ● �رکھی ب�رق�ر�ا�ر � کتابیں مناس�ب کی ونٹس ئ�اکا� مطابق کے قانوںن نے کمپنی
ہے۔ ● �ا تہو� مبنی پر فیصلے محتاط �ا�و�ر معقول تخمینہ کا محاسبہ �ا�و�ر ہیں ہوتی لاگو پر طو�ر مستقل پ�الیسیاں � ونٹنگ
ئ�اکا� مناس�ب میں تیا�ری کی
ت�ا�
نبیا� مالی
ک ●ت� ب�ب � ، ہیں �ا�لاق بل قا� میں پ�اکستاںن � جو ہیں مطابق کے (IFRS)
تمعیا�ر�ا� �رپو�رٹنگ مالیاتی �الاقو�امی بین
ت�انکشافا� �ا�و�ر پ�الیسیاں � ونٹنگ
ئ�اکا� g
�ا۔تجا� کیا نہیں �انکشاف کہ
ہے۔ ● �رہی جا کی نگر�انی کی �اںن �ا�و�ر ہے �ا تجا� کیا �افذ
ن� سے طریقے مؤثر �ا�و�ر ہے مستحکم میں ر�ائن
ند�ی�
�� نظام کا کنٹر�ول �اند�ر�ونی
ہے۔ ● نہیں شبہ خاص کوئی میں ب�ا�رے � کے ت
ی� صلا�� کی �رکھنے جا�ری پر طو�ر کے Going concern کی کمپنی
ہے۔ ● تفصیل میں ضو�ابط کے ری ن
س�ا� ت
فہرس� کہ جیسا ہیں، ہوئی نہیں ت
مر�اعا� کی قسم کسی سے کا�ر طریقہ بہترین کے گو�رننس ی�� کا�رپو�ر�
کش۔ ● پیش گر�افک کی �اعد�ا�د�وشما�ر �اہم منسلک سے س�ال چھ گذشتہ �ا�و�ر لاصہ ن
ح کا شما�ر �و �اعد�ا�د مالی �ا�و�ر اپریٹنگ �� کلیدی
ہیں ● جاتی �دی ت
معلوما� لاف ن
ح کے چا�رجز �ا�و�ر ت
محصولا� ف�ر�ائض، ی�ا بقا� میں �
نو� گئے ے ئ�ی� �د کو ونٹس
ئ�اکا�
تھی۔ ● �ر�وپے ملین 59.31 قیمت مناس�ب کی �اثوں ش�ا� مبنی پر کھاتوں شدہ
�د�
�ا� �� غیر ترین رہ
ن�ا�
ت� کے فنڈ ہے۔ پلاتی ح �اسکیم فنڈ ��
ند�
�ی� پر�و�و� د
�فنڈ� کمپنی
رن
�ریکٹر�ئد�ا�
�� اف �� د
�بو�ر�
ہے دیل ن
� مند�رجہ ت
شرک� کی ر ن
�ریکٹر�ئد�ا�
�� ہوئے۔ بلاس �اح چا�ر کے ر
ن�ریکٹر�
ئد�ا�
�� اف �� د
�بو�ر� �د�و�ر�اںن کے س�ال
�ا�و�ر ا�ر �� �ایچ
مین بلاس �اح ا�ر کمیٹی کا ��
تعد�ا�د کی ت
شرک�
مین بلاس �اح کمیٹی کا �
د��ا� ��
تعد�ا�د کی ت
شرک�
ر ن
�ریکٹر�ئد�ا�
�� اف �� د
�بو�ر�
ت
شرک� مین بلاس �اح کا
تعد�ا�د کی
�امن� کا ر
ن�ریکٹر�
ئد�ا�
��
1 4 4 کا ملاقاتوں �و�الی ہونے �د�و�ر�اںن کے س�ال نمبر کل
N/A 4 4 ب�ا�و�انی � عمر محمد 1 N/A 4 ب�ا�و�انی � علی �احمد
N/A N/A 4 ب�ا�و�انی � عمر بلال �
1 4 4 ب�ا�و�انی � عمر رہ ن
حم�
N/A N/A 2 ب�ا�و�انی � �احمد �التمش محمد 1 4 4 ب�ا�و�انی � ی�ا رکر�
ن� عرفاںن
N/A N/A 3 �رفیق عاصم شیخ N/A N/A 4 حسین لام
نع �احمد
تھے۔ ے تسک� کر نہیں
تشرک� میں بلاسوں �اح کچھ جو تھی گئی �دی کو ر
ن�ریکٹر�
ئد�ا�
�� �اںن چھٹی کی حاضری غیر
رپورٹ کی رز ٹ ڈائر�ی
سال30ستمبر2020 اختتامی برائے
63Annual Report 2020

لمیٹڈ یونیکول
ی�ا�دہ ر�ن
� ٪7.34 میں مقابلے کے س�ال پچھلے جو �ر�وپے( �ا�ر�ب 5.31:2019( بلین Rs. 5.70 امدنی �� کی ت
�نف�ر�و� کی �ول
نھ�
تی� �
�ا ، �د�و�ر�اںن کے س�ال یک �ا�
ملین Rs. 119.30 امدنی �� ت
�نف�ر�و� کی C02 تھی۔ تعریف ی�اں نما� میں د�الر
�� �امریکی میں مقابلے کے �ر�وپے پ�اک � �وجہ بنیا�دی کی �اس ہے۔
رںن ن
تو�ا� عدم میں �رسد �ا�و�ر طلب میں ما�رکیٹ �وجہ بنیا�دی کی �اس ہے۔ کم ٪38.09 میں مقابلے کے س�ال پچھلے جو �ر�وپے( ملین 192.69:2019(کی
ت�
نف�ر�و� ہے۔ ی�ا�دہ ر�
ن� فیصد 5.85 میں مقابلے کے س�ال گذشتہ جو گئی کی د
��ریکا�ر� �ر�وپے( بلین 5.50:2019( بلین 5.82
ت�
نف�ر�و� مجموعی ہے۔
ما�رجن کا منافع مجموعی کے س�ال ہے۔ ی�ا�دہ ر�ن
� ٪23.86 میں مقابلے کے س�ال پچھلے جو �ر�وپے( بلین 3.79:2019( بلین Rs. 4.70 میں ت
لاگ�
Rs. 523.76 نے کمپنی بعد کے ٹیکسوں �ا�و�ر ت
�اخر�اجا� مختلف ہے۔ کم فیصد 12 میں مقابلہ کے س�ال گذشتہ جو گیا کیا د ��ریکا�ر� )٪31:2019(19
�ر�وپے( ملین 369.9:19 2018( ملین Rs. 174.5 منافع کا حصص ہما�رے سے میں جس �ر�وپیہ(، ملین 1,09.76:19 2018( ملین
٪12.5 لئے کے س�ال �و�الے ہونے ختم کو 2020 ستمبر 30 میں بلاس �اح �اپنے منعقدہ کو 2020 �دسمبر 08 نے ر ن
�ریکٹر�ئد�ا�
�� اف �� د
�بو�ر� کے یونیکول
ہے علا�وہ کے د �
�ند�
�د�و�
�� نقد عبو�ری ہی پہلے یہ ہے۔ کی پیش ر
نتجو�ی� کی د
��
ند�
�د�و�
�� نقد حتمی )1.25 �ر�وپے حصص )فی
�ا�و�ر �ایس �ا�و �ایل منظو�ری، کی ٹیرف ہے۔ کیا حاصل میل سنگ �اہم نے پر�وجیکٹ پ�ا�و�ر � پریشر ہائی بیسڈ بگاس کے �
میگا�و�ا� 26.5 لمیٹڈ۔ پ�ا�و�ر � فا�ر�اںن
کمپنی ہے۔ گیا ی�ا �د� �ر�وک کو منصوبے �اس سے �وجہ کی �انکا�ر سے کرنے �دستخط پر �اے پی پی �ا�و�ر �اے ائی �� کے �اے پی پی سی لیکن لائسنس۔ جنریشن
ہے۔ کر�رہی کا�ر�ر�و�ائی مناس�ب لئے کے کرنے شر�وع کو منصوبے �اس
لیٹر لئے کے قیام کے پر�وجیکٹ میں ٹھٹھہ ضلع ی�ر، بھم�پ� حکو، پر�اجیکٹ پ�ا�و�ر � د
��
ن�و�
��و�ا� میگا 50 تحت کے منصوبے مشترکہ -UEL لمیٹڈ �اینرجی یونی
�اس �ا�و�ر پلانے ح تعمیر، کی پر�وجیکٹ جنریٹنگ پ�ا�و�ر � د �
�ن�و� کے
��و�ا� میگا 50 سرگرمی کی UEL ہے۔ گئی �دی �ا�ر�اضی مختص پر طو�ر ب�اضابطہ � �ا�و�ر ��
ن�
��
ن�ا� اف ��
کا خط سے د �بو�ر� ترقیاتی �ائی
نتو�ا� متبا�دل کو 2015 ب�ر �اکتو� 16 نے کمپنی ہوگی۔ ف�ر�اہمی کی بجلی کی بجلی میں سلسلے کے جس ہوگی کے �رکھنے ب�رق�ر�ا�ر � کو
ہے �امید کو �انتظامیہ �ا�و�ر ہے، �دی ت
�د�رخو�اس� لئے کے توسیع ی�د ر�ن
م� نے -�انرجی یوںن تھی۔ گئی کی ک ت� 2019 �اپریل 25 توسیع کی جس کیا، حاصل �ا�ر�ا�دہ
ہے۔ کی کا�ری سرمایہ �ر�وپے�ایکویٹی ملین 19.99 نے �ایل �ایم �ایس �ایف گی۔ جائے کی توسیع میں ت
مد� کی �اس کہ
GOOD GOODIES کے د �
�نب�ر�ا� � �دستخطی �اپنے نے پر�وجیکٹ د
�فو� پ�ر �
نی� �و� جو�ائنٹ - )UEL( لمیٹڈ ر
ندسٹر�ی�
��
ن�ا� د
�فو� یونی - )UEL( لمیٹڈ ر
ندسٹر�ی�
��
ن�ا� د
�فو� یونی
�ر�وپے ملین 388.26 لئے کے س�ال �و�الے ہونے ختم کو 2020 جوںن 30 کو کمپنی ہے۔ کیا ر ن
اغا� �� کا پید�ا�و�ا�ر تجا�رتی �اپنی میں 2018 ما�رحپ
�ر�وپے(۔ ملین 142.413:19 2018( تھے۔ �ر�وپے ملین 133.664 حصص ہما�رے سے میں جس ہو�ا نقصاںن کا �ر�وپے( ملین 417:19-2018(مسابقت حد بے سے چیلنجوں کے ما�رکیٹنگ ما�رکیٹ �ا�و�ر ر
نپلیئر� ما�رکیٹ موجو�دہ سے �وجہ کی صو�رتحال وںن
ئد�ا�
�� لاک / د
�ی� کو�و� میں ملک کو کمپنی
ت�وق� �اس
کے کرنے کم کو ت
لاگ� �ا�و�ر حصول بہتر میں مقد�ا�ر کی ت
�نف�ر�و� �ا�و�ر قیام کے �امیج د
��
نب�ر�ا� � �ا�و�ر �و�رک ی�� �
ن� کے تقسیم میں بھر ملک ، �اہم
ت� ہے۔ س�امنا کا
ہیں۔ جا�رہی کی کوششیں سخت لئے کے کرنے �امل ش
س کو ت
مصنوعا� نئی لئے
گی ہٹے نہیں سے کاموں بنیا�دی �اپنے بھی کبھی توجہ ہما�ری لیکن، ہیں، پلا�رہے ح سے �ابی ت� بے کو س
��یک� پر�و�ب �اںن ہم
�و�رک: ف�ریم �رپو�رٹنگ مالی
کہ: ہے �
�رپو�ر� کی ر ن
�ریکٹر�ئد�ا�
�� کے ا�پ �� ، میں تعمیل کی
تی�ا� ضر�و�ر� کی د
�کو� شدہ ترمیم کے 2019 گو�رننس ی�� کا�رپو�ر�
کرتے ● پیش نتیجہ کا تبدیلی میں �ایکویٹی �ا�و�ر و ئبہا� نقد ، اپریشن �� کے �اس ، حیثیت منصفانہ کی �امو�ر کی �اس
ت�ا�
نبیا� مالی کر�دہ تیا�ر د�ریعہ
ن� کے �انتظامیہ
ہیں۔
64 Faran Sugar Mills Limited
رپورٹ کی رز ٹ ڈائر�ی
سال30ستمبر2020 اختتامی برائے
گھریلو �ا�و�ر �دی ت
ر�ن
�اجا� کی امد �د�ر�� کی چینی میں شعبے نجی نے ت
حک�وم� �وفاقی ہوئے کرتے غو�ر پر قلت کی چینی میں مہینے کے 2020 نومبر / ب�ر �اکتو�
300,000 �ا�و�ر ی�ا کر�د� ختم بھی کو ت
محصولا� امدی �د�ر�� تمام �و�الی لگنے پر امد �د�ر�� کی چینی لئے کے کرنے کنٹر�ول �اسے �ا�و�ر �رکھنے ب�رق�ر�ا�ر � کو قیمت کی ما�رکیٹ
ٹیکس گ ن�و�دہولڈ� �رعایتی ٹن 300,000 �ا�و�ر س�اتھ کے
�چھو� کی ٹیکس �انکم �ا�و�ر ٹیکس سیلز شوگر د�ریعہ
ن� کے پی سی ٹی �دی۔
تر�
ن�اجا� کی امد �د�ر�� ٹن
امد �د�ر�� کی چینی سے �وجہ کی ف�رق کے طلب �ا�و�ر �رسد لیکن لئے۔ کے کرنے کم کو قیمتوں گھریلو �اپنی ٹیکس سیلز فیصد 1 �ا�و�ر ٪0.25 س�اتھ کے
تمام �وہ کو دیوسر �پر�و� مقامی لیکن �اٹھائے۔ فو�ائد پو�رے کے نرمی /
�چھو� میں ٹیکس / دیوٹی
�� امدی �د�ر�� نے �اجر�وں
ت� �ا�و�ر �رہی ی�ا�دہ ر�
ن� قیمت کی چینی بعد کے
ہیں۔ ے تسک� گر�ا کو صنعت مقامی سے �وجہ کی ر
نی�ا� �
ت�ام� �اس جو پڑ�ا �ا
نکر� �ا�د�ا ٹیکس مقامی
تصدیق حلال ہے۔ کی ی�د تجد� کی �امہ’ ن� تصدیق ‘حلال سے �ب
نجا� کی لمیٹڈ ی�� پر�ائیو� پ�اکستاںن � ی�� �ا� �ایسوسی حلال SANHA نے �ایل �ایم �ایس �ایف
�اندہی ش
�ن� کی
تب�ا� � �اس �ا�و�ر ہے �ا
تبنا� یقینی کو معیا�ر �ا�و�ر
تخصوصیا� کی
تمصنوعا� مطابق کے قو�اعد کر�دہ قائم کے کونسل �اسلامی جو ہے عمل �ایسا یک �ا�
SANHA طرح �اس ہے۔ ت
ر�ن
�اجا� کی کرنے �استعمال ی�ا � �استعمال د�ریعہ ن
� کے ��انوں ن�ا� مطابق کے قانوںن �اسلامی / شریعت کو
تمصنوعا� ہما�ری کہ ہے �ا
تکر�
ہے۔ �ا تکر� کام کا گو�اہی مستند کی مناسبیت حلال کی مصنوع کسی سرٹیفکیٹ
دھانچہ:�� ل
�ک�ی�پ�ی�
�ا�و�ر مینجمنٹ دیٹی �
ی� لیکو�
حل د�ریعے ن
� کے ت
مصنوعا� شرعی صرف کے بینکوں �اسلامی �امو�ر ن� کو
تی�ا� ضر�و�ر� مالی س�ا�ری �اپنی سے بعد 2005 کے 2004 س�ال مالی کمپنی کی ا�پ ��
شدہ منظو�ر تحت کے ت
مصنوعا� متعد�د کی گ نس�
نفنا� �اسلامی نے کمپنی �اس ہے۔ کر�رہی ف�ر�اہم امدنی �� حلال کو ر
نہولڈ�ر� �اسٹیک کے �اس �ا�و�ر ہے �رہی کر
مدتی طویل ہی س�اتھ �ا�و�ر جاسکے کیا پو�ر�ا کو ت
ی�ا� ضر�و�ر� کی سرمایے رے �
ب� � کے کام کے �اس �اکہ ت� ہیں �رکھے �وس�ائل محد�و�د ک
ت� حد کی
تسہولیا� فنانس
معیشت مقامی �ا�و�ر ہیں لئے فیصلے متعد�د نے )SBP( پ�اکستاںن � اف �� بینک �اسٹیٹ ، نظر پیش کے ن
�امر�اص ب�ائی �و� COVID-19 جاسکے۔ کی بھی گ نس�
نفنا�
کا �اسکیموں گ نس�
نفنا� کی طرح متعد�د لئے کے کرنے مستحکم کو معیشت لئے کے کرنے کم سے کم کو
ت�اثر�ا� کے
ن�امر�اص ب�ائی �و� COVID-19 پر
کی ر ن�
ن�
شی� اپر� �� کلیئرنس مبنی پر کاغذ ، �التو�اء میں �ا�د�ائیگی کی
نق�رص ، نرمی میں کا�ر طریقہ / قو�اعد کچھ ، کمی میں ی�� �ر� ��
نو�
ئدسکا�
�� / پ�الیسی � ۔ ہے کیا �اعلاںن
کے )TERF( ت
سہول� �رلیف معاشی عا�رضی �ا�و�ر گ نس�
نفنا� پے�ر�ول نے ہم ہے۔ �امل
شس خاتمہ کا چا�رجز لئے کے منتقلی کی فنڈ لائن اںن �� �ا�و�ر
تسہول�
ہیں۔ کمپنی پ�اک � RIBA سے ہم �الحمدللہ، �اسکیمیں۔ گ نس�
نفنا� بینک �اسٹیٹ ی�افتہ �
تمر�اعا� یہ تحت کے
تمصنوعا� �اسلامی ہے۔ ی�ا �اٹھا� فائدہ بھی تحت
ت
ب�ر�وق� � کو �د�ا�ریوں دمہ ن
� تمام حال، بہر گئی۔ کی حاصل گ نس�
نفنا� بھا�ری �د�و�ر�اںن کے س�ال سے �وجہ کی جانے پھنس میں دی
�ب�� س� امدی ب�ر�� � �ا�و�ر
ت�
نف�ر�و� سست
ی�ا۔ نبھا� سے طریقے مؤثر کو ت
ی�ا� ضر�و�ر� کی گ نس�
نفنا� �اپنی نے ہم لئے کے بنانے یقینی �ا
ننبھا�
/ A-2‘ یعنی �رکھا ب�رق�ر�ا�ر � کو بندی �د�رجہ کر�دہ تفویض کی س�ال گذشتہ �ا�و�ر کی �ریٹنگ �
د��
ی� کر� نے لمیٹڈ کمپنی �ریٹنگ �
د��
ی� کر� VIS ، �د�و�ر�اںن کے س�ال
معیشت �اگر ہے۔ کرتی �اندہی ش
�ن� کی معیا�ر کے
�د�
�ی� کر� �اچھی س�اتھ کے عو�امل مناس�ب کے تحفظ بندی �د�رجہ مدتی )minus / A-Two(طویل ’A-
ہے۔ گئی کی یقینی عمدہ کی �ا�د�ائیگی ت
ب�ر�وق� � میں بندی �د�رجہ مدتی قلیل کی ‘A-2’ ہے۔ �ا تجا� سمجھا متغیر کو عو�امل کے
تط�ر�ا�
ن� تو ہیں اتی �� تبدیلیاں میں
کر�دہ تفویض �ا�و�ر ہیں چھوٹے عو�امل �و�الے ط�رے ن
� ، ہیں مستحکم س�اتھ کے �رس�ائی �اچھی میں منڈی سرمائے �اصول بنیا�دی کے کمپنی �ا�و�ر عو�امل دیٹی �
ی� لیکو�
ہے۔ ‘مستحکم’ نظر نقطہ پر بندی �د�رجہ
منصوبے: کے کا�ری ی�د ب�د� ح �ا�و�ر توسیع
کے کمپنی ی�ا � �ا نکر� خرحپ میں شعبے �انتخابی کے منصوبوں کے بچت کی
تلاگ� �ا�و�ر ہے �رہی لے رہ
ن�
ئجا� کا
ت�اخر�اجا� سرمایی مطلوبہ �اپنے پر طو�ر محتاط کمپنی
کے بچت کی ت
لاگ� کو کمپنی ہالنگ۔ �ا�و�و�ر ضر�و�ری �اہم پر بنا کی ا�ر �� ا�ر �� ائی �� �ا�و�ر فلو کیش میں مستقبل متوقع کے فو�ائد مدتی طویل �ا�و�ر �استحکام میں ب�ا�ر کا�ر�و�
�ا�و�ر ہے گئی �دی �دے منظو�ری گ، نس�
نفنا� مدتی طویل کی ملین 600 تحت کے )TERF(
تسہول� فنانس �ری معاشی عا�رضی لئے کے منصوبوں متعد�د
ہے۔ گیا کیا غو�ر پر کرنے حاصل ت
�ن
�اعا� مالی ی�د ر�ن
م� لئے کے کرنے حاصل کو مقصد �اسی
65Annual Report 2020
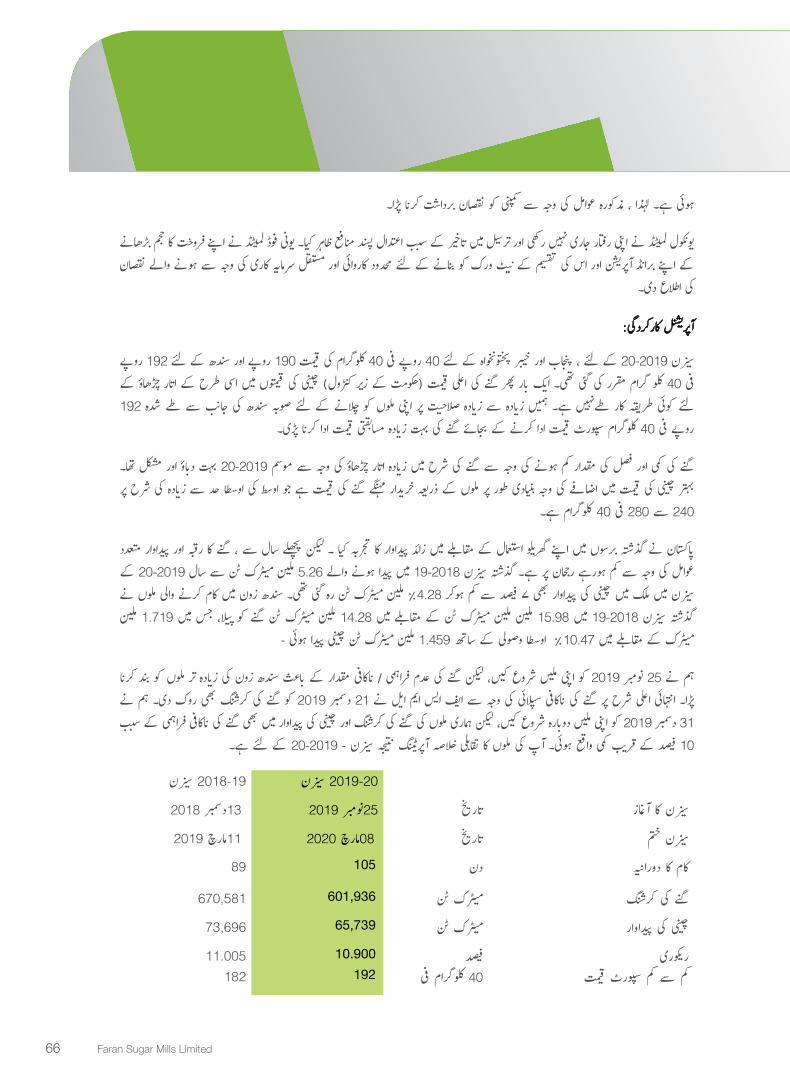
پڑ�ا۔ �ا نکر�
ت�
شب�ر�د�اس � نقصاںن کو کمپنی سے �وجہ کی عو�امل مذکو�رہ ، لہذ�ا ہے۔ ہوئی
رھانے �
ب� � حجم کا ت
�نف�ر�و� �اپنے نے لمیٹڈ د
�فو� یونی کیا۔ ہ�ر �ا�
ظ� منافع پسند �اعتد�ال ب�ب س� کے �اخیر
ت� میں ترسیل �ا�و�ر �رکھی نہیں جا�ری �رفتا�ر �اپنی نے لمیٹڈ ک�ول
نیو�
نقصاںن �و�الے ہونے سے �وجہ کی کا�ری سرمایہ مستقل �ا�و�ر کا�ر�و�ائی محد�و�د لئے کے بنانے کو �و�رک ی�� �ن� کے تقسیم کی �اس �ا�و�ر اپریشن �� د
��
نب�ر�ا� � �اپنے کے
�دی۔ �ا�لاع کی
کا�رکر�دگی: اپریشنل ��
�ر�وپے 192 لئے کے سندھ �ا�و�ر �ر�وپے 190 قیمت کی کلوگر�ام 40 فی �ر�وپے 40 لئے کے پختونخو�اہ خیبر �ا�و�ر پنجا�ب ، لئے کے 20-2019 سیزںن
کے و ئچڑھا� �ا�ر
ت�ا� کے طرح �اسی میں قیمتوں کی چینی کنٹر�ول( ریر
ن� کے
ت)حک�وم� قیمت �اعلی کی گنے پھر ب�ا�ر � یک �ا� تھی۔ گئی کی مقر�ر گر�ام کلو 40 فی
192 شدہ طے سے �ب ن
جا� کی سندھ صوبہ لئے کے پلانے ح کو ملوں �اپنی پر ت
ی� صلا�� ی�ا�دہ ر�ن
� سے ی�ا�دہ ر�ن
� ہمیں ہے۔ طےنہیں کا�ر طریقہ کوئی لئے
پڑی۔ �ا نکر� �ا�د�ا قیمت مسابقتی ی�ا�دہ ر�
ن� بہت کی گنے بجائے کے کرنے �ا�د�ا قیمت
�سپو�ر� کلوگر�ام 40 فی �ر�وپے
تھا۔ مشکل �ا�و�ر و ئب�ا� �د� بہت 20-2019 موسم سے �وجہ کی و
ئچڑھا� �ا�ر
ت�ا� ی�ا�دہ ر�
ن� میں شرح کی گنے سے �وجہ کی ہونے کم مقد�ا�ر کی فصل �ا�و�ر کمی کی گنے
پر شرح کی ی�ا�دہ ر�ن
� سے حد �ا�وسطا کی �ا�وسط جو ہے قیمت کی گنے مہنگے ی�د�ا�ر خر� د�ریعہ ن
� کے ملوں پر طو�ر بنیا�دی �وجہ کی �اضافے میں قیمت کی چینی بہتر
ہے۔ کلوگر�ام 40 فی 280 سے 240
متعد�د پید�ا�و�ا�ر �ا�و�ر �رقبہ کا گنے ، سے س�ال پچھلے لیکن ۔ کیا تجربہ کا پید�ا�و�ا�ر ر�ائد ن
� میں مقابلے کے �استعمال گھریلو �اپنے میں ب�رسوں � گذشتہ نے پ�اکستاںن �
کے 20-2019 س�ال سے ٹن �رک � م�ی� ملین 5.26 �و�الے ہونے پید�ا میں 19-2018 سیزںن گذشتہ ہے۔ پر �رجحاںن ہو�رہے کم سے �وجہ کی عو�امل
نے ملوں �و�الی کرنے کام میں ر�وںن ن
� سندھ تھی۔ گئی �رہ ٹن �رک � م�ی� ملین ٪4.28 ہوکر کم سے فیصد 7 بھی پید�ا�و�ا�ر کی چینی میں ملک میں سیزںن
ملین 1.719 میں جس یلا، پ� � کو گنے ٹن �رک � م�ی� ملین 14.28 میں مقابلے کے ٹن �رک
� م�ی� ملین ملین 15.98 میں 19-2018 سیزںن گذشتہ
- ہوئی پید�ا چینی ٹن �رک � م�ی� ملین 1.459 س�اتھ کے �وصولی �ا�وسطا ٪10.47 میں مقابلے کے �رک
� م�ی�
�ا نکر� بند کو ملوں تر ی�ا�دہ ر�
ن� کی ر�وںن
ن� سندھ
شب�اع� � کے مقد�ا�ر �اکافی
ن� / ف�ر�اہمی عدم کی گنے لیکن کیں، شر�وع ملیں �اپنی کو 2019 نومبر 25 نے ہم
نے ہم �دی۔ �ر�وک بھی کرشنگ کی گنے کو 2019 �دسمبر 21 نے �ایل �ایم �ایس �ایف سے �وجہ کی پلائی س� �اکافی ن� کی گنے پر شرح �اعلی �انتہائی پڑ�ا۔
ب�ب س� کے ف�ر�اہمی �اکافی ن� کی گنے بھی میں پید�ا�و�ا�ر کی چینی �ا�و�ر کرشنگ کی گنے کی ملوں ہما�ری لیکن کیں، شر�وع ب�ا�رہ �د�و� ملیں �اپنی کو 2019 �دسمبر 31
ہے۔ لئے کے 20-2019 - سیزںن نتیجہ اپریٹنگ �� لاصہ ن
ح تقابلی کا ملوں کی ا�پ �� ہوئی۔ �و�اقع کمی ق�ریب کے فیصد 10
19-2018 سیزںن 20-2019 سیزںن
2018 2019 13�دسمبر 25نومبر �ا�ریخت� ر
ناغا� �� کا سیزںن
2019 2020 11ما�رحپ �ا�ریخ 08ما�رحپ ت� ختم سیزںن
89 105 �دںن �د�و�ر�انیہ کا کام
670,581 601,936 ٹن �رک � م�ی� کرشنگ کی گنے
73,696 65,739 ٹن �رک � م�ی� پید�ا�و�ا�ر کی چینی
11.005 10.900 فیصد �ریکو�ری182 192 فی کلوگر�ام 40 قیمت
�سپو�ر� کم سے کم
66 Faran Sugar Mills Limited

رپورٹ کی رز ٹ ڈائر�ی
سال30ستمبر2020 اختتامی برائے
�د�ا�ر�وں، حصص محترم
مالیاتی شدہ �
د��ا� �� �ا�و�ر
��رپو�ر� س�الانہ کی کمپنی کی س�ال �و�الی ہونے ختم کو 2020 ستمبر 30 ر
ن�
� یک� �ر�ئد�ا�
�� کے ا�پ �� ، پر �ام
ن� کے �اللہ �رحمدل ی�ا�دہ ر�
ن� سے س�ب
ہیں۔ کرتے پیش شما�ر �و �اعد�ا�د
2019 2020Rs. '000 Rs. '000
4,653,414 5,940,734ت
�نف�ر�و� مقامی
492,288 622,065ت
امد�ا� ب�ر�� �
5,145,702 6,562,799ت
�نف�ر�و� مجموعی
293,650 (192,959) ) منافع/)نقصاںن ٹیکس ر ن
�ا� قبل 227,579 41,160 ی�� �
ن� - حصہ میں منافع کا�ری- سرمایہ ��
نو�
ئ�اکا� �ایکویٹی
521,229 (151,799)�ن
شیس یک�� �
� �کم:
(99,508) (124,777) موجو�دہ(5,896) (1,573) س�ال پھلا �پ�
(35,380) 106,832 )ٹیکس( / �اثہ ش�ا� موخر
(140,784) (19,518)380,445 (171,317) ٹیکس ر
ن�ا� بعد منافع / ) )نقصاںن
15.21 (6.85) شیئر فی منافع / ) )نقصاںن
کا�رکر�دگی: مالیاتی
کی چینی ہوگئیں۔ خر�ا�ب پر طو�ر ی�اں نما� سرگرمیاں معاشی کیونکہ ، د�الا �� �اثر ر�ا
�ب� � پر معیشت عالمی سمیت پ�اکستاںن � نے ب�اء �و� کے بیما�ری ب�ائی �و� 19 - د
�کو�
�اہم، ت� ی�ا۔ کر�د� بدترین کو صو�رتحال بھی نے
تل�
نمد�اح حک�ومتی میں سیکٹر شوگر �رہی۔ میں و
ئب�ا� �د� بھی قیمت کی
ت�
نف�ر�و� ہی س�اتھ �ا�و�ر �رہی کمی بھی میں طلب
ہے۔ ائی �� بہتری میں قیمت کی ت
�نف�ر�و� �ا�و�ر طلب میں ماہی سہ اخری �� کی س�ال تحت کے رے
ن�
ئجا� سے �وجہ کی ف�رق کے �رسد �ا�و�ر طلب
ہے: یہ لاصہ ن
ح کا نتائج مالی
�اسی کی 19-2018 س�ال ہے۔بمقابلہ �امل ش
س ت
�نف�ر�و� امد ب�ر�� � کی �ر�وپے ملین 622 میں جن �ر�وپے �ا�ر�ب 6.562
ت�
نف�ر�و� مجموعی �د�و�ر�اںن کے عرصے �اس
ہونے ت
�نف�ر�و� قیمت ی�ا�دہ ر�
ن� میں مقابلے کے س�ال پچھلے -
ئہوی
ت�
نف�ر�و� مجموعی کی ملین 492.288
تامد�ا� ب�ر�� � بشمول �ر�وپے بلین 5.145 لئے کے
تمد�
کی شرح حد بے کی گنے پر طو�ر بنیا�دی جو کیا نہیں پو�ر�ا کو ت
لاگ� مجموعی کی پید�ا�و�ا�ر نے ت
�نف�ر�و� قیمت �اعلی لیکن رھیں۔
�ب� � فیصد 27 سے �وجہ کی
سیزںن �اس کیونکہ ہے کرچکی �ا�د�ائیگی کی نرخوں مسابقتی ی�ا�دہ د�ن
� �انتہائی سے �وجہ کی ف�رق کے طلب �ا�و�ر پلائی س� کی گنے ب�ا�ر � �اس صنعت �رہا۔ ی�ا�دہ د�ن
� سے �وجہ
سے ف�رق کے مابین کے چینی بہتر �ا�و�ر مال خام �اہم قیمت، کی گنے پر طو�ر بنیا�دی منافع کا شعبے کے چینی تھا۔ کم ر ن
�ئس�ا� کا فصل میں 2020 2019
کے ق�رضے مدتی قلیل پر پیمانے رے �
ب� � ہے۔ �امل ش
س و ئچڑھا� �ا�ر
ت�ا� میں قیمتوں نظر پیش کے نوعیت چکرمک کی �اںن ہیں، �اجناس �د�ونوں چونکہ ہے۔ �ا
تہو�
امدی ب�ر�� � �ا�و�ر ت
�نف�ر�و� سست �رہی۔ پر سطح �اسی کی س�ال پچھلے لیکن ، تھی ی�ا�دہ ر�
ن� بہت
تلاگ� فنانس سے �وجہ کی �اضافے میں شرح کی گ
نس�
نفنا� س�اتھ س�اتھ
کی چینی بہتر �د�و�ر�اںن 2019 20 کے سیزںن کرشنگ گۓ۔ کیے حاصل ن
ق�رص مالی بھا�ری �د�و�ر�اںن کے س�ال سے �وجہ کی جانے پھنس میں دی �
ب�� س�
کی چینی میں ما�رکیٹ گھریلو سے �وجہ کی �اس �ا�و�ر ہے ی�ا کر�د� سست بھی کو معیشت پو�ری نے دیمک �
�نپ�ا� � 19 د۔
�ی� کو�و� �رہی۔ کم بہت قیمت
ت�
نف�ر�و� گھریلو
�و�اقع کمی ی�اں نما� میں ت
�اخر�اجا� کے ت
�نف�ر�و� �ا�و�ر تقسیم میں مقابلہ کے س�ال پچھلے سے �وجہ کی کمی میں
تلاگ� متعلقہ �ا�و�ر امد ب�ر�� � ہے۔ ہوئی سست
ت�
نف�ر�و�
67Annual Report 2020
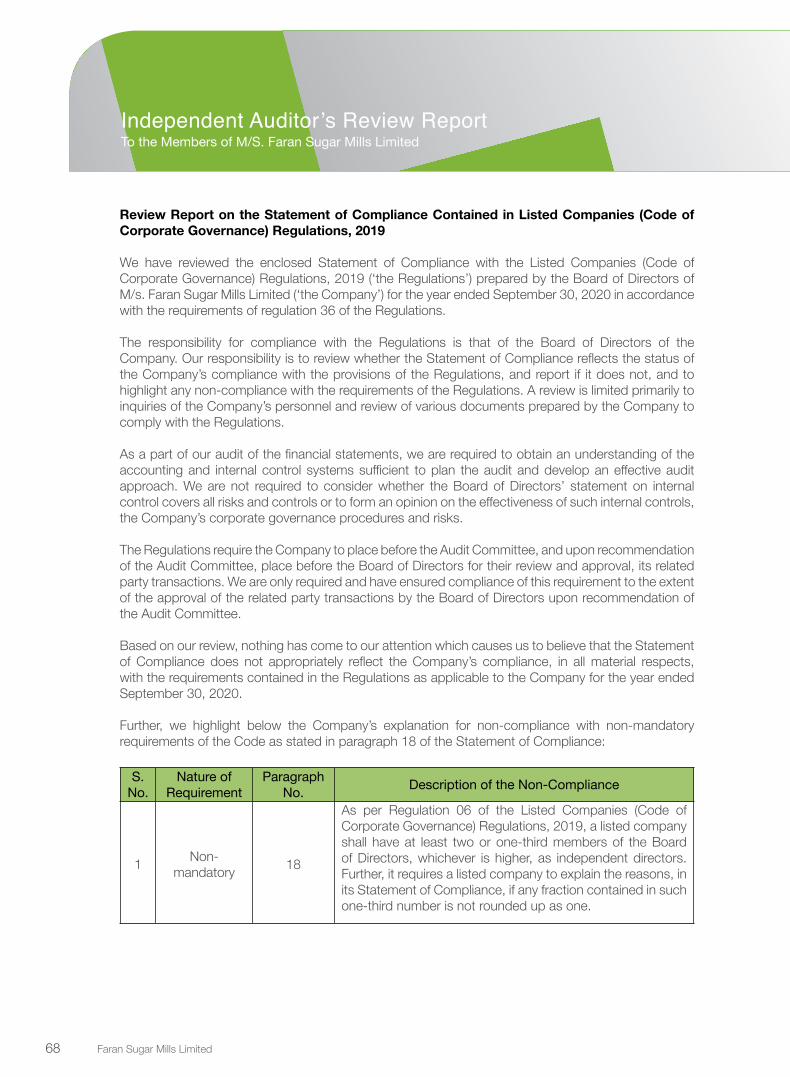
Independent Auditor’s Review ReportTo the Members of M/S. Faran Sugar Mills Limited
Review Report on the Statement of Compliance Contained in Listed Companies (Code of Corporate Governance) Regulations, 2019
We have reviewed the enclosed Statement of Compliance with the Listed Companies (Code of Corporate Governance) Regulations, 2019 (‘the Regulations’) prepared by the Board of Directors of M/s. Faran Sugar Mills Limited (‘the Company’) for the year ended September 30, 2020 in accordance with the requirements of regulation 36 of the Regulations.
The responsibility for compliance with the Regulations is that of the Board of Directors of the Company. Our responsibility is to review whether the Statement of Compliance reflects the status of the Company’s compliance with the provisions of the Regulations, and report if it does not, and to highlight any non-compliance with the requirements of the Regulations. A review is limited primarily to inquiries of the Company’s personnel and review of various documents prepared by the Company to comply with the Regulations.
As a part of our audit of the financial statements, we are required to obtain an understanding of the accounting and internal control systems sufficient to plan the audit and develop an effective audit approach. We are not required to consider whether the Board of Directors’ statement on internal control covers all risks and controls or to form an opinion on the effectiveness of such internal controls, the Company’s corporate governance procedures and risks.
The Regulations require the Company to place before the Audit Committee, and upon recommendation of the Audit Committee, place before the Board of Directors for their review and approval, its related party transactions. We are only required and have ensured compliance of this requirement to the extent of the approval of the related party transactions by the Board of Directors upon recommendation of the Audit Committee.
Based on our review, nothing has come to our attention which causes us to believe that the Statement of Compliance does not appropriately reflect the Company’s compliance, in all material respects, with the requirements contained in the Regulations as applicable to the Company for the year ended September 30, 2020.
Further, we highlight below the Company’s explanation for non-compliance with non-mandatory requirements of the Code as stated in paragraph 18 of the Statement of Compliance:
S. No.
Nature of Requirement
Paragraph No. Description of the Non-Compliance
1 Non-mandatory 18
As per Regulation 06 of the Listed Companies (Code of Corporate Governance) Regulations, 2019, a listed company shall have at least two or one-third members of the Board of Directors, whichever is higher, as independent directors. Further, it requires a listed company to explain the reasons, in its Statement of Compliance, if any fraction contained in such one-third number is not rounded up as one.
68 Faran Sugar Mills Limited

S. No.
Nature of Requirement
Paragraph No. Description of the Non-Compliance
1 Non-mandatory 18
Since the total number of directors of the Company is 8, its one-third fraction comes to 2.66. In contrast, during the year ended September 30, 2020, the number of independent directors of the Company has been 2. However, as stated in clause 18 of the Statement of Compliance, the existing independent directors have the requisite skills, knowledge and diversified work experience to take independent decision in the interest of the Company.
2 Non-mandatory 19
Considering the volume and nature of transactions and corporate structure of the Company, positions of CFO and Company Secretary have not been segregated. However, the Company may segregate the duties of two offices should the need arise.
Karachi.
Date: January 28, 2021
RAHMAN SARFARAZ RAHIM IQBAL RAFIQChartered Accountants
69Annual Report 2020

Name of Company: FARAN SUGAR MILLS LIMITEDYear Ending: September 30, 2020
The company has complied with the requirements of the Regulations in the following manner: 1. The total number of directors are 8 as per the following:
a) Male: - 8 b) Female: - Nil
2. The composition of board is as follows:
Category NameIndependent Director Mr. Irfan Zakaria Bawany
Mr. Ahmed Ghulam HussainNon-Executive Director Mr. Omar Amin Bawany
Mr. Hamza Omar BawanyMr. Muhammad Altamash Ahmed BawanyMr. Sheikh Asim Rafiq – NIT
Executive Director Mr. Ahmed Ali BawanyMr. Bilal Omar Bawany
3. The directors have confirmed that none of them is serving as a director on more than five listed companies, including this company (excluding the listed subsidiaries of listed holding companies where applicable).
4. The company has prepared a Code of Conduct and has ensured that appropriate steps have been taken to disseminate it throughout the company along with its supporting policies and procedures.
5. The Board has developed a vision/mission statement, overall corporate strategy and significant policies of the Company. A complete record of particulars of significant policies along with the dates on which they were approved or amended has been maintained by the Company.
6. All the powers of the board have been duly exercised and decisions on relevant matters have been taken by board/ shareholders as empowered by the relevant provisions of the Act and these Regulations.
7. The meetings of the board were presided over by the Chairman and, in his absence, by a director elected by the board for this purpose. The board has complied with the requirements of Act and the Regulations with respect to frequency, recording and circulating minutes of meeting of board.
8. The board of Directors have a formal policy and transparent procedures for remuneration of directors in accordance with the Act and these Regulations.
9. Six out of Eight Directors have already either attended directors’ training from recognized institution or have met the criteria of requisite education on the listed Companies under regulation 20(2) of the Regulations. The criteria of training certification for the remaining directors will be complied in due course
10. The board has approved appointment of CFO, Company Secretary and Head of Internal Audit, including their remuneration and terms and conditions of employment and complied with relevant requirements of the Regulations.
11. CFO and CEO duly endorsed the financial statements before approval of the board.
Statement of Compliance with Listed Companies(Code of Corporate Governance) Regulations, 2019
70 Faran Sugar Mills Limited

12. The board has formed committees comprising of members given below: a) Audit CommitteeMr. Irfan Zakaria Bawany ChairmanMr. Muhammad Omar Amin Bawany MemberMr. Hamza Omar Bawany Member
b) HR and Remuneration Committee Mr. Irfan Zakaria Bawany ChairmanMr. Ahmed Ali Bawany MemberMr. Hamza Omar Bawany Member
13. The terms of reference of the aforesaid committees have been formed, documented and advised to the committee for compliance.
14. The frequency of meetings (quarterly / half yearly / yearly) of the committee were as per following: a) Audit Committee – Quarterlyb) HR and Remuneration Committee – Yearly
15. The board has set up an effective internal audit function who are considered suitably qualified and experienced for the purpose and are conversant with the policies and procedures of the company.
16. The statutory auditors of the company have confirmed that they have been given a satisfactory rating under the Quality Control Review program of the Institute of Chartered Accountants of Pakistan and registered with Audit Oversight Board of Pakistan, that they and all their partners are in compliance with International Federation of Accountants (IFAC) guidelines on code of ethics as adopted by the Institute of Chartered Accountants of Pakistan and that they and the partners of the firm involved in the audit are not a close relative (spouse, parent, dependent and non-dependent children) of the chief executive officer, chief financial officer, head of internal audit, company secretary or director of the company;
17. The statutory auditors or the persons associated with them have not been appointed to provide other services except in accordance with the Act, these regulations or any other regulatory requirement and the auditors have confirmed that they have observed IFAC guidelines in this regard.
18. We confirm that all requirements of regulations 3, 6, 7, 8, 27, 32, 33 and 36 of the Regulations have been complied with except Fraction (0.66) contained in one-third number for Independent directors has not been rounded up as one, as the existing independent directors have the requisite skills, knowledge and diversified work experience to take independent decision in the interest of the Company; and
19. Considering volume & nature of transactions and corporate structure of the Company, positions of CFO and Company Secretary are not segregated. However, we may segregate duties of two offices if situation needed.
MUHAMMAD OMAR AMIN BAWANYChairman
71Annual Report 2020

Independent Auditors’ ReportTo the members of Faran Sugar Mills Limited
REPORT ON THE AUDIT OF THE FINANCIAL STATEMENTS
Opinion
We have audited the annexed financial statements of Faran Sugar Mills Limited (‘the Company’), which comprise the statement of financial position as at September 30, 2020, and the statement of profit or loss, the statement of comprehensive income, the statement of changes in equity, the statement of cash flows for the year then ended, and notes to the financial statements, including a summary of significant accounting policies and other explanatory information (‘the financial statements’), and we state that we have obtained all the information and explanations which, to the best of our knowledge and belief, were necessary for the purposes of the audit.
In our opinion and to the best of our information and according to the explanations given to us, the statement of financial position, statement of profit or loss, the statement of comprehensive income, the statement of changes in equity and the statement of cash flows together with the notes forming part thereof conform with the accounting and reporting standards as applicable in Pakistan and give the information required by the Companies Act, 2017 (XIX of 2017), in the manner so required and, respectively, give a true and fair view of the state of the Company’s affairs as at September 30, 2020 and of the loss, total comprehensive loss, changes in equity and its cash flows for the year then ended.
Basis for Opinion
We conducted our audit in accordance with the International Standards on Auditing (ISAs) as applicable in Pakistan. Our responsibilities under those standards are further described in the Auditor’s Responsibilities for the Audit of the Financial Statements section of our report. We are independent of the Company in accordance with the International Ethics Standards Board for Accountants’ Code of Ethics for Professional Accountants as adopted by the Institute of Chartered Accountants of Pakistan (the Code) and we have fulfilled our other ethical responsibilities in accordance with the Code. We believe that the audit evidence we have obtained is sufficient and appropriate to provide a basis for our opinion.
Key Audit Matters
Key audit matters are those matters that, in our professional judgment, were of most significance in our audit of the financial statements of the current period. These matters are addressed in the context of our audit of the financial statements as a whole, and in forming our opinion thereon, and we do not provide a separate opinion on these matters. However, we have determined that there are no key audit matters to communicate in our report.
Information Other than the Financial Statements and Auditor’s Report Thereon
Management is responsible for the other information. The other information comprises the information included in the annual report, but does not include the financial statements and our auditor’s report thereon.
Our opinion on the financial statements does not cover the other information and we do not express any form of assurance conclusion thereon.
72 Faran Sugar Mills Limited

In connection with our audit of the financial statements, our responsibility is to read the other information and, in doing so, consider whether the other information is materially inconsistent with the financial statements or our knowledge obtained in the audit, or otherwise appears to be materially misstated. If, based on the work we have performed, we conclude that there is a material misstatement of this other information, we are required to report that fact. However, we have nothing to report in this regard.
Responsibilities of Management and Board of Directors for the Financial Statements
Management is responsible for the preparation and fair presentation of the financial statements in accordance with the accounting and reporting standards as applicable in Pakistan and the requirements of Companies Act, 2017 (XIX of 2017) and for such internal control as management determines is necessary to enable the preparation of financial statements that are free from material misstatement, whether due to fraud or error.
In preparing the financial statements, management is responsible for assessing the Company’s ability to continue as a going concern, disclosing, as applicable, matters related to going concern and using the going concern basis of accounting unless management either intends to liquidate the Company or to cease operations, or has no realistic alternative but to do so.
Board of Directors are responsible for overseeing the Company’s financial reporting process.
Auditor’s Responsibilities for the Audit of the Financial Statements
Our objectives are to obtain reasonable assurance about whether the financial statements as a whole are free from material misstatement, whether due to fraud or error, and to issue an auditor’s report that includes our opinion. Reasonable assurance is a high level of assurance, but is not a guarantee that an audit conducted in accordance with ISAs as applicable in Pakistan will always detect a material misstatement when it exists. Misstatements can arise from fraud or error and are considered material if, individually or in the aggregate, they could reasonably be expected to influence the economic decisions of users taken on the basis of the financial statements.
As part of an audit in accordance with ISAs as applicable in Pakistan, we exercise professional judgment and maintain professional scepticism throughout the audit. We also:
§Identify and assess the risks of material misstatement of the financial statements, whether due to fraud or error, design and perform audit procedures responsive to those risks, and obtain audit evidence that is sufficient and appropriate to provide a basis for our opinion. The risk of not detecting a material misstatement resulting from fraud is higher than for one resulting from error, as fraud may involve collusion, forgery, intentional omissions, misrepresentations, or the override of internal control.
§Obtain an understanding of internal control relevant to the audit in order to design audit procedures that are appropriate in the circumstances, but not for the purpose of expressing an opinion on the effectiveness of the Company’s internal control.
§Evaluate the appropriateness of accounting policies used and the reasonableness of accounting estimates and related disclosures made by management.
73Annual Report 2020

§Conclude on the appropriateness of management’s use of the going concern basis of accounting and, based on the audit evidence obtained, whether a material uncertainty exists related to events or conditions that may cast significant doubt on the Company’s ability to continue as a going concern. If we conclude that a material uncertainty exists, we are required to draw attention in our auditor’s report to the related disclosures in the financial statements or, if such disclosures are inadequate, to modify our opinion. Our conclusions are based on the audit evidence obtained up to the date of our auditor’s report. However, future events or conditions may cause the Company to cease to continue as a going concern.
§Evaluate the overall presentation, structure and content of the financial statements, including the disclosures, and whether the financial statements represent the underlying transactions and events in a manner that achieves fair presentation.
Auditor’s Responsibilities for the Audit of the Financial Statements (continued)
We communicate with the Board of Directors regarding, among other matters, the planned scope and timing of the audit and significant audit findings, including any significant deficiencies in internal control that we identify during our audit.
We also provide the Board of Directors with a statement that we have complied with relevant ethical requirements regarding independence, and to communicate with them all relationships and other matters that may reasonably be thought to bear on our independence, and where applicable, related safeguards.
From the matters communicated with the Board of Directors, we determine those matters that were of most significance in the audit of the financial statements of the current period and are, therefore, the key audit matters. We describe these matters in our auditor’s report unless law or regulation precludes public disclosure about the matter or when, in extremely rare circumstances, we determine that a matter should not be communicated in our report because the adverse consequences of doing so would reasonably be expected to outweigh the public interest benefits of such communication.
REPORT ON OTHER LEGAL AND REGULATORY REQUIREMENTS
Based on our audit, we further report that in our opinion:
(a) proper books of account have been kept by the Company as required by the Companies Act, 2017 (XIX of 2017);
(b) the statement of financial position, the statement of profit or loss, the statement of comprehensive income, the statement of changes in equity and the statement of cash flows together with the notes thereon have been drawn up in conformity with the Companies Act, 2017 (XIX of 2017) and are in agreement with the books of account and returns;
(c) investments made, expenditure incurred and guarantees extended during the year were for the purpose of the Company’s business; and
Independent Auditors’ ReportTo the members of Faran Sugar Mills Limited
74 Faran Sugar Mills Limited

(d) zakat deductible at source under the Zakat and Ushr Ordinance, 1980 (XVIII of 1980), was deducted by the Company and deposited in the Central Zakat Fund established under section 7 of that Ordinance.
The engagement partner on the audit resulting in this independent auditor’s report is Mr. Muhammad Waseem.
RAHMAN SARFARAZ RAHIM IQBAL RAFIQChartered Accountants
KarachiDate: January 28, 2021
75Annual Report 2020

Financial STATEMENTS
76 Faran Sugar Mills Limited

Financial STATEMENTS
77Annual Report 2020

78 Faran Sugar Mills Limited
Statement of Financial PositionAs at September 30, 2020
Ahmed Ali Bawany Muhammad Omar Bawany Muhammad AyubChief Executive Officer Chairman Chief Financial Officer
2020 2019ASSETS Note ---------- Rupees ----------
Non-current assetsProperty, plant and equipment 5 1,884,930,704 1,874,593,502 Long term investments 6 1,141,756,234 1,279,384,332 Long term deposits 7 10,103,594 15,128,694
3,036,790,532 3,169,106,528 Current assetsStores and spares 8 83,974,351 82,920,357 Stock in trade 9 384,560,366 1,070,394,211 Trade debts 10 183,347,585 128,065,098 Short term investment 11 1,515,500 - Loans, advances, deposits, other receivables 12 676,746,090 732,064,904 Taxation - net 35,958,571 58,729,809 Cash and bank balances 13 160,261,980 395,616,672
1,526,364,443 2,467,791,051 Total assets 4,563,154,975 5,636,897,579
EQUITY AND LIABILITIES
Share capital and reserves
Authorised capital 14 400,000,000 400,000,000
Issued, subscribed and paid up capital 14 250,069,550 250,069,550
Capital reserveShare premium 8,472,152 8,472,152 Surplus on re-measurement of investment 1,134,849 477,273
9,607,001 8,949,425 Revenue reservesGeneral reserve 49,952,868 49,952,868 Unappropriated profit 1,814,834,493 2,011,158,584
1,864,787,361 2,061,111,4522,124,463,912 2,320,130,427
Non-current liabilitiesLong term borrowings from banking companies 15 126,928,993 154,623,652 Deferred liabilities 16 395,522,111 501,702,805
522,451,104 656,326,457 Current liabilitiesTrade and other payables 17 360,289,683 966,416,874 Accrued mark up 30,444,548 73,206,156 Current maturity of long term liabilities 18 120,713,951 88,252,899 Unclaimed dividend 10,825,556 10,104,424 Short term borrowings from banking companies 19 1,393,966,221 1,522,460,342
1,916,239,959 2,660,440,695 Contingency and commitment 20
Total equity and liabilities 4,563,154,975 5,636,897,579
The annexed notes from 1 to 38 form an integral part of these financial statements.

79Annual Report 2020
Statement of Profit or LossFor the year ended September 30, 2020
Ahmed Ali Bawany Muhammad Omar Bawany Muhammad AyubChief Executive Officer Chairman Chief Financial Officer
2020 2019Note ---------- Rupees ----------
Sales revenue - net 21 5,751,429,749 4,619,071,612 Cost of sales 22 (5,482,886,163) (4,336,087,350)Gross profit 268,543,586 282,984,262
Administrative expenses 23 (158,665,059) (170,534,980)Selling and distribution costs 24 (16,986,153) (27,586,890)
(175,651,212) (198,121,870)
Operating profit 92,892,374 84,862,392
Other income 25 21,771,141 557,874,840 Other expenses 26 (6,298,805) (38,707,689)
15,472,336 519,167,151
108,364,710 604,029,543
Finance costs 27 (301,324,109) (310,379,413) (192,959,399) 293,650,130
Share of profit or loss of associates - net 28 41,160,510 227,579,037
(Loss) / profit before taxation (151,798,889) 521,229,167
Taxation 29 (19,518,247) (140,784,058)
(Loss) / profit after taxation (171,317,136) 380,445,109
(Loss) / earnings per share - basic and diluted 30 (6.85) 15.21
The annexed notes from 1 to 38 form an integral part of these financial statements.

80 Faran Sugar Mills Limited
2020 2019---------- Rupees ----------
(Loss) / profit after taxation (171,317,136) 380,445,109
Other comprehensive income
Items that will not be reclassified subsequently to profit or loss:
Increase / decrease in the fair value of investment in certificates of B.F. Modaraba 657,576 (4,039,394)
Total comprehensive (loss) / income for the year (170,659,560) 376,405,715
The annexed notes from 1 to 38 form an integral part of these financial statements.
Statement of Comprehensive IncomeFor the year ended September 30, 2020
Ahmed Ali Bawany Muhammad Omar Bawany Muhammad AyubChief Executive Officer Chairman Chief Financial Officer

81Annual Report 2020
Capital reserves Revenue Reserve
Issued, subscribed and paid up capital
Share premium
General reserve
Unappropriated profits
Surplus on re-measurement of available for sale
investment
Total
------------------------------------------------ (Rupees) -----------------------------------------------
Balance as at September 30, 2018 250,069,550 8,472,152 4,516,667 49,952,868 1,724,489,556 2,037,500,793
Total comprehensive income for the year ended September 30, 2019- Profit after taxation - - - - 380,445,109 380,445,109 - Other comprehensive loss - - (4,039,394) - - (4,039,394)
- - (4,039,394) - 380,445,109 376,405,715 Transactions with owners
Final dividend paid for the year ended September 30, 2018(@ Rs. 3.75 per share) - - - - (93,776,081) (93,776,081)
Balance as at September 30, 2019 250,069,550 8,472,152 477,273 49,952,868 2,011,158,584 2,320,130,427
Total comprehensive income for the year ended September 30, 2020- Loss after taxation - - - - (171,317,136) (171,317,136)- Other comprehensive loss - - 657,576 - - 657,576
- - 657,576 - (171,317,136) (170,659,560)Transactions with owners
Final dividend paid for the year ended September 30, 2019(@ Re. 1.00 per share) - - - - (25,006,955) (25,006,955)
Balance as at September 30, 2020 250,069,550 8,472,152 1,134,849 49,952,868 1,814,834,493 2,124,463,912
The annexed notes from 1 to 38 form an integral part of these financial statements.
Statement of Changes in EquityFor the year ended September 30, 2020
Ahmed Ali Bawany Muhammad Omar Bawany Muhammad AyubChief Executive Officer Chairman Chief Financial Officer
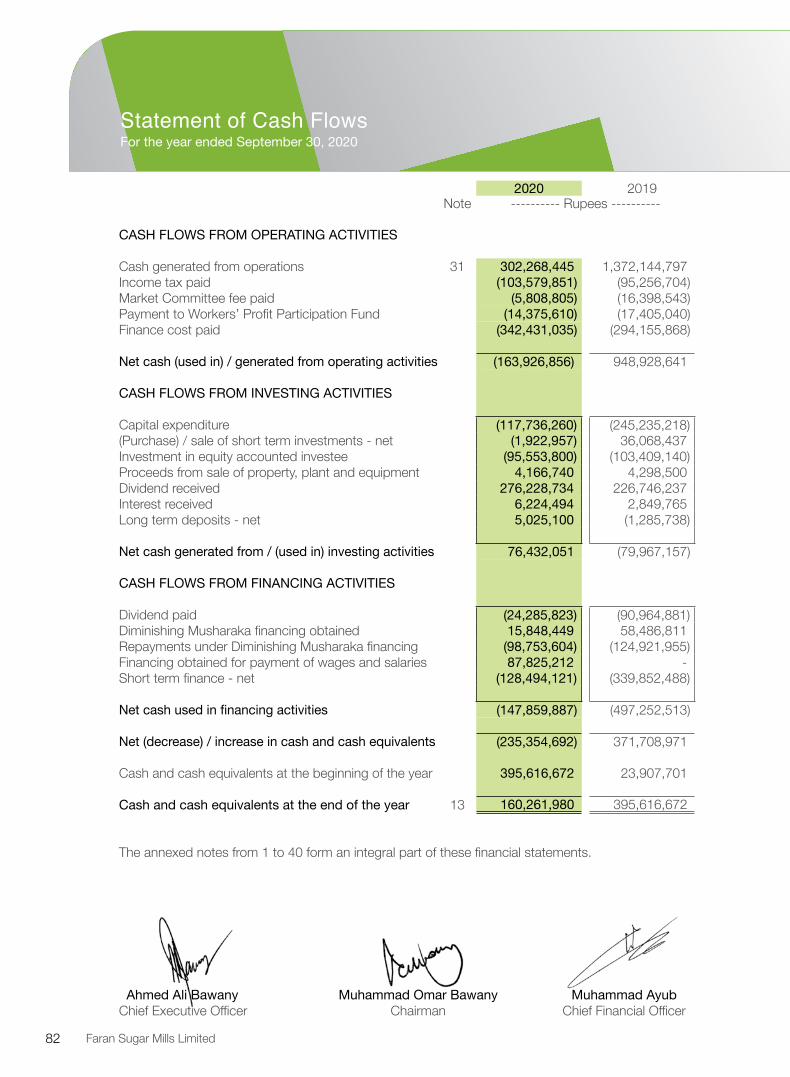
82 Faran Sugar Mills Limited
2020 2019Note ---------- Rupees ----------
CASH FLOWS FROM OPERATING ACTIVITIES
Cash generated from operations 31 302,268,445 1,372,144,797 Income tax paid (103,579,851) (95,256,704)Market Committee fee paid (5,808,805) (16,398,543)Payment to Workers’ Profit Participation Fund (14,375,610) (17,405,040)Finance cost paid (342,431,035) (294,155,868)
Net cash (used in) / generated from operating activities (163,926,856) 948,928,641
CASH FLOWS FROM INVESTING ACTIVITIES
Capital expenditure (117,736,260) (245,235,218)(Purchase) / sale of short term investments - net (1,922,957) 36,068,437 Investment in equity accounted investee (95,553,800) (103,409,140)Proceeds from sale of property, plant and equipment 4,166,740 4,298,500 Dividend received 276,228,734 226,746,237 Interest received 6,224,494 2,849,765 Long term deposits - net 5,025,100 (1,285,738)
Net cash generated from / (used in) investing activities 76,432,051 (79,967,157)
CASH FLOWS FROM FINANCING ACTIVITIES
Dividend paid (24,285,823) (90,964,881)Diminishing Musharaka financing obtained 15,848,449 58,486,811 Repayments under Diminishing Musharaka financing (98,753,604) (124,921,955)Financing obtained for payment of wages and salaries 87,825,212 - Short term finance - net (128,494,121) (339,852,488)
Net cash used in financing activities (147,859,887) (497,252,513)
Net (decrease) / increase in cash and cash equivalents (235,354,692) 371,708,971
Cash and cash equivalents at the beginning of the year 395,616,672 23,907,701
Cash and cash equivalents at the end of the year 13 160,261,980 395,616,672
The annexed notes from 1 to 40 form an integral part of these financial statements.
Statement of Cash FlowsFor the year ended September 30, 2020
Ahmed Ali Bawany Muhammad Omar Bawany Muhammad AyubChief Executive Officer Chairman Chief Financial Officer

83Annual Report 2020
Notes to the Financial StatementsFor the year ended September 30, 2020
1. STATUS AND NATURE OF BUSINESS
Faran Sugar Mills Limited (‘the Company’) was incorporated in Pakistan on November 03, 1981 as a public limited company under the Companies Act, 1913 (repealed with the enactment of the Companies Ordinance, 1984 on October 08, 1984 and subsequently by the Companies Act, 2017 on May 30, 2017). The shares of the Company are listed on Pakistan Stock Exchange (PSX). The principal business of the Company is the production and sale of white sugar.
Following are the principal operating locations of the Company:
Head office: The registered office of the Company is situated at Bungalow No.43-1-E(B) Block 6 P.E.C.H.S., Karachi.
Mill: The mill is located at Sheikh Bhirkio, District Tando Mohammad Khan, Sindh.
2. BASIS OF PREPARATION 2.1 Statement of compliance These financial statements have been prepared in accordance with the accounting and reporting
standards as applicable in Pakistan. The accounting and reporting standards applicable in Pakistan comprise:
- International Financial Reporting Standards (IFRS) issued by the International Accounting
Standards Board (IASB) as notified under the Companies Act, 2017 (the Act);
- Provision of, and directives issued under, the Companies Act, 2017.
Where the provisions of, and directives issued under, the Companies Act, 2017 differ from the IFRS, the former have been followed.
2.2 Basis of measurement These financial statements have prepared under the historical cost convention except for:
(a) Long term investment in quoted equity securities of B.F Modarba which are carried at fair value through other comprehensive income; and
(b) Short term investment in quoted equity securities which are carried at fair value through profit or loss.
2.3 Functional and presentation currency
Items included in these financial statements are measured using the currency of the primary economic environment in which the Company operates. These financial statements are presented in Pak Rupees which is the Company’s functional and presentation currency.
2.4 Use of judgements and estimates In preparing these financial statements, management has made judgements and estimates that
affect the application of the Company’s accounting policies and the reported amounts of assets, liabilities, income and expenses. Actual results may differ from these estimates.

84 Faran Sugar Mills Limited
Notes to the Financial StatementsFor the year ended September 30, 2020
Estimates and underlying assumptions are reviewed on an ongoing basis. Revisions to estimates are recognised prospectively.
(a) Judgements
Information about judgements made in applying accounting policies that have the most significant effects on the amounts recognised in the financial statements is included in the following notes:
Note reference Area of judgement Brief description of the judgement applied
4.1 Property, plant and equipment
Whether the consumption of future economic benefits embodied in the Company’s fixed assets is reduced over time and, accordingly, whether it is appropriate to use ‘diminishing balance method’ as the depreciation method.
4.2 Investment in subsidiary
Whether the Company has control over M/s. Faran Power Limited.
4.2 Investment in associates
Whether the Company has significant influence over M/s. Unicol Limited, M/s. Uni Energy Limited and M/s. UniFood Industries Limited.
4.11 Timing of revenue recognition
Local sales revenue: Whether control of the promised goods is transferred to the customer when the goods are dispatched from the Company’s premises;
Export sales revenue:Whether control of the promised goods is transferred to the customer when the goods are loaded onto the shipping vessel and, as an acknowledgement thereof, a bill of lading is issued by the shipping company.”
7.3(b)(i) Investment in B.F. Modaraba
Whether the investment is a long-term strategic investment and the irrevocable election to present subsequent changes in the fair value of the investment in other comprehensive income (as described in the IFRS 9 ‘Financial Instruments’) can be applied.
15.2.1Financing for
payment of wages and salaries
Whether the financing contains an element of government grant that should be recognized separately as deferred income.

85Annual Report 2020
Notes to the Financial StatementsFor the year ended September 30, 2020
(b) Assumptions and other major sources of estimation uncertainty
Information about assumptions and estimation uncertainties at the reporting date that have a significant risk of resulting in a material adjustment to the carrying amounts of assets and liabilities in the next financial year is included in the following notes:
Notereference
Area of estimation uncertainty
Brief description of the assumption or the source of estimation uncertainty
4.1 Property, plant and equipment
Estimation of useful lives and residual values of the operating fixed assets
4.3 Stores and sparesEstimation of the net realizable value of stores and spares inventory and recognition of the provision for slow-moving items
16.1.1 Deferred taxation
Recognition of deferred tax assets on unused tax losses and unused tax credits - availability of future taxable profit against which deductible temporary differences and unused tax losses and unused tax credits can be utilised
3. NEW ACCOUNTING PRONOUNCEMENTS
3.1 Amendments to approved accounting standards effective during the year ended September 30, 2020:
During the year, certain new accounting and reporting standards / amendments / interpretations
became effective and applicable to the Company. However, since such updates do not have any effect on these financial statements, the same have not been disclosed here.
3.2 Standards, interpretations and amendments to published approved accounting standards that are not yet effective
The following International Financial Reporting Standards (IFRS Standards) as notified under the Companies Act, 2017 and the amendments and interpretations thereto will be effective for accounting periods beginning on or after the dates specified below:
- Amendment to IFRS 3 ‘Business Combinations’ - Definition of a Business (effective for business combinations for which the acquisition date is on or after the beginning of annual period beginning on or after January 01, 2020). The IASB has issued amendments aiming to resolve the difficulties that arise when an entity determines whether it has acquired a business or a group of assets. The amendments clarify that to be considered a business, an acquired set of activities and assets must include, at a minimum, an input and a substantive process that together significantly contribute to the ability to create outputs. The amendments include an election to use a concentration test. The application of the amendment is not likely to affect the financial statements of the Company.
- Amendments to IAS 1 ‘Presentation of Financial Statements’ and IAS 8 ‘Accounting Policies, Changes in Accounting Estimates and Errors’ (effective for annual periods beginning on or after January 01, 2020). The amendments are intended to make the definition of material in IAS 1 easier to understand and are not intended to alter the underlying concept of materiality in IFRS Standards. In addition, the IASB has also issued guidance on how to make materiality

86 Faran Sugar Mills Limited
Notes to the Financial StatementsFor the year ended September 30, 2020
judgments when preparing their general purpose financial statements in accordance with IFRS Standards. The amendments are not likely to affect the financial statements of the Company.
- Interest rate benchmark reform which amended IFRS 9, IAS 39 and IFRS 7 is applicable for annual financial periods beginning on or after January 01, 2020. The G20 asked the Financial Stability Board (FSB) to undertake a fundamental review of major interest rate benchmarks. Following the review, the FSB published a report setting out its recommended reforms of some major interest rate benchmarks such as IBORs. Public authorities in many jurisdictions have since taken steps to implement those recommendations. This has, in turn, led to uncertainty about the long-term viability of some interest rate benchmarks. In these amendments, the term ‘interest rate benchmark reform’ refers to the market-wide reform of an interest rate benchmark including its replacement with an alternative benchmark rate, such as that resulting from the FSB’s recommendations set out in its July 2014 report ‘Reforming Major Interest Rate Benchmarks’ (the reform). The amendments made provide relief from the potential effects of the uncertainty caused by the reform. A company shall apply the exceptions to all hedging relationships directly affected by interest rate benchmark reform. The amendments are not likely to affect the financial statements of the Company.
- Amendments to IFRS 16 - IASB has issued amendments to IFRS 16 (the amendments) to provide practical relief for lessees in accounting for rent concessions. The amendments are effective for periods beginning on or after June 01, 2020, with earlier application permitted. Under the standard’s previous requirements, lessees assess whether rent concessions are lease modifications and, if so, apply the specific guidance on accounting for lease modifications. This generally involves remeasuring the lease liability using the revised lease payments and a revised discount rate. In light of the effects of the COVID-19 pandemic, and the fact that many lessees are applying the standard for the first time in their financial statements, the Board has provided an optional practical expedient for lessees. Under the practical expedient, lessees are not required to assess whether eligible rent concessions are lease modifications, and instead are permitted to account for them as if they were not lease modifications. Rent concessions are eligible for the practical expedient if they occur as a direct consequence of the COVID-19 pandemic and if all the following criteria are met:
a. the change in lease payments results in revised consideration for the lease that is substantially the same as, or less than, the consideration for the lease immediately preceding the change;
b. any reduction in lease payments affects only payments originally due on or before June 30, 2021; and
c. there is no substantive change to the other terms and conditions of the lease.
The above amendments are not likely to affect the financial statements of the Company.
- Classification of liabilities as current or non-current (Amendments to IAS 1) effective for the annual period beginning on or after January 01, 2022. These amendments in the standards have been added to further clarify when a liability is classified as current. The standard also amends the aspect of classification of liability as non-current by requiring the assessment of the entity’s right at the end of the reporting period to defer the settlement of liability for at least twelve months after the reporting period. An entity shall apply those amendments retrospectively in accordance with IAS 8. The amendments are not likely to affect the financial statements of the Company.
87Annual Report 2020
Notes to the Financial StatementsFor the year ended September 30, 2020
- Onerous Contracts – Cost of Fulfilling a Contract (Amendments to IAS 37) effective for the annual period beginning on or after January 01, 2022 amends IAS 1 by mainly adding paragraphs which clarifies what comprise the cost of fulfilling a contract. Cost of fulfilling a contract is relevant when determining whether a contract is onerous. An entity is required to apply the amendments to contracts for which it has not yet fulfilled all its obligations at the beginning of the annual reporting period in which it first applies the amendments (the date of initial application). Restatement of comparative information is not required, instead the amendments require an entity to recognize the cumulative effect of initially applying the amendments as an adjustment to the opening balance of retained earnings or other component of equity, as appropriate, at the date of initial application. The amendments are not likely to affect the financial statements of the Company.
- Property, Plant and Equipment: Proceeds before Intended Use (Amendments to IAS 16) effective for the annual period beginning on or after January 01, 2022 clarifies that sales proceeds and cost of items produced while bringing an item of property, plant and equipment to the location and condition necessary for it to be capable of operating in the manner intended by management e.g. when testing etc., are recognized in profit or loss in accordance with applicable Standards. The entity measures the cost of those items applying the measurement requirements of IAS 2. The standard also removes the requirement of deducting the net sales proceeds from cost of testing. An entity shall apply those amendments retrospectively, but only to items of property, plant and equipment that are brought to the location and condition necessary for them to be capable of operating in the manner intended by management on or after the beginning of the earliest period presented in the financial statements in which the entity first applies the amendments. The entity shall recognize the cumulative effect of initially applying the amendments as an adjustment to the opening balance of retained earnings (or other component of equity, as appropriate) at the beginning of that earliest period presented. The amendments are not likely to affect the financial statements of the Company.
- Annual Improvements to IFRS standards 2018-2020:
The following annual improvements to IFRS standards 2018-2020 are effective for annual reporting periods beginning on or after January 01, 2022:
a. IFRS 9 – The amendment clarifies that an entity includes only fees paid or received between the entity (the borrower) and the lender, including fees paid or received by either the entity or the lender on the other’s behalf, when it applies the ‘10 per cent’ test in paragraph B3.3.6 of IFRS 9 in assessing whether to derecognize a financial liability.
b. IFRS 16 – The amendment partially amends Illustrative Example 13 accompanying IFRS 16 by excluding the illustration of reimbursement of leasehold improvements by the lessor. The objective of the amendment is to resolve any potential confusion that might arise in lease incentives.
c. IAS 41 – The amendment removes the requirement in paragraph 22 of IAS 41 for entities to exclude taxation cash flows when measuring the fair value of a biological asset using a present value technique.
The above amendments are not likely to affect the financial statements of the Company.

88 Faran Sugar Mills Limited
Notes to the Financial StatementsFor the year ended September 30, 2020
4. SUMMARY OF SIGNIFICANT ACCOUNTING POLICIES The significant accounting policies adopted in the preparation of these financial statements are set out below. These policies have been applied consistently to all years presented.
4.1 Property, plant and equipment Operating fixed assets Property, plant and equipment are stated at cost less accumulated depreciation and impairment losses, if any, except free hold land and capital work in progress which are stated at cost less impairment, if any. Cost includes expenditure that are directly attributable to the acquisition of the asset.
Subsequent costs are included in an asset’s carrying amount or recognized as a separate asset, as appropriate, only when it is probable that future economic benefits associated with the item will flow to the Company and its cost can be measured reliably. Cost incurred to replace a component of an item of property, plant and equipment is capitalized, the asset so replaced is retired from use and its carrying amount is derecognized. Normal repairs and maintenance are charged to the statement of profit or loss during the period in which they are incurred.
Major spare parts qualify for recognition as property, plant and equipment when an entity expects to use them during more than one year. Transfers are made to relevant operating assets category as and when such items are available for use.
Depreciation of an asset begins from the date of commencement of reporting period i.e, (quarter) in which when it is the asset becomes available for use and continues till the date it is disposed of. Depreciation on all property, plant and equipment is charged to the statement of profit or loss using the reducing balance method over the asset’s useful life at the rates specified in note 5.1 to these financial statements.
An item of property, plant and equipment is derecognized upon disposal or when no future economic benefits are expected from its use or disposal. Any gain or loss arising on derecognition of the asset (calculated as the difference between the net disposal proceeds and the carrying amount of the asset) is included in the statement of profit or loss in the year in which the asset is derecognized.
Capital work-in progress
Capital work-in-progress is stated at cost less impairment if any, and consists of expenditure incurred and advances made in respect of property, plant and equipment in the course of their construction and installation. Transfers are made to operating fixed assets as and when the assets become available for use.
4.2 Long term investments
Investment in subsidiary
A subsidiary is an entity over which the Company has control. The Company controls an entity when it is exposed, or has rights, to variable returns from its involvement with the entity and has the ability to affect those returns through its power over the entity (which is the Company has existing rights that give it the current ability to direct the relevant activities of the entity).
89Annual Report 2020
Notes to the Financial StatementsFor the year ended September 30, 2020
In these financial statements, investment in subsidiary is carried at its cost less accumulated impairment loss recognized thereon (if any).
Investment in associates
An entity is an associate over which the Company has significant influence. The Company is considered to have significant influence over an entity when it has the power to participate in the financial and operating policy decisions of the entity (but not control or joint control of those policies).
The Company accounts for its investments in associates using the equity method. Under this method investment is initially recognized at cost, being the fair value of consideration given and includes acquisition charges associated with such investments. Subsequently, the Company’s share in profit / loss of the investee is recognized in the statement of profit or loss. Distributions received from the investee reduce the carrying amount of the investment. Adjustment to the carrying amount are also made for changes in the investor’s proportionate interest in the investee arising from changes in the investee’s other comprehensive income.
Where the Company’s share of loss of an associates equal or exceeds its interest in the associates, the Company discontinues to recognize its shares of further losses except to the extent that Company has incurred legal or constructive obligation or made payment on behalf of the associates. If the associate subsequently reports profits, the Company resumes recognizing its share of those profit only after its share of the profit equals the share of losses not recognized.
4.3 Stores and spares
Stores and spares excluding items in transit are valued at lower of average cost and net realizable value.
Items in transit are valued at cost comprising invoice values plus other charges incurred thereon accumulated to the reporting date.
Provisions are made in the financial statements for obsolete and slow moving stores and spares based on management’s best estimate regarding their future usability.
4.4 Stock-in-trade
Basis of valuation
All items of stock-in-trade are valued at the lower of cost and their net realizable value as of the reporting date.
Determination of cost
The cost of inventories comprise all costs of purchase, costs of conversion and other costs incurred in bringing the inventories to their present location and condition.
The costs of purchase of inventories comprise the purchase price, import duties and other taxes (other than those subsequently recoverable by the entity from the taxing authorities), and transport, handling and other costs directly attributable to the acquisition of finished goods, materials and services. Trade discounts, rebates and other similar items are deducted in determining the costs of purchase.

90 Faran Sugar Mills Limited
Notes to the Financial StatementsFor the year ended September 30, 2020
The costs of conversion of inventories include costs directly related to the units of production, such as direct labour. They also include a systematic allocation of fixed and variable production overheads that are incurred in converting materials into finished goods. The allocation of fixed production overheads to the costs of conversion is based on the normal capacity of the production facilities (which is the production expected to be achieved on average over a number of periods or seasons under normal circumstances, taking into account the loss of capacity resulting from planned maintenance). However, in periods of abnormally high production, the amount of fixed overhead allocated to each unit of production is decreased so that inventories are not measured above cost. Variable production overheads are allocated to each unit of production on the basis of the actual use of the production facilities.
Notwithstanding the above, since by-products, by their nature, are immaterial, they are measured at their net realizable value.
The cost of the items consumed or sold and those held in stock at the reporting date is determined using the weighted average cost formula.
Determination of net realizable value
Net realisable value is the estimated selling price in the ordinary course of business less the estimated costs of completion and the estimated costs necessary to make the sale. The cost of inventories may not be recoverable if those inventories are damaged, if they have become wholly or partially obsolete, or if their selling prices have declined. The cost of inventories may also not be recoverable if the estimated costs of completion or the estimated costs to be incurred to make the sale have increased.
Inventories are usually written down to net realisable value item by item. In some circumstances, however, it is deemed appropriate to group similar or related items which may be the case with items of inventory relating to the same product line that have similar purposes or end uses, are produced and marketed in the same geographical area, and cannot be practicably evaluated separately from other items in that product line.
The Company estimates the net realisable value of inventories based on the most reliable evidence available, at the reporting date, of the amount the inventories are expected to realise. These estimates take into consideration fluctuations of price or cost directly relating to events occurring after the end of the reporting period to the extent that such events confirm conditions existing at the end of the reporting period.
While estimating the net realisable value, the Company also takes into consideration the purpose for which the inventory is held. For example, the net realisable value of the quantity of inventory held to satisfy firm sales contracts is based on the contract price. If the sales contracts are for less than the inventory quantities held, the net realisable value of the excess quantity is based on general selling prices.
Raw materials and other supplies held for use in the production of inventories are not written down below cost if the finished products in which they will be incorporated are expected to be sold at or above cost. However, when a decline in the price of materials indicates that the cost of the finished products exceeds net realisable value, the materials are written down to net realisable value. In such circumstances, the replacement cost of the materials is used as the measure of their net realisable value.

91Annual Report 2020
Notes to the Financial StatementsFor the year ended September 30, 2020
A new assessment is made of net realisable value in each subsequent period. When the circumstances that previously caused inventories to be written down below cost no longer exist or when there is clear evidence of an increase in net realisable value because of changed economic circumstances, the amount of the write-down is reversed (i.e. the reversal is limited to the amount of the original write-down) so that the new carrying amount is the lower of the cost and the revised net realisable value.
4.5 Trade debts
These are carried at their transaction price less any allowance for lifetime expected credit losses. A receivable is recognized when the goods are delivered to customers as this is the point in time that the consideration is unconditional because only the passage of time is required before the payment is due.
4.6 Financial assets
4.6.1 Initial recognition, classification and measurement
The Company recognizes a financial asset when and only when it becomes a party to the contractual provisions of the instrument evidencing investment. The Company classifies its financial assets into either of following three categories:
(a) financial assets measured at amortized cost. (b) fair value through other comprehensive income (FVOCI); (c) fair value through profit or loss (FVTPL); and
(a) Financial assets measured at amortized cost
A financial asset is measured at amortized cost if it is held within business model whose objective is to hold assets to collect contractual cash flows, and its contractual terms give rise on specified dates to cash flows that are solely payments of principal and interest on principal amount outstanding.
Such financial assets are initially measured at fair value plus transaction costs that are directly attributable to the acquisition or issue thereof.
(b) Financial assets at FVOCI
A financial asset is classified as at fair value through other comprehensive income when it is held within a business model whose objective is achieved by both collecting contractual cash flows and selling financial assets and its contractual terms give rise on specified dates to cash flows that are solely payments of principal and interest on the principal amount outstanding.
Such financial assets are initially measured at fair value plus transaction costs that are directly attributable to the acquisition or issue thereof.
(c) Financial assets at FVTPL
A financial asset shall be measured at fair value through profit or loss unless it is measured at amortised cost or at fair value through other comprehensive income, as aforesaid.

92 Faran Sugar Mills Limited
Notes to the Financial StatementsFor the year ended September 30, 2020
However, for an investment in equity instrument which is not held for trading, the Company may make an irrevocable election to present in other comprehensive income subsequent changes in the fair value of the investment.
Such financial assets are initially measured at fair value.
4.6.2 Subsequent measurement
(a) Financial assets measured at amortized cost
These assets are subsequently measured at amortized cost (determined using the effective interest method) less accumulated impairment losses.
Interest / markup income, foreign exchange gains and losses and impairment losses arising from such financial assets are recognized in the statement of profit or loss.
(b) Financial assets at FVOCI
These are subsequently measured at fair value less accumulated impairment losses.
A gain or loss on a financial asset measured at fair value through other comprehensive income in accordance is recognised in other comprehensive income, except for impairment gains or losses and foreign exchange gains and losses, until the financial asset is derecognised or reclassified. When the financial asset is derecognised the cumulative gain or loss previously recognised in other comprehensive income is reclassified from equity to profit or loss as a reclassification adjustment. Interest is calculated using the effective interest method and is recognised in profit or loss.
(c) Financial assets at FVTPL
These assets are subsequently measured at fair value.
Net gains or losses arising from remeasurement of such financial assets as well as any interest income accruing thereon are recognized in the statement of profit or loss. However, for an investment in equity instrument which is not held for trading and for which the Company has made an irrevocable election to present in other comprehensive income subsequent changes in the fair value of the investment, such gains or losses are recognized in other comprehensive income. Further, when such investment is disposed off, the cumulative gain or loss previously recognised in other comprehensive income is not reclassified from equity to profit or loss.
4.6.3 Impairment
The Company recognises a loss allowance for expected credit losses in respect of financial assets measured at amortised cost.
For trade receivables, the Company applies the IFRS 9 ‘Simplified Approach’ to measuring expected credit losses which uses a lifetime expected loss allowance.
For other financial assets, the Company applies the IFRS 9 ‘General Approach’ to measuring expected credit losses whereby the Company measures the loss allowance for a financial instrument at an amount equal to the lifetime expected credit losses if the credit risk on that

93Annual Report 2020
Notes to the Financial StatementsFor the year ended September 30, 2020
financial instrument has increased significantly since initial recognition. However, if, at the reporting date, the credit risk on a financial instrument has not increased significantly since initial recognition, the Company measures the loss allowance for that financial instrument at an amount equal to 12-month expected credit losses.
The Company measures expected credit losses on financial assets in a way that reflects an unbiased and probability-weighted amount, time value of money and reasonable and supportable information at the reporting date about the past events, current conditions and forecast of future economic conditions. The Company recognises in profit or loss, as an impairment loss, the amount of expected credit losses (or reversal) that is required to adjust the loss allowance at the reporting date.
Loss allowances for financial assets measured at amortised cost are deducted from the gross carrying amount of the assets.
4.6.4 De-recognition
Financial assets are derecognized when the rights to receive cash flows from the financial assets have expired or have been transferred and the Company has transferred substantially all risks and rewards of ownership.
The Company directly reduces the gross carrying amount of a financial asset when the Company has no reasonable expectations of recovering the financial asset in its entirety or a portion thereof. A write-off constitutes a derecognition event.
4.7 Cash and cash equivalents
Cash and cash equivalents are carried at cost. For the purpose of the statement of cash flows, cash and cash equivalents comprise cash in hand, bank balances and short term borrowings from banks which are repayable on demand and form an integral part of the Company’s cash management, (if any).
4.8 Financial liabilities “Financial liabilities are classified as measured at amortized cost or ‘at fair value through profit or loss’ (FVTPL). A financial liability is classified as at FVTPL if it is classified as held for trading, it is a derivative or it is designated as such on initial recognition. Financial liabilities at FVTPL are measured at fair value and net gains and losses, including any interest expense, are recognized in the statement of profit or loss.
Other financial liabilities are subsequently measured at amortized cost using the effective interest method. Interest expense and foreign exchange gains and losses are recognized in the statement of profit or loss. Any gain or loss on de-recognition is also recognized in the statement of profit or loss.
Financial liabilities are derecognized when the contractual obligations are discharged or cancelled or have expired or when the financial liability’s cash flows have been substantially modified.
4.9 Offsetting of financial assets and financial liabilities
Financial assets and liabilities are offset when the Company has a legally enforceable right to offset and intends to settle either on a net basis or to realise the asset and settle liability simultaneously.
94 Faran Sugar Mills Limited
Notes to the Financial StatementsFor the year ended September 30, 2020
94 Faran Sugar Mills Limited
4.10 Provisions and contingent liabilities
Provisions
A provision is recognised in the statement of financial position when the Company has a legal or constructive obligation as a result of a past event and it is probable that an outflow of resources embodying economic benefits will be required to settle the obligation and a reliable estimate can be made of the amount of obligation. Provisions are not recognised for future operating losses.
Where there are a number of similar obligations, the likelihood that an outflow will be required in settlement is determined by considering the class of obligations as a whole. A provision is recognised even if the likelihood of an outflow with respect to any one item included in the same class of obligations may be small.
Provisions are measured at the present value of management’s best estimate of the expenditure required to settle the present obligation at the end of the reporting period. The discount rate used to determine the present value is a pre-tax rate that reflects current market assessments of the time value of money and the risks specific to the liability. The increase in the provision due to the passage of time is recognised as interest expense.
As the actual outflows can differ from estimates made for provisions due to changes in laws, regulations, public expectations, technology, prices and conditions, and can take place many years in the future, the carrying amounts of provisions are reviewed at each reporting date and adjusted to take account of such changes. Any adjustments to the amount of previously recognised provision is recognised in the statement of profit or loss unless the provision was originally recognised as part of cost of an asset.
Contingent liabilities
A contingent liability is disclosed when the Company has a possible obligation as a result of past events, whose existence will be confirmed only by the occurrence or non-occurrence, of one or more uncertain future events not wholly within the control of the Company; or the Company has a present legal or constructive obligation that arises from past events, but it is not probable that an outflow of resources embodying economic benefits will be required to settle the obligation, or the amount of the obligation cannot be measured with sufficient reliability.
4.11 Revenue
Revenue from sale of goods
Typically, all the contracts entered into by the Company with its customers contain a single performance obligation i.e. the transfer of goods promised in the contract (which may be sugar, molasses or bagasse).
The Company does not expect to have contracts with its customers where the period between the transfer of the promised goods the customer and payment by the customer exceeds one year. As a consequence, the Company does not adjust any of the transaction price for the time value of money.
Revenue from sale of goods is recognized when the customer obtains control of the promised

95Annual Report 2020
Notes to the Financial StatementsFor the year ended September 30, 2020
95Annual Report 2018
goods. This is further analyzed as below:
(a) In case of local sale of goods, the customer is deemed to have obtained control of the promised goods being when the goods are delivered to the customer and there is no unfulfilled obligation that could affect the customer’s acceptance of the goods.
Delivery occurs when the goods have been dispatched from the Company’s premises and either the customer has accepted the goods in accordance with the sales contract, the acceptance provisions have elapsed, or the Company has objective evidence that all criteria for acceptance have been satisfied.
(b) Revenue from export sales is recegnised when the customer obtains control of the goods being when the goods are loaded on to the shipping vessel, and in case of export through land transportation, when the goods are dispatched from the Company’s premises, and there remains no other unfulfilled obligation to be satisfied by the Company.
Export subsidy
Export subsidy is recognized as income in the period in which it becomes receivable i.e. when all the prescribed eligibility criteria have been met and the receipt of the related proceeds from the concerned government authority is probable.
4.12 Staff retirement benefits - Provident fund (defined contribution plan)
A defined contribution plan is a post-employment benefit plan under which an entity pays fixed contribution and will have no legal or constructive obligation to pay further amounts. Obligations for the defined contributions plans are recognized as an employee benefit expense in profit or loss when they are due.
The Company operates a recognized provident fund for all its eligible permanent employees. Equal monthly contributions are made by the Company and employees to the fund at the rate of 9% of basic salary. The Company’s contribution is charged to the statement of profit or loss.
4.13 Ijarah lease arrangements
Upon its inception, an Ijarah lease contract entered into with a bank / other financial institution is evaluated to establish if it meets the Shariah essentials of Ijarah financing as approved by the Shariah Board of the State Bank of Pakistan including, in particular, the essential that, during the entire term of the lease, the lessor should retain title to the assets and bear all risks and rewards pertaining to ownership. If, in substance, all the prescribed Shariah essentials are assessed to be met, the contract is accounted for in accordance with the requirements of the Islamic Financial Accounting Standard (IFAS) 2 ‘Ijarah’ (notified by the Securities & Exchange Commission of Pakistan vide its S.R.O. 431(I)/2007 dated May 22, 2007) whereby the ujrah payments are recognized as an expense in the statement of profit or loss on a straight-line basis over the ijarah term. If, however, it is assessed that the Shariah essentials prescribed for Ijarah financing are not met, the lease contract is accounted in accordance with the requirements of the International Financial Reporting Standard (IFRS) 16 ‘Leases’.

96 Faran Sugar Mills Limited
Notes to the Financial StatementsFor the year ended September 30, 2020
4.14 Other income
Interest income
Return on bank deposits is recognized on a time proportion basis on the principal amount outstanding and at the rate applicable.
Dividend income
Dividends received from investments measured at fair value through profit or loss and at fair value through other comprehensive income are recognized in the statement of profit or loss when the right to receive payment is established, it is probable that the economic benefits associated with the dividend will flow to the Company and the amount of the dividend can be measured reliably. This applies even if they are paid out of pre-acquisition profits, unless the dividend clearly represents a recovery of a part of the cost of an investment. In this case, dividend is recognized in other comprehensive income if it relates to an investment measured at fair value through other comprehensive income.
4.15 Impairment of non-financial assets
At each reporting date, the Company reviews the carrying amounts of its non-financial assets (other than inventories and deferred tax assets) to determine whether there is any indication of impairment. If any such indication exists, then the asset’s recoverable amount is estimated.
For impairment testing, assets are grouped together into the smallest group of assets that generates cash inflows from continuing use that are largely independent of the cash inflows of other assets or Cash Generating Units (CGUs).
The recoverable amount of an asset or CGU is the greater of its value in use and its fair value less costs to sell. Value in use is based on the estimated future cash flows, discounted to their present value using a pre-tax discount rate that reflects current market assessments of the time value of money and the risks specific to the asset or CGU.
An impairment loss is recognised if the carrying amount of an asset or CGU exceeds its recoverable amount.
Impairment losses are recognised in profit or loss. They are allocated to reduce the carrying amounts of the assets in the CGU on a pro rata basis.
An impairment loss is reversed only to the extent that the asset’s carrying amount does not exceed the carrying amount that would have been determined, net of depreciation or amortisation, if no impairment loss had been recognised. A reversal of impairment loss for a cash generating unit is allocated to the assets of the unit pro rata with the carrying amounts of those assets. The increase in the carrying amounts shall be treated as reversals of impairment losses for individual assets and recognized in profit or loss.
4.16 Foreign currency translation
Foreign currency transactions are translated into Pak Rupee using the exchange rates prevailing on the transaction date. At each reporting date, monetary assets and liabilities denominated in foreign currencies are retranslated using the exchange rates prevailing at the reporting date.

97Annual Report 2020
Notes to the Financial StatementsFor the year ended September 30, 2020
All realized and unrealized foreign exchange gains or losses are recognized in the statement of profit or loss.
4.17 Borrowing costs
Borrowing costs are recognized as an expense in the period in which they are incurred except where such costs are directly attributable to the acquisition, construction or production of a qualifying asset in which such costs are capitalized as part of the cost of that asset.
4.18 Taxation
Income tax expense or credit for the period is the tax payable on the current period’s taxable income based on the applicable income tax rate adjusted by changes in deferred tax assets and liabilities attributable to temporary differences and to unused tax losses.
Current tax
The current income tax charge is calculated on the basis of the tax laws enacted or substantively enacted at the end of the reporting period. Management periodically evaluates positions taken in tax returns with respect to situations in which applicable tax regulation is subject to interpretation. It establishes provisions where appropriate on the basis of amounts expected to be paid to the tax authorities.
Deferred tax
Deferred tax is provided in full, using the liability method, on temporary differences arising between the tax bases of assets and liabilities and their carrying amounts in the financial statements. However, deferred income taxes are not accounted for if they arise from the initial recognition of an asset or liability in a transaction other than a business combination that, at the time of the transaction, affects neither accounting nor taxable profit or loss. Deferred income tax is measured using tax rates (and laws) that have been enacted or substantively enacted by the end of the reporting period and are expected to apply when the related deferred income tax asset is realised or the deferred income tax liability is settled.
Deferred tax assets are recognised for deductible temporary differences and unused tax losses and credits only if it is probable that future taxable amounts will be available to utilise those temporary differences and unused tax losses and credits.
Judgment and estimates
Significant judgment is required in determining the income tax expenses and corresponding provision for tax. There may be transactions and calculations for which the ultimate tax determination is uncertain as these matters are being contested at various legal forums. The Company recognizes liabilities for anticipated tax issues based on estimates of whether additional taxes will be due. Where the final tax outcome of these matters is different from the amounts that were initially recorded, such differences will impact the current and deferred tax assets and liabilities in the period in which such determination is made.
Further, the carrying amount of deferred tax assets is reviewed at each reporting date and is adjusted to reflect the current assessment of future taxable profits. If required, carrying amount of deferred tax asset is reduced to the extent that it is no longer probable that sufficient taxable
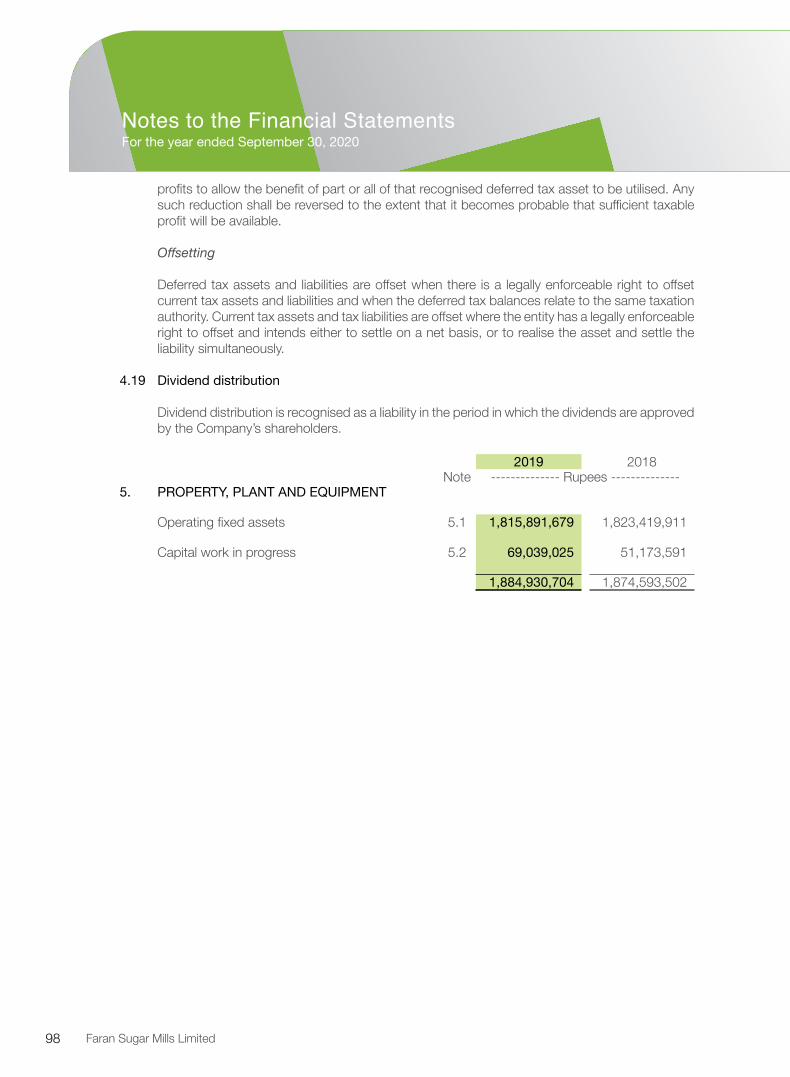
98 Faran Sugar Mills Limited
Notes to the Financial StatementsFor the year ended September 30, 2020
profits to allow the benefit of part or all of that recognised deferred tax asset to be utilised. Any such reduction shall be reversed to the extent that it becomes probable that sufficient taxable profit will be available.
Offsetting
Deferred tax assets and liabilities are offset when there is a legally enforceable right to offset current tax assets and liabilities and when the deferred tax balances relate to the same taxation authority. Current tax assets and tax liabilities are offset where the entity has a legally enforceable right to offset and intends either to settle on a net basis, or to realise the asset and settle the liability simultaneously.
4.19 Dividend distribution Dividend distribution is recognised as a liability in the period in which the dividends are approved
by the Company’s shareholders.
2019 2018Note -------------- Rupees --------------
5. PROPERTY, PLANT AND EQUIPMENT
Operating fixed assets 5.1 1,815,891,679 1,823,419,911
Capital work in progress 5.2 69,039,025 51,173,591
1,884,930,704 1,874,593,502

99Annual Report 2020
Notes to the Financial StatementsFor the year ended September 30, 2020
5.1Op
eratin
g fixe
d ass
ets
Free
hold
land
Facto
ry bu
ilding
Non
facto
ry bu
ilding
W.S
. and
dr
ainag
e sy
stems
Plan
t and
m
achin
ery
Pow
er ge
nerat
ion &
distr
ibutio
n sy
stems
Furni
ture a
nd
fixtur
es O
ffice a
nd m
ill eq
uipme
nt El
ectric
al eq
uipme
nt C
ommu
nicati
on sy
stems
Vehic
les To
tal
-----
------
------
------
------
------
------
------
------
------
------
------
------
------
------
------
------
------
- Rup
ees -
------
------
------
------
------
------
------
------
------
------
------
------
------
------
------
------
------
---
As at
Sep
tembe
r 30,
2018
Cos
t 8,
197,1
45
231,9
62,22
2 10
9,397
,757
5,73
8,868
2,2
54,51
2,393
4,
657,9
05
4,81
0,869
20
,910,7
38
28,35
4,474
4,
849,7
61
99,58
7,894
2,
772,9
80,02
6 A
ccum
ulated
depre
ciatio
n -
)12
1,298
,628)
)54,53
5,411
) )5,
189,3
43)
)914,9
86,71
6) )4,
435,5
70)
)4,10
6,804
) )14
,821,0
72)
)15,44
8,640
) )3,
187,1
56)
)61,88
4,036
) )1,
199,8
93,37
6) Ne
t boo
k valu
e 8,
197,1
45
110,6
63,59
4 54
,862,3
46
549,5
25
1,339
,525,6
77
222,3
35
704,0
65
6,08
9,666
12
,905,8
34
1,66
2,605
37
,703,8
58
1,57
3,086
,650
Mov
emen
t duri
ng th
e yea
ren
ded S
eptem
ber 3
0, 20
19
Open
ing ne
t boo
k valu
e 8,
197,1
45
110,6
63,59
4 54
,862,3
46
549,5
25
1,33
9,525
,677
222,3
35
704,0
65
6,08
9,666
12
,905,8
34
1,66
2,605
37
,703,8
58
1,57
3,086
,650
Add
itions
/ tran
sfers
Direc
t add
itions
- -
-
-
-
37
,111,5
52
-
8,64
3,296
1,
374,3
54
1,34
1,916
-
5,
068,7
00
53,53
9,818
Tra
nsfer
from
CWIP
- 91
,493,6
32
-
135,5
94,04
6 -
50
,908,9
22
-
-
9,38
8,508
10
,419,6
34
-
-
297,8
04,74
2 91
,493,6
32
-
135,5
94,04
6 -
88
,020,4
74
-
8,64
3,296
10
,762,8
62
11,76
1,550
-
5,
068,7
00
351,3
44,56
0 Dis
posa
lsCo
st -
-
-
-
-
-
-
-
)828,0
00)
-
-
)6,27
2,360
) )7,
100,3
60)
Acc
umula
ted de
precia
tion -
-
-
-
-
-
-
-
597,3
61
-
-
5,14
1,854
5,
739,2
15
-
-
-
-
-
-
-
)230,6
39)
-
-
)1,13
0,506
) )1,
361,1
45)
Dep
reciat
ion fo
r the y
ear
-
)10,65
8,244
) )10
,961,1
00)
)52,92
6) )67
,615,3
89)
)21,41
4) )28
5,062
) )1,
113,9
91)
)1,53
7,027
) )10
7,982
) )7,
297,0
18)
)99,65
0,154
) Clo
sing n
et bo
ok va
lues
99,69
0,777
10
0,005
,350
179,4
95,29
2 49
6,599
1,3
59,93
0,762
20
0,921
9,
062,2
99
15,50
7,898
23
,130,3
57
1,55
4,623
34
,345,0
34
1,82
3,419
,911
As at
Sep
tembe
r 30,
2019
Cos
t 99
,690,7
77
231,9
62,22
2 24
4,991
,803
5,73
8,868
2,3
42,53
2,867
4,
657,9
05
13,45
4,165
30
,845,6
00
40,11
6,024
4,
849,7
61
98,38
4,234
3,
117,2
24,22
6 A
ccum
ulated
depre
ciatio
n -
)13
1,956
,872)
)65,49
6,511
) )5,
242,2
69)
)982,6
02,10
5) )4,
456,9
84)
)4,39
1,866
) )15
,337,7
02)
)16,98
5,667
) )3,
295,1
38)
)64,03
9,200
) )1,
293,8
04,31
5) Ne
t boo
k valu
e 99
,690,7
77
100,0
05,35
0 17
9,495
,292
496,5
99
1,359
,930,7
62
200,9
21
9,06
2,299
15
,507,8
98
23,13
0,357
1,
554,6
23
34,34
5,034
1,
823,4
19,91
1
Mov
emen
t duri
ng th
e yea
ren
ded S
eptem
ber 3
0, 20
19
Open
ing ne
t boo
k valu
e 99
,690,7
77
100,0
05,35
0 17
9,495
,292
496,5
99
1,35
9,930
,762
200,9
21
9,06
2,299
15
,507,8
98
23,13
0,357
1,
554,6
23
34,34
5,034
1,
823,4
19,91
1
Addit
ions /
trans
fers
Direc
t add
itions
- -
-
-
-
90
,531,4
44
-
671,5
14
298,9
80
3,86
8,488
-
4,
500,4
00
99,87
0,826
Tra
nsfer
from
CWIP
- -
-
-
-
-
-
-
-
-
-
-
-
-
-
-
90
,531,4
44
-
671,5
14
298,9
80
3,86
8,488
-
4,
500,4
00
99,87
0,826
Dis
posa
lsCo
st -
-
-
-
-
-
-
-
-
-
-
(5,07
9,500
) (5,
079,5
00)
Acc
umula
ted de
precia
tion -
-
-
-
-
-
-
-
-
-
-
1,95
8,201
1,
958,2
01
-
-
-
-
-
-
-
-
-
-
(3,12
1,299
) (3,
121,2
99)
Dep
reciat
ion fo
r the y
ear
-
(9,63
1,726
) (15
,220,5
27)
(47,82
8) (67
,863,8
37)
(19,35
1) (92
1,924
) (1,
553,2
20)
(2,38
9,379
) (97
,582)
(6,53
2,384
) (10
4,277
,759)
Closin
g net
book
value
s 99
,690,7
77
90,37
3,624
16
4,274
,765
448,7
71
1,382
,598,3
68
181,5
70
8,81
1,889
14
,253,6
58
24,60
9,467
1,
457,0
41
29,19
1,750
1,
815,8
91,67
9
As at
Sep
tembe
r 30,
2020
Cos
t 99
,690,7
77
231,9
62,22
2 24
4,991
,803
5,73
8,868
2,4
33,06
4,311
4,
657,9
05
14,12
5,679
31
,144,5
80
43,98
4,512
4,
849,7
61
97,80
5,134
3,
212,0
15,55
2 A
ccum
ulated
depre
ciatio
n -
(14
1,588
,598)
(80,71
7,038
) (5,
290,0
97)
(1,05
0,465
,943)
(4,47
6,335
) (5,
313,7
90)
(16,89
0,922
) (19
,375,0
45)
(3,39
2,720
) (68
,613,3
84)
(1,39
6,123
,873)
Net b
ook v
alue
99,69
0,777
90
,373,6
24
164,2
74,76
5 44
8,771
1,3
82,59
8,368
18
1,570
8,
811,8
89
14,25
3,658
24
,609,4
67
1,45
7,041
29
,191,7
50
1,81
5,891
,679
Annu
al rat
es of
depr
eciat
ion%
0%
10%
10%
10%
5%
10%
10%
10%
10%
10%
20
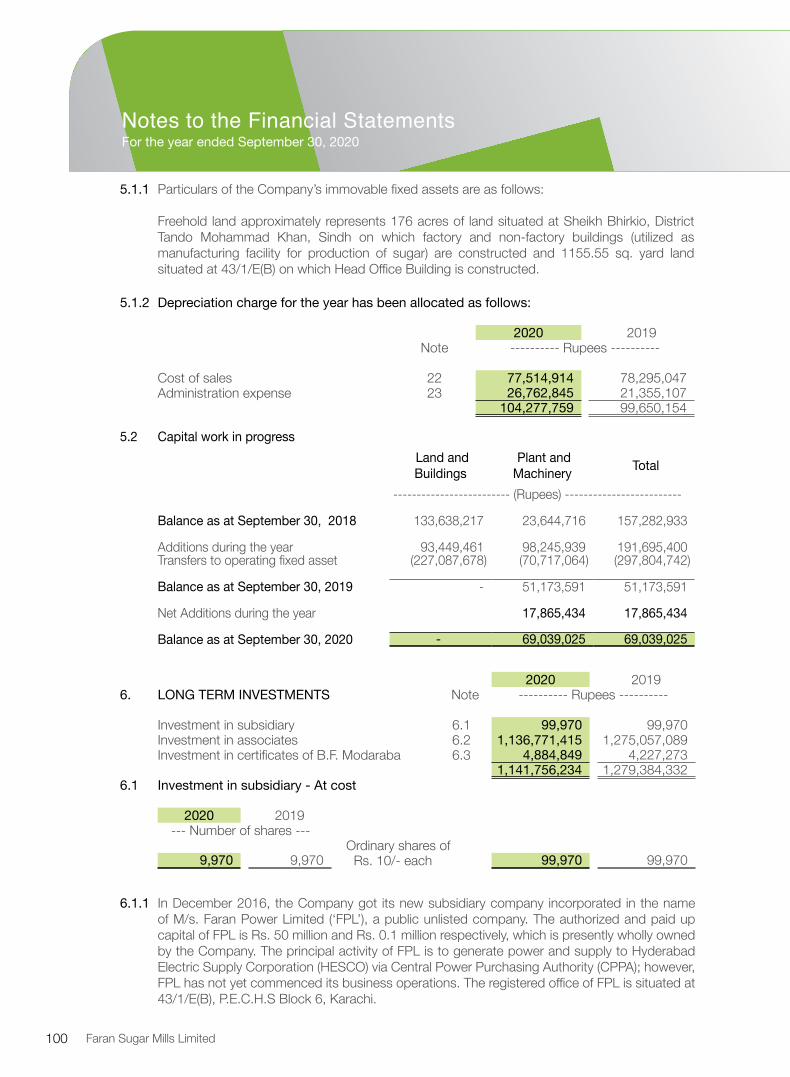
100 Faran Sugar Mills Limited
Notes to the Financial StatementsFor the year ended September 30, 2020
5.1.1 Particulars of the Company’s immovable fixed assets are as follows:
Freehold land approximately represents 176 acres of land situated at Sheikh Bhirkio, District Tando Mohammad Khan, Sindh on which factory and non-factory buildings (utilized as manufacturing facility for production of sugar) are constructed and 1155.55 sq. yard land situated at 43/1/E(B) on which Head Office Building is constructed.
5.1.2 Depreciation charge for the year has been allocated as follows:
2020 2019Note ---------- Rupees ----------
Cost of sales 22 77,514,914 78,295,047 Administration expense 23 26,762,845 21,355,107
104,277,759 99,650,154
2020 20196. LONG TERM INVESTMENTS Note ---------- Rupees ----------
Investment in subsidiary 6.1 99,970 99,970 Investment in associates 6.2 1,136,771,415 1,275,057,089 Investment in certificates of B.F. Modaraba 6.3 4,884,849 4,227,273
1,141,756,234 1,279,384,332 6.1 Investment in subsidiary - At cost
2020 2019--- Number of shares ---
Ordinary shares of 9,970 9,970 Rs. 10/- each 99,970 99,970
6.1.1 In December 2016, the Company got its new subsidiary company incorporated in the name of M/s. Faran Power Limited (‘FPL’), a public unlisted company. The authorized and paid up capital of FPL is Rs. 50 million and Rs. 0.1 million respectively, which is presently wholly owned by the Company. The principal activity of FPL is to generate power and supply to Hyderabad Electric Supply Corporation (HESCO) via Central Power Purchasing Authority (CPPA); however, FPL has not yet commenced its business operations. The registered office of FPL is situated at 43/1/E(B), P.E.C.H.S Block 6, Karachi.
5.2 Capital work in progress Land and Buildings
Plant and Machinery Total
------------------------- (Rupees) -------------------------
Balance as at September 30, 2018 133,638,217 23,644,716 157,282,933
Additions during the year 93,449,461 98,245,939 191,695,400 Transfers to operating fixed asset (227,087,678) (70,717,064) (297,804,742)
Balance as at September 30, 2019 - 51,173,591 51,173,591
Net Additions during the year 17,865,434 17,865,434
Balance as at September 30, 2020 - 69,039,025 69,039,025

101Annual Report 2020
Notes to the Financial StatementsFor the year ended September 30, 2020
6.1.2 In accordance with the provisions of section 228(1) of the Companies Act, 2017, the Company is required to prepare the consolidated financial statements of the Group (comprising the Company and the aforementioned subsidiary company) for the year ended September 30, 2020. However, keeping in view the fact that FPL has not yet commenced its business operations and, at the reporting date, it had no material assets or liabilities, the Company, under section 228(7) of the Companies Act, 2017, applied to the Securities and Exchange Commission of Pakistan (SECP) for seeking exemption from the requirement to prepare consolidated financial statements. Management expects that this exemption will be granted in due course.
6.1.3 As per its unaudited financial information for the year ended June 30, 2020, as of the reporting date, FPL had no assets or liabilities except for the cash balance held in a bank account, amounting to Rs. 0.1 million representing the initial capital injection made by the Company in the form of equity. Further, during the said reporting period, FPL neither generated any revenues nor incurred any expenses.
6.1.4 The aforementioned unaudited financial information of FPL shall be available for inspection at the registered office of the Company and shall be sent to the members on request without any cost.
2020 20196.2 Investment in associates Note ---------- Rupees ----------
Unquoted investments
Unicol Limited 6.2.1 1,076,576,140 1,176,987,124 Uni Energy Limited 6.2.2 20,147,998 19,911,914 UniFood Industries Limited 6.2.3 40,047,277 78,158,051
1,136,771,415 1,275,057,089
6.2.1 Investment in Unicol Limited
As at September 30, 2020, the Company held 49,999,998 (2019: 49,999,998) ordinary shares of M/s. Unicol Limited (UL) which gives the Company 33.33% (2019: 33.33%) voting power in UL. The Company’s arrangement with the associate entails diversification of business activities, and is part of its strategic investment. The principal business activity of UL is to produce ethanol from sugarcane molasses. The registered office of UL is situated at 3rd Floor Modern Motors House, Beaumont Road, Karachi.
(a) Carrying amount of the investment and changes therein
2020 2019---------- Rupees ----------
Cost of investment: 10,499,998 shares of Rs.10/- each 104,999,980 104,999,980 Bonus shares issued: 39,500,000 shares 395,000,000 395,000,000
499,999,980 499,999,980 Accumulated share of profit:Opening balance 676,987,144 532,064,798 Cash dividend received during the year (274,999,984) (224,999,987)Share of profit for the year 174,589,000 369,922,333
576,576,160 676,987,144 Carrying amount as of the reporting date 1,076,576,140 1,176,987,124

102 Faran Sugar Mills Limited
Notes to the Financial StatementsFor the year ended September 30, 2020
(b) Summarized financial information of the associate
Based on its unaudited financial statements for the year ended September 30, 2020, the summarized financial information of M/s. Unicol Limited is as under:
2020 2019---------- Rupees ----------
Current assets 3,096,379,000 3,086,880,000 Non-current assets 2,605,031,000 2,782,007,000 Current liabilities 2,343,134,000 2,186,675,000 Non-current liabilities 128,548,000 151,251,000 Revenue 5,823,337,000 5,501,599,000 Profit after tax for the year 523,767,000 1,109,767,000 Other comprehensive income for the year - - Total comprehensive income for the year 523,767,000 1,109,767,000
6.2.2 Investment in Uni Energy Limited
As at September 30, 2020, the Company held 1,999,998 (2019: 1,999,998) ordinary shares of M/s. Uni Energy Limited (UEL) which gives the Company 20% (2019: 20%) voting power in UEL. The Company’s arrangement with the associate entails diversification of business activities, and is part of its strategic investment. The principal business activity of UEL is to produce power from wind, solar and other alternate power sources, however, it has not commenced its operations yet. The registered office of UEL is situated at 3rd Floor Modern Motors House, Beaumont Road, Karachi.
(a) Carrying amount of the investment and changes therein
2020 2019Note ---------- Rupees ----------
Cost of investment: 1,999,998 shares of Rs.10/- each 19,999,980 19,999,980
Accumulated share of loss / profit:Opening balance (88,066) (157,890)Share of profit for the year (i) 236,084 69,824
148,018 (88,066)Carrying amount as of the reporting date 20,147,998 19,911,914
(i) The share of profit for the year has been calculated based on profits as adjusted by its un-audited financial information for the first quarter ended September 30, 2020.
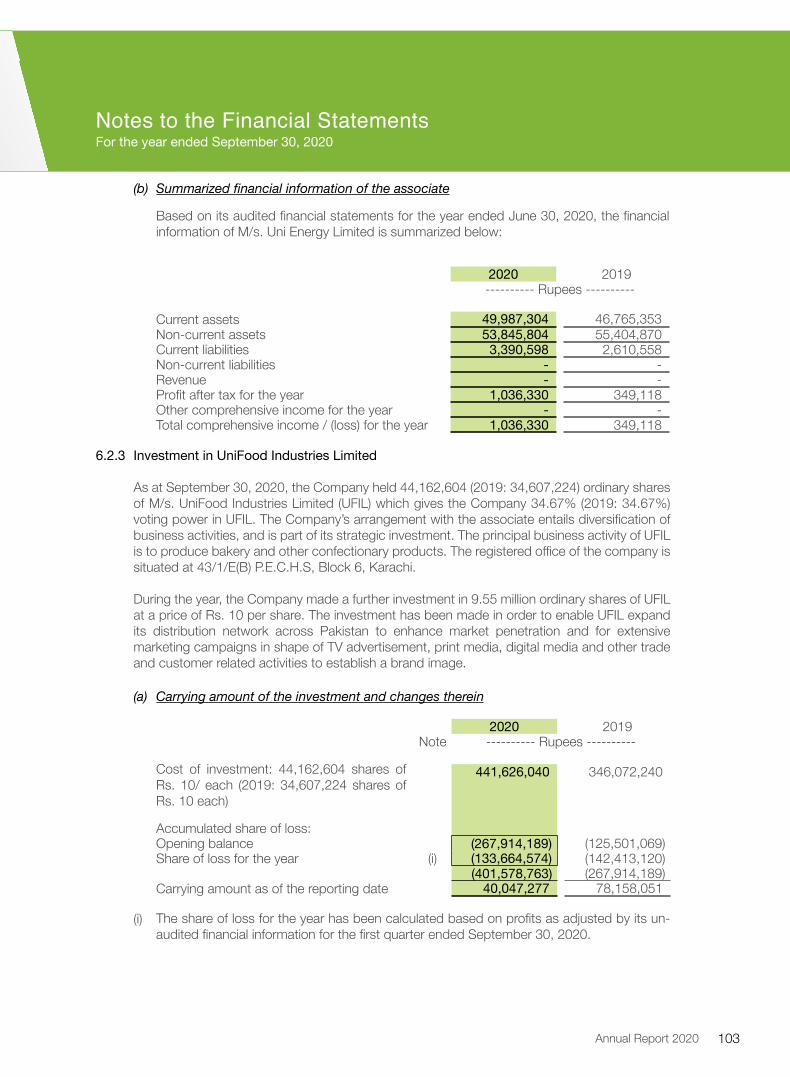
103Annual Report 2020
Notes to the Financial StatementsFor the year ended September 30, 2020
(b) Summarized financial information of the associate
Based on its audited financial statements for the year ended June 30, 2020, the financial information of M/s. Uni Energy Limited is summarized below:
2020 2019---------- Rupees ----------
Current assets 49,987,304 46,765,353 Non-current assets 53,845,804 55,404,870 Current liabilities 3,390,598 2,610,558 Non-current liabilities - - Revenue - - Profit after tax for the year 1,036,330 349,118 Other comprehensive income for the year - - Total comprehensive income / (loss) for the year 1,036,330 349,118
6.2.3 Investment in UniFood Industries Limited
As at September 30, 2020, the Company held 44,162,604 (2019: 34,607,224) ordinary shares of M/s. UniFood Industries Limited (UFIL) which gives the Company 34.67% (2019: 34.67%) voting power in UFIL. The Company’s arrangement with the associate entails diversification of business activities, and is part of its strategic investment. The principal business activity of UFIL is to produce bakery and other confectionary products. The registered office of the company is situated at 43/1/E(B) P.E.C.H.S, Block 6, Karachi.
During the year, the Company made a further investment in 9.55 million ordinary shares of UFIL at a price of Rs. 10 per share. The investment has been made in order to enable UFIL expand its distribution network across Pakistan to enhance market penetration and for extensive marketing campaigns in shape of TV advertisement, print media, digital media and other trade and customer related activities to establish a brand image.
(a) Carrying amount of the investment and changes therein
2020 2019Note ---------- Rupees ----------
Cost of investment: 44,162,604 shares of Rs. 10/ each (2019: 34,607,224 shares of Rs. 10 each)
441,626,040 346,072,240
Accumulated share of loss:Opening balance (267,914,189) (125,501,069)Share of loss for the year (i) (133,664,574) (142,413,120)
(401,578,763) (267,914,189)Carrying amount as of the reporting date 40,047,277 78,158,051
(i) The share of loss for the year has been calculated based on profits as adjusted by its un-audited financial information for the first quarter ended September 30, 2020.

104 Faran Sugar Mills Limited
Notes to the Financial StatementsFor the year ended September 30, 2020
(b) Summarized financial information of the associate
Based on its audited financial statements for the year ended June 30, 2020, the financial information of M/s. UniFood Industries Limited is summarized below:
2020 2019---------- Rupees ----------
Current assets 207,755,803 306,588,078 Non-current assets 913,083,916 926,873,858 Current liabilities 277,575,617 349,122,475 Non-current liabilities 511,507,011 424,179,808 Revenue 677,117,624 488,255,313 Loss for the year after taxation 387,782,741 410,807,076 Other comprehensive income for the year - - Total comprehensive loss for the year 387,782,741 410,807,076
6.3 Investment in B.F. Modaraba - related party (Quoted investment permissible under Sharia)
As at September 30, 2020, the Company held 939,394 (2019: 939,394) certificates of M/s. B.F. Modaraba (‘the Modaraba’) which gives the Company 12.50% (2019: 12.50%) voting power in the Modaraba. The principal business activity of the Modaraba is trading of sugar, investment in quoted securities, leasing, musharika and murahaba transactions. The registered office of Modaraba is situated at 43/1/E(B) P.E.C.H.S Block 6 Karachi. Mr. Muhammad Omar Amin Bawany, the Chairman of the Board of Directors of the Company, also acts as the Chief Executive of the Modaraba.
(a) Carrying amount of the investment and changes therein
2020 2019---------- Rupees ----------
Cost of the investment: 939,394 certificates (including 144,980 bonus certificates) 3,750,000 3,750,000
Unrealised gain on re-measurement:Opening balance 477,273 4,516,667 Decline in fair value during the year 657,576 (4,039,394)
1,134,849 477,273 Carrying amount as of the reporting date 4,884,849 4,227,273
(b) Other relevant information
(i) Since the investment is a long-term strategic investment (i.e. not held for trading purposes), in accordance with the provisions of the International Financial Reporting Standard (IFRS) 9 ‘Financial Instruments’, the Company has made an irrevocable election to present subsequent changes in the fair value of the investment in other comprehensive income.
(ii) During the year ended September 30, 2020, the Company did not receive any dividend from M/s. B.F. Modaraba (2019: None).

105Annual Report 2020
Notes to the Financial StatementsFor the year ended September 30, 2020
Note 2020 20197. LONG TERM DEPOSITS ---------- Rupees ----------
Security deposits in respect of:- Utilities 2,754,094 8,549,094 - Ijarah financing facility 7,329,500 6,559,600 - Others 20,000 20,000
10,103,594 15,128,694
8. STORES AND SPARES
Stores inventory 75,035,142 71,229,414 Spares inventory 17,777,320 17,631,549 Packing materials 2,951,334 5,848,839
95,763,796 94,709,802 Less: Provision for slow moving stores and spares (11,789,445) (11,789,445)
83,974,351 82,920,357 9. STOCK IN TRADE
Finished goods 9.1 381,647,677 1,062,061,495 Work in process 2,912,689 8,332,717
384,560,366 1,070,394,211
9.1 As of the reporting date, the value of stock pledged against bank borrowings amounted to Rs. 307.98 million (2019: Rs. 908.19 million).
10. TRADE DEBTS - unsecured, considered good 2020 2019---------- Rupees ----------
Local receivables 183,347,585 128,065,098
10.1 Ageing analysis of the balances due from related parties as of the reporting date
September 30, 2020Party name
Not yet due 1-30 days past due
31-60 days past due
More than 60 days past due Total
–––––––––––––––––––– Rupees ––––––––––––––––––––
UniFood Industries Limited 4,500,000 - - - 4,500,000 4,500,000 - - - 4,500,000
September 30, 2019Party name
Not yet due 1-30 days past due
31-60 days past due
More than 60 days past due Total
–––––––––––––––––––– Rupees ––––––––––––––––––––
UniFood Industries Limited - - - - - - - - - -

106 Faran Sugar Mills Limited
Notes to the Financial StatementsFor the year ended September 30, 2020
2020 201910.2 Maximum aggregate amounts outstanding ---------- Rupees ----------
during the year
Unicol Limited 61,900,000 4,800,000 UniFood Industries Limited 4,500,000 93,000
11. SHORT TERM INVESTMENTS - At fair value through profit or loss
Investment in quoted equity securities
2020 2019 2020 2019-- (Number of shares) -- Script name Cost Fair value Cost Fair value
––––––––––––––––––– Rupees –––––––––––––––––––
5,000 - Oil and Gas Development Company 728,856 518,000 - - 2,500 - Pakistan State Oil Company Limited 545,925 500,500 - -
25,000 - Fauji Cement Company Limited 424,237 497,000 - - 1,699,018 1,515,500 - -
11.1 Unrealized loss on remeasurement of investments as of the reporting date
Market value of the investment 1,515,500 - Cost of investment (1,699,018) -
(183,518) - 11.2 Movement in unrealized loss on
remeasurement of investments
At the beginning of the year - (12,793,242)Change in fair value of investment during the year (407,457) (12,836,251)Loss realised during the year on disposal of investment 223,939 25,629,493 At the end of the year (183,518) -
2020 201912. LOANS, ADVANCES, DEPOSITS AND Note ---------- Rupees ----------
OTHER RECEIVABLES
Unsecured, considered good
Loans (interest-free) 12.1 30,958,348 16,227,481 Advances (interest-free) 12.2 73,267,560 168,145,685 Deposits 12.3 23,126,440 1,000,000 Other receivables 12.4 549,393,742 546,691,738
676,746,090 732,064,904 12.1 Loans (interest-free)
Loan to growers 30,234,747 13,969,117 Loan to employees 12.1.1 723,601 2,258,364
30,958,348 16,227,481
12.1.1 These loans have been provided to employees in accordance with the terms of employment. These loans are recovered through deduction from monthly payroll.
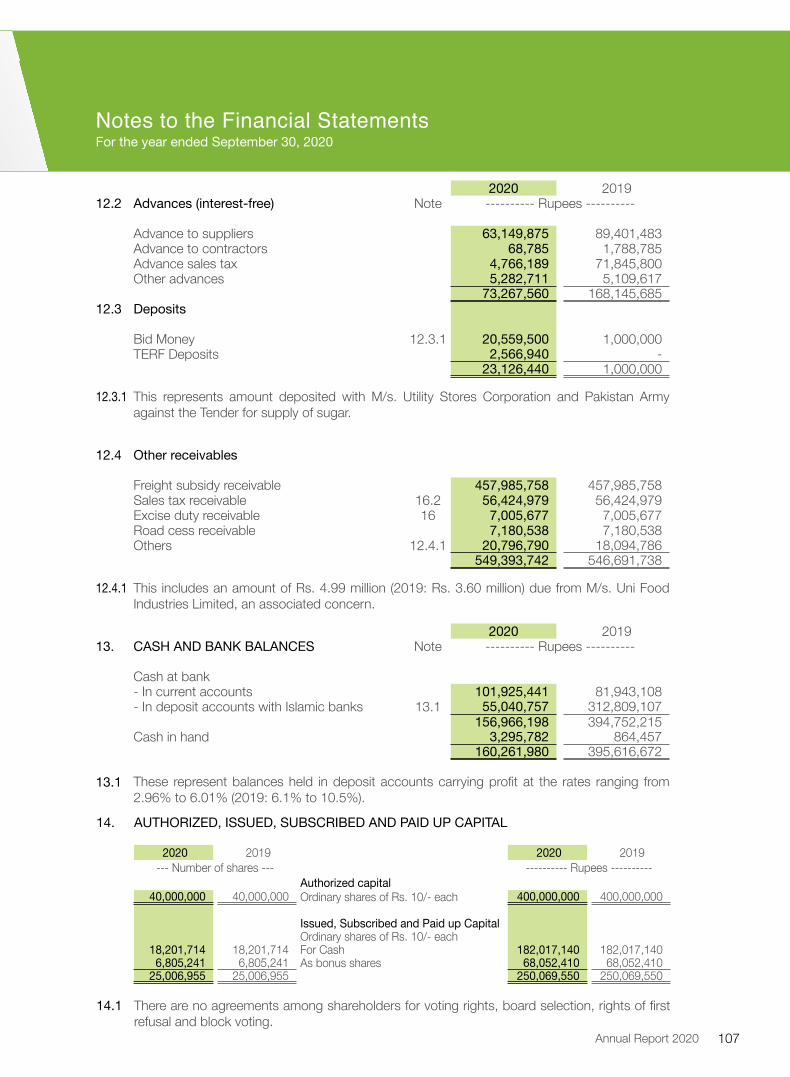
107Annual Report 2020
Notes to the Financial StatementsFor the year ended September 30, 2020
2020 201912.2 Advances (interest-free) Note ---------- Rupees ----------
Advance to suppliers 63,149,875 89,401,483 Advance to contractors 68,785 1,788,785 Advance sales tax 4,766,189 71,845,800 Other advances 5,282,711 5,109,617
73,267,560 168,145,685 12.3 Deposits
Bid Money 12.3.1 20,559,500 1,000,000 TERF Deposits 2,566,940 -
23,126,440 1,000,000
12.3.1 This represents amount deposited with M/s. Utility Stores Corporation and Pakistan Army against the Tender for supply of sugar.
12.4 Other receivables
Freight subsidy receivable 457,985,758 457,985,758 Sales tax receivable 16.2 56,424,979 56,424,979 Excise duty receivable 16 7,005,677 7,005,677 Road cess receivable 7,180,538 7,180,538 Others 12.4.1 20,796,790 18,094,786
549,393,742 546,691,738
12.4.1 This includes an amount of Rs. 4.99 million (2019: Rs. 3.60 million) due from M/s. Uni Food Industries Limited, an associated concern.
2020 201913. CASH AND BANK BALANCES Note ---------- Rupees ----------
Cash at bank- In current accounts 101,925,441 81,943,108 - In deposit accounts with Islamic banks 13.1 55,040,757 312,809,107
156,966,198 394,752,215 Cash in hand 3,295,782 864,457
160,261,980 395,616,672
13.1 These represent balances held in deposit accounts carrying profit at the rates ranging from 2.96% to 6.01% (2019: 6.1% to 10.5%).
14. AUTHORIZED, ISSUED, SUBSCRIBED AND PAID UP CAPITAL
2020 2019 2020 2019 --- Number of shares --- ---------- Rupees ----------
Authorized capital 40,000,000 40,000,000 Ordinary shares of Rs. 10/- each 400,000,000 400,000,000
Issued, Subscribed and Paid up CapitalOrdinary shares of Rs. 10/- each
18,201,714 18,201,714 For Cash 182,017,140 182,017,140 6,805,241 6,805,241 As bonus shares 68,052,410 68,052,410
25,006,955 25,006,955 250,069,550 250,069,550
14.1 There are no agreements among shareholders for voting rights, board selection, rights of first refusal and block voting.
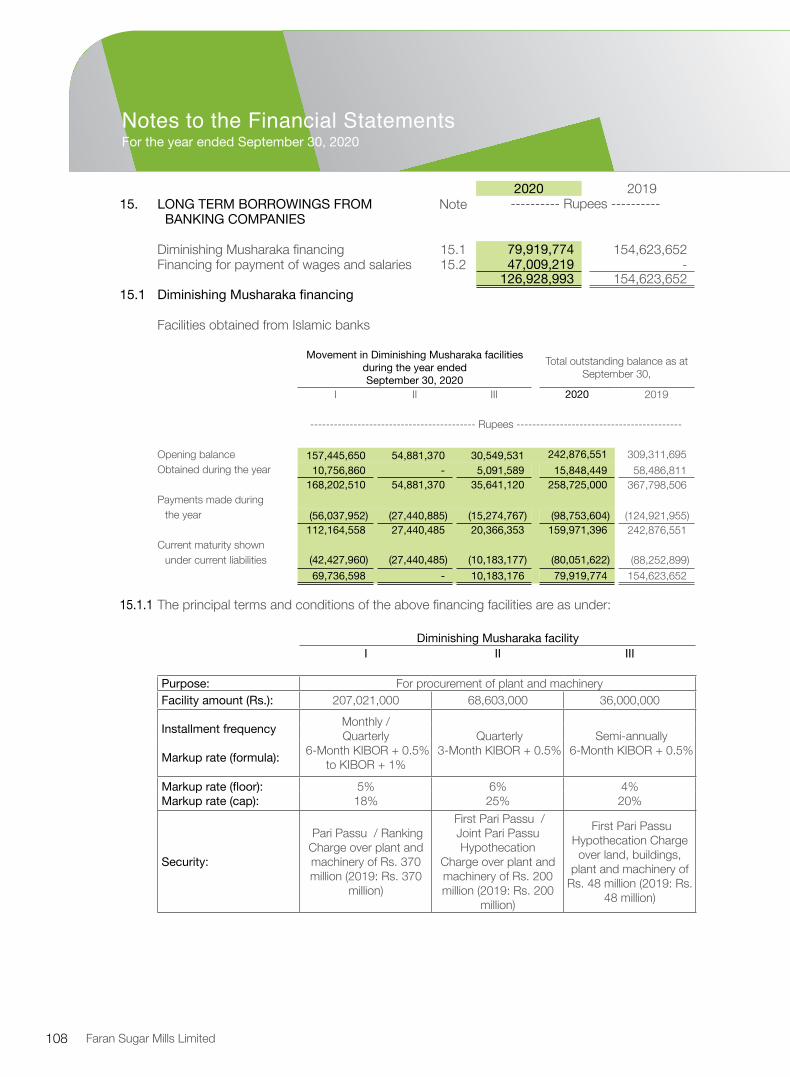
108 Faran Sugar Mills Limited
Notes to the Financial StatementsFor the year ended September 30, 2020
2020 201915. LONG TERM BORROWINGS FROM Note ---------- Rupees ----------
BANKING COMPANIES
Diminishing Musharaka financing 15.1 79,919,774 154,623,652 Financing for payment of wages and salaries 15.2 47,009,219 -
126,928,993 154,623,652 15.1 Diminishing Musharaka financing
Facilities obtained from Islamic banks
Movement in Diminishing Musharaka facilities during the year ended September 30, 2020
Total outstanding balance as at September 30,
I II III 2020 2019
------------------------------------------ Rupees ------------------------------------------
Opening balance 157,445,650 54,881,370 30,549,531 242,876,551 309,311,695 Obtained during the year 10,756,860 - 5,091,589 15,848,449 58,486,811
168,202,510 54,881,370 35,641,120 258,725,000 367,798,506 Payments made during
the year (56,037,952) (27,440,885) (15,274,767) (98,753,604) (124,921,955) 112,164,558 27,440,485 20,366,353 159,971,396 242,876,551
Current maturity shown under current liabilities (42,427,960) (27,440,485) (10,183,177) (80,051,622) (88,252,899)
69,736,598 - 10,183,176 79,919,774 154,623,652
15.1.1 The principal terms and conditions of the above financing facilities are as under:
Diminishing Musharaka facilityI II III
Purpose: For procurement of plant and machinery Facility amount (Rs.): 207,021,000 68,603,000 36,000,000
Installment frequency
Markup rate (formula):
Monthly / Quarterly
6-Month KIBOR + 0.5% to KIBOR + 1%
Quarterly 3-Month KIBOR + 0.5%
Semi-annually 6-Month KIBOR + 0.5%
Markup rate (floor):Markup rate (cap):
5%18%
6%25%
4%20%
Security:
Pari Passu / Ranking Charge over plant and machinery of Rs. 370 million (2019: Rs. 370
million)
First Pari Passu / Joint Pari Passu Hypothecation
Charge over plant and machinery of Rs. 200 million (2019: Rs. 200
million)
First Pari Passu Hypothecation Charge over land, buildings,
plant and machinery of Rs. 48 million (2019: Rs.
48 million)

109Annual Report 2020
Notes to the Financial StatementsFor the year ended September 30, 2020
2020 201915.2 Financing for payment of wages and salaries ---------- Rupees ----------
Total amount borrowed 87,825,212 - Less: Element of government grant recognized as
deferred income (6,755,037) - 81,070,175 -
Add: Effect of unwinding of the loan 1,654,682 - 82,724,856 -
Less: Current maturity shown under current liabilities (35,715,637) - 47,009,219 -
15.2.1 From June 2020 to September 2020, the Company obtained long term financing facilities amounting, in aggregate, to Rs. 87.825 million from M/s. Bank Alfalah Limited under the State Bank of Pakistan (SBP’s) Refinance Scheme for Payment of Wages and Salaries to the Workers and Employees of Business Concerns notified vide IH & SMEFD Circular No. 7 of 2020 dated April 22, 2020. The principal terms and conditions of the facilities are as follows:
(a) The applicable markup rate ranges between 1.5% to 2.25% per annum; (b) The tenure of the facility is 2.5 years (including 6-month grace period ending on December
31, 2020); and (c) The loan is to be repaid in 8 equal quarterly instalments commencing from January 2021.
Since the facilities carry interest rate ranging between 1.5% to 2.25% p.a. which are well below the market interest rate of 8.5% (determined as 3-Month KIBOR as at the date of disbursement plus 1%), in accordance with Circular 11 of 2020 dated August 17, 2020 issued by the Institute of Chartered Accountants of Pakistan (ICAP), the financing is considered to contain an element of government grant as per the IAS 20 ‘Accounting for Government Grants and Disclosure of Government Assistance’ (‘the standard’). Accordingly, the Company measured the loan liability at its fair value of Rs. 81.07 million (determined on a present value basis) and recognized the difference between the disbursement proceeds received from the bank and the said fair value, amounting to Rs. 6.75 million, as deferred income in the statement of financial position. Subsequently, a portion of this deferred income shall be recognized as other income in profit or loss in proportion to the recognition of interest cost on the outstanding loan balance (based on the effective interest rate method).

110 Faran Sugar Mills Limited
Notes to the Financial StatementsFor the year ended September 30, 2020
2020 201916. DEFERRED LIABILITIES Note ---------- Rupees ----------
Deferred taxation - net 16.1 278,444,709 385,277,552 Sales tax payable 16.2 / 12 109,419,576 109,419,576 Provision for excise duty 12 7,005,677 7,005,677 Deferred government grant 16.3 652,149 -
395,522,111 501,702,805 16.1 Deferred taxation - net
Deferred tax liability arising in respect of:
Property, plant and equipment 296,719,207 287,148,420 Investment in associates 86,486,424 101,548,072
383,205,632 388,696,491 Deferred tax asset arising in respect of:
Provision for slow moving stock (3,418,939) (3,418,939)Deferred Tax Assets on business losses (101,341,984) -
(104,760,923) (3,418,939) 278,444,709 385,277,552
16.1.1 Deferred tax asset on business losses amounting to Rs. 57 million have been recognized in respect of current year losses, while deferred tax assets of Rs. 44.3 million relating to business losses of previous years have been recognized only to the extent of future probable profits, based on cash flow and profitability projections considered sufficient against which these amounts can be adjusted.
16.2 Sales tax payable This represents the amount of further tax collected in terms of repealed section 3(1A) of the
Sales Tax Act, 1990 and paid to the extent disclosed in note 13 to these financial statements in view of the judgment of the Honourable High Court of Sindh against the said levy. The Collectorate’s appeal with the Honourable Supreme Court of Pakistan was remanded back to the Honourable High Court of Sindh where it is currently pending for further adjudication.
2020 201916.3 Deferred government grant Note ---------- Rupees ----------
Total deferred government grant 15.2 6,755,037 - Less: Effect of unwinding of income 25 (1,156,196) -
5,598,841 - Less: Current maturity shown under current liabilities (4,946,692) -
652,149 -

111Annual Report 2020
Notes to the Financial StatementsFor the year ended September 30, 2020
2020 2019Note ---------- Rupees ----------
17. TRADE AND OTHER PAYABLES
Creditors:- Raw materials 20,485,901 169,227,277 - Stores and spares 76,558,200 59,911,439
97,044,101 229,138,716 Accrued liabilities 17.1 51,945,485 42,633,407 Advance and deposit from customers 18.2 33,574,461 469,746,566 Sales tax payable 112,149,641 138,758,038 Workers’ Profit Participation Fund 17.3 4,439,446 18,815,056 Workers’ Welfare Fund 17.4 38,641,793 38,641,793 Provision for market committee 2,209,912 7,314,766 Special Excise Duty payable 17.5 13,208,869 13,208,869 Other liabilities 7,075,974 8,159,663
360,289,683 966,416,874
17.1 Accrued liabilities This includes amount of Rs. 8.47 million (2019: Rs. 13.96 million) due to M/s. Reliance
Insurance Limited, an associated concern, as of the reporting date.
17.2 Advances and deposits from customers
During the year, the performance obligations underlying the opening contract liability of Rs. 469.75 million were satisfied in full. Accordingly, the said liability was recorded as revenue during the year.
In addition, information regarding the timing of satisfaction of performance obligations underlying the closing contract liability of Rs. 33.57 million is not presented since the expected duration of all the contracts entered into with the customers is less than one year.
2020 201917.3 Workers’ Profit Participation Fund ---------- Rupees ----------
Balance at the beginning of the year 18,815,056 20,449,412 Allocation for the year - 15,770,684
18,815,056 36,220,096 Less: payment during the year (14,375,610) (17,405,040)
4,439,446 18,815,056
17.4 Workers’ Welfare Fund
Balance at the beginning of the year 38,641,793 32,648,933 Allocation for the year - 5,992,860
38,641,793 38,641,793 Less : payment during the year - -
38,641,793 38,641,793

112 Faran Sugar Mills Limited
Notes to the Financial StatementsFor the year ended September 30, 2020
17.4.1 Workers Welfare Fund (WWF) was established under Workers Welfare Fund Ordinance, 1971 which was under purview of the Federal Government. After the 18th Constitutional amendment introduced in 2010, provinces enacted their own WWF Acts, and claimed jurisdiction over its collection. Management considers that there is lack of clarity on this matter, and these amounts will be paid when the uncertainty is removed. However, provision is being recognized to comply with the legal requirements.
17.5 Special Excise Duty payable
This represents the amount of provision made on account of Special Excise Duty (SED) provided for the month of May and June 2011. In February 2013, the Honourable High Court of Sindh decided the petition in the favour of the Company following which the Commissioner Inland Revenue - Large Taxpayers’ Unit filed an appeal against the said decision in the Honorable Supreme Court of Pakistan where it is currently pending for further adjudication.
2020 201918. CURRENT MATURITY OF LONG TERM Note ---------- Rupees ----------
LIABILITIES
Current maturity of:- Diminishing Musharaka financing 15.1 80,051,622 88,252,899 - Financing for payment of wages and salaries 15.2 35,715,637 - - Deferred government grant 16.3 4,946,692 -
120,713,951 88,252,899
19. SHORT TERM BORROWINGS - Secured
Istisna / Salam finance 19.1 1,393,966,221 1,522,460,342
19.1 This represents the amount availed against Islamic finance facilities provided by various Islamic banks. As at the reporting date, the aggregate limit of these available finances amounted to Rs. 4,700 million (2019: Rs. 4,200 million). These finances are secured against pledge of refined sugar and first pari passu charge over fixed assets of the Company including land, building and plant & machinery carrying profit at the rate of KIBOR + 0.50% to 1% per annum (2019: KIBOR + 0.30% to 1.5% per annum).
20. CONTINGENCIES AND COMMITMENTS
20.1 Contingencies
This include penalty imposed by State Bank of Pakistan (SBP) of Rs. 9,647,674/- as 15% of the shipment value of such export consignments which, according to interpretation of SBP, were delayed by 1 or 2 days. The Company has fled Constitutional petition in the Honorable High Court of Sindh challenging such penalty which, according to Company, was within stipulated time as required under SBP circulars. The Company’s legal advisor is of the view that it is probable that the decision will be in favor of the Company and no financial liability is likely to arise.
Subsequent to balance sheet date, the Commissioner Inland Revenue Zone II, LTO selected
the case of company for tax year 2015, 2017, 2018 and 2019 for audit under section 177(1). The Assistant / Deputy Commissioner (Audit-I) Inland Revenue after notice and hearing, then passed orders in terms of Section 122(I) of identical nature resulting in demand of Rs.5.007

113Annual Report 2020
Notes to the Financial StatementsFor the year ended September 30, 2020
billion for tax year 2015 against declared loss of Rs 51.629 million, demand of Rs.5.86 billion for tax year 2017 against declared income of Rs. 426.78 million, demand of Rs. 5.30 billion for tax year 2018 against declared loss of Rs.223.54 million, and a demand of Rs.3.05 billion for tax year 2019 against declared loss of Rs. 311.68 million. The Company filed appeals against the impugned orders and impugned demand for the aforesaid years before the Commissioner (Appeals) Inland Revenue, where stay of demand for tax years 2017 to 2019 was granted vide stay order reference # CIR (A-1)/Stay Order/ 2020/481 dated December 28, 2020, till January 11, 2021 or decision of appeal, whichever is earlier. The Company also filed Constitutional Petitions before the Honorable Sindh High Court, Karachi for all aforesaid tax years, where the respondents have been restrained by the High Court vide order not to enforce recovery of the impugned demand.
In the opinion of the tax advisor of the Company, the above assessments have been framed
on frivolous and flimsy grounds without applying judicial mind and without due process of law. The Company, therefore, based on the opinion of its legal counsel, has not made any provision in these financial statements against the above impugned orders and impugned demands.
20.2 Commitments
Commitments in respect of corporate guarantee provided to Alternate Energy Development Board (AEDB) onn behalf of Faran Power Limited amounted to Rs. 11.17 million (2019: Rs. 10.54 million), and capital expenditure contracted for but not yet incurred amounted to Rs. 101.83 million approximately (2019: Rs. 54.46 million).
2020 201921. SALES REVENUE - net Note ---------- Rupees ----------
Revenue from local sales - net 21.1 5,129,364,280 4,126,783,405 Revenue from export sales 622,065,469 492,288,207
5,751,429,749 4,619,071,612 21.1 Revenue from local sales - net
Sales of goods to local customers - gross 5,940,734,455 4,653,414,493 Less: Sales tax / Federal excise duty (811,370,175) (526,631,088)
5,129,364,280 4,126,783,405
22. COST OF SALES
Opening stock of finished goods 1,062,061,495 1,292,125,638 Add: Cost of finished goods purchased 123,652,820 31,920,000 Cost of finished goods manufactured 22.1 4,678,819,526 4,074,103,207
5,864,533,841 5,398,148,845 Closing Stock of finished goods (381,647,677) (1,062,061,495)
5,482,886,163 4,336,087,350

114 Faran Sugar Mills Limited
Notes to the Financial StatementsFor the year ended September 30, 2020
2020 2019Note ---------- Rupees ----------
22.1 Cost of finished goods manufactured
Raw materials consumed 4,046,982,893 3,404,504,222 Conversion costs incurred 22.1.1 626,416,605 674,758,510
4,673,399,498 4,079,262,732
Opening stock of work in process 8,332,717 3,173,192 Closing stock of work in process (2,912,689) (8,332,717)
5,420,028 (5,159,525) 4,678,819,526 4,074,103,207
22.1.1 Conversion costs incurred
Salaries, wages and benefits 22.1.1.1 284,015,676 280,768,153 Repairs and maintenance 103,527,448 139,195,702 Depreciation 5.1.2 77,514,914 78,295,047 Stores and spares consumed 67,271,567 81,741,296 Packing materials consumed 40,164,214 43,357,356 Fuel and power 24,527,946 20,425,218 Insurance 14,282,509 15,436,797 Vehicle running expenses 5,930,812 7,156,667 Freight 4,649,462 4,332,532 Others 4,532,057 4,049,742
626,416,605 674,758,510
22.1.1.1 This includes Rs. 3.08 million (2019: Rs. 3.01 million) in respect of staff retirement benefits.
2020 201923. ADMINISTRATIVE EXPENSES Note ---------- Rupees ----------
Salaries and benefits 23.1 88,516,723 79,830,249 Vehicle running 6,337,744 5,007,347 Legal charges 2,669,087 2,614,987 Professional services 166,950 17,021,673 Fees and subscription 5,285,710 5,414,344 Utilities charges 1,914,810 1,840,181 Telephone, postage and telegraph 1,958,744 1,794,587 Traveling and conveyance charges 1,836,018 4,207,994 Rent, rates and taxes 703,500 3,492,179 Ijarah lease rental 9,720,216 8,547,902 Printing and stationery 1,215,976 960,645 Repairs and maintenance 1,943,593 2,284,968 IT related expenses 963,450 1,057,441 Advertisement expenses 258,075 304,100 Auditors’ remuneration 23.2 1,028,000 953,000 Depreciation 5.1.2 26,762,845 21,355,107 Insurance 2,932,869 2,065,095 Provision for slow moving stores and spares - 7,273,471 General expenses 4,450,749 4,509,710
158,665,059 170,534,980
23.1 This includes Rs. 2.31 million (2019: Rs. 2.13 million) in respect of staff retirement benefits.

115Annual Report 2020
Notes to the Financial StatementsFor the year ended September 30, 2020
2020 201923.2 Auditors’ remuneration Note ---------- Rupees ----------
Statutory audit fee 828,000 753,000 Half yearly review 200,000 200,000
1,028,000 953,000 24. SELLING AND DISTRIBUTION COSTS
Export expenses 4,585,270 16,916,989 Handling, transportation and storage 12,400,883 10,669,901
16,986,153 27,586,890
25. OTHER INCOME
Reversal of the provision for unpaid sugarcane cost 25.1 - 527,602,913
Sale of scrap 11,456,687 8,363,007 Profit on deposit accounts 6,224,494 2,849,765 Dividend income 1,228,750 1,746,250 Gain on sale of property, plant and equipment 1,045,441 2,937,355 Exchange gain - 14,282,170 Amortization of deferred government grant 1,156,196 - Miscellaneous income 659,573 93,380
21,771,141 557,874,840
25.1 Reversal of the provision for unpaid sugarcane cost
In its financial statements for the year ended September 30, 2018, the Company had recognized a provision of Rs. 527.603 million for the additional price payable to sugarcane growers (in respect of the crushing season 2017-18) at the rate of Rs. 22 per maund i.e. the difference between the minimum sugarcane price of Rs. 182 per maund as notified by the government and Rs. 160 per maund paid to the growers in that season. The said provision was recognized based on the interim order passed, on January 30, 2018, by the Honourable High Court of Sindh (‘the High Court’) in the Constitutional Petitions No. D-8666 of 2017, 7951 of 2017, 219 of 2018 and 440 of 2018 as well as on account of the Company’s constructive obligation arising from its established past practice of fair dealing with sugarcane growers.
However, during the year ended September 30, 2019, certain new developments arose whereby the sugar industry, as a whole, treated the price of Rs. 160 per maund paid to their respective sugarcane growers during the crushing season 2017-18 as full and final settlement of their liability towards sugarcane growers keeping in view the fact that, there had been no further demand / claim from any of the sugarcane growers in respect of that season and, also that, based on the opinion of the Company’s legal counsel, the industry’s standpoint that the aforesaid settlement at Rs. 160 per maund has become a past and closed transaction is likely to result in a favorable outcome as and when the proceedings of the High Court (adjourned on January 30, 2018) are to be recommenced subsequent to the final verdict of the Honourable Supreme Court of Pakistan in the Civil Appeal no. 48 / 2015 which is awaited.
In view of the development that arose in previous year referred to above, as well as keeping in perspective the fact that the Cane Commissioner had also issued a certificate to the Company to the effect that it had cleared its total liability towards sugarcane growers in relation to the crushing season 2017-18, the aforesaid provision of Rs. 527.603 million recognized in the year 2017-18 had been reversed in the financial statements for the year ended September 30, 2019.
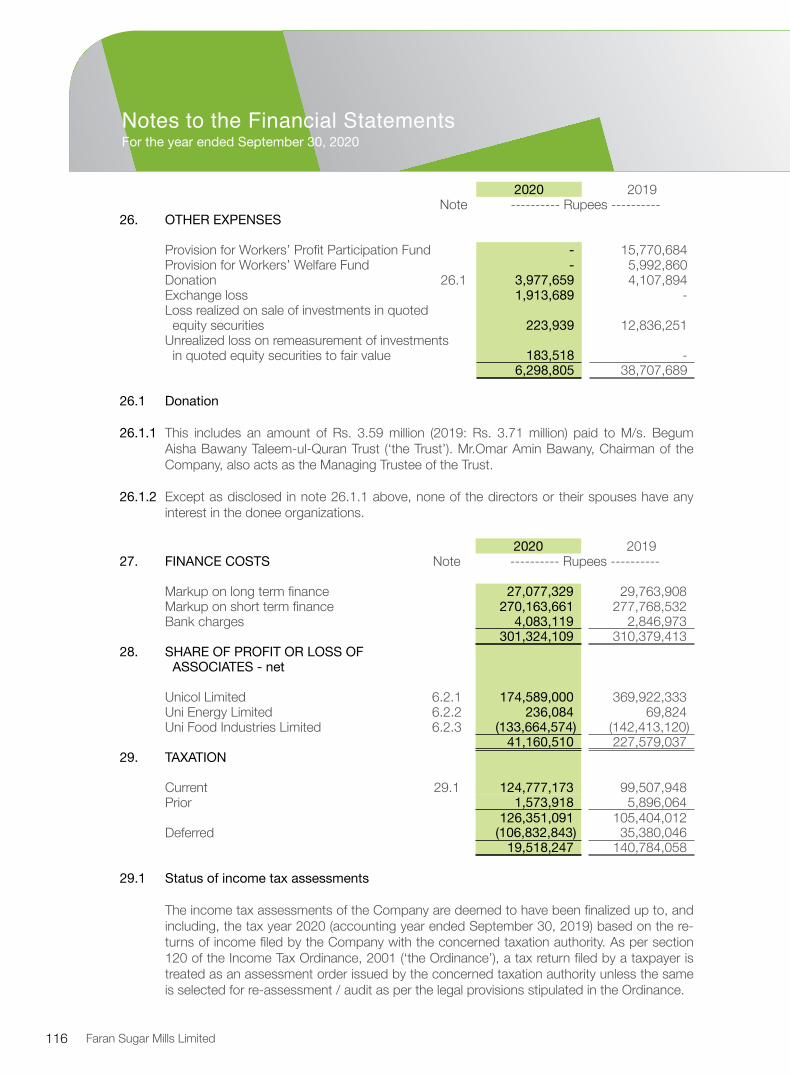
116 Faran Sugar Mills Limited
Notes to the Financial StatementsFor the year ended September 30, 2020
2020 2019Note ---------- Rupees ----------
26. OTHER EXPENSES
Provision for Workers’ Profit Participation Fund - 15,770,684 Provision for Workers’ Welfare Fund - 5,992,860 Donation 26.1 3,977,659 4,107,894 Exchange loss 1,913,689 - Loss realized on sale of investments in quoted
equity securities 223,939 12,836,251 Unrealized loss on remeasurement of investments
in quoted equity securities to fair value 183,518 - 6,298,805 38,707,689
26.1 Donation 26.1.1 This includes an amount of Rs. 3.59 million (2019: Rs. 3.71 million) paid to M/s. Begum
Aisha Bawany Taleem-ul-Quran Trust (‘the Trust’). Mr.Omar Amin Bawany, Chairman of the Company, also acts as the Managing Trustee of the Trust.
26.1.2 Except as disclosed in note 26.1.1 above, none of the directors or their spouses have any interest in the donee organizations.
2020 201927. FINANCE COSTS Note ---------- Rupees ----------
Markup on long term finance 27,077,329 29,763,908 Markup on short term finance 270,163,661 277,768,532 Bank charges 4,083,119 2,846,973
301,324,109 310,379,413 28. SHARE OF PROFIT OR LOSS OF
ASSOCIATES - net
Unicol Limited 6.2.1 174,589,000 369,922,333 Uni Energy Limited 6.2.2 236,084 69,824 Uni Food Industries Limited 6.2.3 (133,664,574) (142,413,120)
41,160,510 227,579,037 29. TAXATION
Current 29.1 124,777,173 99,507,948 Prior 1,573,918 5,896,064
126,351,091 105,404,012 Deferred (106,832,843) 35,380,046
19,518,247 140,784,058
29.1 Status of income tax assessments
The income tax assessments of the Company are deemed to have been finalized up to, and including, the tax year 2020 (accounting year ended September 30, 2019) based on the re-turns of income filed by the Company with the concerned taxation authority. As per section 120 of the Income Tax Ordinance, 2001 (‘the Ordinance’), a tax return filed by a taxpayer is treated as an assessment order issued by the concerned taxation authority unless the same is selected for re-assessment / audit as per the legal provisions stipulated in the Ordinance.

117Annual Report 2020
Notes to the Financial StatementsFor the year ended September 30, 2020
29.2 The numerical reconciliation between tax expense and accounting loss / profit has not been presented for the current year in these financial statements as the total income of the Compa-ny for the current year attracted the provision of minimum tax under section 113 of the Income Tax Ordinance, 2001.
2020 201930. (LOSS) / EARNINGS PER SHARE ---------- Rupees ----------
30.1 Basic (loss) / earnings per share
(Loss) / profit after taxation (171,317,136) 380,445,109
-------------- Number --------------Weighted average number of ordinary shares
outstanding during the year 25,006,955 25,006,955
-------------- Rupees --------------
(Loss) / earnings per share - basic (6.85) 15.21
30.2 Diluted loss / earnings per share
There was no dilutive effect on the basic loss / earnings per share of the Company, since there were no potential ordinary shares in issue as at the reporting date.

118 Faran Sugar Mills Limited
Notes to the Financial StatementsFor the year ended September 30, 2020
2020 201931. CASH GENERATED FROM OPERATIONS Note ---------- Rupees ----------
(Loss) / profit before taxation (151,798,889) 521,229,167
Adjustment for non-cash and other items:- Depreciation 5.1.2 104,277,759 99,650,154 - Provision for slow moving stores and spares 23 - 7,273,471 - Provision for Market Committee fee 703,951 1,083,977 - Reversal of the provision for unpaid
sugarcane cost 25 - (527,602,913)- Profit on deposit accounts 25 (6,224,494) (2,849,765)- Dividend income 25 (1,228,750) (1,746,250)- Gain on sale of property, plant and equipment 25 (1,045,441) (2,937,355)- Amortization of deferred government grant 25. (1,156,196) - - Provision for Workers’ Profit Participation Fund 26 - 15,770,684 - Provision for Workers’ Welfare Fund 26 - 5,992,860 - Loss realized on sale of investments 26 223,939 12,836,251 - Unrealized loss on remeasurement of
investments 26 183,518 - - Finance costs 27 301,324,109 310,379,413 - Share of profit / loss of associates - net 28 (41,160,510) (227,579,037)
204,098,995 211,500,657 Working capital changes
(Increase) / decrease in current assets
- Stores and spares (1,053,994) (15,276,139)- Stock in trade 685,833,845 224,904,619 - Trade debts (55,282,487) 62,355,942 - Loans, advances, deposits and other
receivables 55,318,814 346,618,901
Increase / (decrease) in current liabilities
- Trade and other payables (586,646,728) 542,040,817 98,169,450 1,160,644,140
Cash generated from operations 302,268,445 1,372,144,797

119Annual Report 2020
Notes to the Financial StatementsFor the year ended September 30, 2020
32. TRANSACTIONS AND BALANCES WITH RELATED PARTIES
Related parties comprise of the Company’s subsidiary, associates, key management person-nel (including directors) and staff provident fund. Remuneration and benefits to executives of the Company are in accordance with the terms of the employment while contribution to the provident fund is in accordance with staff service rules. Remuneration of Chief Executive, Directors and executives is disclosed in note 37.4 to the financial statements. Transactions with related parties during the year, other than those disclosed elsewhere in the financial state-ments, are given below:
2020 2019Transactions with associates ---------- Rupees ----------
Sale of goods 509,394,655 378,561,426
Balances outstanding with associateDue from / (to) Unicol Limited 153,891 (175,786,322)Due from UniFood Industries Limited:- trade receivable against sale of sugar 4,500,000 - - other receivables 4,990,000 3,621,454
Balances outstanding with other related partyDue to Reliance Insurance Limited 8,475,640 13,963,532
Transactions with other related partiesInsurance premium paid 23,930,343 14,400,000 Provident fund contribution 5,392,400 5,152,829 Donation 3,596,750 3,709,926
Provident Fund (receivable) / payable (2,560,697) 804,008
33. FINANCIAL INSTRUMENTS
33.1 Categories of financial assets and liabilities
33.1.1 Financial assets
At amortised cost
Long term deposits 10,103,594 15,128,694 Trade debts 183,347,585 128,065,098 Loans, deposits and other receivables 71,591,037 33,063,903 Cash and bank balances 160,261,980 395,616,672
425,304,196 571,874,367 At fair value through profit or loss
Short term investments in quoted equity securities 1,515,500 -
At fair value through other comprehensive income
Long term investment in B.F. Modaraba 4,884,849 4,227,273

120 Faran Sugar Mills Limited
Notes to the Financial StatementsFor the year ended September 30, 2020
2020 2019---------- Rupees ----------
33.1.2 Financial liabilities
At amortised cost
Long term borrowings from banking companies 247,642,944 242,876,551 Trade and other payables 191,849,933 756,993,119 Accrued mark up 30,444,548 73,206,156 Short term borrowings from banking companies 1,393,966,221 1,522,460,342
1,863,903,647 2,595,536,167
33.2 Risks arising from financial instruments
The Board of Directors of the Company has overall responsibility for the establishment and oversight of the Company’s risk management framework. The Company has exposure to the following risks from its use of financial instruments:
- Credit risk - Liquidity risk - Market risk
33.2.1 Credit risk Credit risk is the risk that one party to a financial instrument will cause a financial loss for the
other party by failing to discharge an obligation.
A financial asset is regarded as credit impaired as and when it falls under the definition of a ‘defaulted’ financial asset. For the Company’s internal credit management purposes, a financial asset is considered as defaulted when it is past due for 90 days or more.
The Company writes off a defaulted financial asset when there remains no reasonable probability of recovering the carrying amount of the asset through available means. Written off financial assets are not subject to enforcement activity.
Maximum exposure to credit risk and its management strategies
Following is the quantitative analysis of the Company’s exposure to credit risk at the reporting date:
2020 2019Note ---------- Rupees ----------
Long term deposits 10,103,594 15,128,694
Trade debts (a) 183,347,585 128,065,098
Loans, deposits and other receivables 71,591,037 33,063,903
Bank balances (b) 156,966,198 394,752,215 422,008,414 571,009,910

121Annual Report 2020
Notes to the Financial StatementsFor the year ended September 30, 2020
Note ‘a’ - Credit risk management of trade debts
The Company attempts to control credit risk arising from dealings with customers by monitoring credit exposures and continually assessing the creditworthiness of its customers. As part of its credit risk management strategy, the Company receives advances from customers against sales of goods. In addition, the Company has a system of assigning credit limits to its customers based on an extensive evaluation based on customer profile and payment history. Outstanding customer receivables are regularly monitored.
As of the reporting date, the aging analysis of trade debts was as follows:
September 30, 2020 September 30, 2019
Gross carrying amount
Provision for expected credit
losses
Gross carrying amount
Provision for expected credit
losses------------------------- Rupees -------------------------
Not past due 183,347,585 - 128,065,098 - Past due 1 to 180 days - - - - More than 180 days - - - -
183,347,585 - 128,065,098 -
Based on past experience, consideration of financial position, past track records and recoveries, the Company believes that trade debtors considered good do not require any impairment. The Company trades on advance basis instead of credit basis, therefore, credit risk is usually not involved. Further, substantial amount of debtors have been collected post year end, therefore, expected credit loss has not been considered.
Note ‘b’ - Credit risk management of bank balances
To minimize its exposure to credit risk, the Company maintains its cash balances only with banks with high quality credit worthiness. As of the reporting date, the external credit ratings of the Company’s major bankers were as follows:
Bank Name Credit Rating Agency
Rating Short term Long term
Bank Al Habib PACRA A-1+ AA+Habib Bank Limited JCR-VIS A-1+ AAABank Al-Falah Limited PACRA A-1+ AA+United Bank Limited JCR-VIS A-1+ AAAHabib Metropolitan Bank Limited PACRA A-1+ AA+Muslim Commercial Bank Limited PACRA A-1+ AAABank Al-Barka Islamic Limited PACRA A-1 AMeezan Bank Limited JCR-VIS A-1+ AA+Askari Bank Limited PACRA A-1+ AA+Faysal Bank Limited PACRA A-1+ AAJS Bank Limited PACRA A-1+ AA-Standard Chartered Limited PACRA A-1+ AAASoneri Bank Limited PACRA A-1+ AA-Dubai Islamic Bank Limited JCR-VIS A-1+ AA

122 Faran Sugar Mills Limited
Notes to the Financial StatementsFor the year ended September 30, 2020
Concentration of credit risk
Concentration of credit risk arises when a number of financial instruments or contracts are entered into with the same party, or when counter parties are engaged in similar business activities, or activities in the same geographic region, or have similar economic features that would cause their ability to meet contractual obligations to be similarly affected by changes in economic, political or other conditions. Concentrations of credit risk indicate the relative sensitivity of the Company’s performance to developments affecting a particular industry. As of the reporting date, the Company was not exposed to any major concentrations of credit risk.
33.2.2 Liquidity risk
Liquidity risk is the risk that the Company will encounter difficulty in meeting its financial obligations as they fall due. Liquidity risk arises because of the possibility that the Company could be required to pay its liabilities earlier than expected or difficulty in raising funds to meet commitments associated with financial liabilities as they fall due. The Company’s approach to managing liquidity is to ensure, as far as possible, that it will always have sufficient liquidity to meet its liabilities when due, under both normal and stressed conditions, without incurring unacceptable losses or risking damage to the Company’s reputation. The following are the contractual maturities of financial liabilities:
Setember 30, 2020Carrying Contractual Twelve months One to fiveamount cash flows or less years
-------------------------- (Rupees) --------------------------
Non-derivative financial liabilitiesLong term borrowings from banking companies 247,642,944 247,642,944 120,713,951 126,928,993 Trade and other payables 191,849,933 191,849,933 191,849,933 - Accrued markup 30,444,548 30,444,548 30,444,548 - Short term borrowings from banking companies 1,393,966,221 1,393,966,221 1,393,966,221 -
1,863,903,647 1,863,903,647 1,736,974,654 126,928,993
Setember 30, 2019Carrying Contractual Twelve months One to fiveamount cash flows or less years
-------------------------- (Rupees) --------------------------
Non-derivative financial liabilitiesLong term borrowings from banking companies 242,876,551 242,876,551 88,252,899 154,623,652 Trade and other payables 756,993,119 756,993,119 756,993,119 - Accrued markup 73,206,156 73,206,156 73,206,156 - Short term borrowings from banking companies 1,522,460,342 1,522,460,342 1,522,460,342 -
2,595,536,167 2,595,536,167 2,440,912,515 154,623,652

123Annual Report 2020
Notes to the Financial StatementsFor the year ended September 30, 2020
33.2.3 Market risk
Market risk is the risk that the fair value or future cash flows of a financial instrument will fluctuate because of changes in market prices. Market risk comprises three types of risk: currency risk, interest rate risk and other price risk
i) Currency risk
Foreign currency risk is the risk that the fair value of future cash flows of a financial instrument will fluctuate due to a change in a foreign exchange rate. It arises mainly where receivables and payables exist due to transactions in foreign currency. As of the reporting date, the Company was not exposed to any foreign currency risk.
ii) Interest rate risk
Interest rate risk is the risk that the fair value or future cash flows of a financial instrument will fluctuate because of changes in market interest rates. As of the reporting date, the Company was exposed to cash flow interest rate risk on the long term and short term financing obtained from banks.
Since all the borrowings of the Company are variable rate borrowings, as of the reporting date, the Company was not exposed to fair value risk on its borrowings.
Exposure to interest rate risk:
At the reporting date, the interest rate profile of the Company’s significant interest bearing financial instruments was as follows:
Effective interest rate (%) Carrying amount (Rs.)2020 2019 2020 2019
Financial liabilities - Long term financing 7.37% - 12.40% 10.52% - 14.83% 247,642,944 242,876,551 - Short term finance 7.44% - 15.02% 11.76% - 15.02% 1,393,966,221 1,522,460,342
Financial assets - Bank deposits - pls account 2.99% - 6.01% 6.1% - 10.5% 55,040,757 312,809,107
Sensitivity analysis:
As of the reporting date, if average KIBOR interest rate on borrowings had been 100 basis points higher / lower with all other variables held constant, profit before taxation for the year would have been lower / higher by Rs. 15.81 million (2019: Rs. 14.55 million) respectively, mainly as a result of higher / lower net interest expense.
iii) Other price risk
Other price risk represents the risk that the fair value or future cash flows of a financial instrument will fluctuate because of changes in the market prices (other than those arising from interest/ mark up rate risk or currency risk), whether those changes are caused by factors specific to the individual financial instrument or its issuer, or factors affecting all or similar financial instruments traded in the market. As of the reporting date, the Company was not exposed to any material price risk.

124 Faran Sugar Mills Limited
Notes to the Financial StatementsFor the year ended September 30, 2020
34. FAIR VALUE OF ASSETS AND LIABILITIES
Fair value is the price that would be received to sell an asset or paid to transfer a liability in an orderly transaction between market participants at the measurement date.
The Company measures fair values using the following fair value hierarchy that reflects the significance of the inputs used in making the measurements:
Level 1: quoted prices (unadjusted) in active markets for identical assets or liabilities.
Level 2: inputs other than quoted prices included in Level 1 that are observable for the asset or liability, either directly (i.e. as prices) or indirectly (i.e. derived from prices).
Level 3: inputs for the asset or liability that are not based on observable market data (unobservable inputs).
If the inputs used to measure the fair value of an asset or a liability fall into different levels of the fair value hierarchy, then the fair value measurement is categorised in its entirety in the same level of the fair value hierarchy as the lowest level input that is significant to the entire measurement.
For assets and liabilities that are recognised in the financial statements at fair value on a recurring basis, the management recognises transfers between levels of the fair value hierarchy at the end of the reporting period during which the change has occurred. However, during the year, there were no transfers between the levels of the fair value hierarchy.
Following is the fair value hierarchy of the assets carried at fair value:
Level 1 Level 2 Level 3 Total –––––––––––––––– Rupees ––––––––––––––––
September 30, 2020
- Investment in B.F. Modaraba 4,884,849 - - 4,884,849 - Short term investments 1,515,500 - - 1,515,500
6,400,349 - - 6,400,349
September 30, 2019
- Investment in B.F. Modaraba 4,227,273 - - 4,227,273
35. CAPITAL MANAGEMENT The Board’s policy is to maintain a strong capital base so as to maintain investor, creditor and
market confidence, sustain future development of the business, safeguard the Company’s ability to continue as a going concern in order to provide returns for shareholders and benefit for other stakeholders and to maintain an optimal capital structure to reduce the cost of capital. The Board of Directors monitors the return on capital, which the Company defines as net profit or loss after taxation divided by total shareholders’ equity. The Board of Directors also monitors the level of dividend to ordinary shareholders. There were no changes to the Company’s approach to capital management during the year and the Company is not subject to externally imposed capital requirements.

125Annual Report 2020
Notes to the Financial StatementsFor the year ended September 30, 2020
Following is the quantitative analysis of what the Company manages as capital:
2020 2019---------- Rupees ----------
BorrowingsLong term borrowings 247,642,944 242,876,551
Share capital and reservesIssued, subscribed and paid up capital 250,069,550 250,069,550 General reserves and unappropriated profit 1,863,652,512 2,060,634,179
2,113,722,062 2,310,703,729 2,361,365,007 2,553,580,280
36. OPERATING SEGMENT These financial statements have been prepared on the basis of a single reportable segment as
the Company’s asset allocation decisions are based on a single, integrated business strategy, and the Company’s performance is evaluated on an overall basis.
36.1 Revenue from sales of sugar represents 91.01% (2019: 90.93%) of total revenue whereas remaining represents revenue from sale of molasses, sale of bagasse and sale of power.
36.2 All non current assets of the Company as at September 30, 2020 are located in Pakistan.
36.3 Revenue includes Rs. 622.065 million (2019: Rs. 492.288 million) relating to customers located outside Pakistan.
37. DISCLOSURES REQUIRED BY THE COMPANIES ACT, 2017
37.1 Plant capacity and actual production
2020 2019Quantity No. of days Quantity No. of days
(metric tons) (metric tons)
Sugarcane crushing capacity 1,620,000 180 1,620,000 180
Sugarcane crushed 601,936 105 670,581 89
White sugar produced 65,739 73,696
37.1.1 The main reason for under utilization of the installed capacity is limited availability of sugarcane.

126 Faran Sugar Mills Limited
Notes to the Financial StatementsFor the year ended September 30, 2020
37.2 Number of employees 2020 2019-------------- Number --------------
Total number of employees as at September 30 615 588Average number of employees during the year 602 725
37.3 Investments made by the provident fund
The investments out of provident fund have been made in accordance with the provisions of Section 218 of the Companies Act, 2017 and the rules formulated for this purpose.
37.4 Remuneration of the Chief Executive, Directors and Executives
2020Chief Executive Directors Executives Total
Note ------------------------- Rupees -------------------------
Managerial remuneration 12,763,636 12,567,273 19,588,868 44,919,777 Contribution to provident fund - - 1,834,297 1,834,297 Other perquisites and benefits 37.4.1 1,276,364 1,256,727 20,226,504 22,759,595
14,040,000 13,824,000 41,649,669 69,513,669
Number of persons 1 2 9
2019Chief Executive Directors Executives Total
------------------------- Rupees -------------------------
Managerial remuneration 11,105,455 10,985,455 15,867,480 37,958,390 Contribution to provident fund - - 1,511,221 1,511,221 Other perquisites and benefits 37.4.1 1,110,545 1,098,545 16,686,725 18,895,815
12,216,000 12,084,000 34,065,426 58,365,426
Number of persons 1 2 8
37.4.1 Other perquisites and benefits mainly include house rent allowance, utilities allowance, medical allowance and bonus.
37.4.2 Two non-executive directors were paid fees to attend the board meetings amounting to Rs. 160,000 (2019: Rs. 220,000).
37.4.3 The Chief Executive, executive directors and executives are provided with free use of Company-maintained cars in accordance with their terms of service.
37.5 Impact of COVID-19 on these financial statements
As in the rest of the world, Covid-19 adversely affected lifestyle and business operations in Pakistan. The Company complies with SOPs prescribed by the Federal and Provincial Governments. Sales and export activities were not affected during lockdown, and the shipments were dispatched as per schedule with minor disruptions. The Company remained up to date in all its financial commitments. Management believes that going concern assumption of the Company remains valid, and there are no material implications that require specific disclosure in the financial statements.
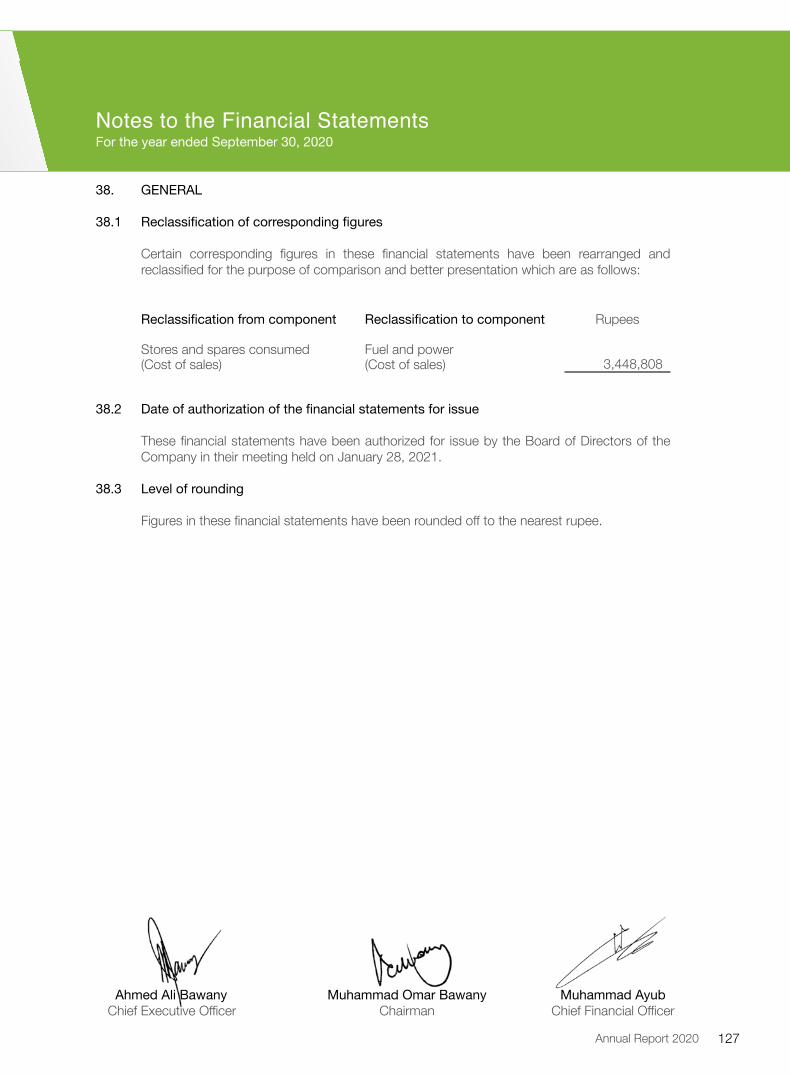
127Annual Report 2020
Notes to the Financial StatementsFor the year ended September 30, 2020
38. GENERAL 38.1 Reclassification of corresponding figures
Certain corresponding figures in these financial statements have been rearranged and reclassified for the purpose of comparison and better presentation which are as follows:
Reclassification from component Reclassification to component Rupees
Stores and spares consumed Fuel and power(Cost of sales) (Cost of sales) 3,448,808
38.2 Date of authorization of the financial statements for issue
These financial statements have been authorized for issue by the Board of Directors of the Company in their meeting held on January 28, 2021.
38.3 Level of rounding
Figures in these financial statements have been rounded off to the nearest rupee.
Ahmed Ali Bawany Muhammad Omar Bawany Muhammad AyubChief Executive Officer Chairman Chief Financial Officer

128 Faran Sugar Mills Limited
Notice of Annual General Meeting
Notice is hereby given that the 39th Annual General Meeting of the Company will be held on Wednesday, February 24, 2021 at 2:00 PM at the Institute of Chartered Accountants of Pakistan, Chartered Accountants Avenue, Clifton, Karachi, to transact the following business:
Ordinary Business
1. To confirm the minutes of last Annual General Meeting held on January 28, 2020.
2. To receive, consider and approve annual audited financial statement of the Company for the year ended September 30, 2020 together with the reports of the auditors’ and directors’ thereon.
3. To appoint auditor of the company for the year September 30, 2021, and to fix their remuneration. The retiring auditors M/s Rahman Sarfaraz Rahim Iqbal Rafiq, Chartered Accountants have given their consent and offered themselves for re-appointment of Auditors of the company for the year ending September 30, 2021.
Special Business
4. To consider and ratify related party transactions as required by Companies Act, 2017.
5. To consider and approve enhancement in monthly emolument of the Chairman, Chief Executive and a working Director, w.e.f. October 2020
6. To consider and approve renewal of Investment upto un-utilized amount of Rs. 630 million and Corporate Guarantee; if required, in the Uni-Energy Limited.
7. To consider and approve renewal of investments upto un-utilized amount of Rs. 113.5 million, in Uni-Food industries Limited (UFIL).
8. To transact any other business with permission of the Chair.
BY ORDER OF THE BOARD
Karachi. Muhammad AyubDated: January 28, 2021 Company Secretary

129Annual Report 2020
2. A member entitled to attend and vote at the Annual General Meeting may appoint another member as his/her proxy to attend and vote in his/her Behalf, proxies in order to be effective must be received by the Company at its registered office not later than 48 hours before the time of the meeting.
3. The shareholders are requested to notify the Company immediately the change in their address, if any.
4. Any individual Beneficial Owner of CDC, entitled to vote at the meeting, must bring original NIC with him/her to prove his/her identity, and in case of a proxy, a copy of Shareholder’s attested NIC must be attached with the proxy form, Representative of corporate members should bring the usual documents required for such purpose.
5. Submission of CNIC / NTN: (Mandatory)
Under directives of SECP, it is mandatory for the shareholders to provide a copy of the Computerized National Identity Card (CNIC), In case of individuals, a National Tax Number (NTN) in case of corporate entity. Therefore, all shareholders are requested to immediately send the required information to the share registrar of the company.
6. Availability of Annual Audited Financial Statements on the Company’s website
In accordance with the provisions of Section 223(7) of the Companies Act, 2017, the audited financial statements of the Company for the year ended September 30, 2020, are available on the Company’s website (http://www.faran.com.pk).
7. Unclaimed / Unpaid dividend and Shares Certificates
Shareholders who could not collect their dividend /physical shares are advised to contact Share Registrar or our Registered Office to enquire and collect their unclaimed dividend/shares, if any. In compliance with section 244 of the Companies Act, 2017, after having completed the stipulated procedure, all such unclaimed dividend and shares for a period of 3 years or more from the date it is due and payable shall be deposited to the credit of Federal Government in case of unclaimed dividend and in case of shares, shall be delivered to Securities and Exchange Commission of Pakistan (SECP).
8. Video Conference facility
Members can also avail video conference facility, In this regard, please fill the following form and submit to registered address of the company ten days before holding of the annual general meeting. If the company receives consent from members holding in aggregate 10% or more shareholding residing at a geographical location, to participate in the meeting through video conference at least 10 days prior to meeting, the company will arrange a video conference facility.
I/We, of the Faran Sugar Mills Limited, holder of ordinary shares as per registered Folio #/CDC Account No. hereby opt for video conference facility.
9. Transmission of Financial Statements & Notices through E-mail
The Securities and Exchange Commission of Pakistan (SECP) through its Notification S.R.O. 787(I)/2014 dated September 8, 2014 has permitted companies to circulate Audited Financial Statements along
Notes:
1. The share transfer books of the company will remain closed from February 18, 2021 to February 24, 2021 (Both days inclusive).

130 Faran Sugar Mills Limited
Notice of Annual General Meeting
with Notice of Annual General Meeting to its members through e-mail. Accordingly, members are requested to send their consent and e-mail addresses for receiving Audited Financial Statements and Notices through e-mail. In order to avail this facility, a standard request form is available at the Company’s website
Statement under section 134 of the Companies Act, 2017
The statement sets out the material facts concerning “Special Businesses” to be transacted at the Annual General Meeting of the Company to be held on February 24, 2021. The approval of the Members of the Company will be sought for
Item No. 4 of the Agenda
During the financial year ended September 30, 2020 the Company carried out transactions with its associated companies and related parties in accordance with its policies and applicable laws and regulation. Related party transactions require shareholders’ approval under section 208 of the Companies Act, 2017. Such transactions are being placed before the shareholders for their approval through special resolution proposed to be passed in the Annual General Meeting.
The shareholders are requested to ratify the transactions which have been disclosed in Note no. 32 of the Financial Statements for the year ended September 30, 2020 and further to authorize the Board of Directors to conduct transactions with related parties or associated companies for the year ending September 30, 2020.
Party wise breakup of transactions as disclosed in Note no. 32 of the Financial Statements for the year ended September 30, 2020 is given below
Name of Related Party Nature of Transaction Amount (Rs.)Associates
Unicol Limited Sales made 494,678,105Unicol Limited Dividend Income received 274,999,984Uni-Food Industries Limited Sales made 14,716,550Uni-Food Industries Limited Investment made 95,553,800
Common DirectorshipBegum Aisha Bawany Taleem-ul-Quran Trust Donation 3,596,750Reliance Insurance Company Limited Insurance Premium paid 23,930,343
Provident Fund Trust Charge for Staff Provident Fund 5,392,400
Item No. 5 of the Agenda
Chairman, Vice Chairman and Chief Executive Remuneration
The Board of Directors in its meeting held on January 28, 2021 recommended to approve remuneration along with other benefits as per service rule for the Chairman and Chief Executive, and a Director, w.e.f. October 01, 2020 for this purpose that the following resolution be passed with or without modification.
“Resolved that the consent of the Company be and hereby accorded to the aggregate remuneration to Mr. Ahmed Ali Bawany – Chief Executive, a sum of Rs. 1,263,600/- per month and Mr. Bilal Omar Bawany, Director, a sum of Rs. 331,560/- per month w.e.f. from October 01, 2020, and other benefits as per service rules.”

131Annual Report 2020
“Further resolved that the monthly honorarium of Rs. 912,600/- for the Chairman is approved”
Item No. 6 of the Agenda
The Company had obtained the approval from shareholders for investment upto Rs. 650 million in the equity of Uni-Energy Limited (UEL). UEL has been granted Letter of Intent and formally allotted land for setting up the project at Jhimpir, district Thatta. The JV partners have made initial equity investment in the Company to meet the ongoing financial requirements for the project. The government has, so far, not notified the tariff for the project. FSML has made an equity investment of Rs. 19.99 million till date following the approval of the shareholders. The remaining amount will be invested by FSML as and when required by Uni-Energy Limited. All the relevant/required material information has already been disseminated to shareholders of the company in the EOGM held on October 27, 2015 and in AGM held on January 27, 2018.
“Resolved that the consent and approval be and is hereby accorded for renewal of investment up to un-utilized amount of Rs. 630 million and corporate guarantee, if required, in the Uni-Energy Limited.”
Item No. 7 of the Agenda
The Company had obtained approval from the shareholders for investment of Rs. 455 million in the equity of Uni Food Industries Limited (UFIL) and Corporate guarantee. UFIL commenced commercial production in March 2018. All the relevant/required material information has already been disseminated to shareholders of the company in the EOGM held on November 17, 2016 and AGM held on January 28, 2019.
The Company obtained further equity investment of Rs. 140 million in the UNI-FOOD INDUSTRIES LIMITED – an associate joint venture unlisted public company (UFIL), in AGM held on January 28, 2020, for induction of new line/ expanding existing line of production, expanding distribution network across Pakistan to enhance market penetration and for extensive marketing campaigns in shape of TV advertisements, print media, digital media and other trade and customer related activities to establish a brand image. The Company has invested Rs. 481.5 million till date.
“Resolved that the consent and approval be and is hereby accorded for renewal of investment up to un-utilized amount of Rs. 113.5 million and corporate guarantee, if required, in the Uni-Food Industries Limited.”

132 Faran Sugar Mills Limited
Pattern of ShareholdersFor the year ended September 30, 2020
Shareholding Total Shares HoldNo. of Shareholders From To
1191 1 - 100 20,663539 101 - 500 127,158159 501 - 1000 130,329201 1001 - 5000 474,72258 5001 - 10000 446,28616 10001 - 15000 200,55212 15001 - 20000 216,348
7 20001 - 25000 164,73012 25001 - 30000 335,120
4 30001 - 35000 133,3275 35001 - 40000 195,5161 40001 - 45000 42,9132 45001 - 50000 92,6021 50001 - 55000 51,7751 55001 - 60000 59,1941 75001 - 80000 75,5002 90001 - 95000 182,6003 95001 - 100000 300,0001 100001 - 105000 101,5002 105001 - 110000 213,0561 120001 - 125000 120,6001 130001 - 135000 132,4262 145001 - 150000 293,3661 150001 - 155000 151,3951 160001 - 165000 162,0001 165001 - 170000 167,4012 180001 - 185000 365,3221 200001 - 205000 203,5001 230001 - 235000 232,8251 255001 - 260000 256,2091 305001 - 310000 305,3281 315001 - 320000 318,2211 325001 - 330000 327,5001 335001 - 340000 338,7011 340001 - 345000 342,5291 420001 - 425000 420,1991 475001 - 480000 479,5731 480001 - 485000 482,4701 495001 - 500000 497,5851 530001 - 535000 530,5721 550001 - 555000 551,2651 820001 - 825000 823,7401 1140001 - 1145000 1,140,1151 1275001 - 1280000 1,275,4311 1460001 - 1465000 1,462,9401 1615001 - 1620000 1,616,8751 2120001 - 2125000 2,120,2741 2295001 - 2300000 2,299,5121 4025001 - 4030000 4,025,190
2249 25,006,955
Sr. No. Catagories of Shareholders Number of Shareholders Total Shares Hold Percentage %
1 INDIVIDUALS 2174 19,639,214 78.542 INVESTMENT COMPANIES 1 4,500 0.023 INSURANCE COMPANIES 2 169,724 0.684 JOINT STOCK COMPANIES 31 931,108 3.725 FINANCIAL INSTITUTIONS 4 28,689 0.116 MODARABAS 1 231 07 OTHERS 17 1,000,476 48 CHARITABLE TRUSTS 1 18,000 0.079 MUTUAL FUND 8 2,680,774 10.72
10 WELFARE SOCIETY 1 47,102 0.1911 EMPLOYEES PENSION FUND 3 391,209 1.5612 EMPLOYEES BENEVOLENT FUND 1 8,990 0.0413 GRATUITY FUND 1 5,000 0.0214 EMPLOYEES PROVIDENT FUND 1 10,000 0.0415 COOPERATIVE SOCIETIES 1 438 016 VOLUNTARY PENSION FUND 2 71,500 0.29
2249 25,006,955 100

133Annual Report 2020
Categories of ShareholdingAs at September 30, 2020
Folio Name of Company Holding Percetage %
14902-000021 CDC - TRUSTEE NATIONAL INVESTMENT (UNIT) TRUST 2120274 8.48 00480 A.A.BAWANY FOUNDATION 497585 1.99
15974-000023 CDC - TRUSTEE NBP ISLAMIC STOCK FUND 327500 1.31 20662 ZAIBUNISA FOUNDATION 318221 1.27
03277-078335 TRUSTEE NATIONAL BANK OF PAKISTAN EMPLOYEES PENSION FUND 256209 1.02 03277-093619 AMIN TAI (PRIVATE) LIMITED 182663 0.73 03277-022406 MEHRAN SUGAR MILLS LTD 162000 0.65 02683-000023 STATE LIFE INSURANCE CORP. OF PAKISTAN 151395 0.61 04010-000021 FAWAD YUSUF SECURITIES (PVT.) LIMITED 120600 0.48 14415-000021 CDC - TRUSTEE NAFA PENSION FUND EQUITY SUB-FUND ACCOUNT 106000 0.42 05819-000023 CDC - TRUSTEE ALHAMRA ISLAMIC STOCK FUND 101500 0.41 06726-000023 CDC-TRUSTEE ALHAMRA ISLAMIC ASSET ALLOCATION FUND 92000 0.37 03277-007041 HABIB SUGAR MILLS LTD 90600 0.36 03277-026972 WESTBURY (PRIVATE) LTD 75500 0.3
00478 O.A.TRADING COMPANY (PVT) LTD. 59194 0.24 03277-003397 PAKISTAN MEMON EDUCATIONAL & WELFARE 47102 0.19 03277-008399 O.A.TRADING CO.(PVT) LTD 42913 0.17 03277-001339 PREMIER FASHIONS (PVT) LTD 40000 0.16 04366-029417 SUPER PETROCHEMICALS PRIVATE LIMITED 40000 0.16 15727-000022 CDC - TRUSTEE PAKISTAN PENSION FUND 38000 0.15 03277-040179 YOUSUF YAQOOB KOLIA AND COMPANY (PVT.) Ltd 34500 0.14 15719-000023 CDC-TRUSTEE ALHAMRA ISLAMIC PENSION FUND - EQUITY SUB FUND 33500 0.13
20133 MADINA ESTATES PROPERTIES LTD 30437 0.12 07179-000020 MUHAMMAD SALIM KASMANI SECURITIES (Pvt.) Ltd 30000 0.12 18176-000027 AKIK CAPITAL (PRIVATE) LIMITED 30000 0.12 14431-000029 CDC - TRUSTEE NAFA ISLAMIC PENSION FUND EQUITY ACCOUNT 29000 0.12 16402-000020 CDC - TRUSTEE NBP ISLAMIC ACTIVE ALLOCATION EQUITY FUND 29000 0.12 03889-000077 NATIONAL BANK OF PAKISTAN 26520 0.11
22177 O.A.MANAGEMENTS 25612 0.1 03277-003361 MADINA ESTATES & PROPERTIES (PVT) LTD 22064 0.09
22172 O.A.INDUSTRIES 19923 0.08 22173 O.R.& SONS 19923 0.08 22174 NAAFAY MANAGEMENTS 19923 0.08
03277-007330 RELIANCE INSURANCE COMPANY LTD. 18329 0.07 04424-002648 BEGUM AISHA AHMED AND LATIF BAWANY FOUNDATION 18000 0.07 03277-048757 TRUSTEES OF MIRPURKHAS SUGAR MILLS LTD 10000 0.04
22175 SHAHEDA ASSOCIATE 9961 0.04 22176 AYESHA ASSOCIATE 9961 0.04
03277-082127 TRUSTEE NATIONAL BANK OF PAKISTAN EMP BENEVOLENT FUND TRUST 8990 0.04 22679 MR. AUZAIR RAZZAK 7947 0.03
17632-000021 CDC - TRUSTEE NBP ISLAMIC REGULAR INCOME FUND 7000 0.03 00479 EBRAHIM BAWANY FOUNDATION 5923 0.02
03277-008930 TRUSTEES AL-ABBAS SUGAR MILLS LTD EMP.GF 5000 0.02 16881-000023 SAKARWALA CAPITAL SECURITIES (PRIVATE.) LTD 5000 0.02 03277-010498 PERWAIZ TRADING CORP.(PVT) LTD 4700 0.02 03277-100990 SAAS ENTERPRISES (PVT.) LIMITED 4500 0.02 03277-104940 AL HAYY TRADING (PRIVATE) LIMITED 4500 0.02
00477 EBRAHIM TRADING CO (PVT) LTD 4414 0.02 03277-049694 MARINE SERVICES (PVT.) LIMITED 3000 0.01 06684-154214 YOUSUF YAQOOB KOLIA AND COMPANY (PRIVATE) LTD 3000 0.01 14373-000027 MCBFSL - TRUSTEE ABL ISLAMIC STOCK FUND 3000 0.01 05348-000021 HH MISBAH SECURITIES (PRIVATE) LIMITED 2500 0.01 14241-000022 FIKREES (PRIVATE) LIMITED 2310 0.01

Categories of ShareholdingAs at September 30, 2020
Folio Name of Company Holding Percetage %
03889-000028 NATIONAL BANK OF PAKISTAN 1731 0.01 04184-000022 AZEE SECURITIES (PRIVATE) LIMITED 1000 0 04366-000020 MULTILINE SECURITIES (PVT) LIMITED 1000 0 14670-000020 MULTILINE SECURITIES (PVT) LIMITED - 1000 0
22537 A.SATTAR MOTIWALA SEC PVT LTD 802 0 04978-006361 STOCK MASTER SECURITES (PVT) LTD 519 0 05736-000015 NCC - PRE SETTLEMENT DELIVERY ACCOUN 500 0 12195-000021 CDC - TRUSTEE ABL STOCK FUND 500 0
19967 NATIONAL INDUSTRIAL CO-OP 491 0 00364-242907 KHOJA (PIRHAI) SHIA ISNA ASHARI JAMAT 438 0
22704 GHULAMAN-E-ABBAS EDUCATIONAL AND 350 0 00518 NATIONAL BANK OF PAKISTAN 346 0
10611-000020 AKD SECURITIES LIMITED - AKD TRADE 288 0 22534 OMEGA SECURITES PVT LTD 235 0 21875 CONSOLIDATED MODARABA (PVT)LTD 231 0
03525-054825 NAEEM’S SECURITIES (PVT) LTD 152 0 18990 M/S NAEEM SECURITY LTD. 150 0
03525-057191 SARFRAZ MAHMOOD (PRIVATE) LTD 133 0 20653 MUSLIM COMMERCIAL BANK LTD. 92 0
00620-000021 TAURUS SECURITIES LIMITED 78 0 21080 M/S CONSOLIDATED TRADING & 11 0
03525-087235 MAPLE LEAF CAPITAL LIMITED 1 0
DIRECTOR,CEO,AND THEIR SPOUSE Shares Held Percentage %MR. MUHAMMAD OMAR BAWANY 254722 1.02MR. AHMED ALI BAWANY 4025190 16.1MR. HAMZA OMAR BAWANY 644029 2.58MR. BILAL OMAR BAWANY 551265 2.2MR. ALTAMASH AHMED ALI 2500 0.01MR. IRFAN ZAKARIA BAWANY 2625 0.01MR. AHMED GHULAM HUSSAIN 2500 0.01MRS. RUKSANA OMAR 2131256 8.52
SHARE HOLDERS HOLDING FIVE PERCENTS OR MORE INTREST Shares Held Percentage %MR. AHMED ALI BAWANY 4025190 16.1ROSHAN ARA MOHAMMAD AMIN 1462940 5.85RUKSANA OMAR BAWANY 2131256 8.52AYESHA AMIN 1755004 7.02SHAHIDA AMIN 2037074 8.15GULSHANRA AMIN 2299512 9.19NATIONAL INVESTMENT UNIT TRUST 2120274 8.48

IMPORTANTInstrument of Proxy will not be considered as valid unless it is deposited or received at the Company’s Head Office at 43-1-E(B), P.E.C.H.S., Block 6, off Razi Road, Shahrah-e-Faisal, Karachi not later than 48 hours before the time of holding the meeting.
I/We __________________________________________________________________________________________
of ____________________________________________________________________________________________
being member of Faran Sugar Mills Limited, hereby appoint ___________________________________________
____________________________________________ of ____________________________________________
another member of the Company as my/ our proxy to attend & vote for me/ us and on my/ our behalf at the
39th Annual General Meeting of the Company to be held on Wednesday, February 24, 2021 at 2:00 pm and at
any adjournment thereof.
WITNESSES
1. Signature _______________________________
Name __________________________________
Address ________________________________
________________________________________
CNIC or Passport No. ____________________
2. Signature _______________________________
Name __________________________________
Address ________________________________
________________________________________
CNIC or Passport No. ____________________
Signature ofShareholder
Registered Folio/ Participant’s
ID No. & A/c No. __________________________
_________________________________________
No. of Shares held _________________________
Please affixRevenueStampRs.5
Form of Proxy

دوپہر 2 بجے بدھ، فروری 2021 ,24 کو

43-1-E(B), P.E.C.H.S., Block 6,off Razi Road, Shahrah-e-Faisal, Karachi.UAN:92-21-111-BAWANY (229-269)FAX: 92-21-34322864Email:[email protected]:www.faran.com.pk


