Page 1
Accepted Manuscript
Folate intake and folate serum levels in men and women from two Europeanpopulations: The IMMIDIET project
George Pounis, MSc Augusto F. Di Castelnuovo, PhD Michel de Lorgeril, MD VittorioKrogh, MD Alfonso Siani, MD Jozef Arnout, MD, PhD Francesco P. Cappuccio, MDMartien van Dongen, PhD Bruno Zappacosta, MD Maria Benedetta Donati, MD, PhDGiovanni de Gaetano, MD, PhD Licia Iacoviello, MD, PhD
PII: S0899-9007(13)00542-X
DOI: 10.1016/j.nut.2013.11.014
Reference: NUT 9167
To appear in: Nutrition
Received Date: 22 April 2013
Revised Date: 18 November 2013
Accepted Date: 21 November 2013
Please cite this article as: Pounis G, Di Castelnuovo AF, de Lorgeril M, Krogh V, Siani A, Arnout J,Cappuccio FP, van Dongen M, Zappacosta B, Donati MB, de Gaetano G, Iacoviello L, , Folate intakeand folate serum levels in men and women from two European populations: The IMMIDIET project,Nutrition (2014), doi: 10.1016/j.nut.2013.11.014.
This is a PDF file of an unedited manuscript that has been accepted for publication. As a service toour customers we are providing this early version of the manuscript. The manuscript will undergocopyediting, typesetting, and review of the resulting proof before it is published in its final form. Pleasenote that during the production process errors may be discovered which could affect the content, and alllegal disclaimers that apply to the journal pertain.
Page 2
MANUSCRIP
T
ACCEPTED
ACCEPTED MANUSCRIPT1
Folate intake and folate serum levels in men and women 1
from two European populations: The IMMIDIET project 2
Running title: Folate intake and levels in 2 EU countries 3
4
George Pounis MSc1, Augusto F Di Castelnuovo PhD1, Michel de Lorgeril, MD2, 5
Vittorio Krogh, MD3, Alfonso Siani, MD4, Jozef Arnout, MD, PhD5, Francesco P 6
Cappuccio, MD6, Martien van Dongen, PhD7, Bruno Zappacosta, MD8, Maria 7
Benedetta Donati, MD, PhD1, Giovanni de Gaetano, MD, PhD1, Licia Iacoviello, MD, 8
PhD1, on behalf of the European Collaborative Group of the IMMIDIET Project 9
10
1Department of Epidemiology and Prevention, IRCCS Istituto Neurologico 11
Mediterraneo Neuromed, Pozzilli (IS), Italy 12
2Université Joseph Fourier-CNRS, Faculté de Médecine, La Tronche, France 13
3Istituto Nazionale dei Tumori, Milan, Italy 14
4Institute of Food Sciences, CNR, Avellino, Italy 15
5Katholieke Universiteit Leuven, Belgium 16
6Warwick Medical School, Coventry, United Kingdom 17
7Maastricht University, The Netherlands 18
8U.O.C. Laboratorio Analisi, Fondazione di Ricerca e Cura ”Giovanni Paolo II”, 19
Università Cattolica del Sacro Cuore, Campobasso, Italy 20
*IMMIDIET Project Investigators are listed in the Appendix 21
22
Page 3
MANUSCRIP
T
ACCEPTED
ACCEPTED MANUSCRIPT2
Corresponding Author: Licia Iacoviello, MD, PhD, Department of Epidemiology 23
and Prevention, IRCCS Istituto Neurologico Mediterraneo Neuromed, Via 24
dell’Elettronica. 86077 Pozzilli, (IS), Italy. E-mail: [email protected] . Tel: 25
+39.0865929664. 26
27
Author contribution 28
Conception and design of the study: MdL, VK, AS, JA, FPC, LI. Generation, 29
collection, assembly, analysis and/or interpretation of data: GP, AFDC, MdL, VK, 30
AS, JA, FPC, MvD, LI. Drafting or revision of the manuscript: GP, AFDC, MdL, VK, 31
AS, JA, FPC, MvD, MBD, GdG, LI. Approval of the final version of the manuscript: 32
GP, AFDC, MdL, VK, AS, JA, FPC, MvD, MBD, GdG, LI. 33
Page 4
MANUSCRIP
T
ACCEPTED
ACCEPTED MANUSCRIPT3
ABSTRACT 34
Objective: Folate status has been associated with neural tube defects and 35
cerebrovascular disease. We aimed at evaluating possible differences in folate status 36
in two EU Countries and to assess their possible association with dietary patterns 37
and/or other lifestyles. Methods and Procedures: In the framework of the EU-38
funded IMMIDIET Project, 1,068 subjects (534 man-woman pairs), aged 26-64 years, 39
were enrolled in Italy and UK. 1-year-recall Food Frequency Questionnaire was used 40
to evaluate dietary intake. Reduced Rank Regression-analysis was used to derive a 41
dietary pattern better describing high dietary folate intake. Results: 11.3% of the 42
Italians and 45.1% of the British exceeded the optimal dietary folate intake of 43
400µg/day (Recommended Dietary Allowance). 66.7% and 22.1% of Italian and UK 44
women, respectively, all at childbearing age, had folate serum levels lower than 45
6.62ng/ml (P=0.01). The percentage of total variance of dietary folate intake 46
explained by food group consumption was 14.2% and 16.3% in Italy and UK, 47
respectively. Reduced Rank Regression-analysis indicated a healthy pattern which 48
was positively associated with folate serum levels in both Countries (for all β-coef>0, 49
P<0.001):100µg/day increase in dietary folate intake was associated with 13.8% and 50
10.5% increase in folate serum levels in the Italian and English population, 51
respectively (for 100µg/day increase eβ-coef=1.138 and 1.105, P<0.001). Smoking habit 52
was negatively but physical activity positively associated with folate serum levels 53
(P<0.05). Conclusion(s): An inadequate dietary folate intake and subsequent serum 54
levels were observed in Italian subjects. High consumption of food sources of folate 55
was positively associated with folate serum levels, explaining a good proportion of its 56
variability. 57
Page 5
MANUSCRIP
T
ACCEPTED
ACCEPTED MANUSCRIPT4
Key words: folate; folate status; diet; dietary patterns, cardiovascular disease, 58
neurovascular disease 59
Page 6
MANUSCRIP
T
ACCEPTED
ACCEPTED MANUSCRIPT5
INTRODUCTION 60
Folate is a water-soluble B-vitamin and one of the micronutrients included in 61
the Mediterranean diet [1]. Reduced folate levels have been associated with 62
cardiovascular disease [2-4], possibly through increase in homocysteine; however, 63
trials aiming at reducing homocysteine with folate supplementation have shown 64
overall negative results [5], excepted for a reduction in stroke prevention [6, 7]. 65
More consistent are the data on the association between low folate levels in 66
pregnant women and neural tube defects (NTD) or other adverse birth outcomes [8]. 67
The increase in serum folate with the diet or by supplementation drastically reduces 68
the birth prevalence of NTDs. In the US, Canada, Chile and Costa Rica, which all 69
made mandatory the fortification of flour between 1998 and 2000, the drop in NTD 70
rates among live new-born babies was between 23 and 78% [9]. However, the 71
fortification is still non-mandatory in several European Countries mainly due to a 72
concern that folate fortification may harm people with undiagnosed vitamin 73
B12 deficiency [10]. 74
In Particular in Italy food folate fortification is not mandatory and folate 75
supplementation of women at childbearing age or health promotion strategies targeted 76
at increasing intake of dietary sources, are not a major public health issues. 77
On the contrary, in England public health promotion strategies force 78
consumers to prefer fortified foods as a health protection choice. In 2007 UK Food 79
Standards Agency considering the report of Scientific Advisory Committee on 80
Nutrition (SACN) [11] recommended the mandatory fortification of bread or flour 81
with folate in order to reduce the risk of neural tube defects in foetuses. However, no 82
such decision has already been taken by the Health Ministers. 83
Page 7
MANUSCRIP
T
ACCEPTED
ACCEPTED MANUSCRIPT6
There is a wide list of foods containing folate, however the relation between 84
folate food intake and folate serum levels is not so strong and there is limited evidence 85
on which food source could really help the population introducing the appropriate 86
folate daily amount to achieve the desired serum levels [12]. Moreover, it is of interest 87
to better understand factors, beside diet, that might affect folate levels. 88
This study aims firstly at describing the present status of dietary folate intake 89
and serum levels in a population of men and women from Italy and UK, a Southern 90
and a Northern European Country, respectively, with no mandatory food fortification 91
strategy for folate. Secondly, it aims at identifying food patterns that better describe a 92
high folate intake in these two Countries and at evaluating if and how such patterns 93
are associated with folate serum levels. 94
95
MATERIALS AND METHODS 96
Study population 97
The IMMIDIET Project [13, 14] and subject recruitment procedures have been 98
previously described. The IMMIDIET study is a population-based cross-sectional 99
study; apparently healthy pairs were man-woman spouses or partners living together, 100
recruited through local general practices. To protect against selection bias, the 101
selection of eligible pairs was randomized in each centre. Between October 2001 and 102
October 2003, 271 pairs in the Abruzzo region in Italy and 263 in S-W London in 103
United Kingdom (UK) aged 26-64 years (mean ±SD: men 48±7, women 45±7) were 104
randomly enrolled [13, 14]. The participation rates were 85% in Italy and 90% in UK. 105
The ethical committees of all participating institutions using the ethical standards laid 106
down in the 1964 Declaration of Helsinki and its later amendments approved the 107
Page 8
MANUSCRIP
T
ACCEPTED
ACCEPTED MANUSCRIPT7
study. All study participants agreed to participate by written informed consent prior to 108
their inclusion into the study. 109
110
Measurements 111
Interviews were taken using a standardised questionnaire previously adopted 112
[15]. 113
Subjects were classified as non-smokers (if they had never smoked cigarettes), 114
ex-smokers (if they had smoked cigarettes in the past), and current smokers if they 115
were currently smoking on a regular daily basis one or more cigarettes per day. 116
Physical activity rate was assessed by a standardised questionnaire [15]. Subjects 117
were grouped in 2 categories of physical activity (“low” or “high”) according to the 118
median rate of each population. Socio-economic status was defined as a score (0-5) 119
based on 3 variables: education, job and housing. The higher the score, the higher was 120
the level of socio-economic status. Participants were grouped in 2 categories of socio-121
economic status (“low” or “high”) according to the median of each population. 122
Women were divided into groups of pre-menopause and menopause according to their 123
reporting. 124
Body weight and height were measured on a standard beam balance scale with 125
an attached ruler, in subjects wearing no shoes and only light indoor clothing. Body 126
mass index (BMI) was calculated as weight in kilograms divided by the square of the 127
height in meters (kg/m2). Blood samples were obtained between 7.00 and 10.00 a.m. 128
from subjects who had been fasting overnight and had refrained from smoking for at 129
least 6 hours. 130
Page 9
MANUSCRIP
T
ACCEPTED
ACCEPTED MANUSCRIPT8
Folate serum levels were determined by a chemoluminescent assay at 131
microparticles capture (CMIA), Axsym (ABBOTT) (adequate levels, folate>6.62 132
ng/ml) [16]. The assay sensitivity was lower than 0.8 ng/ml, interassay CV <10%. 133
134
Dietary assessment 135
Either the validated Italian or the English European Prospective Investigation 136
into Cancer and Nutrition (EPIC) food frequency questionnaire (FFQ) [17] were used 137
to evaluate dietary intake. A computer program, Nutrition Analysis of FFQ (NAF) 138
[18] was developed by the Epidemiology and Prevention Unit, Fondazione IRCCS, 139
Istituto Nazionale dei Tumori, Milan to convert questionnaire dietary data into 140
frequencies of consumption and average daily quantities of foods, energy, folate and 141
vitamin B6 intake. NAF was linked to either to the Mc Cance Food composition 142
Tables (FCT) for UK data [19], or to the Italian FCT, for Italian data [20]. According 143
to Recommended Dietary Allowance for adults [21], dietary folate intake of 144
400µg/day and 200µg/day were considered as optimal and lowest recommended 145
intake, correspondingly. From the 164 food items included in the EPIC-FFQ, food 146
sources of folate were categorized in 15 major food groups as follows: “leafy 147
vegetables”, “broccoli & root vegetables”, “tomato & other vegetables”, “legumes”, 148
“citrus fruits”, “other fruits”, “fruit & vegetable juices”, “dried fruits”, “pasta rice & 149
cereals”, “potatoes & bread”, “breakfast cereals”, “nuts & seeds”, “red meat & 150
products”, “white meat & egg”, “fish” and “dairy”. The use of vitamin supplements 151
was evaluated in the UK population as a binary factor (yes or no). Data on their exact 152
prescription was missing. 153
154
Statistical analysis 155
Page 10
MANUSCRIP
T
ACCEPTED
ACCEPTED MANUSCRIPT9
Normally distributed continuous variables are presented as mean±SD, skewed 156
as median (1st, 3rd quartiles) and categorical variables as frequencies. Comparisons of 157
continuous variables between two groups of study were performed using the 158
independent Student's t-test, for the normally distributed variables and the Mann-159
Whitney test, for the skewed ones. Associations between categorical variables were 160
tested using the Pearson’s chi-square test. 161
Reduced rank regression (RRR) was used to derive dietary patterns (for Italy 162
and UK) including major food sources of folate better describing a high dietary folate 163
intake. RRR extracts linear functions of predictors (named factors) that explain as 164
much response variation as possible [22]. RRR produces as many factors as there are 165
dependent variables, which in our case is only one. The correlations between each 166
extracted factor and foods are called factor loadings; we characterized the factor using 167
the foods with an absolute factor loading greater than 0.20. Each subject received, for 168
each pattern, a factor score (RRR-score), calculated by summing the observed intake 169
of the 15 food groups, each weighed by factor loadings [22]. An increase in this score 170
represents increasing adherence to the factor-dietary pattern that better describes the 171
high dietary folate intake. 172
Linear regression analysis was used separately for Italian and UK participants, 173
to evaluate the association between dietary folate intake and food group consumption. 174
Unadjusted models with main outcome dietary folate intake and independent factors 175
each food group consumption was derived. Furthermore, in order to evaluate the 176
percentage of the total variance of dietary folate intake that was explained by the food 177
group consumption, multiple regression models including all food items were 178
performed. Partial R2% conducted from these analyses indicated the aforementioned 179
percentage. Using the same setting standardized β-coefficients was also produced to 180
Page 11
MANUSCRIP
T
ACCEPTED
ACCEPTED MANUSCRIPT10
comparatively evaluate the effects of independed factors to the main outcome. They 181
were reported as percent absolute values. The same regression analyses were 182
performed to evaluate the association between dietary folate intake and other 183
participant characteristics. Unadjusted and multi-adjusted linear regression analyses 184
separated by either Country were also performed to evaluate the possible associations 185
of folate serum levels with food group consumption, dietary folate intake and other 186
characteristics. Because of the log-transformation of the dependent factor in each of 187
all the aforementioned cases, the 1 unit increase in the independent factor caused the 188
β-coefficient (β-coef) to be equal with the log ratio of the dependent situations after 189
and before the 1 unit increase. So the eβ-coef should be equal to the ratio of the 190
dependent situations after and before the 1 unit increase in the independent factor; 191
results were presented as eβ-coef, describing how many times 1 unit increase in the 192
independent factor increased or decreased the dependent. 193
In all regression models normality of residuals, homoscedasticity, and multiple 194
co-linearity were evaluated by plotting standardized residuals against the predicted 195
values. All tested hypotheses were two-sided. P-value <0.05 was considered as 196
statistically significant. STATA version 9 software was used for all calculations 197
(STATA Corp., Texas, USA) except from RRR where SAS software (version 9.1.3 198
for Windows, Cary, NC: SAS Institute Inc. 2000-2004) was used. 199
200
RESULTS 201
Dietary intake of folate in Italy and UK 202
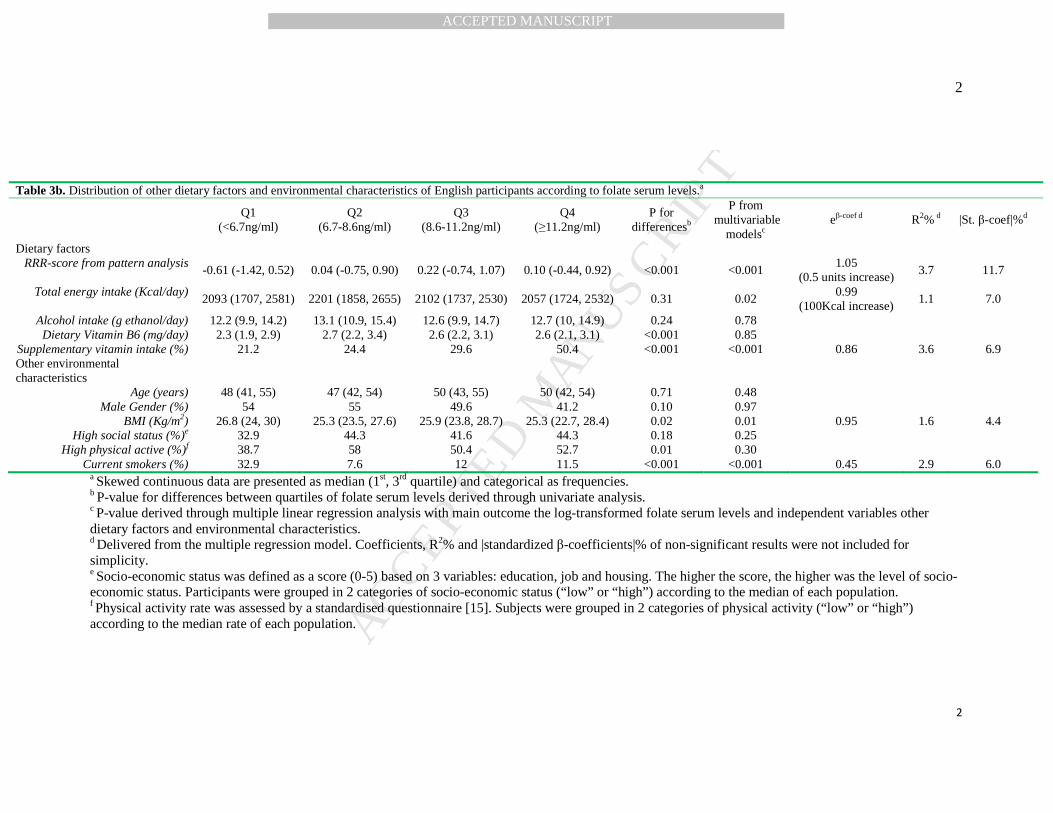
Figure 1a presents the distribution of dietary folate intake in men and women 203
according to either country. Mean folate intake was higher in Italian men than women 204
(β-coef=29.4, p<0.001), while no gender difference was observed in UK (β-coef=-7.6, 205
Page 12
MANUSCRIP
T
ACCEPTED
ACCEPTED MANUSCRIPT11
p=0.49). In both genders, English people had greater dietary folate intake than Italians 206
(P for country differences<0.001). The percentage of participants that reached the 207
lowest recommended intake of 200µg/day was 83% of Italian and 96% of English 208
subjects (P<0.001). However, only 11.3% (15.1% of men and 7.4% of women, 209
P<0.001) of Italians exceeded the optimal recommended intake of 400µg/day 210
(Recommended Dietary Allowance for adults) against 45.1% of UK participants 211
(44.9% of men and 45.3% of women, P=0.93) (P<0.001). Further analysis showed 212
that in Italy, menopausal women had greater dietary folate intake (362 (273, 455) 213
µg/d) than pre-menopause women (298 (244, 378) µg/d), (P<0.001) while no 214
significant difference was observed in the UK (P=0.18). The percentage of pre-215
menopausal women who reached the recommended levels of dietary folate intake 216
(RDA=400µg/d) was only 8.1% in Italy but 41.4% in UK (P<0.001). 217
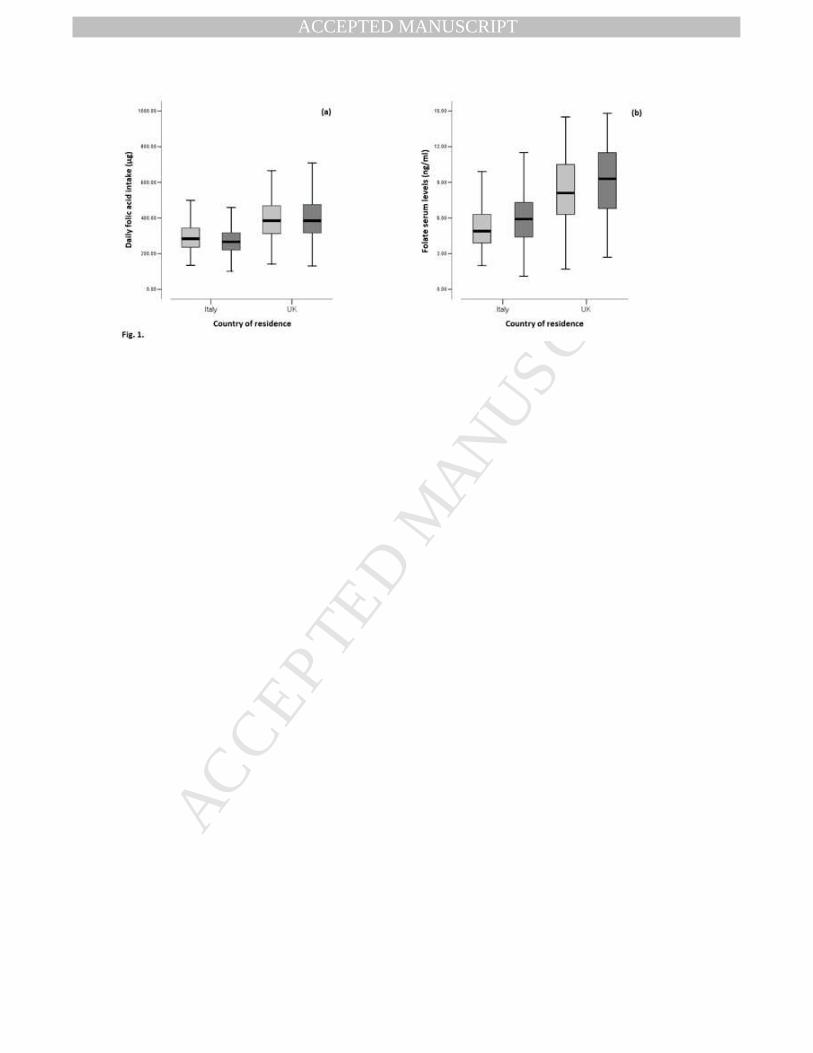
Figure 2 presents the partials R2% calculated from multivariate analysis in 218
Italian and UK participants. Total variance of dietary folate intake that was explained 219
by food groups was 88.3% in Italy and 89.5% in UK. In Italians, potatoes and bread 220
explained 61.5% of the folate intake variance, followed by leafy vegetables, fruit and 221
vegetables, juices, pasta and rice and citrus fruit. In UK, at variance, broccoli and root 222
vegetables explained more of the dietary intake folate variance (Partial R2%=59.1) 223
followed by breakfast cereals, potatoes and bread, dairy and leafy vegetables. 224
In Italy a factor-dietary pattern was derived which could explain 85.9% of the 225
total variation of dietary folate intake and 15.7% of the total variation between food 226
groups (Table 1). The “Italian dietary folate intake pattern” was described by high 227
consumption of every different type of vegetables, legumes, potatoes and bread, non-228
citrus fruits and white meat. The results of RRR in UK also revealed a factor-dietary 229
pattern explaining 82% of the total variation of dietary folate intake and the 14% of 230
Page 13
MANUSCRIP
T
ACCEPTED
ACCEPTED MANUSCRIPT12
the total variation between food groups. The “UK dietary folate intake pattern” was 231
described by high consumption of vegetables, non-citrus fruits, potatoes and bread, 232
breakfast cereals and dairy. 233
234
Folate serum levels in Italy and UK 235
Figure 1b presents the distribution of folate levels in men and women 236
according to either country. In both genders, UK participants showed higher folate 237
levels than Italians (P for country differences<0.001). This was also indicated by the 238
percentage of participants who had a favourable folate status (serum levels 239
>6.62ng/ml or 15 nmol/L) Italy 29.0% and UK 75.5% (P<0.001). Menopausal women 240
had higher folate levels (8.8 (6.3, 11.1) ng/ml) than pre-menopause (6.7 (4.9, 9.2) 241
ng/ml). In addition, only 33.3% of Italian women at childbearing age had favourable 242
folate status, while in UK they were 77.9% (P<0.001). 243
Multivariate analyses showed that Italian participants who were classified in 244
the higher quartile of folate levels had greater daily consumption of citrus fruits, leafy 245
vegetables, and fish as compared with those in the lowest quartile (Table 2a). On the 246
contrary, red meat, legumes and dairy were less consumed. The total percentage of 247
variance of folate levels explained by food group consumption was 14.2% (R2% from 248
multivariable model). The “Italian high folate dietary pattern” was also positively 249
associated with serum folate levels in the multivariable model (P<0.001). 250
Italians who were classified in the highest quartiles of folate levels were older, 251
more frequently women, with higher rate of high physical activity and lower rate of 252
current smoking habits as well as lower energy intake (P for all<0.05) (Table 2b). 253
According to both R2% and |standardized β-coef|%, the “Italian high folate dietary 254
pattern” was the most important factor explaining folate levels variability. Moreover, 255
Page 14
MANUSCRIP
T
ACCEPTED
ACCEPTED MANUSCRIPT13
energy intake accounted for a relatively high percentage of explained variability 256
(R2%=3.7). On the contrary, physical activity was the less important factor. 257
UK participants with the highest folate levels had greater daily consumption of 258
citrus fruit, breakfast cereals and fish and lower intake of red meat (P for all<0.05) 259
(Table 3a). The total percentage of variance of folate levels explained by food group 260
consumption was 16.3% (R2% from multivariable model). 261
UK participants with the highest folate levels showed higher adherence to the 262
“English high folate dietary pattern” and a more frequent use of vitamin supplements 263
(P for all<0.05) (Table 3b). Moreover, they were less frequently smokers and had both 264
lower energy intake and BMI. According to both R2% and |standardized β-coef|% the 265
“English high folate dietary pattern” was the most important factor in explaining 266
folate level variability. In addition, the use of vitamin supplements (R2%=3.6) and 267
tobacco (R2%=2.9) accounted for a relative high percentage of explained variability. 268
In contrast, energy intake was the less important (R2%=1.1). 269
In both populations dietary folate intake was positively associated with folate 270
levels after adjustments for confounders (P for all<0.05). An increase of 100µg/day in 271
dietary folate intake was associated with 13.8% and 10.5% increase in folate levels in 272
the Italian and UK population, respectively (for 100µg/day increase eβ-coef=1.138 and 273
1.105, P<0.001). 274
275
DISCUSSION 276
Dietary folate intake in Italy and UK 277
In this study, an inadequate dietary folate intake was observed in Southern-278
Italian subjects, while in S-W London people the folate status appeared to be better. 279
Page 15
MANUSCRIP
T
ACCEPTED
ACCEPTED MANUSCRIPT14
Only 11.3% of Italians but 45.1% of English people exceed the recommended intake 280
of 400µg/day, as an indication of a better but non-optimal dietary profile. 281
The average European intake (UK excluded) according to recent evidence 282
from EPIC-study was 307µg/d in men and 252µg/d in women [23] while in a review 283
of de Bree et al. the dietary folate intake did not exceed 320µg/d [24]. EPIC data have 284
also indicated that an English health- conscious group (mainly vegetarians or vegans) 285
had markedly greater intake than other EU populations [23]. 286
The percentage of women at childbearing age who did not reach the 287
appropriate intake of folate was quite high in both Countries. Indeed, 91.9% and 288
58.6% of Italian and UK women at childbearing age did not succeed to reach the 289
intake of 400µg/d, which is quite safe at this reproductive age. In US after the 290
fortification strategy of grain and cereal products, spina bifida and anencephaly rates 291
were reduced by about 20% [25]. 292
To understand possible factors responsible for the low intake of folate in the 293
two populations we examined food sources of folate. 294
Potatoes and bread explained 61.5% of the total variance of dietary folate 295
intake in Italians followed by leafy vegetables; while the corresponding food groups 296
in UK were broccoli and root vegetables (59.1% of total variance) followed by 297
breakfast cereals. Parallel pattern analysis resulted in similar conclusions. The “Italian 298
dietary folate intake pattern”, which was characterized by high intake of vegetables, 299
potatoes, bread, fruits, legumes and white meat described more precisely the high 300
dietary folate intake. The corresponding “UK pattern” differed only in legumes and 301
white meat consumption, which was replaced, by breakfast cereals and dairy. 302
Page 16
MANUSCRIP
T
ACCEPTED
ACCEPTED MANUSCRIPT15
These findings are in agreement with previous European data that indicated 303
vegetables, cereals and cereal products as the most important folate sources, both in 304
Italy and UK [23]. 305
In addition, both dietary patterns extracted by the present “a posteriori’ dietary 306
analysis included high consumption of food groups common with those included in 307
the traditional Mediterranean diet, a pattern recently associated to a better folate 308
nutritional adequacy [26]. 309
310
Folate serum status in Italy and UK 311
As far as folate intake is concerned, folate serum levels were generally 312
inadequate in the Italian population, while UK subjects showed a better profile. 313
Again, women at childbearing age had lower folate serum levels than at menopause, 314
probably because of a lower dietary intake. 315
A recent study by Dhonukshe-Rutten et al. [16] indicated that using the same 316
cut off (6.62ng/ml or 15 nmol/L), only in Germany, Sweden, UK and Spain folate 317
serum levels seemed to be adequate. The three Italian studies included in that 318
European survey reported an alarming situation. Similarly, a more recent analysis [27] 319
indicated that only 22.5% of a Southern Italy population had adequate serum folate 320
levels. On the contrary, results from US after the mandatory fortification strategy 321
revealed a more adequate folate serum profile [28]. 322
Possible reasons for such difference include dietary intake of folate and the 323
fortification strategies that had been followed by national health policies. Dietary 324
intake profile of UK subjects was more adequate than that of the Italians. In UK, 325
public health promotion efforts have been made the last 2 decades recommending 326
consumers to prefer fortified foods as a health protection choice. More recently 327
Page 17
MANUSCRIP
T
ACCEPTED
ACCEPTED MANUSCRIPT16
(2007), the UK Food Standards Agency has approved the suggestion for food 328
industries to fortify bread or flour with folate, however, there is still no decision for a 329
mandatory fortification. [11]. 330
Food group consumption in Italy and UK explained respectively 14.2% and 331
16.3% of serum folate variability. Similarly, the adherence to a high folate dietary 332
pattern was positively associated with folate serum levels in both countries. 333
Conversely, red meat, legumes and dairy, although containing folate, were inversely 334
associated with folate serum levels. Tanking into account that the use of FFQ may not 335
always allow to identify strong associations of dietary and serum folate, the intake of 336
food rich in folate seems to result somehow in higher folate serum levels. Available 337
data both from cross-sectional [29, 30] and diet-intervention studies [31, 32] suggest a 338
positive association between folate status and dietary patterns characterized by high 339
consumption of fruits, vegetables, and low consumption of red meat and dairy. 340
Probably the increase in the latter consumption might be an indicator of an unhealthy 341
dietary pattern with limited servings of fruits, vegetables and cereals. In addition 342
bioavailability of folate in different food groups, that has not been yet fully 343
understood [33], might explain the reported proportion of explained variability of 344
serum folate levels by food intake. 345
UK participants with the highest folate levels showed a more frequent use of 346
vitamin supplements. This could be in part an explanation for the better profile. 347
However, data about exact prescription of vitamins was missing. 348
In both EU populations energy intake was positively associated with serum 349
folate levels. Indeed, in the Italian population energy consumption explained 3.7% of 350
the total folate levels variability. Indeed, lower energy intake has been associated with 351
better quality of diet through lower energy-dense and healthier foods choices [34]. 352
Page 18
MANUSCRIP
T
ACCEPTED
ACCEPTED MANUSCRIPT17
This might lead to a better and well-absorbed folate intake. In addition, low energy 353
reporting is usually associated to a healthier lifestyle [35] (e.g. lower smoking habits, 354
greater physical activity), which, according to the present results, was also associated 355
with higher folate levels. 356
Among non-dietary environmental factors, non-smoking was associated with 357
better folate profile. In the study by Vardavas et al., in a healthy Greek population, 358
non-smokers had 13% greater folate serum levels than smokers [36]. Similar findings 359
were observed in a population of pregnant women where non-smokers had 22% 360
higher levels of folate serum levels than smokers [37]. EPIC study bearded out the 361
same conclusion [23]. The underlined biological mechanism of this association could 362
be explained by the chemical components found in tobacco smoke which interact with 363
folate in blood by transforming them into inactive compounds, reducing their active 364
concentration in biological fluids and possibly altering the ability of the cell to store 365
and metabolize them [38]. 366
Physical activity was positively associated with folate serum levels in Italians, 367
as already observed in Southern Italy, where more active individuals had significant 368
greater folate serum levels as compared to inactive [27]. According to our knowledge 369
there is no biological mechanism explaining the positive association of physical 370
activity rate with serum folate levels. However, physical active populations seemed to 371
use tobacco less frequent [39] while they had greater adherence to healthy dietary 372
patterns including high quantities of fruits, vegetables and cereals [40]; factors that, in 373
our study, were associated with higher folate levels. 374
375
Limitations of this study 376
Page 19
MANUSCRIP
T
ACCEPTED
ACCEPTED MANUSCRIPT18
Although the data reported here appear of high public health interest, this 377
study has some limitations. First, the cross-sectional design of the IMMIDIET study 378
does not enable determination of causality. Secondly, possible errors because of 379
misreporting by participating subjects should be acknowledged. The use of FFQ as a 380
dietary assessment method may not always allow identifying strong associations of 381
intake and folate levels. In addition, the use of different food composition tables might 382
insert possible error in the evaluation of folate intake in the 2 EU populations. 383
Generalization of the present conclusions to the total Italian or UK population should 384
be avoided, since the recruitment of study participants, although randomly made from 385
the general population, was limited to Abruzzo region and S-W London. 386
387
Conclusions 388
In this study, both inadequate dietary folate intake and serum levels were 389
observed in Italian subjects, while in S-W London people the folate status appeared to 390
be somewhat better. Differences between country in food group consumption as good 391
sources of folate could in part explain this phenomenon. Non-smoking habit and 392
physical activity were the two non-dietary, lifestyle characteristics positively 393
associated with folate serum levels. 394
Folate is a potentially relevant factor in the prevention of a number of diseases. 395
The evidence linking folate to NTD prevention must lead to the introduction of public 396
health strategies to increase folate intake, in particular in Countries with evidence of 397
low intake and low serum levels of folate. Different approaches should be used, such 398
as pharmacological supplementation and/or mandatory or voluntary fortification of 399
staple foods with folate, although they should never replace dietary improvement 400
strategies. 401
Page 20
MANUSCRIP
T
ACCEPTED
ACCEPTED MANUSCRIPT19
402
ACKNOWLEDGEMENTS 403
The study was supported by European Union grant no QLK1-2000-00100. 404
Page 21
MANUSCRIP
T
ACCEPTED
ACCEPTED MANUSCRIPT20
REFERENCES 405
[1] Trichopoulou A, Costacou T, Bamia C, Trichopoulos D. Adherence to a 406
Mediterranean diet and survival in a Greek population. N Engl J Med. 407
2003;348:2599-608. 408
[2] McNulty H, Pentieva K, Hoey L, Ward M. Homocysteine, B vitamins and CVD. 409
Proc Nutr Soc. 2008; doi:10.1017/S0029665108007076. 410
[3] Refsum H, Ueland PM, Nygard O, Vollset SE. Homocysteine and cardiovascular 411
disease. Annu Rev Med. 1998; 49: 31-62. 412
[4] Ciccarone E, Di Castelnuovo A, Assanelli D, Archetti S, Ruggeri G, Salcuni N, et 413
al. Homocysteine levels are associated with the severity of peripheral arterial 414
disease in Type 2 diabetic patients. J Thromb Haemost. 2003; 1: 2540-7. 415
[5] Clarke R, Halsey J, Lewington S, Lonn E, Armitage J, Manson JE, et al. Effects of 416
lowering homocysteine levels with B vitamins on cardiovascular disease, cancer, 417
and cause-specific mortality. Arch Intern Med. 2010; 170: 1622-31. 418
[6] Wang X, Qin X, Demirtas H, Li J, Mao G, Huo Y, et al. Efficacy of folic acid 419
supplementation in stroke prevention: a meta-analysis. Lancet. 2007; 369: 1876-420
82. 421
[7] The Heart Outcomes Prevention Evaluation (HOPE) 2 Investigators. 422
Homocysteine lowering with folic acid and B vitamins in vascular disease. N Engl 423
J Med. 2006; 354: 1567-77. 424
[8] MRC Vitamin Study Research Group. Prevention of neural tube defects: results 425
of the Medical Research Council Vitamin Study. Lancet. 1991; 338: 131–37. 426
[9] Grosse SD, Waitzman NJ, Romano PS, Mulinare J. Reevaluating the benefits of 427
folic acid fortification in the United States: economic analysis, regulation, and 428
public health. Am J Public Health. 2005; 95: 1917-22. 429
Page 22
MANUSCRIP
T
ACCEPTED
ACCEPTED MANUSCRIPT21
[10] Smith AD, Kim YI, Refsum H. Is folic acid good for everyone? Am J Clin Nutr. 430
2008; 87: 517-33. 431
[11] Scientific Advisory Committee on Nutrition. Report: Folate and Disease 432
Prevention. 2006. Available at 433
http://www.sacn.gov.uk/pdfs/folate_and_disease_prevention_report.pdf (last 434
accessed 27 August 2013). 435
[12] Tucker KL, Selhub J, Wilson PW, Rosenberg IH. Dietary intake pattern relates 436
to plasma folate and homocysteine concentrations in the Framingham Heart 437
Study. J Nutr. 1996 Dec;126(12):3025-31. 438
[13] Iacoviello L, Arnout J, Buntinx F, Cappuccio FP, Dagnelie PC, de Lorgeril M, 439
et al. Dietary habit profile in European communities with different risk of 440
myocardial infarction: the impact of migration as a model of gene-environment 441
interaction. The IMMIDIET Study. Nutr Metab Cardiovasc Dis. 2001; 11: 122-442
6. 443
[14] Vohnout B, Arnout J, Krogh V, Donati MB, de Gaetano G, Iacoviello L; 444
European Collaborative Group of the IMMIDIET Project. Association between 445
MTHFR C677T genotype and circulating folate levels irrespective of folate 446
intake: data from the IMMIDIET Project. Nutrition. 2011; 27: 1209-10. doi: 447
10.1016/j.nut.2011.07.008. 448
[15] Cappuccio FP, Strazzullo P, Farinaro E Trevisan M. Uric acid metabolism and 449
tubular sodium handling: Results from a population-based study. J Am Med 450
Assoc. 1993; 270: 354–359. 451
[16] Dhonukshe-Rutten RA, de Vries JH, de Bree A, van der Put N, van Staveren 452
WA, de Groot LC. Dietary intake and status of folate and vitamin B12 and their 453
Page 23
MANUSCRIP
T
ACCEPTED
ACCEPTED MANUSCRIPT22
association with homocysteine and cardiovascular disease in European 454
populations. Eur J Clin Nutr. 2009; 63: 18-30. 455
[17] Slimani N, Kaaks R, Ferrari P, Casagrande C, Clavel-Chapelon F, Lotze G, et 456
al. European Prospective Investigation into Cancer and Nutrition (EPIC) 457
calibration study: rationale, design and population characteristics. Public Health 458
Nutr. 2002; 5: 1125-45. 459
[18] Pala V, Sieri S, Palli D, Salvini S, Berrino F, Bellegotti M, et al. Diet in the 460
Italian EPIC cohorts: presentation of data and methodological issues. Tumori. 461
2003; 89: 594–607. 462
[19] Mc Cance RA, Widdowson EM. The composition of foods. 5th ed. Cambridge, 463
United Kingdom: The Royal Society of Chemistry and Ministry of Agriculture, 464
Fisheries and Food; 1991. 465
[20] Salvini S, Parpinel M, Gnagnarella P, Maisonnneuve P, Turrini A. Banca Dati 466
di Composizione degli Alimenti per Studi Epidemiologici in Italia. Milan, Italy: 467
Istituto Europeo di Oncologia; 1998. 468
[21] Institute of Medicine. Food and Nutrition Board (1998). Dietary Reference 469
Intakes: Thiamin, Riboflavin, Niacin, Vitamin B6, Folate, Vitamin B12, 470
Pantothenic Acid, Biotin, and Choline. Washington, DC, National Academy 471
Press. 472
[22] K. Hoffman, M.B. Schulze, A. Schienkiewitz, U. Nöthlings, H. Boeing. 473
Application of a new statistical method to derive dietary patterns in nutrition 474
epidemiology. Am J Epidemiol. 2004; 159: 935–44. 475
[23] Park JY, Nicolas G, Freisling H, Biessy C, Scalbert A, Romieu I, et al. 476
Comparison of standardised dietary folate intake across ten countries 477
Page 24
MANUSCRIP
T
ACCEPTED
ACCEPTED MANUSCRIPT23
participating in the European Prospective Investigation into Cancer and 478
Nutrition. Br J Nutr. 2012; 108: 552-69. 479
[24] de Bree A, van Dusseldorp M, Brouwer IA, van het Hof KH, Steegers-480
Theunissen RP. Folate intake in Europe: recommended, actual and desired 481
intake. Eur J Clin Nutr. 1997; 51: 643-60. 482
[25] Choumenkovitch SF, Selhub J, Wilson PW, Rader JI, Rosenberg IH, Jacques 483
PF. dietary folate intake from fortification in United States exceeds predictions. 484
J Nutr. 2002; 132: 2792-8. 485
[26] Serra-Majem L, Bes-Rastrollo M, Román-Viñas B, Pfrimer K, Sánchez-Villegas 486
A, Martínez-González MA. Dietary patterns and nutritional adequacy in a 487
Mediterranean country. Br J Nutr. 2009; 101: S21-8. doi: 488
10.1017/S0007114509990559. 489
[27] Zappacosta B, Persichilli S, Iacoviello L, Di Castelnuovo A, Graziano M, 490
Gervasoni J, et al. Folate, vitamin B12 and homocysteine status in an Italian 491
blood donor population. Nutr Metab Cardiovasc Dis. 2011 Dec 30. [Epub ahead 492
of print]. 493
[28] Pfeiffer CM, Johnson CL, Jain RB, Yetley EA, Picciano MF, Rader JI, et al. 494
Trends in blood folate and vitamin B-12 concentrations in the United States, 495
1988–2004. Am J Clin Nutr. 2007; 86: 718–27. 496
[29] Tucker KL, Selhub J, Wilson PW, Rosenberg IH. Dietary intake pattern related 497
to plasma folate and homocysteine concentrations in the Framingham Heart 498
Study. J Nutr. 1996; 126: 3025-31. 499
[30] Kerver JM, Yang EJ, Bianchi L, Song WO. Dietary patterns associated with risk 500
factors for cardiovascular disease in healthy US adults. Am J Clin Nutr. 2003; 501
78: 1103-10. 502
Page 25
MANUSCRIP
T
ACCEPTED
ACCEPTED MANUSCRIPT24
[31] Brouwer IA, van Dusseldorp W, West CE, Meyboom S, Thomas CMG, Duran 503
M, van het Hof KH, et al. Dietary folate from vegetables and citrus fruit 504
decreased plasma homocysteine concentrations in humans in a dietary 505
controlled trial. J Nutr. 1999; 129: 1135-9. 506
[32] Kiefer I, Prock P, Lawrence C, Wise J, Bieger W, Bayer P, et al. 507
Supplementation with mixed fruit and vegetable juice concentrates increased 508
serum antioxidants and folate in healthy adults. J Am Coll Nutr. 2004; 23: 205-509
11. 510
[33] Ohrvik VE, Witthoft CM. Human folate bioavailability. Nutrients. 2011; 3: 475-511
90. 512
[34] de Oliveira MC, Sichieri R, Venturim Mozzer R. A low-energy-dense diet 513
adding fruit reduces weight and energy intake in women. Appetite. 2008; 51: 514
291-5. doi: 10.1016/j.appet.2008.03.001. 515
[35] Johansson L, Solvoll K, Bjørneboe GE, Drevon CA. Under- and overreporting 516
of energy intake related to weight status and lifestyle in a nationwide sample. 517
Am J Clin Nutr. 1998; 68: 266-74. 518
[36] Vardavas CI, Linardakis MK, Hatzis CM, Malliaraki N, Saris WH, Kafatos AG. 519
Smoking status in relation to serum folate and dietary vitamin intake. Tob Induc 520
Dis. 2008; doi:10.1186/1617-9625-4-8. 521
[37] McDonald SD, Perkins SL, Jodouin CA, Walker MC. Folate levels in pregnant 522
women who smoke: an important gene/environment interaction. Am J Obstet 523
Gynecol. 2002; 187: 620-5. 524
[38] Northrop-Clewes CA, Thurnham DI. Monitoring micronutrients in cigarette 525
smokers. Clinica Chima Acta. 2000; 377: 14-38. 526
Page 26
MANUSCRIP
T
ACCEPTED
ACCEPTED MANUSCRIPT25
[39] Kaczynski AT, Manske SR, Mannell RC, Grewal K. Smoking and physical 527
activity: a systematic review. Am J Health Behav. 2008; 32: 93-110. 528
[40] Kavouras SA, Panagiotakos DB, Pitsavos C, Chrysohoou C, Arnaoutis G, 529
Skoumas Y, et al. Physical Activity and Adherence to Mediterranean Diet 530
Increase Total Antioxidant Capacity: The ATTICA Study. Cardiol Res Pract. 531
2010; 2011: 248626. doi: 10.4061/2011/248626. 532
Page 27
MANUSCRIP
T
ACCEPTED
ACCEPTED MANUSCRIPT26
[41] LEGEND TO THE FIGURES 533
Figure 1 Distribution of dietary folate intake and folate serum levels in men and 534
women participants according to country of residence: (a) Italy, (b) UK. 535
Daily folate intake (µg) by country and gender: median (1st, 3rd quartile) 536
Italy, men: 284 (235, 344); Italy, women: 266 (220, 317); 537
UK, men: 385 (312, 469); UK women: 384 (316, 476) 538
Folate serum levels (ng/ml) by country and gender: median (1st, 3rd quartile) 539
Italy, men: 4.9 (3.9, 6.3); Italy, women: 5.9 (4.4, 7.3) 540
UK, men: 8.1 (6.3, 10.5); UK women: 9.3 (6.8, 11.5) 541
Figure 2 Contribution of food group consumption to dietary folate intake in Italy 542
& UK . 543
Page 28
MANUSCRIP
T
ACCEPTED
ACCEPTED MANUSCRIPT27
Appendices: European Collaborative Group of the IMMIDIET Project 544
Project Co-ordinator: Licia Iacovielloa 545
Scientific Committee: Jef Arnout,c Frank Buntinx,d Francesco P. Cappuccio,e Pieter 546
C. Dagnelie,f Maria Benedetta Donati,a Michel de Lorgeril,g Vittorio Krogh,h Alfonso 547
Sianii 548
Co-ordinating secretariat: Carla Dirckxc,d 549
Data management and statistics: Augusto Di Castelnuovoa 550
Dietary assessment and analysis: Martien van Dongenf 551
Communication and dissemination: Americo Bonannia 552
Recruitment: Carla Dirckx,c,d Pit Rink,e Branislav Vohnout,b Francesco Zitob 553
External advisory committee: Mario Mancini, Napoli, Italy; Antonia Trichopoulou, 554
Athens, Greece 555
The IMMIDIET group, collaborative centres and associated investigators (2012) 556
a. IRCCS Istituto Neurologico Mediterraneo Neuromed, Pozzilli, Isernia, 557
Italy (Licia Iacoviello, Mari Benedetta Donati, Giovanni de Gaetano 558
Amalia De Curtis, Augusto Di Castelnuovo, Americo Bonanni) 559
b. Fondazione di Ricerca e Cura “Giovanni Paolo II”, Catholic University, 560
Campobasso, Italy (Francesco Zito, Branislav Vohnout, Marco Olivieri, 561
Agnieszka Pampuch) 562
c. Centre for Molecular and Vascular Biology, Katholieke Universiteit 563
Leuven, Leuven, Belgium (Jef Arnout, Carla Dirckx, Ward Achten) 564
Page 29
MANUSCRIP
T
ACCEPTED
ACCEPTED MANUSCRIPT28
d. Department of General Practice, Katholieke Universiteit Leuven, Leuven, 565
Belgium (Frank Buntinx, Carla Dirckx, Jan Heyrman) 566
e. Clinical Sciences Research Institute, Warwick Medical School, Coventry, 567
United Kingdom (Francesco P. Cappuccio, Michelle A Miller); Division of 568
Community Health Sciences, St George’s, University of London, United 569
Kingdom (Pit Rink, Sally C Dean, Clare Harper) 570
f. Department of Epidemiology, NUTRIM Subdivision of Nutritional 571
Epidemiology, Maastricht University, Maastricht, The Netherlands (Peter 572
Dagnelie, Martien van Dongen, Dirk Lemaître) 573
g. Nutrition, Vieillissement et Maladies Cardiovasculaires (NVMCV), UFR 574
de Médecine, Domaine de la Merci, 38056 La Tronche, France (Michel de 575
Lorgeril) 576
h. Nutritional Epidemiology Unit, National Cancer Institute, Milan, Italy 577
(Vittorio Krogh, Sabrina Sieri, Manuela Bellegotti, Daniela Del Sette 578
Cerulli) 579
i. Unit of Epidemiogy & Population Genetics, Institute of Food Sciences 580
CNR, Avellino, Italy (Alfonso Siani, Gianvincenzo Barba, Paola Russo, 581
Antonella Venezia) 582
Page 30
MANUSCRIP
T
ACCEPTED
ACCEPTED MANUSCRIPT
Table 1. Results from reduced rank regression analyses that evaluated the dietary pattern, which is associated with folate dietary intake of Italian and English IMMIDIET population. Factor loadings a Italy (n=542) UK (n=526) Food groups (g/day)
Leafy vegetables 39.2 30.4 Broccoli & root vegetables 28.6 43.9 Tomato & other vegetables 30.2 37.1
Legumes 29.3 Citrus fruits Other fruits 32.7 23.4
Fruit & vegetable juices Dried fruits
Pasta rice & cereals Potatoes & bread 37.6 28.9 Breakfast cereals 34.6
Nuts & seeds Red meat & products
White meat & egg 28.0 Fish
Dairy 26.7 a Factor loadings lower than 20.0 was not presented for simplicity.
Page 31
MANUSCRIP
T
ACCEPTED
ACCEPTED MANUSCRIPT
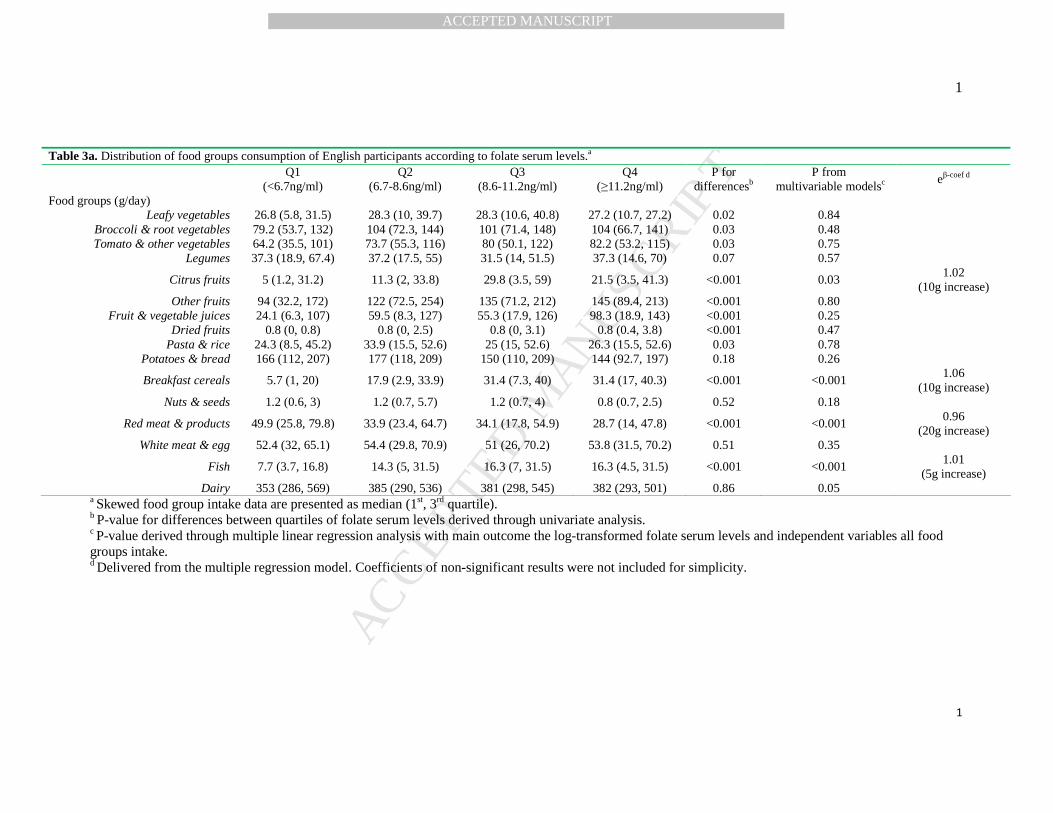
1
Table 2a. Distribution of food groups consumption of Italian participants according to folate serum levels. a
Q1 (<4.2ng/ml)
Q2 (4.2-5.3ng/ml)
Q3 (5.3-6.9ng/ml)
Q4 (≥6.9ng/ml)
P for differencesb
P from multivariable
modelc eβ-coef d
Food groups (g/day)
Leafy vegetables 25 (13.3, 41.3) 22.2 (12.3, 42.3) 28 (19.1, 44.6) 33 (50.8, 21.3) <0.001 0.04 1.01
(10g increase) Broccoli & root vegetables 12.7 (6.7, 22.5) 14.0 (7, 28.7) 15.6 (7.4, 28.5) 15.8 (8.3, 29.9) 0.14 0.26
Tomato & other vegetables 58.4 (40, 82) 71.1 (38.1, 108) 71.4 (49.6, 99.3) 66.4 (44.4, 103) 0.03 0.10
Legumes 20.7 (12.9, 31.3) 20.0 (11.2, 28.9) 20.1 (15.8, 31.8) 20.3 (13.5, 28.7) 0.53 0.01 0.99
(10g increase)
Citrus fruits 58.0 (34.1, 93.4) 67.9 (41.1, 116) 81.3 (54.5, 110) 83.9 (54.7, 139) <0.001 <0.001 1.02
(25g increase) Other fruits 194 (110, 272) 215 (140, 323) 216 (156, 316) 252 (175, 353) <0.001 0.35
Fruit & vegetable juices 34.5 (0, 104) 44.0 (0, 116) 35.7 (0, 83.3) 35.7 (4.2, 92.3) 0.63 0.70
Dried fruits 0.1 (0, 0.1) 0.1 (0, 0.1) 0.1 (0, 0.1) 0.1 (0, 0.1) 0.14 0.51
Pasta & rice 69.7 (42.4, 115) 68.6 (42.2, 98.1) 64.1 (40.8, 87.6) 61.6 (35.1, 94.2) 0.14 0.16
Potatoes & bread 146 (94.3, 247) 144 (92, 235.1) 134 (69.3, 189) 128 (70.2, 191) 0.03 0.06
Breakfast cereals - - - - -
Nuts & seeds 0.2 (0.2, 0.3) 0.2 (0.2, 1) 0.2 (0.2, 0.7) 0.2 (0.2, 1) 0.13 0.07
Red meat & products 104 (67.5, 133) 75.7 (54.8, 124) 79.2 (50, 132) 64.3 (43.9, 88) <0.001 <0.001 0.96
(25g increase) White meat & egg 56.5 (40.1, 75.2) 61.2 (38.9, 91.7) 62.2 (42.1, 87.5) 54.7 (38.9, 76) 0.24 0.63
Fish 26.7 (16.4, 36.6) 22.9 (13.7, 36.19) 27.6 (18.8, 42.1) 27.5 (14.4, 38.1) 0.26 0.04 1.18
(10g increase)
Dairy 185 (74.7, 279) 183 (73.9, 298) 172 (86.9, 295) 171 (59.1, 262) 0.44 0.02 0.98
(100g increase) a Skewed food group intake data are presented as median (1st, 3rd quartile). b P-value for differences between quartiles of folate serum levels derived through univariate analysis. c P-value derived through multiple linear regression analysis with main outcome the log-transformed folate serum levels and independent variables all food groups intake. d Delivered from the multiple regression model. Coefficients of non-significant results were not included for simplicity.
Page 32
MANUSCRIP
T
ACCEPTED
ACCEPTED MANUSCRIPT
2
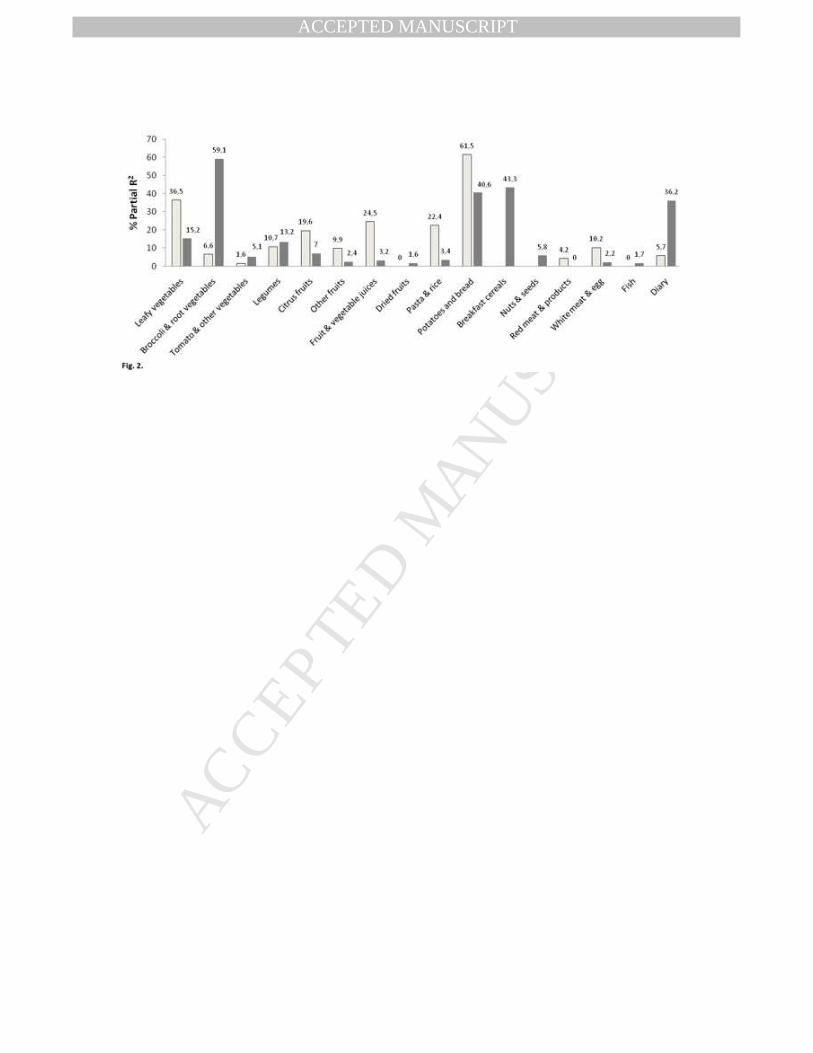
Table 2b. Distribution of other dietary factors and environmental characteristics of Italian participants according to folate serum levels. a
Q1 (<4.2ng/ml)
Q2 (4.2-5.3ng/ml)
Q3 (5.3-6.9ng/ml)
Q4 (≥6.9ng/ml)
P for differencesb
P from multivariable
modelc eβ-coef d R%2 d |St. β-coef|%d
Dietary factors
RRR-score from pattern analysis -0.33 (-1.00, 0.71) -0.19 (-0.83, 0.90) -0.19 (-0.88, 0.72) -0.16 (-0.85, 0.51) 0.81 <0.001 1.06
(0.5 units increase) 4.9 15.3
Total energy intake (Kcal/day) 2465 (2021,
2998) 2411 (2064,
3141) 2327 (1830,
2711) 2091 (1815, 2513) <0.001 <0.001
0.99 (100Kcal increase)
3.7 12.5
Alcohol intake (g/day) 11.2 (0.56, 26.2) 8.5 (0.34, 24.7) 2.3 (0.31, 16.3) 5.4 (0.34, 16.6) 0.07 0.05 Vitamin B6 intake (mg/day) 1.92 (1.61, 2.44) 2.02 (1.60, 2.40) 1.95 (1.65, 2.33) 1.79 (1.51, 2.18) 0.03 0.05
Other environmental characteristics
Age (years) 44 (38, 49) 43 (39, 48) 45 (39, 51) 45 (41, 51) 0.02 <0.001 1.03
(5 years increase) 1.6 4.7
Male Gender (%) 59.9 54.5 46.5 36.8 <0.001 0.01 0.90 1.5 5.2 BMI (Kg/m2) 26.9 (24.5, 29.5) 26.4 (23.8, 29.8) 26.9 (23.8, 30.8) 27.0 (24.2, 29.5) 0.68 0.98
High social status (%)e 14.8 17.9 14.7 10.5 0.40 0.10 High physical active (%)f 21.1 29.9 28.7 36.8 0.04 0.01 1.09 1.3 4.1
Current smokers (%) 47.9 34.3 25.6 16.5 <0.001 <0.001 0.84 4.8 7.9 a Skewed continuous data are presented as median (1st, 3rd quartile) and categorical as frequencies. b P-value for differences between quartiles of folate serum levels derived through univariate analysis. c P-value derived through multiple linear regression analysis with main outcome the log-transformed folate serum levels and independent variables other dietary factors and environmental characteristics. d Delivered from the multiple regression model. Coefficients, R2% and |standardized β-coefficients|% of non-significant results were not included for simplicity. e Socio-economic status was defined as a score (0-5) based on 3 variables: education, job and housing. The higher the score, the higher was the level of socio-economic status. Participants were grouped in 2 categories of socio-economic status (“low” or “high”) according to the median of each population. f Physical activity rate was assessed by a standardised questionnaire [15]. Subjects were grouped in 2 categories of physical activity (“low” or “high”) according to the median rate of each population.
Page 33
MANUSCRIP
T
ACCEPTED
ACCEPTED MANUSCRIPT
1
1
Table 3a. Distribution of food groups consumption of English participants according to folate serum levels.a Q1
(<6.7ng/ml) Q2
(6.7-8.6ng/ml) Q3
(8.6-11.2ng/ml) Q4
(≥11.2ng/ml) P for
differencesb P from
multivariable modelsc eβ-coef d
Food groups (g/day) Leafy vegetables 26.8 (5.8, 31.5) 28.3 (10, 39.7) 28.3 (10.6, 40.8) 27.2 (10.7, 27.2) 0.02 0.84
Broccoli & root vegetables 79.2 (53.7, 132) 104 (72.3, 144) 101 (71.4, 148) 104 (66.7, 141) 0.03 0.48 Tomato & other vegetables 64.2 (35.5, 101) 73.7 (55.3, 116) 80 (50.1, 122) 82.2 (53.2, 115) 0.03 0.75
Legumes 37.3 (18.9, 67.4) 37.2 (17.5, 55) 31.5 (14, 51.5) 37.3 (14.6, 70) 0.07 0.57
Citrus fruits 5 (1.2, 31.2) 11.3 (2, 33.8) 29.8 (3.5, 59) 21.5 (3.5, 41.3) <0.001 0.03 1.02
(10g increase) Other fruits 94 (32.2, 172) 122 (72.5, 254) 135 (71.2, 212) 145 (89.4, 213) <0.001 0.80
Fruit & vegetable juices 24.1 (6.3, 107) 59.5 (8.3, 127) 55.3 (17.9, 126) 98.3 (18.9, 143) <0.001 0.25 Dried fruits 0.8 (0, 0.8) 0.8 (0, 2.5) 0.8 (0, 3.1) 0.8 (0.4, 3.8) <0.001 0.47
Pasta & rice 24.3 (8.5, 45.2) 33.9 (15.5, 52.6) 25 (15, 52.6) 26.3 (15.5, 52.6) 0.03 0.78 Potatoes & bread 166 (112, 207) 177 (118, 209) 150 (110, 209) 144 (92.7, 197) 0.18 0.26
Breakfast cereals 5.7 (1, 20) 17.9 (2.9, 33.9) 31.4 (7.3, 40) 31.4 (17, 40.3) <0.001 <0.001 1.06
(10g increase) Nuts & seeds 1.2 (0.6, 3) 1.2 (0.7, 5.7) 1.2 (0.7, 4) 0.8 (0.7, 2.5) 0.52 0.18
Red meat & products 49.9 (25.8, 79.8) 33.9 (23.4, 64.7) 34.1 (17.8, 54.9) 28.7 (14, 47.8) <0.001 <0.001 0.96
(20g increase) White meat & egg 52.4 (32, 65.1) 54.4 (29.8, 70.9) 51 (26, 70.2) 53.8 (31.5, 70.2) 0.51 0.35
Fish 7.7 (3.7, 16.8) 14.3 (5, 31.5) 16.3 (7, 31.5) 16.3 (4.5, 31.5) <0.001 <0.001 1.01
(5g increase) Dairy 353 (286, 569) 385 (290, 536) 381 (298, 545) 382 (293, 501) 0.86 0.05
a Skewed food group intake data are presented as median (1st, 3rd quartile). b P-value for differences between quartiles of folate serum levels derived through univariate analysis. c P-value derived through multiple linear regression analysis with main outcome the log-transformed folate serum levels and independent variables all food groups intake. d Delivered from the multiple regression model. Coefficients of non-significant results were not included for simplicity.
Page 34
MANUSCRIP
T
ACCEPTED
ACCEPTED MANUSCRIPT
2
2
Table 3b. Distribution of other dietary factors and environmental characteristics of English participants according to folate serum levels.a
Q1 (<6.7ng/ml)
Q2 (6.7-8.6ng/ml)
Q3 (8.6-11.2ng/ml)
Q4 (≥11.2ng/ml)
P for differencesb
P from multivariable
modelsc eβ-coef d R2% d |St. β-coef|%d
Dietary factors RRR-score from pattern analysis
-0.61 (-1.42, 0.52) 0.04 (-0.75, 0.90) 0.22 (-0.74, 1.07) 0.10 (-0.44, 0.92) <0.001 <0.001 1.05
(0.5 units increase) 3.7 11.7
Total energy intake (Kcal/day) 2093 (1707, 2581) 2201 (1858, 2655) 2102 (1737, 2530) 2057 (1724, 2532) 0.31 0.02
0.99 (100Kcal increase)
1.1 7.0
Alcohol intake (g ethanol/day) 12.2 (9.9, 14.2) 13.1 (10.9, 15.4) 12.6 (9.9, 14.7) 12.7 (10, 14.9) 0.24 0.78 Dietary Vitamin B6 (mg/day) 2.3 (1.9, 2.9) 2.7 (2.2, 3.4) 2.6 (2.2, 3.1) 2.6 (2.1, 3.1) <0.001 0.85
Supplementary vitamin intake (%) 21.2 24.4 29.6 50.4 <0.001 <0.001 0.86 3.6 6.9 Other environmental characteristics
Age (years) 48 (41, 55) 47 (42, 54) 50 (43, 55) 50 (42, 54) 0.71 0.48 Male Gender (%) 54 55 49.6 41.2 0.10 0.97
BMI (Kg/m2) 26.8 (24, 30) 25.3 (23.5, 27.6) 25.9 (23.8, 28.7) 25.3 (22.7, 28.4) 0.02 0.01 0.95 1.6 4.4 High social status (%)e 32.9 44.3 41.6 44.3 0.18 0.25
High physical active (%)f 38.7 58 50.4 52.7 0.01 0.30 Current smokers (%) 32.9 7.6 12 11.5 <0.001 <0.001 0.45 2.9 6.0
a Skewed continuous data are presented as median (1st, 3rd quartile) and categorical as frequencies. b P-value for differences between quartiles of folate serum levels derived through univariate analysis. c P-value derived through multiple linear regression analysis with main outcome the log-transformed folate serum levels and independent variables other dietary factors and environmental characteristics. d Delivered from the multiple regression model. Coefficients, R2% and |standardized β-coefficients|% of non-significant results were not included for simplicity. e Socio-economic status was defined as a score (0-5) based on 3 variables: education, job and housing. The higher the score, the higher was the level of socio-economic status. Participants were grouped in 2 categories of socio-economic status (“low” or “high”) according to the median of each population. f Physical activity rate was assessed by a standardised questionnaire [15]. Subjects were grouped in 2 categories of physical activity (“low” or “high”) according to the median rate of each population.
Page 35
MANUSCRIP
T
ACCEPTED
ACCEPTED MANUSCRIPT
Page 36
MANUSCRIP
T
ACCEPTED
ACCEPTED MANUSCRIPT