Page 1
Clemson UniversityTigerPrints
All Dissertations Dissertations
12-2012
FOLIAR APPLIED UREA NITROGENMETABOLISM IN WARM-SEASONTURFGRASS UNDER SALINITY STRESSNicholas MenchykClemson University, [email protected]
Follow this and additional works at: https://tigerprints.clemson.edu/all_dissertations
Part of the Plant Sciences Commons
This Dissertation is brought to you for free and open access by the Dissertations at TigerPrints. It has been accepted for inclusion in All Dissertations byan authorized administrator of TigerPrints. For more information, please contact [email protected] .
Recommended CitationMenchyk, Nicholas, "FOLIAR APPLIED UREA NITROGEN METABOLISM IN WARM-SEASON TURFGRASS UNDERSALINITY STRESS" (2012). All Dissertations. 1049.https://tigerprints.clemson.edu/all_dissertations/1049
Page 2
FOLIAR APPLIED UREA NITROGEN METABOLISM
IN WARM-SEASON TURFGRASS UNDER SALINITY STRESS
A Dissertation
Presented to
the Graduate School of
Clemson University
In Partial Fulfillment
of the Requirements for the Degree
Doctor of Philosophy
Plant and Environmental Sciences
by
Nicholas Alexander Menchyk
December 2012
Accepted by:
Dr. Haibo Liu, Committee Chair
Dr. Douglas Bielenberg
Dr. Samuel Martin
Dr. Hong Luo
Page 3
ii
ABSTRACT
The most widely used foliar nitrogen (N) source for warm-season turfgrass and
agriculture is urea [(NH2)2CO], due to its low cost, high percentage of N (46% by mass),
and completely soluble nature. Since urea is a soluble N source, it is commonly utilized
as a foliar N source when tank mixed with pesticides in warm-season turfgrass
management. The N in urea is not directly available to the plant until it is hydrolyzed
into ammonia by the enzyme urease in the cytosol. Urease is a nickel (Ni2+
) dependant
enzyme that is ubiquitous in plants. Its main biochemical function is the hydrolysis of
urea; however other physiological roles have been discovered including enhancement in
germination and plant defense mechanisms.
Nickel was first recognized as a required nutrient in plants in the 1970s. Critical
Ni2+
concentrations in leaf tissue varying between 25- 100 µg kg -1
depending on N
source and species. Nickel is a highly mobile trace element that tends to accumulate in
newly formed plant parts, as well as seeds and is an important cofactor of many enzymes.
Typically, excessive Ni2+
is a more common problem and has shown to affect
physiological and biochemical processes including decreased chlorophyll, lowered
photosynthetic and transpiration activities, reduced germination and impaired membrane
permeability associated with enhanced extracellular peroxidase activity.
Water use and quality have become important issues in turfgrass management
due to water use restrictions and mandates in arid climates. In these areas, effluent water
irrigation has become commonplace, leading to potential problems with water quality
including transition or heavy metal toxicity. Furthermore, seawater intrusion in coastal
Page 4
iii
areas has also led to a need for salinity tolerant turfgrasses and better knowledge of their
management techniques. Although Ni2+
is rarely deficient in plants, the widespread use
of urea as a N source in turfgrass management and the importance of urease activity
requires further examination of urea N metabolism and Ni2+
nutrition under salinity
stress.
Research also needs to examine Ni2+
supplementation of warm-season turfgrass
supplied with combinations of NH4+, NO3
- and [(NH2)2CO] N sources. Analysis of urea
and specific amino acid concentrations in plant tissue needs to be conducted to more fully
understand the uptake, assimilation, and translocation of foliar applied urea N under the
influence of Ni2+
supplementation. The significance of Ni2+
supply is dependent on N
source, and species. Critical Ni2+
concentrations in turfgrass tissues need to be
determined in those scenarios. Comprehensive research of Ni2+
nutrition needs to be
further conducted to determine the effects of supplemental Ni2+
levels, including Ni2+
toxicity symptoms, and long term ecological impact in turfgrass ecology.
Due to the lack of research examining urea N fertility, Ni2+
nutrition and toxicity,
and salinity stress of turfgrasses, three studies were conducted. The first study examined
the effect of urea fertilization method (root vs. foliar) under salinity stress of five warm-
season turfgrasses. We hypothesized that urea delivery method will influence N uptake
under salinity stress and the turfgrasses will perform similarly under salinity stress.
Treatments included two fertility delivery methods, two salinity levels, and five warm
season turfgrass genotypes. Results revealed no difference between root and foliar
applications of urea N under salinity stress. There was variability in the performance of
Page 5
iv
the ultradwarf bermudagrass cultivars, with Champion exhibiting the greatest reduction
in turf quality and accumulating the greatest concentration of proline in leaf tissue.
Seadwarf, the most salinity tolerant genotype examined, exhibited significant increases in
N concentration under foliar urea N applications and slight improvements in TQ under
moderate salinity stress. In addition, foliar applications of urea N resulted in elevated
Na+ concentration in the leaf tissue of Seadwarf at the midpoint and conclusion of the
study, which was the only genotype to display such a response. Findings from this study
suggest that foliar applications of urea N provide an alternative to traditional granular
fertilization when root zone salinity is elevated.
The second study examined urea N metabolism and the effect of Ni2+
supplementation on foliar uptake of urea. We hypothesized that Ni2+
supplementation
will enhance urea N metabolism and foliar uptake by stimulating urease activity and
increasing total amino acid pools in turfgrass leaf tissue. Treatments included two
salinity levels, two turfgrass species and three Ni2+
levels. Results from this study
revealed an apparent stimulation of N metabolism under foliar urea nutrition with Ni2+
supplementation. Although urease activity and amino acid pools were increased under
Ni2+
supplementation, an overall decrease in N content in leaf tissue was observed over
the course of the nine week study. The reduction observed in total N concentration in
leaf tissue could be due to the use of a single N source (urea) causing physiological N
deficiency which is a common response. Due to this finding, it is important to use
multiple N sources to maintain optimal growth.
Page 6
v
The third study further examined Ni2+
toxicity of two common warm-season
turfgrasses under urea N fertility. We hypothesized that Ni2+
supplementation will
stimulate urease activity and increase amino acid pools as recorded in the previous study.
Secondly, as Ni2+
concentration in leaf tissue increases, toxicity will cause decreases in
turf quality, growth, and fluctuations in micronutrient concentration. Treatments
included two turfgrass species, and four Ni2+
levels. Results revealed a stimulation of
urease activity and increases in the total amino acid pool with Ni2+
supplementation.
However, visual toxicity symptoms occurred when Ni2+
concentrations increased in leaf
tissue. Reductions in turf quality and growth were exhibited under 400, 800, and 1600
µM Ni2+
regimes. Results from this study suggest that the critical Ni2+
toxicity level in
Diamond and TifEagle begins at a range >25 mg kg-1
. Ni2+
concentrations in leaf tissue
greater than 25 mg kg-1
caused reductions in growth and symptoms of toxicity.
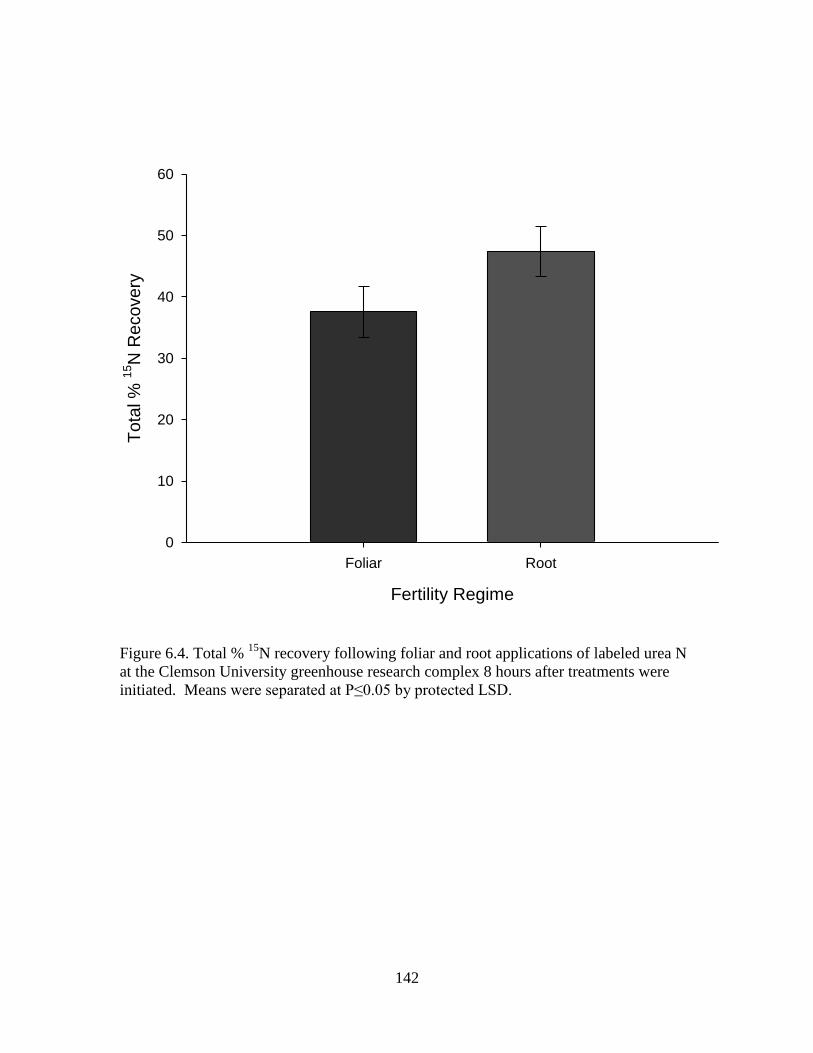
An additional fertility delivery method experiment was conducted to examine
recovery of 15
N following root and foliar applications of urea. We hypothesized that total
plant recovery of 15
N derived from fertilizer would be different between delivery methods
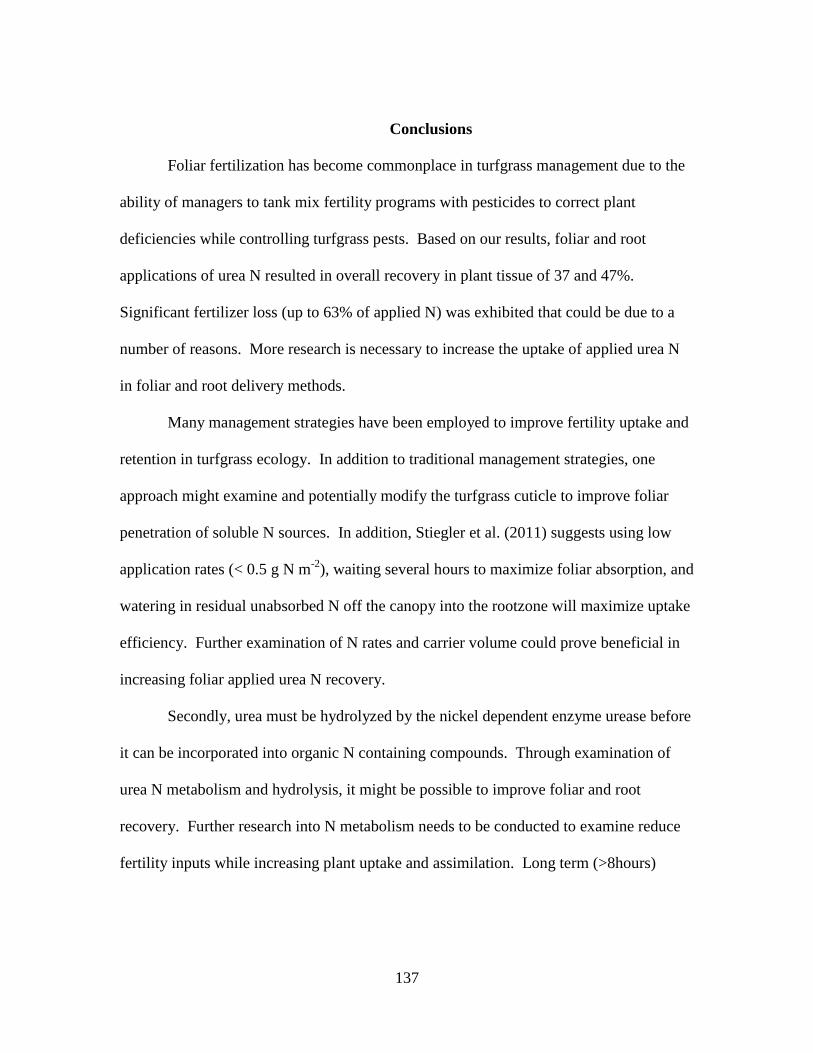
and that overall recovery would be greater in foliar applied treatments. Results revealed
that total plant recovery of 15
N labeled urea derived from fertilizer was not significantly
different in either fertility regime or species tested. Although not statistically different,
root applications of urea N resulted in 10% higher total 15
N recovery than foliar
treatments at 8 hours after application. There was variability in total plant recovery
across species although not statistically significant. MiniVerde displayed the lowest total
15N recovery at 8 hours at 35.14%, which was much lower than Diamond and Seadwarf
Page 7
vi
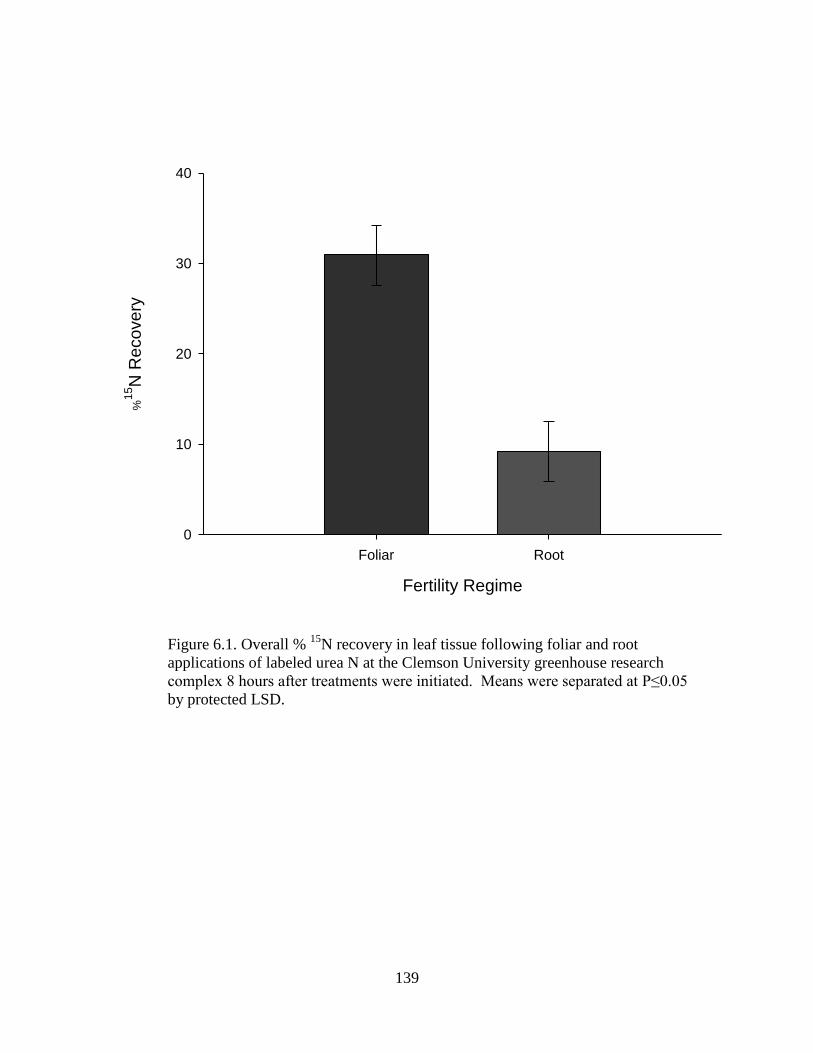
at 44.66% and 47.62% respectively. Recovery of labeled urea in each plant part was
significantly influenced by fertility regime, and was anticipated. Foliar applications of
urea resulted in higher recovery in leaf tissue while root applications resulted in elevated
15N recoveries in root tissue. In addition to recovery in specific plant tissue, root
applications of urea N resulted in significantly higher 15
N retention in soil than foliar
applications, however overall recovery of 15
N derived from fertilizer was higher in root
treatments. The 10% overall reduction in 15
N recovery for foliar treatments compared to
root applications could be due to a number of factors, including volatilization. The
disparity, although not statistically different, in total 15
N recovery due to fertility regime
could be biologically significant and is worth examining more closely. 15
N labeled urea
retained in the soil (5.55%) 8 hrs after root applications has the ability to be taken up by
the plant potentially increasing the overall recovery over time. Foliar treatments resulted
in 15
N recovery in the soil of <1%. Leaching and volatilization losses were not quantified
for this study, and account for the large portion of N lost when sampling took place.
Lastly, a field study was conducted to investigate the effects of N fertility levels
and plant growth regulator applications on the performance of Diamond zoysiagrass as a
putting green surface in the transition zone. We hypothesized that N fertility level and
plant growth regulator applications would significantly influence Diamond zoysiagrass
putting green performance. Results of this study revealed that Diamond zoysiagrass has
the ability to become another warm-season turfgrass option for putting greens in the
southern transition zone. Based on finding of this project, N fertilization of Diamond
zoysiagrass in putting green scenarios should begin with 147 kg-1
N ha-1
or less over the
Page 8
vii
growing season. Additional quick release N sources should be used following cultivation
events to promote growth and recovery. As total N input surpassed 147 kg-1
N ha-1
putting green performance as indicated by ball roll distance suffered. An obvious
increase in thatch depth and accumulation was displayed during the two year study.
Cultivation, surface management, PGR use, and fertility regimes need to be determined
to optimize putting green performance and overall turfgrass health of Diamond
zoysiagrass in putting green scenarios.
Page 9
viii
ACKNOWLEDGMENTS
I would like to sincerely thank my major advisor and friend Dr. Haibo Liu.
Thank you for your support and guidance while working on many projects at Clemson
University. I look forward to growing our knowledge of turfgrass management through
future collaborations. I would like to thank my committee members Dr. Doug
Bielenberg, Dr. Hong Luo, and Dr. Bruce Martin for their contributions to this work. I
would also like to thank Dr. Zhigang Li for his countless hours of help with lab work and
guidance, I have learned a lot through your instruction. I would like to also thank Dr.
William Bridges for his patient explanations of statistical analysis; your help is greatly
appreciated! Many thanks are due to my good friend and colleague Mr. Gib Bethea for
all your help throughout my time at Clemson. Without your help in turfgrass harvest,
data collection, and analysis this dissertation wouldn’t have been possible. Thanks to Mr.
Don Garrett, Mr. Mike Echols, and their staff for assisting with turfgrass plot and
equipment maintenance during my time at Clemson University. I would like to thank Dr.
Clint Waltz at the University of Georgia for his collaboration. I would also like to thank
the Cliffs Communities, USGA, CGCSA, and Clemson University for their financial
support of this project. I would also like to thank my parents and family. None of this
would have been possible without the support and love from you. I am so thankful to
have such great parents that made so many great things possible in my life. Finally, I
would like to thank my wife Laura. You are my best friend, and I wouldn’t have been
able to complete this work without you, thanks for your love and support.
Page 10
ix
TABLE OF CONTENTS
Page
TITLE PAGE .................................................................................................................... i
ABSTRACT ..................................................................................................................... ii
ACKNOWLEDGMENTS ............................................................................................ viii
LIST OF TABLES .......................................................................................................... xi
LIST OF FIGURES ....................................................................................................... xv
CHAPTER
I. INTRODUCTION ......................................................................................... 1
II. LITERATURE REVIEW .............................................................................. 4
Salinity Stress........................................................................................... 4
Urea N Metabolism ................................................................................ 10
Nickel Nutrition ..................................................................................... 16
Nickel Toxicity ...................................................................................... 18
Warm-Season Turfgrasses ..................................................................... 20
Foliar Fertilization ................................................................................. 25
III. FOLIAR AND ROOT UREA-N FERTILITY OF FIVE WARM
SEASON TURFGRASSES UNDER SALINITY STRESS ........................ 30
Introduction ............................................................................................ 30
Materials and Methods ........................................................................... 31
Results .................................................................................................... 35
Discussion .............................................................................................. 45
Conclusions ............................................................................................ 52
IV. SUPPLEMENTAL NICKEL APPLICATIONS AND FOLIAR UREA
FERTILITY ON TWO WARM SEASON TURFGRASS SPECIES
UNDER SALINITY STRESS ............................................................. 76
Introduction ............................................................................................ 76
Materials and Methods ........................................................................... 77
Results .................................................................................................... 79
Page 11
x
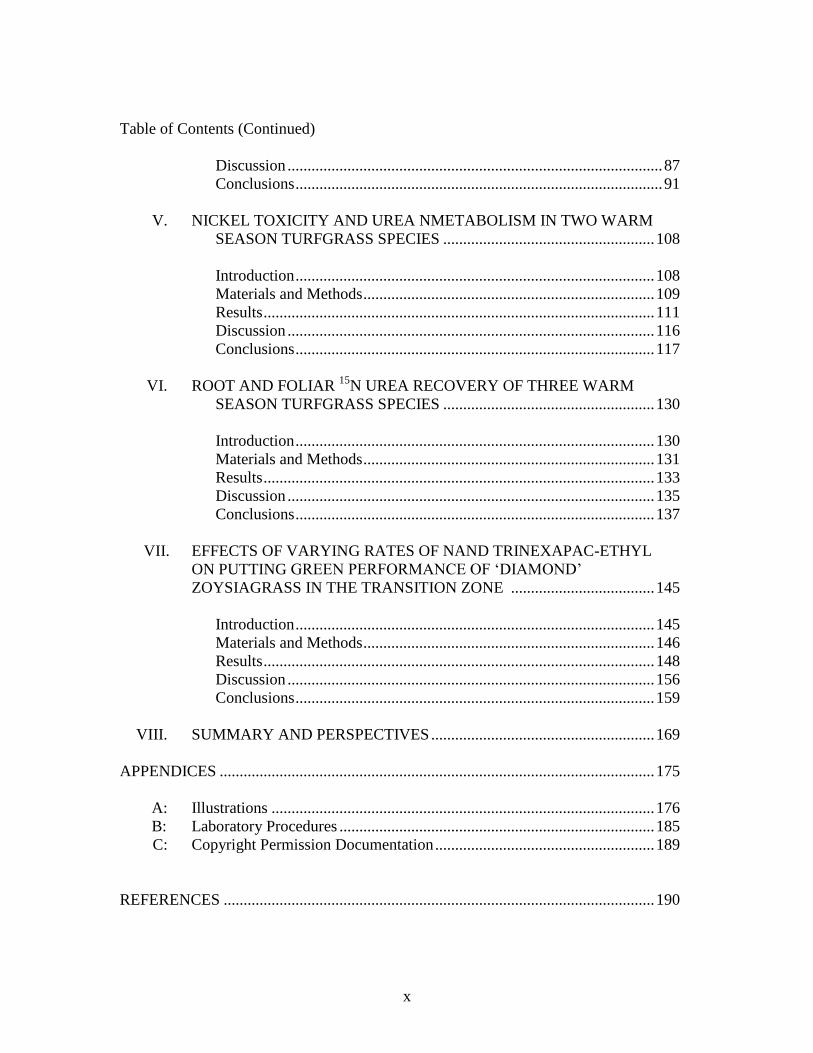
Table of Contents (Continued)
Discussion .............................................................................................. 87
Conclusions ............................................................................................ 91
V. NICKEL TOXICITY AND UREA NMETABOLISM IN TWO WARM
SEASON TURFGRASS SPECIES ..................................................... 108
Introduction .......................................................................................... 108
Materials and Methods ......................................................................... 109
Results .................................................................................................. 111
Discussion ............................................................................................ 116
Conclusions .......................................................................................... 117
VI. ROOT AND FOLIAR 15
N UREA RECOVERY OF THREE WARM
SEASON TURFGRASS SPECIES ..................................................... 130
Introduction .......................................................................................... 130
Materials and Methods ......................................................................... 131
Results .................................................................................................. 133
Discussion ............................................................................................ 135
Conclusions .......................................................................................... 137
VII. EFFECTS OF VARYING RATES OF NAND TRINEXAPAC-ETHYL
ON PUTTING GREEN PERFORMANCE OF ‘DIAMOND’
ZOYSIAGRASS IN THE TRANSITION ZONE .................................... 145
Introduction .......................................................................................... 145
Materials and Methods ......................................................................... 146
Results .................................................................................................. 148
Discussion ............................................................................................ 156
Conclusions .......................................................................................... 159
VIII. SUMMARY AND PERSPECTIVES ........................................................ 169
APPENDICES ............................................................................................................. 175
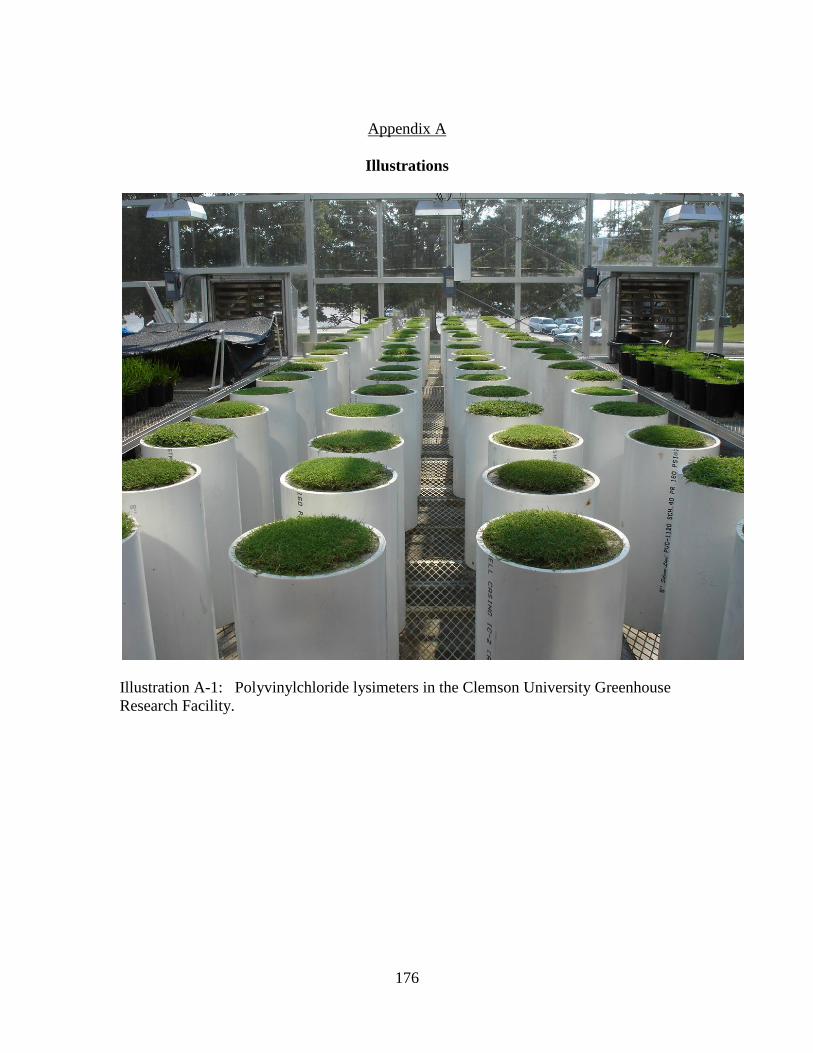
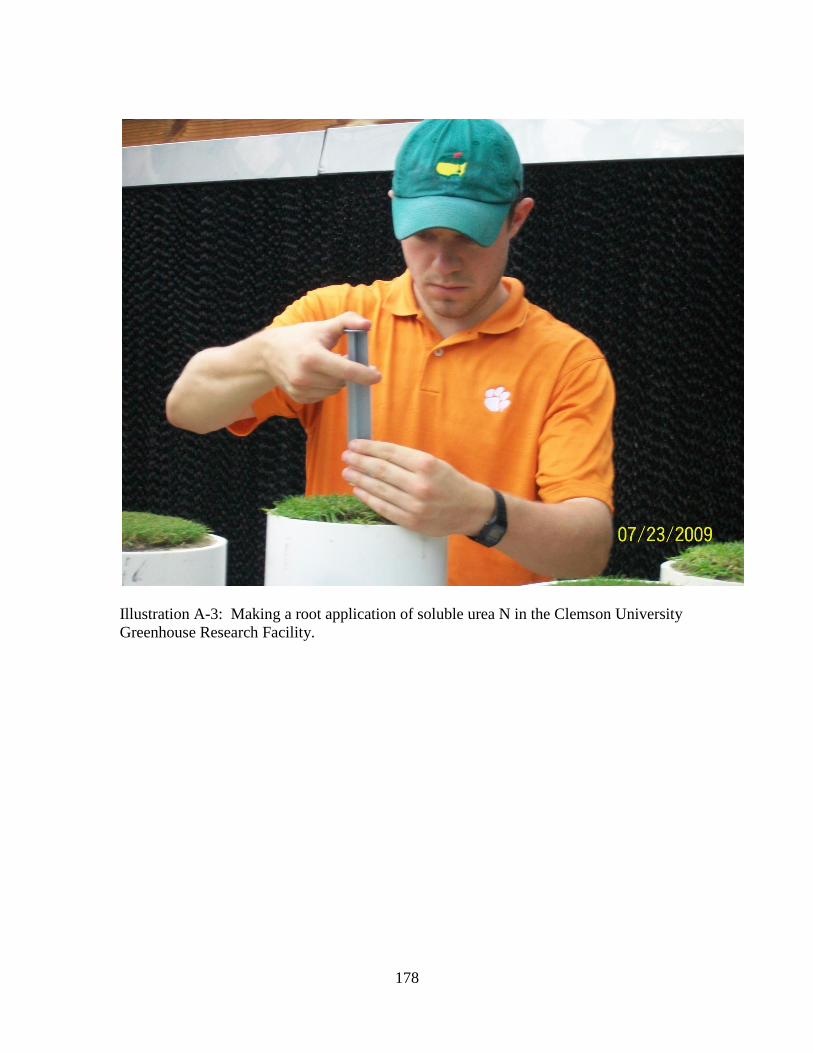
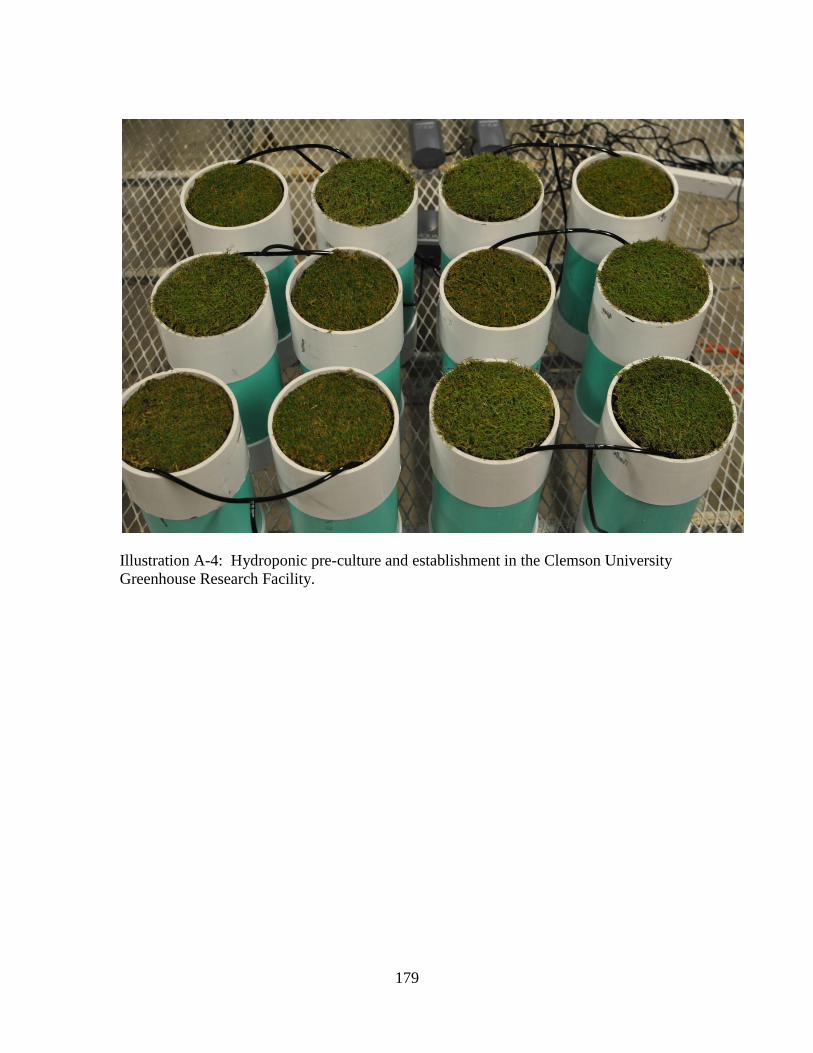
A: Illustrations ................................................................................................ 176
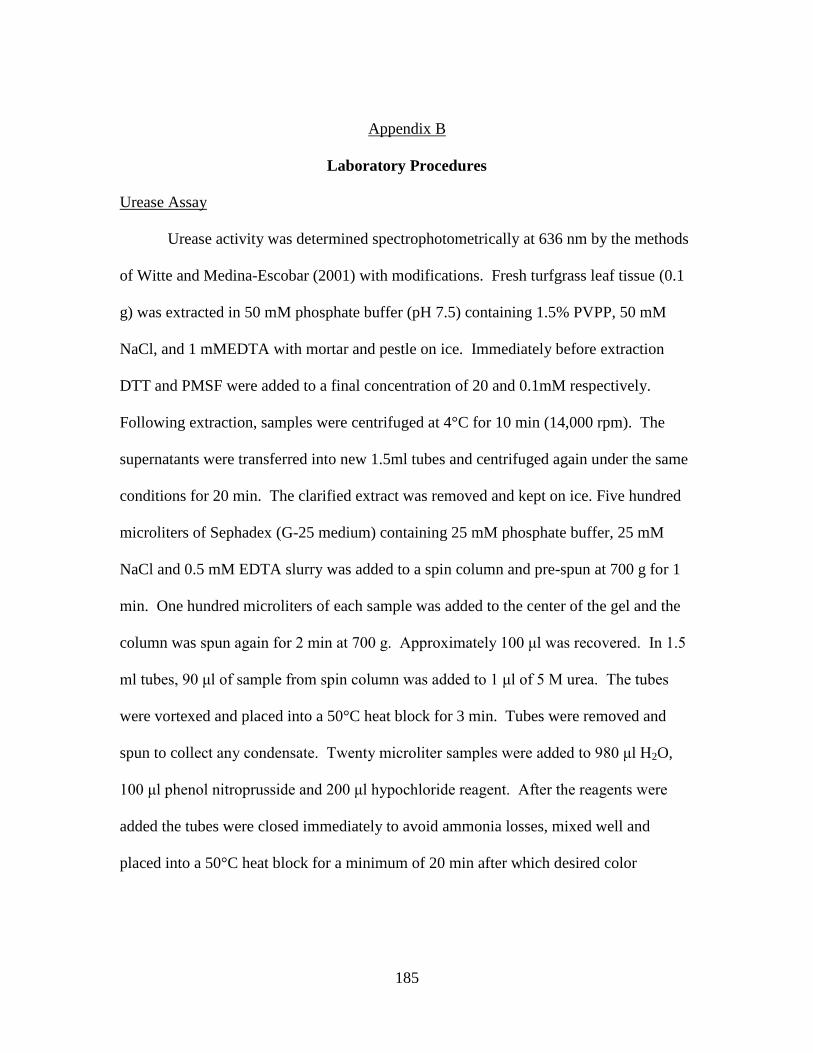
B: Laboratory Procedures ............................................................................... 185
C: Copyright Permission Documentation ....................................................... 189
REFERENCES ............................................................................................................ 190
Page 12
xi
LIST OF TABLES
Table Page
3.1 Soil chemical properties of 85%:15% (v:v) sand: peat
Used for the project Clemson University Greenhouse
Research Complex ................................................................................. 56
3.2 Stock solutions and concentrations for micronutrient,
NaCl, phosphorus, and potassium, solutions based
on Hoagland and Arnon (1950) ............................................................. 57
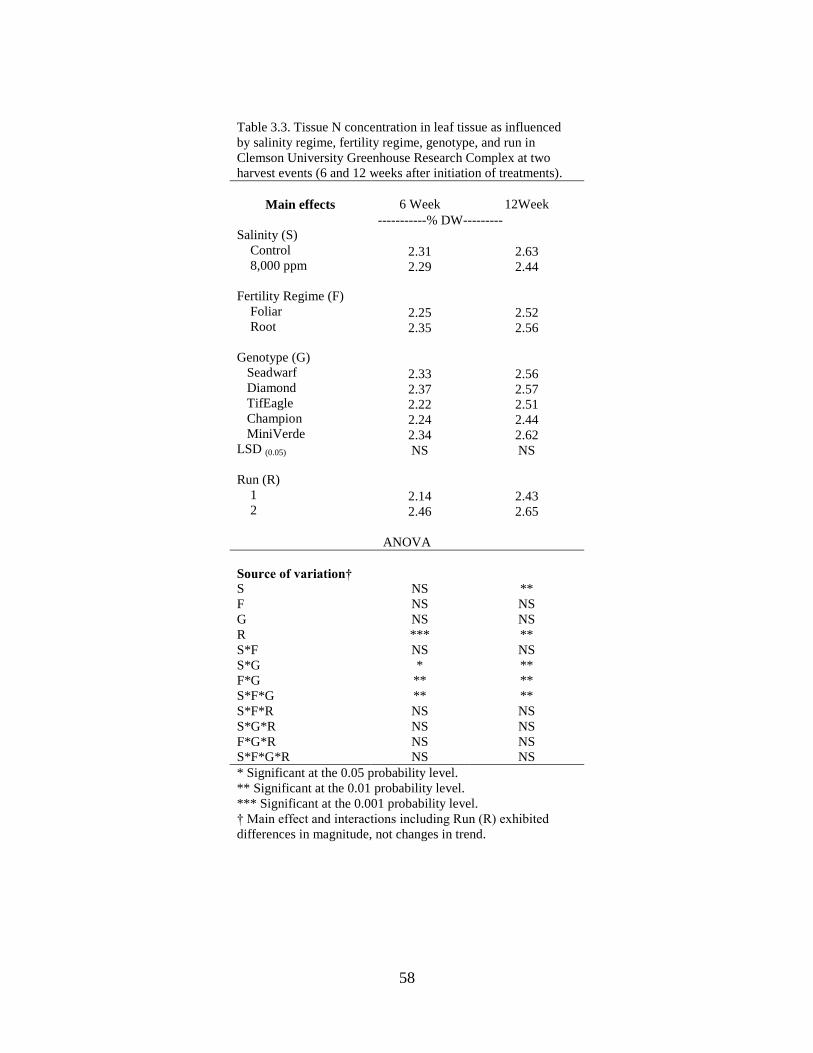
3.3 Tissue N concentration in leaf tissue as influenced by
salinity regime, fertility regime, species, and run in
Clemson University Greenhouse Research Complex at
two harvest events (6 and 12 weeks after initiation of
treatments) ............................................................................................ 58
3.4 Tissue P concentration in leaf tissue as influenced by
salinity regime, fertility regime, species, and run in
Clemson University Greenhouse Research Complex at
two harvest events (6 and 12 weeks after initiation of
treatments).............................................................................................. 59
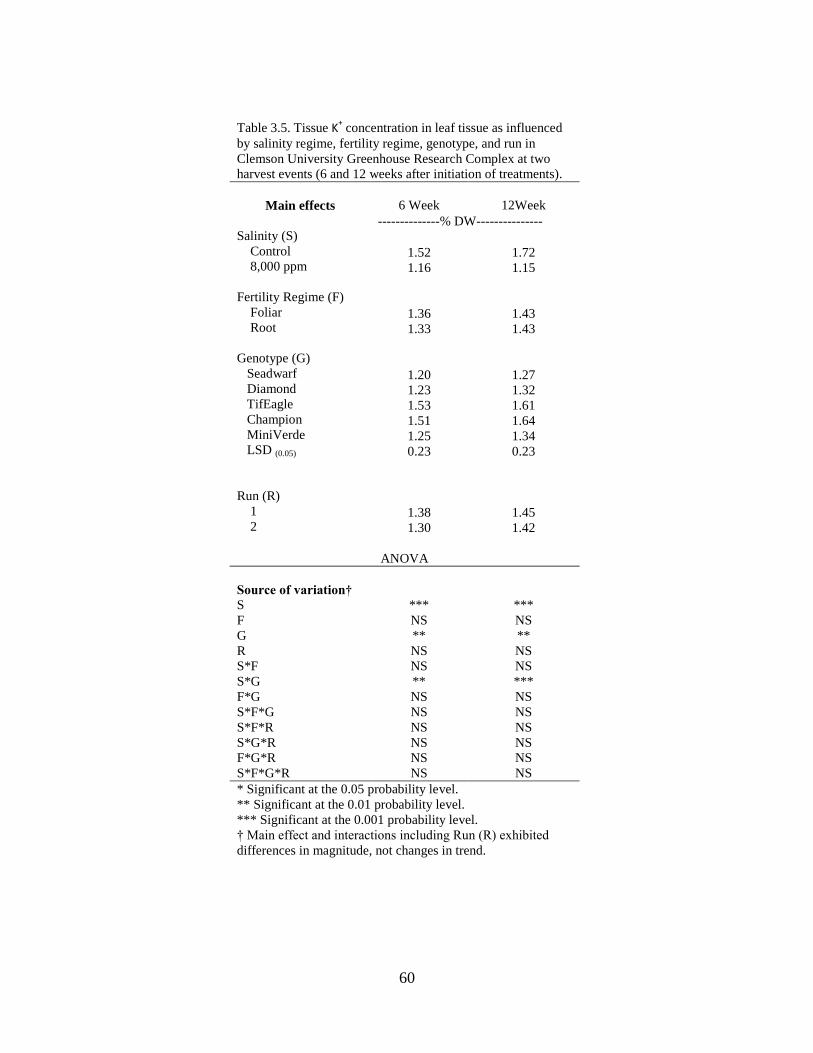
3.5 Tissue K+ concentration in leaf tissue as influenced by
salinity regime, fertility regime, species, and run in
Clemson University Greenhouse Research Complex at
two harvest events (6 and 12 weeks after initiation of
treatments).............................................................................................. 60
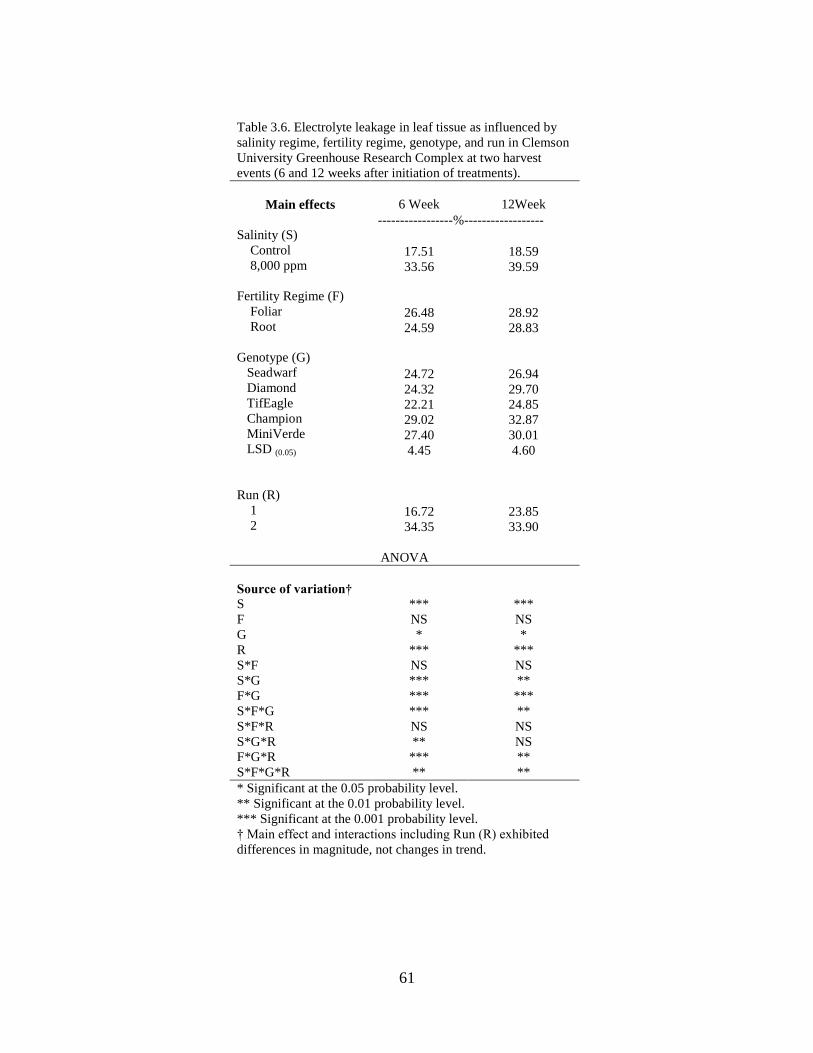
3.6 Electrolyte leakage in leaf tissue as influenced by
salinity regime, fertility regime, species, and run in
Clemson University Greenhouse Research Complex at
two harvest events (6 and 12 weeks after initiation of
treatments).............................................................................................. 61
3.7 Proline accumulation in leaf tissue as influenced by
salinity regime, fertility regime, species, and run in
Clemson University Greenhouse Research Complex at
two harvest events (6 and 12 weeks after initiation of
treatments).............................................................................................. 62
Page 13
xii
List of Tables (Continued)
Table Page
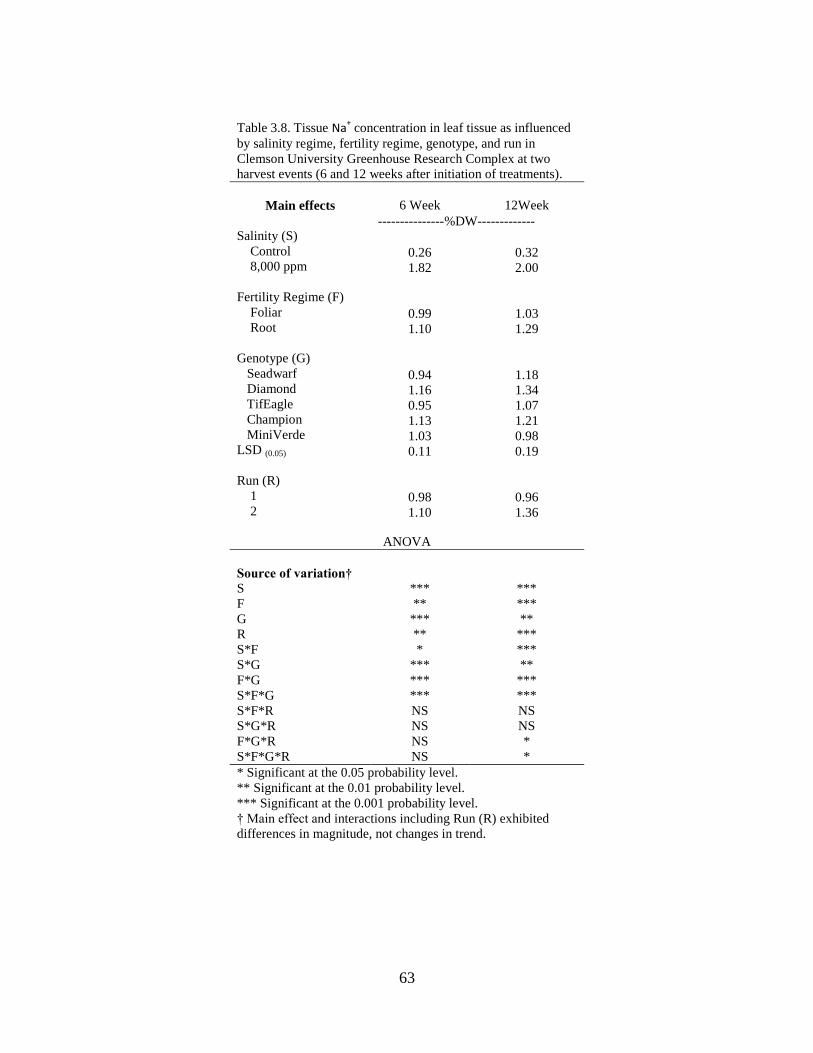
3.8 Tissue Na+ concentration in leaf tissue as influenced by
salinity regime, fertility regime, species, and run in
Clemson University Greenhouse Research Complex at
two harvest events (6 and 12 weeks after initiation of
treatments)............................................................................................ 563
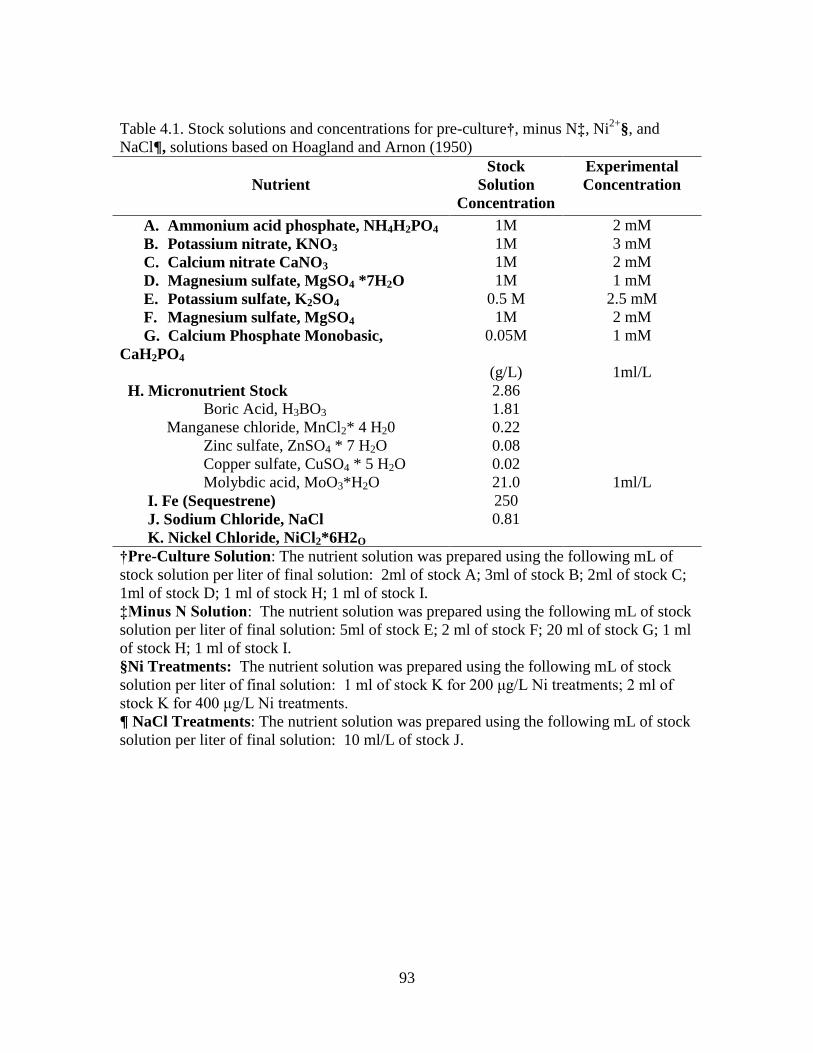
4.1 Stock solutions and concentrations for pre-culture, minus N,
Ni2+
, and NaCl, solutions based on Hoagland
and Arnon (1950) ................................................................................... 93
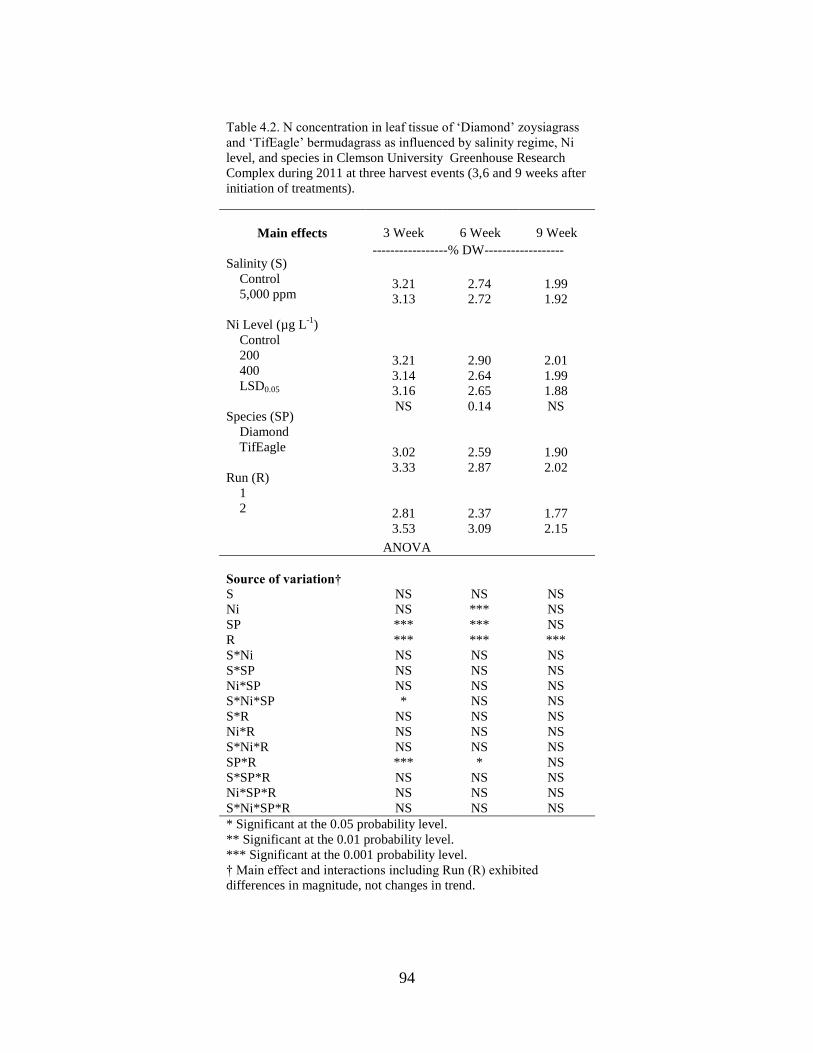
4.2 N concentration in leaf tissue of ‘Diamond’ zoysiagrass
and‘TifEagle’ bermudagrass as influenced by salinity
regime, Ni2+
level, and species in Clemson University
Greenhouse Research Complex during 2011 at three
harvest events (3,6 and 9 weeks after initiation of
treatments).............................................................................................. 94
4.3 Nickel concentration in leaf tissue of ‘Diamond’ zoysiagrass
and ‘TifEagle’ bermudagrass as influenced by salinity
regime, Ni2+
level, and species in Clemson University
Greenhouse Research Complex during 2011 at three
harvest events (3,6 and 9 weeks after initiation of
treatments) ............................................................................................. 95
4.4 Urease activity in leaf tissue of ‘Diamond’ zoysiagrass
and ‘TifEagle’ bermudagrass as influenced by salinity
regime, Ni2+
level, and species in Clemson University
Greenhouse Research Complex during 2011 at three
harvest events (3,6 and 9 weeks after initiation of
treatments).............................................................................................. 96
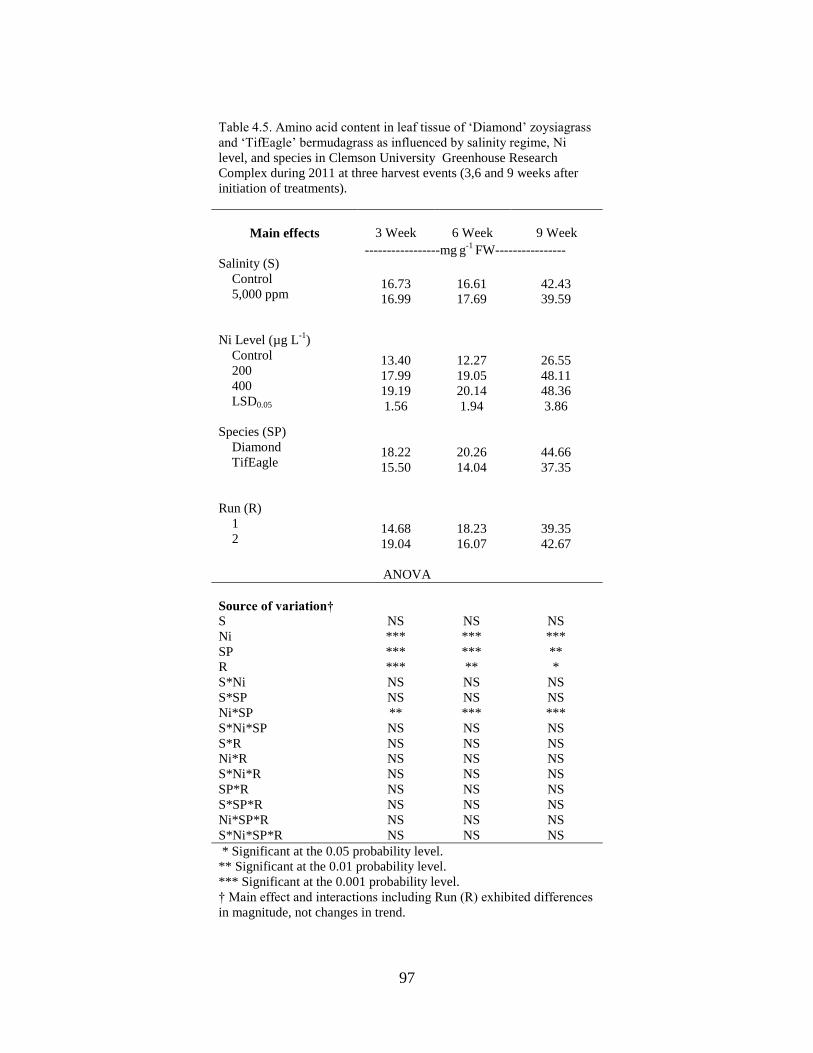
4.5 Amino acid content in leaf tissue of ‘Diamond’ zoysiagrass
and ‘TifEagle’ bermudagrass as influenced by salinity
regime, Ni2+
level, and species in Clemson University
Greenhouse Research Complex during 2011 at three
harvest events (3,6 and 9 weeks after initiation of
treatments).............................................................................................. 97
Page 14
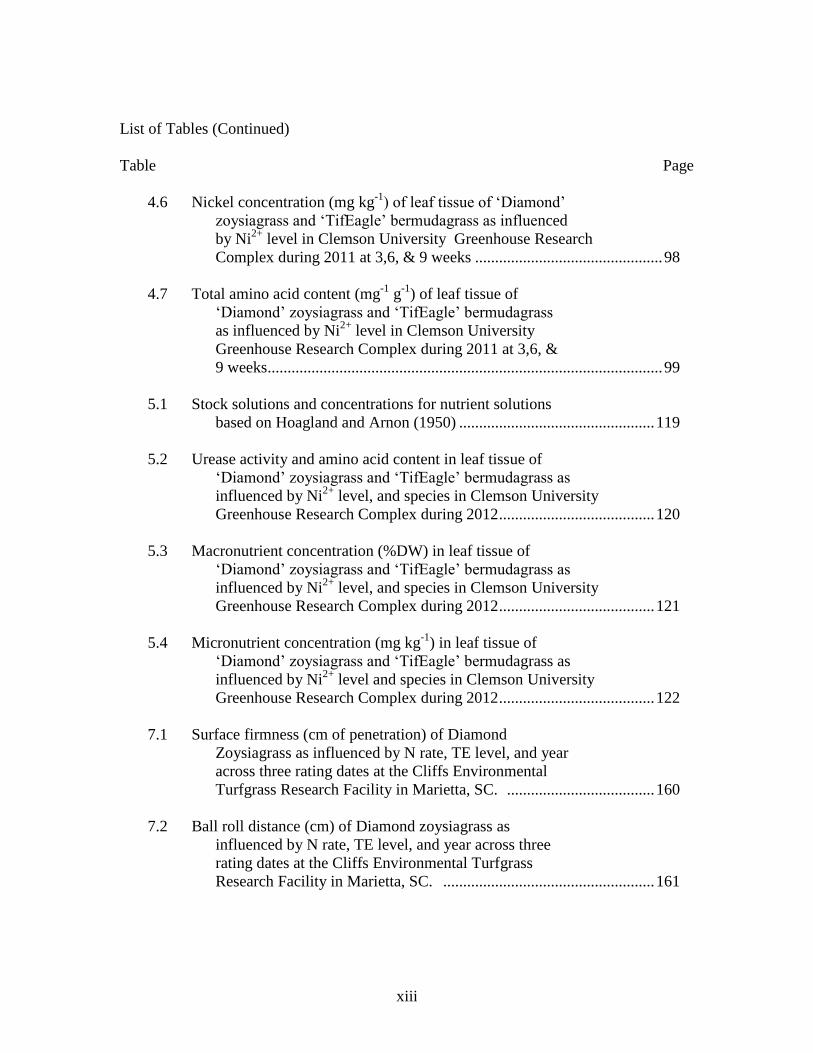
xiii
List of Tables (Continued)
Table Page
4.6 Nickel concentration (mg kg-1
) of leaf tissue of ‘Diamond’
zoysiagrass and ‘TifEagle’ bermudagrass as influenced
by Ni2+
level in Clemson University Greenhouse Research
Complex during 2011 at 3,6, & 9 weeks ............................................... 98
4.7 Total amino acid content (mg-1
g-1
) of leaf tissue of
‘Diamond’ zoysiagrass and ‘TifEagle’ bermudagrass
as influenced by Ni2+
level in Clemson University
Greenhouse Research Complex during 2011 at 3,6, &
9 weeks................................................................................................... 99
5.1 Stock solutions and concentrations for nutrient solutions
based on Hoagland and Arnon (1950) ................................................. 119
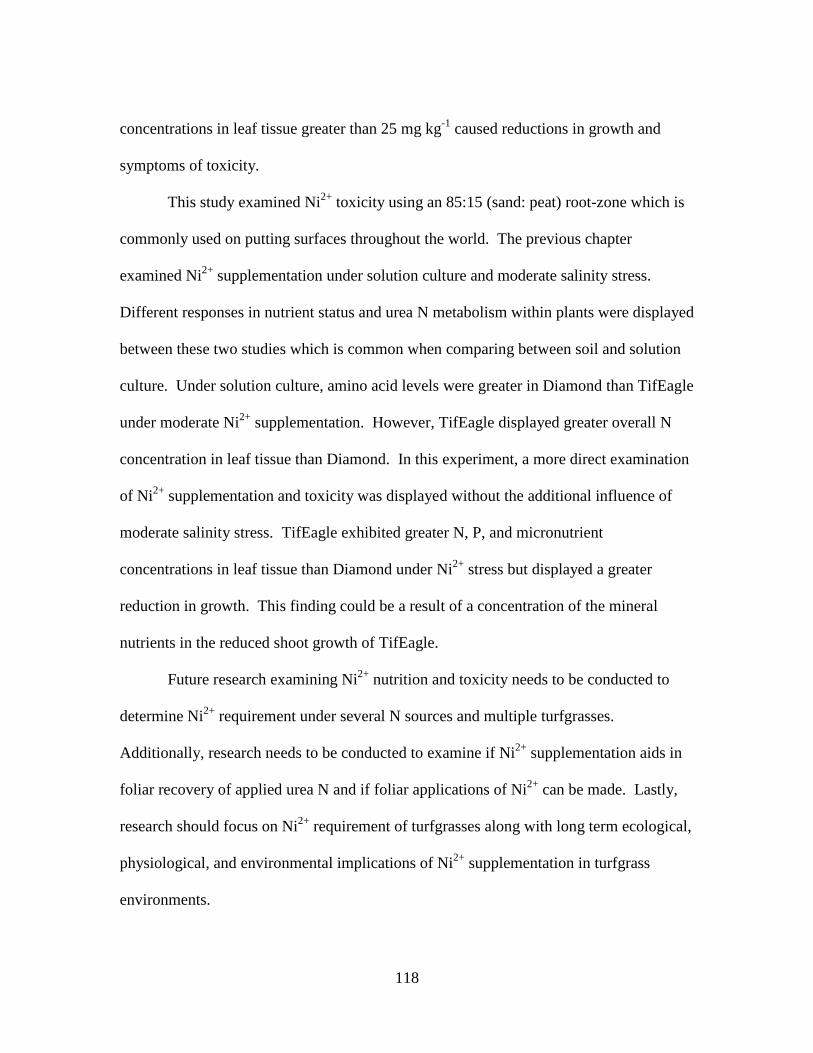
5.2 Urease activity and amino acid content in leaf tissue of
‘Diamond’ zoysiagrass and ‘TifEagle’ bermudagrass as
influenced by Ni2+
level, and species in Clemson University
Greenhouse Research Complex during 2012 ....................................... 120
5.3 Macronutrient concentration (%DW) in leaf tissue of
‘Diamond’ zoysiagrass and ‘TifEagle’ bermudagrass as
influenced by Ni2+
level, and species in Clemson University
Greenhouse Research Complex during 2012 ....................................... 121
5.4 Micronutrient concentration (mg kg-1
) in leaf tissue of
‘Diamond’ zoysiagrass and ‘TifEagle’ bermudagrass as
influenced by Ni2+
level and species in Clemson University
Greenhouse Research Complex during 2012 ....................................... 122
7.1 Surface firmness (cm of penetration) of Diamond
Zoysiagrass as influenced by N rate, TE level, and year
across three rating dates at the Cliffs Environmental
Turfgrass Research Facility in Marietta, SC. ..................................... 160
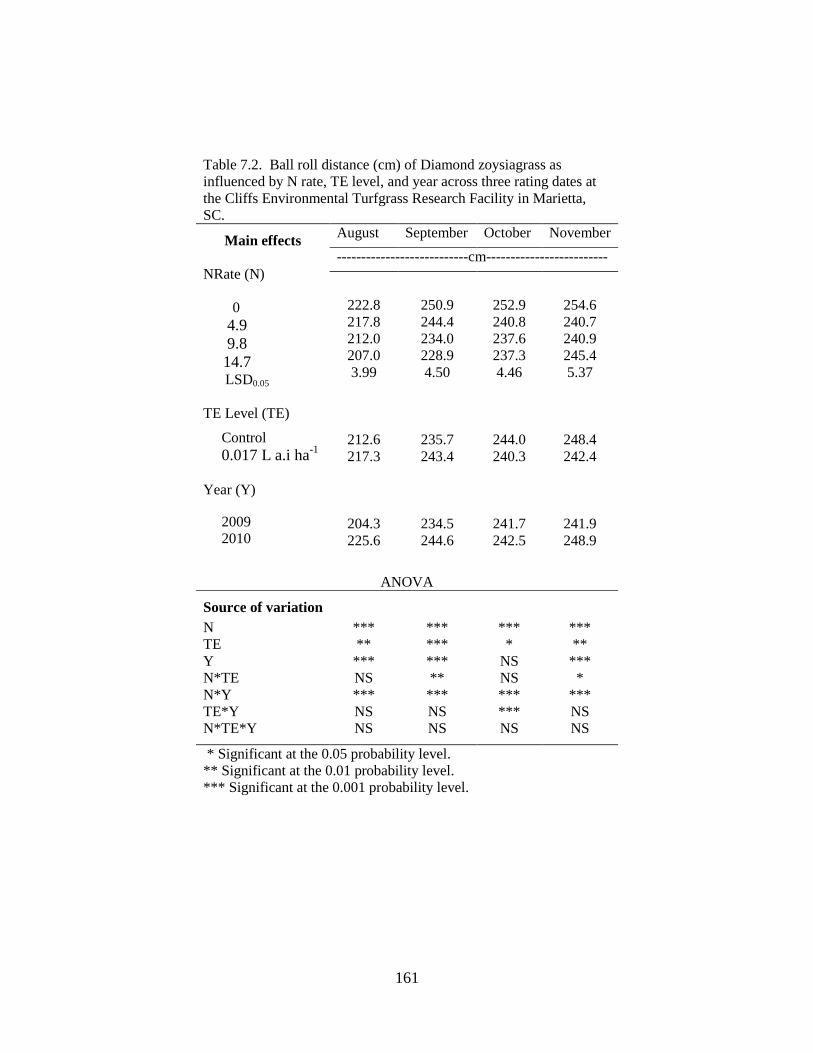
7.2 Ball roll distance (cm) of Diamond zoysiagrass as
influenced by N rate, TE level, and year across three
rating dates at the Cliffs Environmental Turfgrass
Research Facility in Marietta, SC. ..................................................... 161
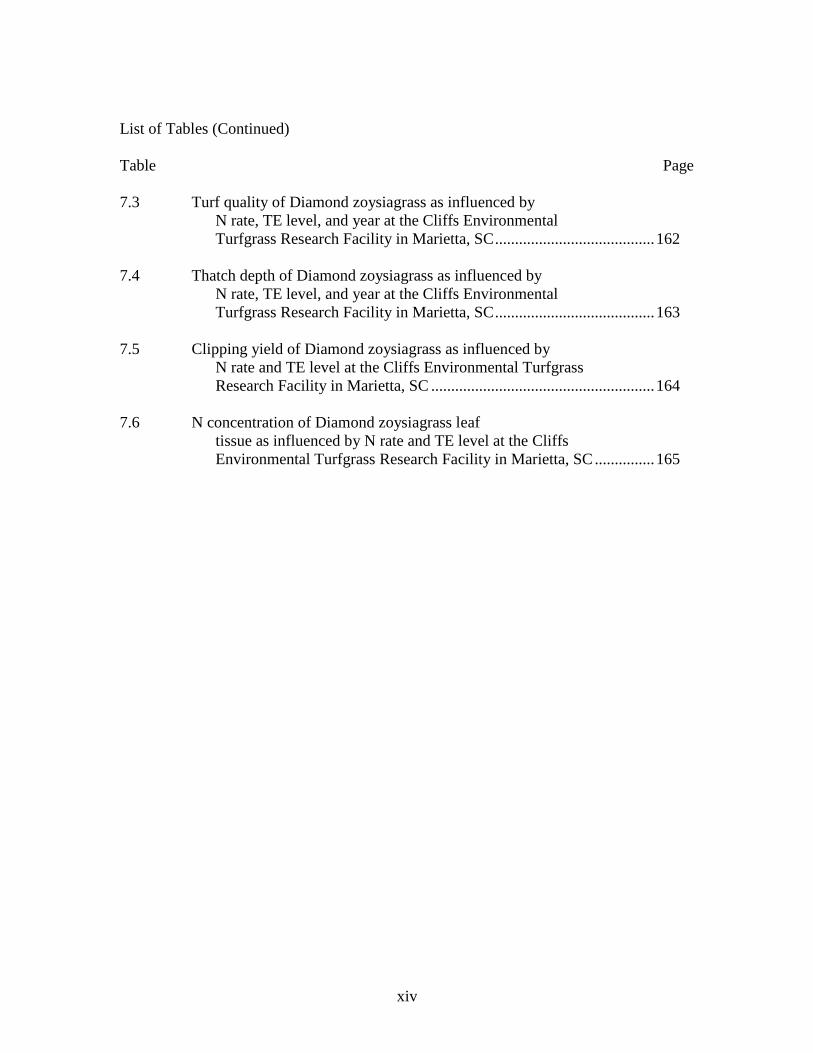
Page 15
xiv
List of Tables (Continued)
Table Page
7.3 Turf quality of Diamond zoysiagrass as influenced by
N rate, TE level, and year at the Cliffs Environmental
Turfgrass Research Facility in Marietta, SC ........................................ 162
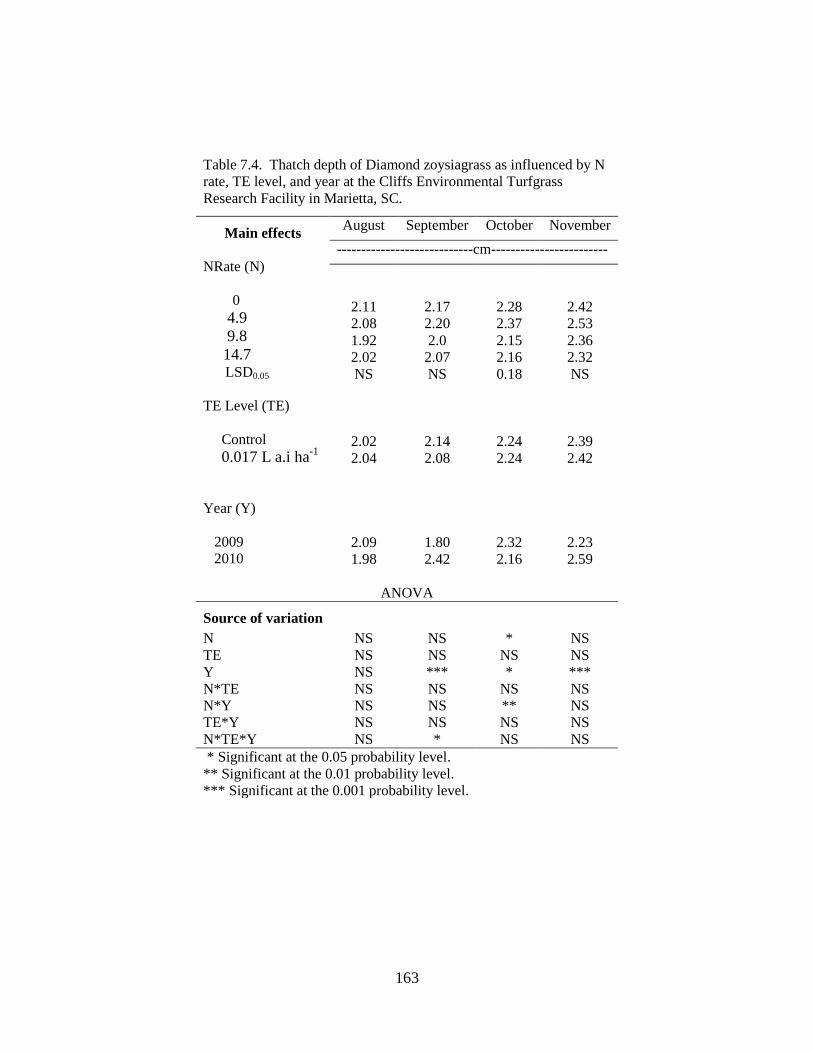
7.4 Thatch depth of Diamond zoysiagrass as influenced by
N rate, TE level, and year at the Cliffs Environmental
Turfgrass Research Facility in Marietta, SC ........................................ 163
7.5 Clipping yield of Diamond zoysiagrass as influenced by
N rate and TE level at the Cliffs Environmental Turfgrass
Research Facility in Marietta, SC ........................................................ 164
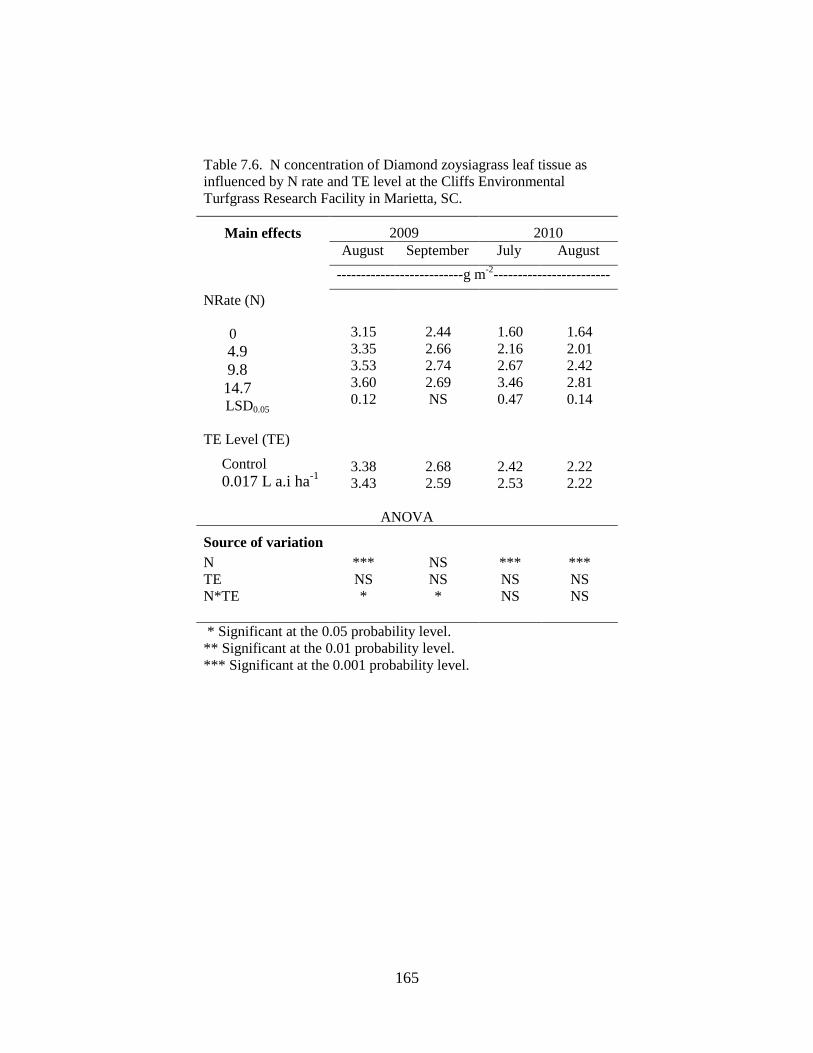
7.6 N concentration of Diamond zoysiagrass leaf
tissue as influenced by N rate and TE level at the Cliffs
Environmental Turfgrass Research Facility in Marietta, SC ............... 165
Page 16
xv
LIST OF FIGURES
Figure Page
2.1 Urea generation, transport and degradation in the plant
cells. (Wang et al. 2008) ....................................................................... 11
2.2 Function of urease, and turnover of urea and ureides in
plants and microorganisms. (Gerendas et al. 1999;
Polacco and Holland, 1993; Winkler et al. 1987) ................................. 13
2.3 Urease reaction and model of urease activation.
(Witte 2011) ........................................................................................... 14
3.1 Turf quality (0-9, >6 acceptable) of MiniVerde,
TifEagle, Champion, Diamond and Seadwarf under
fresh water irrigation at the Clemson University
Greenhouse Complex over 12 rating dates. Means
were separated at P≤0.05 by protected LSD) ........................................ 64
3.2 Turf quality (0-9, >6 acceptable) of MiniVerde,
TifEagle, Champion, Diamond and Seadwarf under
salinity stress at the Clemson University Greenhouse
Complex over 12 rating dates. Means were separated at
P≤0.05 by protected LSD ....................................................................... 65
3.3 Turf quality of five warm-season turfgrasses at the
conclusion of the study .......................................................................... 66
3.4 The interaction of salinity stress and fertility
regime on Na+ concentration % DW in the leaf tissue at the
conclusion of the study. Means were separated at
P≤0.05 by protected LSD…………………………………………….....67
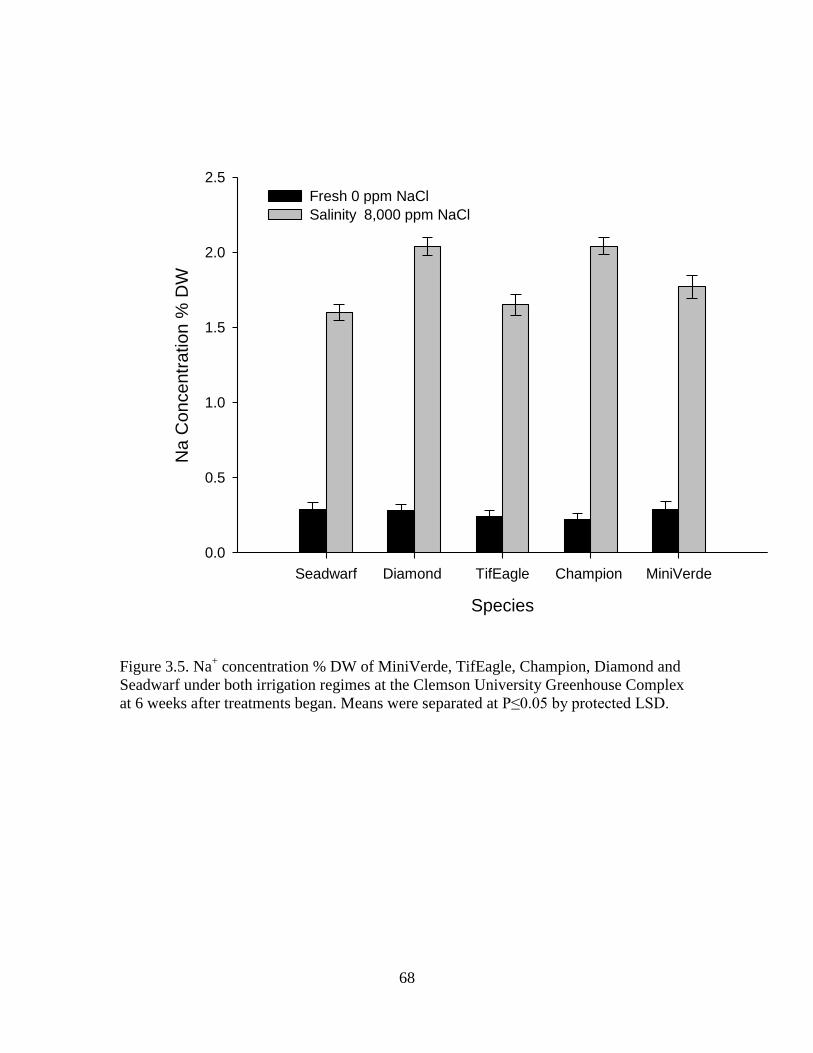
3.5 Na+ concentration % DW of MiniVerde, TifEagle,
Champion, Diamond and Seadwarf under both
irrigation regimes at the Clemson University Greenhouse
Complex at 6 weeks after treatments began.
Means were separated at P≤0.05 by protected LSD. ............................ 68
Page 17
xvi
List of Figures (Continued)
Figure Page
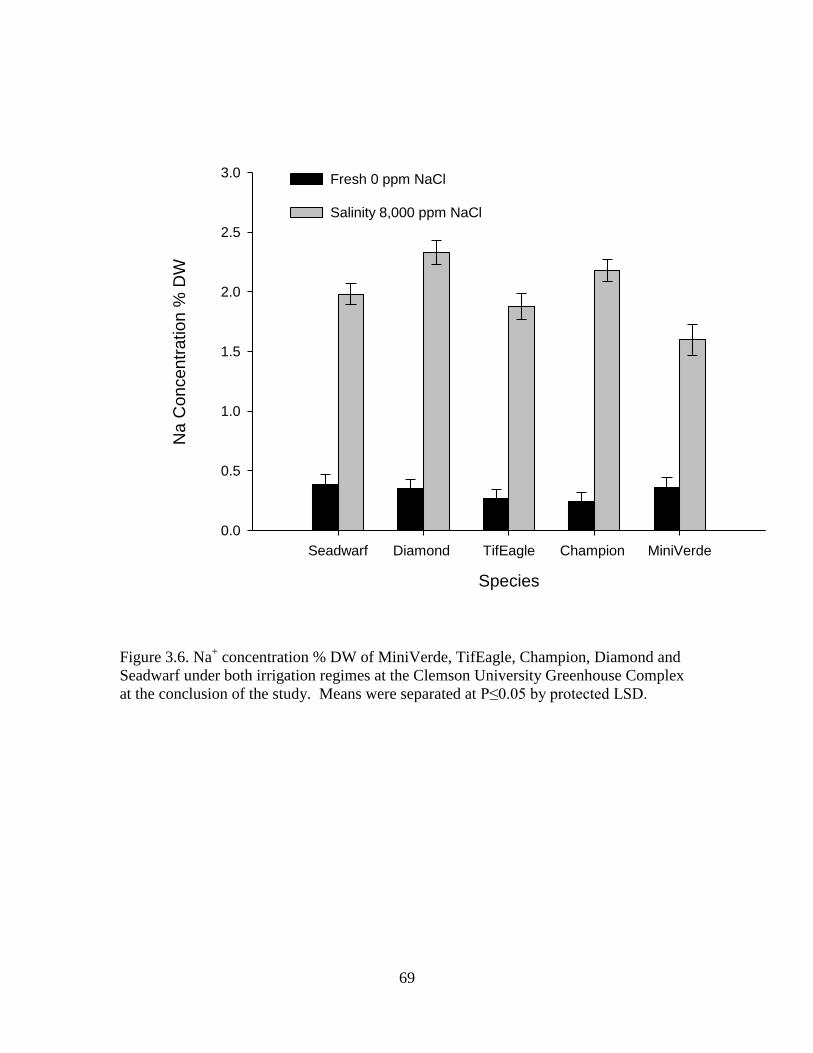
3.6 Na+ concentration % DW of MiniVerde, TifEagle,
Champion, Diamond and Seadwarf under both
irrigation regimes at the Clemson University
Greenhouse Complex at the conclusion of the study.
Means were separated at P≤0.05 by protected LSD. ............................. 69
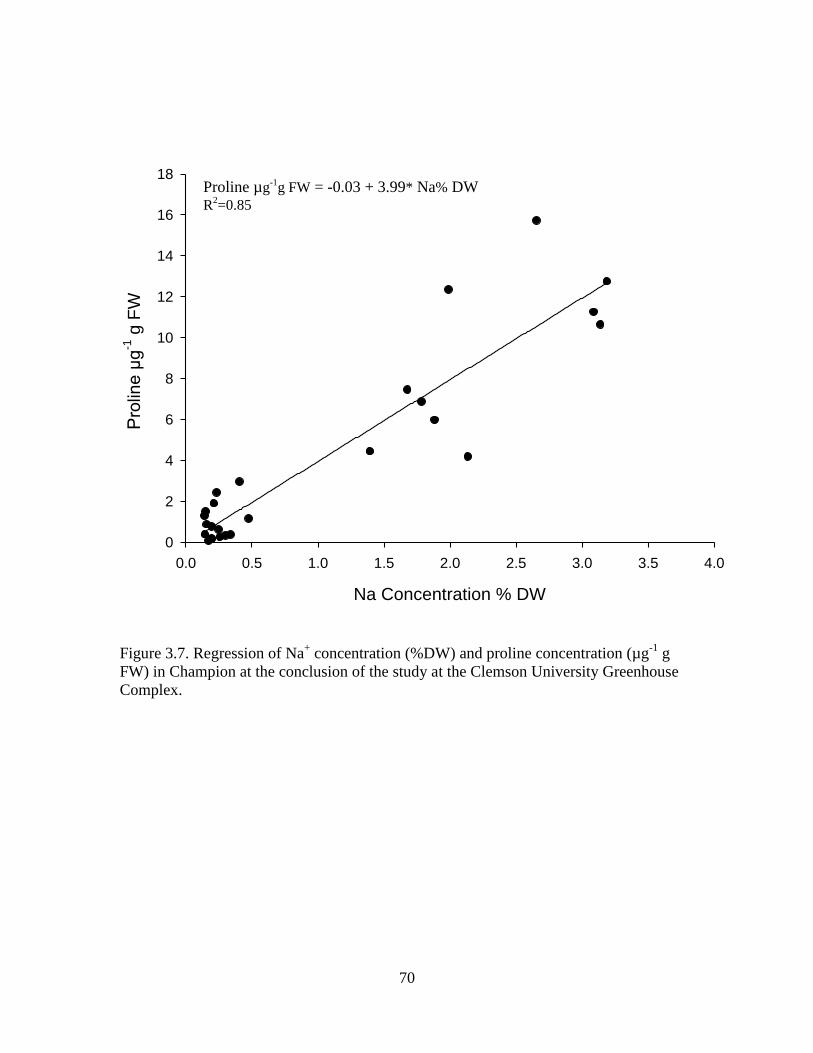
3.7 Regression of Na+ concentration (%DW) and proline
concentration (µg-1
g FW) in Champion at the
conclusion of the study at the Clemson University
Greenhouse Complex. ............................................................................ 70
3.8 Regression of Na+ concentration (%DW) and proline
concentration (µg-1
g FW) in Diamond at the
conclusion of the study at the Clemson University
Greenhouse Complex ............................................................................. 71
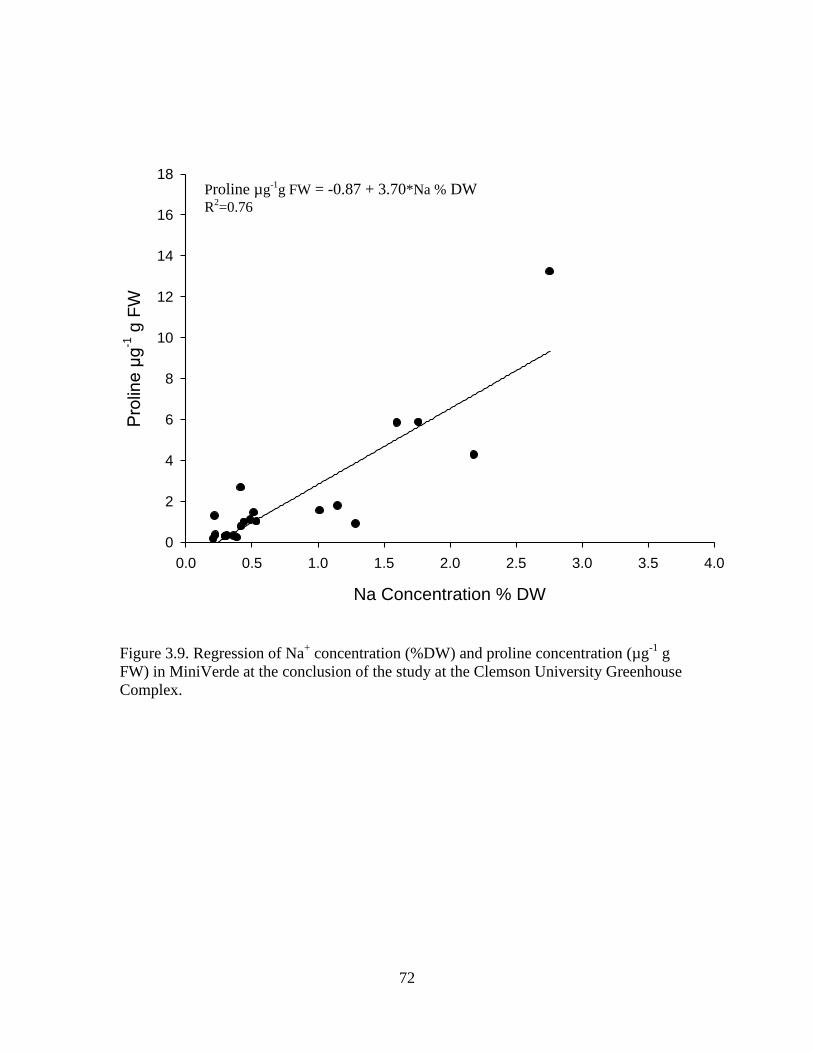
3.9 Regression of Na+ concentration (%DW) and proline
concentration (µg-1
g FW) in MiniVerde at the
conclusion of the study at the Clemson University
Greenhouse Complex. ............................................................................ 72
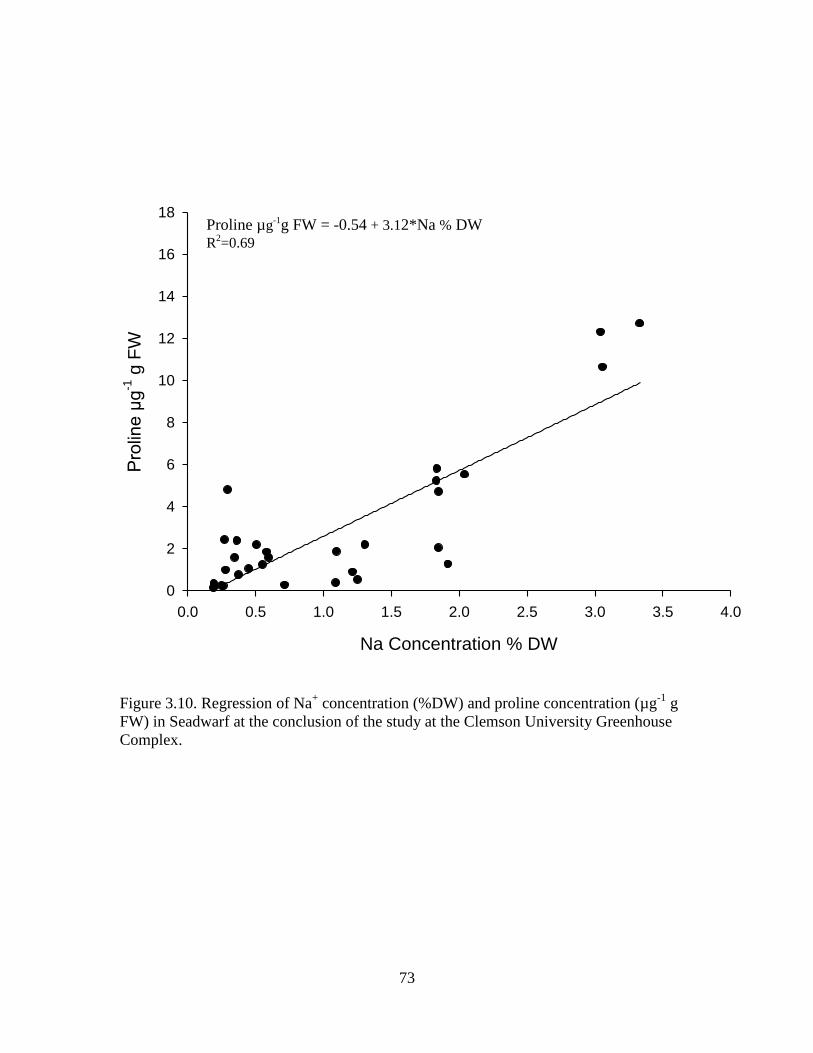
3.10 Regression of Na+ concentration (%DW) and proline
concentration (µg-1
g FW) in Seadwarf at the
conclusion of the study at the Clemson University
Greenhouse Complex ............................................................................. 73
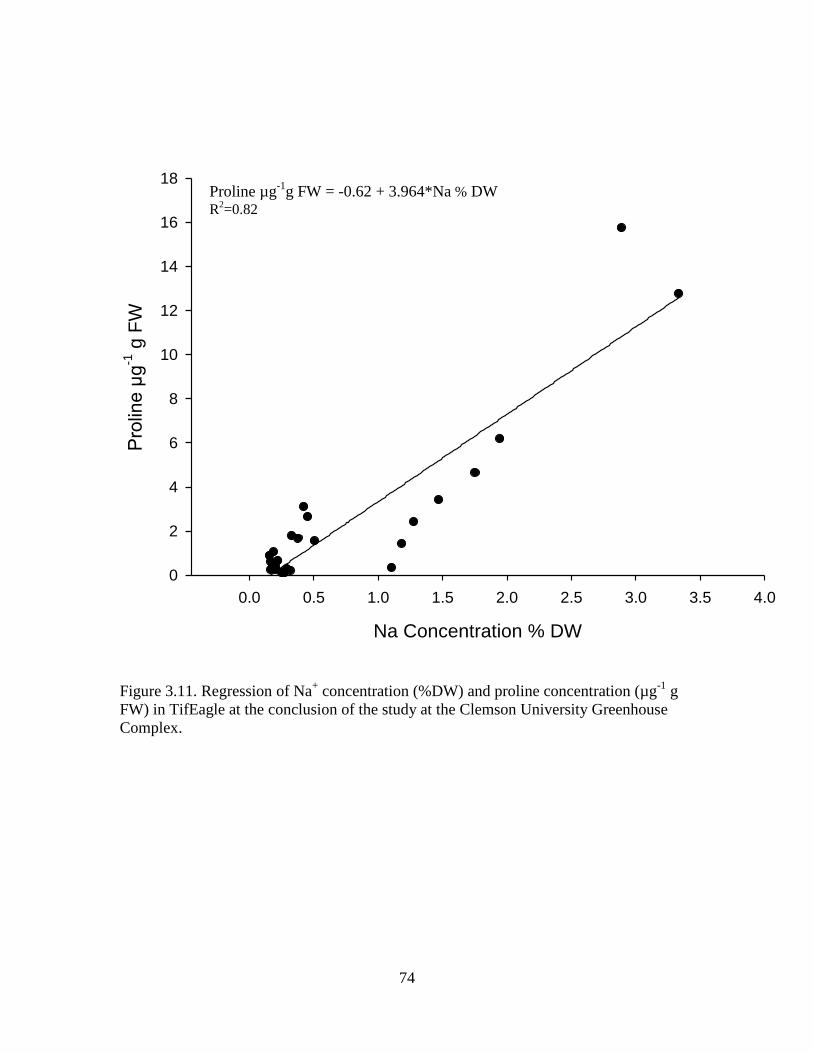
3.11 Regression of Na+ concentration (%DW) and proline
concentration (µg-1
g FW) in TifEagle at the
conclusion of the study at the Clemson University
Greenhouse Complex ............................................................................. 74
3.12 Regression of Na+ concentration (%DW) and proline
concentration (µg-1
g FW) in all species at the
conclusion of the study at the Clemson University
Greenhouse Complex ............................................................................. 75
Page 18
xvii
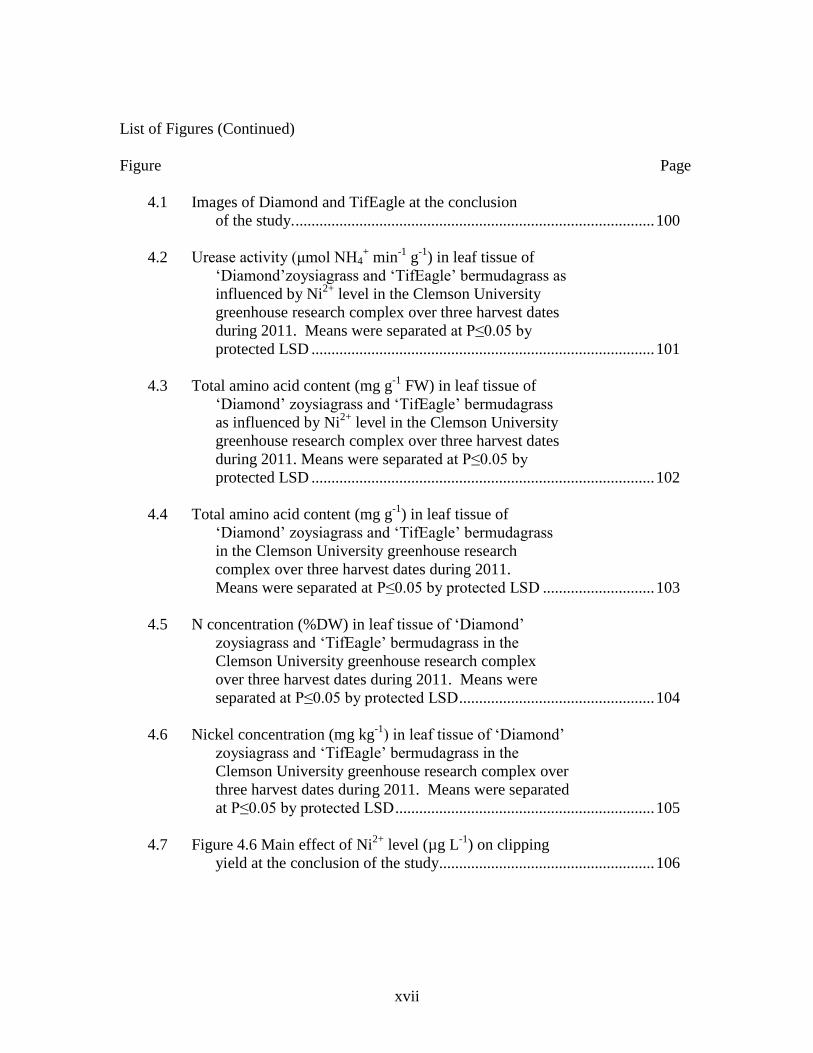
List of Figures (Continued)
Figure Page
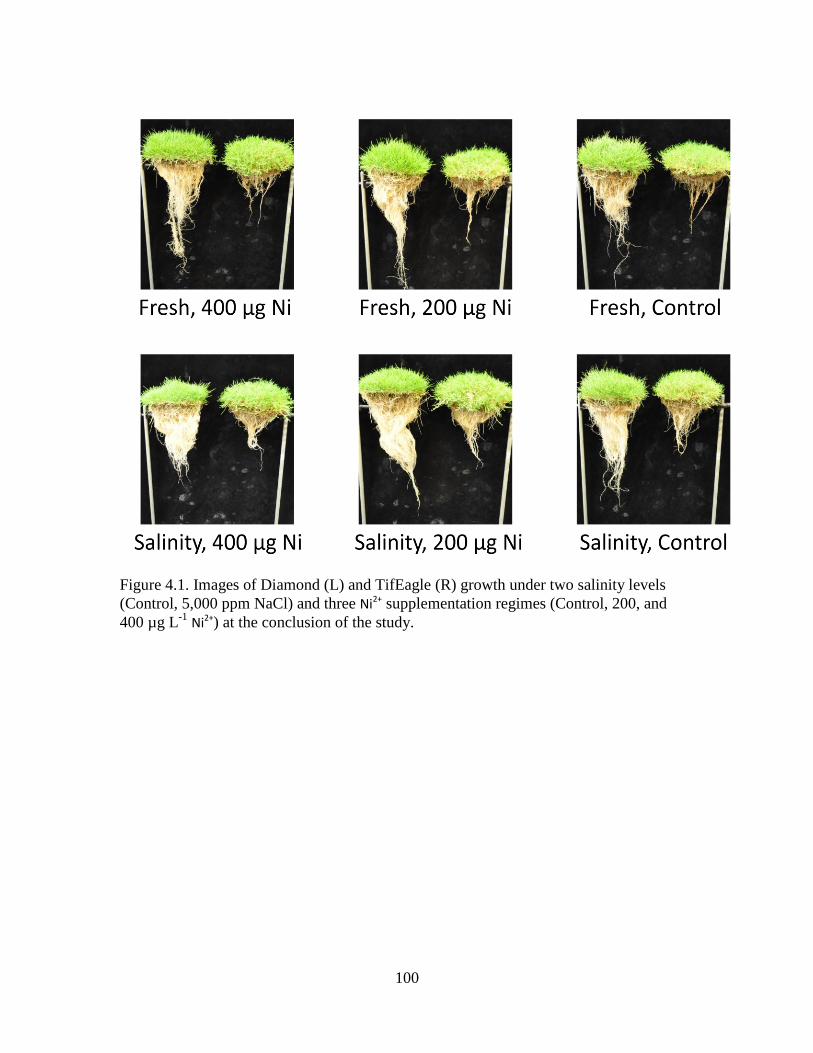
4.1 Images of Diamond and TifEagle at the conclusion
of the study. .......................................................................................... 100
4.2 Urease activity (μmol NH4+ min
-1 g
-1) in leaf tissue of
‘Diamond’zoysiagrass and ‘TifEagle’ bermudagrass as
influenced by Ni2+
level in the Clemson University
greenhouse research complex over three harvest dates
during 2011. Means were separated at P≤0.05 by
protected LSD ...................................................................................... 101
4.3 Total amino acid content (mg g-1
FW) in leaf tissue of
‘Diamond’ zoysiagrass and ‘TifEagle’ bermudagrass
as influenced by Ni2+
level in the Clemson University
greenhouse research complex over three harvest dates
during 2011. Means were separated at P≤0.05 by
protected LSD ...................................................................................... 102
4.4 Total amino acid content (mg g-1
) in leaf tissue of
‘Diamond’ zoysiagrass and ‘TifEagle’ bermudagrass
in the Clemson University greenhouse research
complex over three harvest dates during 2011.
Means were separated at P≤0.05 by protected LSD ............................ 103
4.5 N concentration (%DW) in leaf tissue of ‘Diamond’
zoysiagrass and ‘TifEagle’ bermudagrass in the
Clemson University greenhouse research complex
over three harvest dates during 2011. Means were
separated at P≤0.05 by protected LSD ................................................. 104
4.6 Nickel concentration (mg kg-1
) in leaf tissue of ‘Diamond’
zoysiagrass and ‘TifEagle’ bermudagrass in the
Clemson University greenhouse research complex over
three harvest dates during 2011. Means were separated
at P≤0.05 by protected LSD ................................................................. 105
4.7 Figure 4.6 Main effect of Ni2+
level (µg L-1
) on clipping
yield at the conclusion of the study...................................................... 106
Page 19
xviii
List of Figures (Continued)
Figure Page
4.8 Clipping yield of Diamond zoysiagrass and
TifEagle bermudagrass as influenced by Ni2+
level
(µg L-1
) at the conclusion of the study ................................................. 107
5.1 Nickel toxicity symptoms on leaf tissue of Diamond
and TifEagle under1600 µM Ni treatments ......................................... 123
5.2 Nickel toxicity symptoms on leaf tissue of Diamond
and TifEagle under 800 µM Ni treatments .......................................... 124
5.3 Nickel toxicity symptoms on leaf tissue of Diamond
and TifEagle under 400 µM Ni treatments .......................................... 125
5.4 Nickel toxicity symptoms on leaf tissue of Diamond
and TifEagle under control treatments ................................................. 126
5.5 TifEagle bermudagrass growth reduction under five
Ni2+
levels (Control, 400, 800, 1600 µM Ni2+
) .................................... 127
5.6 Diamond zoysiagrass growth reduction under five
Ni2+
levels (Control, 400, 800, 1600 µM Ni2+
) .................................... 128
5.7 Diamond and TifEagle TQ under five Ni2+
levels
(Control, 400, 800, 1600 µM Ni2+
) ...................................................... 129
6.1 Overall % 15
N recovery in leaf tissue following foliar
and root applications of labeled urea N at the Clemson
University greenhouse research complex 8 hours after
treatments were initiated. Means were separated at
P≤0.05 by protected LSD ..................................................................... 139
6.2 Overall % 15
N recovery in thatch tissue following foliar
and root applications of labeled urea N at the Clemson
University greenhouse research complex 8 hours after
treatments were initiated. Means were separated at
P≤0.05 by protected LSD ..................................................................... 140
Page 20
xix
List of Figures (Continued)
Figure Page
6.3 Overall % 15
N recovery in root tissue following foliar
and root applications of labeled urea N at the Clemson
University greenhouse research complex 8 hours after
treatments were initiated. Means were separated at
P≤0.05 by protected LSD ..................................................................... 141
6.4 Total % 15
N recovery following foliar and root
applications of labeled urea N at the Clemson
University greenhouse research complex 8 hours
after treatments were initiated. Means were
separated at P≤0.05 by protected LSD ................................................. 142
6.5 Total % 15
N recovery of Diamond, MiniVerde and
Seadwarf at the Clemson University greenhouse
research complex 8 hours after treatments were
initiated. Means were separated at P≤0.05 by
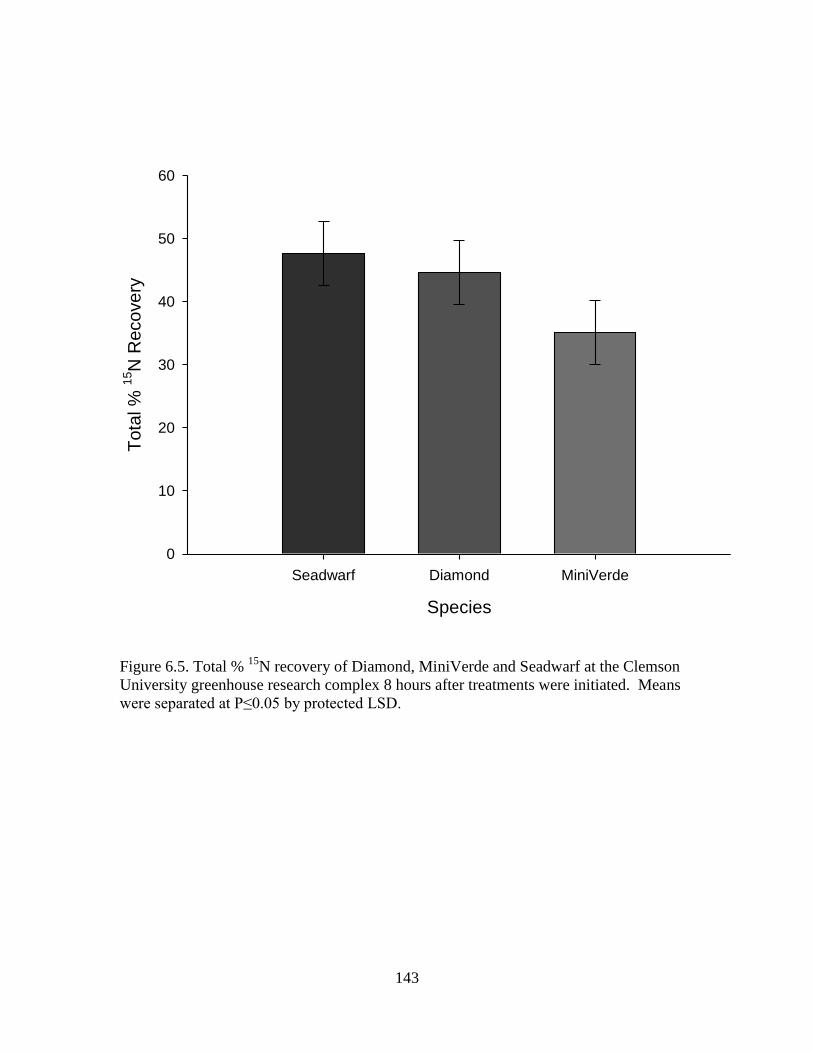
protected LSD ...................................................................................... 143
6.6 Total % 15
N recovery in soil following foliar and root
applications of labeled urea N at the Clemson
University greenhouse research complex 8 hours
after treatments were initiated. Means were separated
at P≤0.05 by protected LSD ................................................................. 144
7.1 Turf quality as affected by N level and time
(1-9, >6 acceptable) Means were separated at
P≤0.05 by protected LSD ..................................................................... 166
7.2 Ball roll distance (cm) as affected by N level
and time. Means were separated at P≤0.05 by
protected LSD ...................................................................................... 167
7.3 Main effect of N level on thatch depth over 4 harvest
dates and 2 years. Means were separated at P≤0.05 by
protected LSD ...................................................................................... 168
Page 21
1
CHAPTER I
INTRODUCTION
Second to water, N is most growth limiting factor in turfgrass management.
Without proper N fertilization, turfgrass health, quality, and performance suffer.
Comprising 3-6% of the dry weight of turfgrass, N is a vital component of chlorophyll,
amino acids, proteins, nucleic acids and secondary metabolites (Beard, 1973). Turfgrass
managers employ two very different techniques to apply N, granular fertilization
targeting root uptake, and foliar fertilization targeting nutrient uptake through leaf tissue.
The most widely used foliar N source for warm-season turfgrass and agriculture is
urea [(NH2)2CO], due to its low cost, high percentage of N (46% by weight), and
completely soluble nature (McCarty, 2011). Before urea N can be useful to the plant it
must be hydrolyzed by the Ni2+
dependent metalloenzyme urease into ammonia and
carbon dioxide. Urease is ubiquitous in most vegetative plant tissue and has many
functions in plant physiology including, recycling N bound in urea that accumulates
during early seedling development and catabolism of arginine pools (Zonia et al., 1995).
Other roles of urease are being examined, including enhancements in germination, and
plant defense properties.
Ni2+
is a trace micronutrient that was demonstrated to be essential in plants in the
1970s. The major role of Ni2+
in plants is its requirement as a cofactor of urease. The
influence of Ni2+
on urease activity and urea N metabolism has been documented in
numerous species (Krogmeier et al., 1991; Gerendas et al., 1998; Moraes et al., 2009; Tan
et al., 2000; Yang et al., 1996). However, literature focusing on Ni2+
’s influence on urea
Page 22
2
metabolism is lacking in turfgrass where a large amount of urea is utilized every year in
fertility programs.
Salinity stress is important in turfgrass management due to limitations on the
availability of high quality irrigation water. Water use mandates are increasingly
common, requiring turfgrass managers to use effluent water for irrigation. Coastal areas
with poor water quality also can suffer seawater intrusion. The best strategy for turfgrass
managers in these scenarios is to select well-adapted salinity tolerant turfgrass. The most
popular warm-season putting green turfgrasses include ultradwarf bermudagrass Cynodon
dactylon (L) Pers. X C. transvaalensis Burtt- Davy] varieties, seashore paspalum
(Paspalum vaginatum O. Schwartz) cultivars, and most recently fine textured
zoysiagrasses [Zoysia matrella (L.) Merr.]. Salinity stress negatively influences turfgrass
health and performance in numerous ways forcing turfgrass managers to seek
management techniques including fertility programs that will promote healthy turfgrass
growth and minimize environmental stress.
Foliar fertilization accounts for a significant portion of total nutrients applied in
turfgrass management each year. Although commonly practiced by turfgrass managers,
there is still a lot to learn about the mechanisms, metabolism, and uptake of foliar applied
urea N. Unlike granular applications of urea, where microorganisms in the soil break
down urea into ammonium N forms prior to plant uptake, foliar applications of urea
require the plant to directly hydrolyze the urea. Previous literature have examined foliar
applied recovery of multiple N sources, species (Bowman and Paul, 1989; Bowman and
Paul, 1990; Bowman and Paul, 1992; Henning et al., 2009; Stiegler et al., 2011) but have
Page 23
3
not investigated Ni2+
nutrition in an effort to enhance urea N metabolism through
augmentation of urease activity in the plant tissue.
This dissertation explores foliar and root urea N fertilization, urea N metabolism,
the effects of Ni2+
supplementation, and Ni2+
toxicity in several common warm-season
turfgrasses under moderate salinity stress.
Page 24
4
CHAPTER II
LITERATURE REVIEW
Salinity Stress
The use of effluent water for irrigation is becoming more common in turfgrass
management due to water use restrictions, and competition between the turfgrass industry
and citizens for fresh water in arid climates. Effluent water, also known as reclaimed,
gray, recycled, or wastewater are terms describing water that has gone through one cycle
of domestic use (McCarty, 2011). Currently 13% of all golf courses in the United States
use reclaimed water, 34 percent of them being in the Southwest (McCarty, 2011). Both
limited water availability and reduced quality increase our need to examine salinity
tolerant turfgrasses and management techniques (Qian et al., 2000).
Although utilization of effluent water is beneficial in terms of water conservation,
it carries the risk of salinity toxicity. Turfgrasses growing in salt-affected areas suffer
many salt related problems. Negative effects of utilizing effluent water as an irrigation
source include diminished N metabolism resulting in reduced photosynthetic rate. Toxic
element accumulation from effluent irrigation water can cause deficiencies in beneficial
nutrients, most notably calcium and potassium (K+), resulting in lower K
+/Na
+ ratios
within the plant. Effluent water irrigation can lead to a more negative water potential in
the soil affecting the general water balance of the plant leading to drought stress
symptoms. These osmotic effects associated with salinity stress cause stomatal closure
leading to reduced photosynthesis. The use of effluent water irrigation in arid climates,
where it is commonly practiced can cause additional injury to turfgrass plants by causing
Page 25
5
an accumulation of salts, including sodium chloride, leading to heightened levels of stress
(Bowman et al., 2006). Salinity stress does not only affect nutrient levels within plants it
has also been shown to augment N metabolism. Salinity stress can affect nutrient uptake,
such as Na+ reducing K
+ uptake and excessive Cl
- ions reducing NO3
- uptake (Grattan and
Grieve, 1999). To achieve favorable K+/Na
+ ratios, selectivity of ions at the root zone is
important. Peng et al. (2004) reported that alkali-grass (Puccinellia spp.) possesses a low
affinity K+ channel in the root which facilitates favorable K
+ uptake and Na
+ exclusion in
salt affected sites. K+ and sodium (Na
2+) selectivity is exhibited in shoot cells when of
Na+ ions are sequestered into the vacuole (Pessarakli and Kopec, 2008). If elevated
levels of salt and trace micronutrients accumulate in the soil, permeability problems due
to the degradation of the soil structure by Na+ occur which can also lead to reductions in
enzyme activities of microorganisms (Carrow and Duncan, 1998; Frankenberger and
Bingham, 1982; Reynolds et al., 1985). Tabatabai (1977) found that many trace elements
commonly found in effluent irrigation water inhibited urease activity in soil.
A change in the growth characteristics and physiology of turfgrass plants is seen
under salinity stress. Moderately tolerant and salt sensitive species display reduced shoot
growth in salt affected sites whereas tolerant species and halophytes often show an
increase or stimulation in growth due to presumed deficiencies in salt ions. Enhanced
root growth in tolerant species is frequently demonstrated under salinity stress leading to
an increased root /shoot ratio that is advantageous and considered a salinity tolerance
mechanism (Pessarakli and Kopec, 2008). A frequent salt tolerance mechanism of C3
and C4 turfgrasses is toxic ion exclusion from the shoot. Torello and Rice (1986)
Page 26
6
demonstrated that alkali-grass (Puccinellia spp.) a C3 species, restricted Na+ ions to
significantly lower levels in plant tissue than salt sensitive cultivars. Marcum and
Murdoch (1994) reported that salinity tolerance of C4 turfgrasses species depends on their
ability to exclude toxic ions in shoot tissue. Ion exclusion can be facilitated through the
use of salt glands or bladders which eliminate excess saline ions from shoots by active
excretion (Pessarakli and Kopec, 2008). Marcum and Pessarakli (2008) found that salt
glands were present in abaxial and adaxial leaf surfaces of many cultivars of
bermudagrass (Cynodon spp.).
A difference in salt tolerance among turfgrasses has been reported in a number of
studies largely based upon salinity induced growth reduction or relative turf quality
(Torello and Rice, 1986). To overcome salinity stress, turfgrasses utilize several
mechanisms including: compatible solute synthesis/accumulation, exclusion of saline
ions at the root cortex, and excretion by salt glands (Marcum and Pessarakli, 2006). Salt
exclusion has been observed in C3 and C4 turfgrasses with minimal osmotic adjustment in
the shoot sap (Marcum and Pessarakli, 2006).
Halophytes and glycophytes adjust to increasing salinity levels by lowering tissue
osmotic potentials through compatible solute accumulation (Torello and Rice, 1986).
Compatible solutes are low molecular weight molecules such as glycine betaine, proline,
sorbitol, mannitol, pinitol, and sucrose used by plants to adjust osmotic potential in the
cytoplasm under dehydrative stresses including drought, salinity, and low temperatures
(Hare et al., 1999). Compatible solutes are thought to reduce the cellular water potential
below soil water values, thus maintaining turgor pressure high enough to sustain growth
Page 27
7
under drought or salinity stress (Delauney and Verma, 1993). K+ ions also function in a
similar way by adjusting the osmotic potential within plant tissues to cope with the
lowering of the water potential in salt affected soils. An N containing amino acid,
proline, can be synthesized via two pathways in plants, 1) glutamate pathway the most
common pathway under osmotic stress and 2) ornithine pathway, which is considered the
biosynthetic pathway under supra optimal N conditions. Proline accumulation has been
reported to occur after high and low temperature, transition metal toxicity, pathogen
infection, anaerobiosis, nutrient deficiency, atmospheric pollution and elevated UV
exposure (Verbruggen and Hermans, 2008). Proline is also thought to play a principal
role as an osmoregulatory solute in plants subjected to osmotic stresses (Delauney and
Verma, 1993). Increased proline contents within leaf tissue would suggest a shift in N
metabolites due to the increased synthesis of the amino acid under environmental stress.
Proline accumulation has been proposed to act as a way to store carbon and N (Hare and
Cress, 1997).
Salt glands or bladders eliminate saline ions by active excretion and are present in
many salt adapted turfgrass genera including Cynodon and Zoysia (Marcum et al., 1998;
Marcum and Pessarakli, 2006). In addition to salt secretion, it is probable that salt
tolerant species also compartmentalize Na2+
and Cl- ions within the vacuoles while
organic solutes are accumulated in the cytoplasm (Marcum and Pessarakli, 2006).
Although adjustments in osmoticum are made, glycophtytic species’ growth is usually
inhibited due to the toxic effects of accumulated solutes. Although exclusion of Na+
and
Cl- in the shoot is critical to maintain enzyme function and growth in turfgrasses under
Page 28
8
salinity stress, C4 plants utilize Na2+
and Cl- for osmotic adjustment. In C4 turfgrasses the
regulation or selectivity of Na+ and Cl
- is a better description of their tolerance
mechanism under salinity stress (Pessarakli and Kopec, 2008). In C3 and C4 turfgrasses
the maintenance of K+/Na
+ ratio is necessary to cellular enzyme function (Marcum and
Murdoch, 1994).
Uptake of N and its metabolism are restricted by root zone salinity, which
increases the potential for nutrient losses due to leaching (Bowman et al., 2006).
Generally, plants prefer a mixed N source (NH4+, NO3
-) under salinity stress (Kant et al.,
2007). Kant et al. (2007) showed that barley (Hordeum vulgare L.) fed a mixed N
regime led to an increase in total N in control and saline environments. Supplementing
ammonium for nitrate under salinity stress has been shown to alleviate deleterious effects
by increasing concentrations of iron, chlorophyll and reducing sugars in tomato
(Lycopersicon esculentum L.) (Flores et al., 2001). Uptake of nitrate in barley and nitrate
and ammonium uptake in wheat (Triticum spp.) are affected by salinity stress (Aslam et
al., 1984). N status also affected nutrient uptake in salinity-stressed tall fescue (Festuca
arundinacea Schreb.) with 60% reductions under sufficient N regimes, whereas N
deficient tall fescue absorbed nearly the entire amount of available N under salinity stress
(Bowman et al., 2006).
Lewis and Chadwick (1983) found that the highest amount of 15
N assimilation in
mixed N fed plants (most robust plants), followed by ammonium fed plants (smallest,
least robust plants) and finally, the nitrate fed plants. Pease et al. (2011) found that N
forms applied had negligible effects on velvet bentgrass [Agrostis canina (L.)] turf
Page 29
9
quality. Bailey (1999) found that N sources affected biomass production and
partitioning, under nitrate treatments, creeping bentgrass (Agrostis palustris subsp.
stolonifera L.) partitioned resources into shoot and stolon formation whereas ammonium
treatments preferentially partitioned resources into root production. Due to the lack of
consistency in the patterns of ammonium and nitrate absorption rates with time implies
that the plants had no specific preference for either N form (Bailey, 1999). Picchioni and
Quiroga-Garza (1999) found that recovery of soluble ammonium nitrate and ammonium
sulfate was higher than urea in ‘TifGreen’ bermudagrass. Total N recovered after
fertilization for ammonium sulfate and ammonium nitrate averaged 78% of the applied
N, whereas urea only averaged 66%. This finding is inconsistent with the suggestion that
foliar urea uptake is rapid, less likely to leach. Under suboptimal growing conditions
(decreasing photoperiod, reduced temperature) losses of foliar applied fertilized increased
to 46%-62% of the applied N (Picchinoi and Quiroga-Garza, 1999). Contradictory
results were found by Bowman and Paul (1992), where perennial ryegrass [Lolium
perenne (L.)] fertilized with foliar urea, ammonium, and nitrate all exhibited similar
uptake.
In order to be incorporated into amino acids, nucleic acids, and other compounds,
the anion form of N (NO3-) must be reduced to NH4
+ which is energy dependent. Nitrate
fed plants showed no reduction in dry mass and only a slight reduction in fresh mass up
to the 50 mM salinity levels, whereas the effect of salinity at the 20 mM level in
ammonium fed plants was very marked and became increasingly so with elevated levels
of salinity. Due to the different tissues in the plant where nitrate (leaf) and ammonium
Page 30
10
(roots) are assimilated, salinity stress could have deleterious effects on ammonium
metabolism and ionic effects that don’t affect leaf based N assimilation. Although most
salinity/nutrient related studies demonstrate that salinity reduces nutrient uptake and
accumulation or affects partitioning within the plant, little evidence exists that adding
nutrients at levels above those considered optimal in non-saline environments, improves
crop yield (Grattan and Grieve, 1999).
Urea N Metabolism
In addition to being a popular N fertilizer source, urea is also an important N
metabolite in plants (Figure 2.1) generated by arginine (Arg) degradation and ureide
catabolism (Merigout et al., 2008). Before urea N can be assimilated into amino acids it
must be hydrolyzed by urease into ammonia (NH3) and carbon dioxide. Urease, a Ni2+
dependent cytosolic enzyme, is ubiquitous in plants and is found in soil where it can lead
to considerable N loss through volatilization following urea fertilization (Torello and
Wehner, 1983; Stiegler et al., 2011). Ureases are Ni2+
dependent metalloenzymes that
catalyze the hydrolysis of urea to ammonia and carbon dioxide, enhancing the rate of the
un-catalyzed reaction by a factor of 8 x 10¹⁷
. The reaction catalyzed by urease is
essential to make urea N accessible to plants (Gerendas et al., 1999). The best genetic
data concerning plant ureases are available for soybean (Glycine max) (Polacco and
Holland, 1993). The embryo-specific urease is an abundant seed protein in many species
including soybean and jackbean (Polacco and Holland, 1993) and Arabidopsis (Zonia et
al., 1995), while the ubiquitous urease iso-enzyme is found in lower amounts in
vegetative tissues of most plants (Hogan et al., 1983). The ubiquitous urease is
Page 31
11
responsible for recycling metabolically derived urea and hydrolysis of externally
generated urea, while the embryo-specific urease’s role is currently unknown. (Sirko and
Brodzik, 2000).
Figure 2.1 Urea generation, transport, degradation in plant cells (Wang et al., 2008).
Reprinted with permission, documentation in appendix C.
Urease has many roles in plants including enhancements in germination, plant
defense, but it’s most well known function is its role in urea metabolism (Brown et al.,
1987; Krogmeier et al., 1991; Gerendas and Sattelmacher, 1997a; Gerendas et al., 1998a;
Gerendas et al., 1999). The primary role of urease is to allow the use of external or
internally generated urea as an N source (Sirko and Brodzik, 2000). N present in urea is
unavailable to the plant until hydrolyzed by urease and incorporated into organic
compounds (Figure 2.2) by glutamine synthetase (Sirko and Brodzik, 2000). Urease has
a molecular weight of 590 kDA and is the only Ni2+
containing metalloenzyme (Figure
Page 32
12
2.3) yet identified in plants, and the importance of Ni2+
for urease activity has been
demonstrated in many studies (Menegassi et al., 2008; Krogmeier et al., 1991; Sirko and
Brodzik, 2000; Zonia et al., 1995).
Several studies have examined mutant, or urease antisense plants including potato
(Solanum tuberosum L.) and soybean to further establish roles of urease within plants. A
urease negative soybean mutant accumulated considerable levels of urea in all tissues and
exhibited necrotic leaf tips (Krogmeier et al., 1991). Observations that urease-negative
mutants also tend to germinate more slowly and at lower frequency were noted. Witte et
al. (2002) demonstrated urease activity in wild type and urease-antisense transgenic
potato. Urease activity in leaves of the antisense plants was approximately 30% of the
controls, and urea N accumulated to higher concentrations in the antisense plants due to
the lowered hydrolysis of urea. However, Witte et al. (2002) reported that urea
degradation rates after the initial increase in urea concentrations are similar in both
transgenic and non-transgenic plants. A correlation between urease activity and 15
N
metabolism was found, however, there was no effect of urease activity on either N losses
or 15
N distribution in the plants after foliar urea application (Witte et al., 2002). Lastly,
urease activities per unit protein were far higher in older leaves and mother tubers (Witte
et al., 2002). Conclusions from the work done by Witte et al. (2002) supports the theory
that urease serves not only as a critical enzyme in the hydrolysis of foliar applied urea but
for recycling N in plant tissue acting as an N source.
Page 33
13
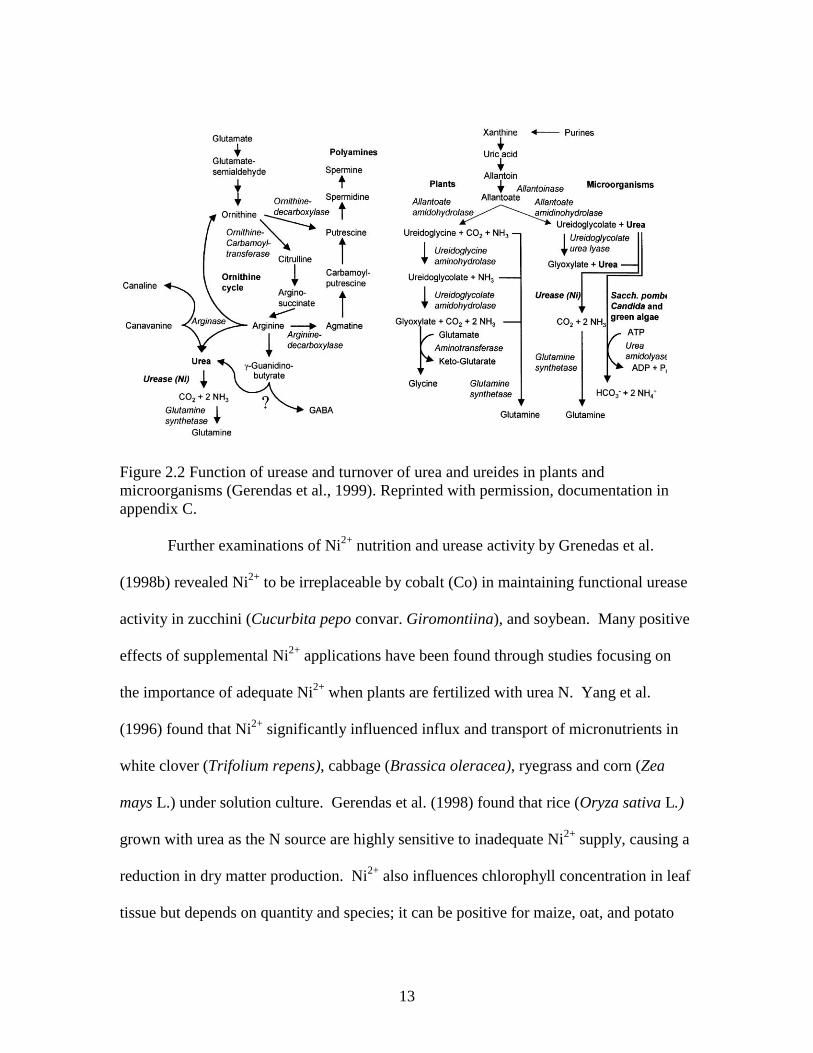
Figure 2.2 Function of urease and turnover of urea and ureides in plants and
microorganisms (Gerendas et al., 1999). Reprinted with permission, documentation in
appendix C.
Further examinations of Ni2+
nutrition and urease activity by Grenedas et al.
(1998b) revealed Ni2+
to be irreplaceable by cobalt (Co) in maintaining functional urease
activity in zucchini (Cucurbita pepo convar. Giromontiina), and soybean. Many positive
effects of supplemental Ni2+
applications have been found through studies focusing on
the importance of adequate Ni2+
when plants are fertilized with urea N. Yang et al.
(1996) found that Ni2+
significantly influenced influx and transport of micronutrients in
white clover (Trifolium repens), cabbage (Brassica oleracea), ryegrass and corn (Zea
mays L.) under solution culture. Gerendas et al. (1998) found that rice (Oryza sativa L.)
grown with urea as the N source are highly sensitive to inadequate Ni2+
supply, causing a
reduction in dry matter production. Ni2+
also influences chlorophyll concentration in leaf
tissue but depends on quantity and species; it can be positive for maize, oat, and potato
Page 34
14
and detrimental for barley and tomato (Moraes et al., 2009). Tan et al. (2000) found a
strong relationship with chlorophyll concentration when urea was amended with Ni2+
,
however ammonium nitrate nutrition with and without Ni2+
did not demonstrate any
increase in chlorophyll concentration. Additions of molybdenum (Mo) and Ni2+
together
increased urease activity greater than each element supplied separately in rice and found
that Mo and Ni2+
additions also increased dry matter production and when omitted
reduced chlorophyll and photosynthetic rate (Moraes et al., 2009).
Figure 2.3 Hydrolysis of urea by urease and model of urease activation (Witte, 2011).
Reprinted with permission, documentation in appendix C.
The increasing use of urea as N fertilizer calls for more detailed studies on plant
urea metabolism, particularly in cases where urea is applied as a foliar fertilizer or in
hydroponic systems with high purity chemicals, where Ni2+
supply may inadequate
(FAO, 2008). Without adequate Ni2+
levels, urease activity in plant tissue is hardly
Page 35
15
detectable which can lead to accumulation of urea in leaf tissue that can cause toxicity,
foliar burn, and physiological N deficiency (Krogmeier et al., 1991; Gerendas et al.,
1998a,b). Critical Ni2+
concentrations in leaf tissue vary between 25- 100 µg kg -1
depending on N source and species (Gerendas and Sattelmacher, 1997b; Gerendas and
Sattelmacher, 1999). Tan et al. (2000) found that urea assimilation, chlorophyll content,
and total leaf N in urea-fed tomato plants was significantly increased by Ni2+
supplementation indicating that N absorption increased. Gerendas and Sattelmacher
(1999) found that spring rape (Brassica napus L.) grown on Ni2+
-deficient urea based
media accumulated urea, while their amino acid content reduced, leading to an N
deficient phenotype and substantial growth repression. Nickel deficiency has been shown
to disrupt several metabolic pathways in pecan [Carya illinoinensis (Wangenh.) K.Koch]
leading to abnormality in growth including stunting of leaves known as mouse ear (Wood
et al., 2004a, 2004b; Bai et al., 2006). The importance of Ni2+
supplementation also was
determined under ammonium nitrate nutrition. Spring rape and lettuce (Lactuca sativa
L.) grown on ammonium nitrate as N source without Ni2+
supplementation accumulated
urea in leaf tissue due to a lack of urease activity hydrolyzing metabolically generated
urea (Gerendas and Sattelmacher, 1997b; Gerendas and Sattelmacher, 1999). Gerendas
and Sattelmacher (1997a) demonstrated similar results in six plants grown with urea as
the sole N source without Ni2+
supplementation, further demonstrating the importance of
Ni2+
under urea fertility.
Leaf tip burn was also exhibited with a urease negative phenocopy induced by
Ni2+
deprivation (Eskew et al., 1984) in which 2.5% of the dry weight of the necrotic leaf
Page 36
16
tip was urea. Tan et al. (2000) found that supplemental Ni2+
applications reduced the
symptom of urea toxicity in tomato seedlings. The symptoms of foliar toxicity was
caused by urea rather than ammonium, the urea assimilation product, for the following
reasons: as Ni2+
concentration increased urea N concentration decreased in leaf tissue
with accompanying loss in toxicity symptoms, which looked differently from ammonium
toxicity. Symptoms of urea toxicity and low N concentrations were exhibited in the urea
fed tomato plants without Ni2+
supplement, and the symptoms were reduced in the plants
with Ni2+
supplement at 0.01 mg L -1
(Tan et al., 2000). In addition to lowered foliar
toxicity the lowest concentration of leaf total N was detected in the urea-fed tomato
plants without Ni2+
supplement and urea assimilation increased, as the Ni2+
concentration
in the solution increased from 0 to 0.1 mg L-1
, but no further increase at 1 mg L-1
(Tan et
al., 2000). The changes of the concentrations of leaf urea N and NH4 N in the urea fed
plants indicate that a very rapid initial hydrolysis of urea is stimulated by the Ni2+
absorbed form the nutrient solution (Tan et al., 2000).
Nickel Nutrition
Nickel is an essential nutrient for plants, however the amount of Ni2+
required for
normal growth is very low. Dixon et al. (1975) first discovered the function of Ni2+
for
urease activation and Ni2+
was determined to be essential in higher plants by several
authors (Eskew et al., 1983; Brown et al., 1987; Marschner, 1995). Nickel deficiency
decreased the capacity for barley to develop viable seeds due to hindered embryo growth
(Brown et al., 1987a,b). In addition to seed development, Ni2+
is an important component
of many enzymes, where it coordinates either with S-ligands and O-ligands (urea), S-
Page 37
17
ligands (hydrogenase) or ligands of tetrapyrrol structure (Marschner, 1995). Nickel
deficient barley exhibited disrupted metabolism of amino acids, malate, and various
inorganic acids. Accumulation of urea in the foliage of soybean and cowpea due to Ni2+
deficiency, affected amino acid metabolism, reduced urease activity, induced metabolic
N deficiency, and affected amino acids, amides and urea cycle intermediates in several
non woody species [rye, wheat, soybean, rape, zucchini, and sunflower (Helianthus
annuus)] (Bai et al., 2006).
Nickel in the environment is commonly found in the form of nickelous ion Ni2+
.
Nickel is released into the environment from anthropogenic activities including metal
mining, smelting, burning of fossil fuels, vehicle emissions, and disposal of wastes,
fertilizer applications and organic manures (Chen et al., 2009). The hydrated form as Ni
(H2O)62+
is the most abundant form of Ni found in the soil solution (Yusuf et al., 2011).
Nickel uptake in plants is carried out through the root system via passive diffusion and
active uptake (Seregin and Kozhevnikova, 2006). Nickel uptake by plants depends on
the concentration of Ni2+
, plant metabolism, the acidity of soil or solution, the presence of
other metals and organic matter composition (Chen et al., 2009). Nickel uptake declines
at higher pH values of the soil solution due to the formation of less soluble complexes.
The uptake of heavy metals from the soil solution is strongly affected by calcium ions
(Marschner, 1995). Uptake of Ni2+
can be inhibited by Cu2+
and Zn2+
, which indicates
they may be absorbed by the same transport system (Chen et al., 2009). Nickel can also
enter the plant through the leaves. Sajwan et al. (1996) found that sunflower leaves
translocated 37% of the total foliar applied 63
Ni. Similar trends were found in oat,
Page 38
18
soybean, tomato and egg plant [Solanum melongena (L.)] leaves when sprayed with a
Ni2+
solution (Hirai et al., 1993). Nickel is transported through the plant via the
transpiration stream in the xylem, typically organic acids and amino acids act as chelators
to facilitate movement in the xylem (Yusuf et al., 2011). Without chelation, movement
of metal cations (Ni2+
) in the xylem would be retarded due to the cells walls possessing a
high cation exchange capacity (Yusuf et al., 2011). Nickel is a highly mobile trace
element that tends to accumulate in newly formed plant parts, as well as seeds (Yusuf et
al., 2011).
Nickel Toxicity
Plants rely on a range of transition (heavy) metals as essential micronutrients for
normal growth and development (Yusuf et al., 2011). These elements are essential for
most redox reactions which in turn are fundamental to higher functions within the plant.
Although necessary, these transition metals, when accumulated above a permissible limit
begin to interfere with cellular functions and inhibit normal plant metabolism causing
cellular injuries and in sometimes cases death (Yusuf et al., 2011). At least three events
that play a pivotal role in generating heavy metal toxicity in plants includes (1)
displacement of essential components in the biomolecules by the metal, (2) blocking of
essential biological functional group of the molecules and (3) modification of
enzyme/proteins, plasma membrane and or membrane transporters structure/function
(Ochiai, 1977). Pathways of Ni2+
toxicity in plants: (i) interference with other essential
metal ions and (ii) induction of oxidative stress.
Page 39
19
Nickel disrupts photosynthesis in isolated chloroplasts and in whole plants by
damaging the photosynthetic apparatus at almost every level of its organization including
destroying mesophyll and epidermal tissues and decreasing total chlorophyll content
(Chen et al., 2009). Nickel also damages the thylakoid membrane and chloroplast grana
structure (Chen et al., 2002). Nickel disrupts the light harvesting complex II and the
amounts of xanthopylls and caratenoids that can lead to oxidative stress due to the
increased production of free radicals (Chen at al., 2002). Enzymes such as superoxide
dismutase (SOD) and catalase (CAT) are metalloenzymes containing Fe, Cu2+
, Zn2+
, or
Mn2+
in their prosthetic groups (Chen et al., 2002). Excessive Ni2+
has been shown to
decrease the concentrations of these metals in plant tissue, which can lead to reductions
in the biosynthesis and activities of these enzymes. Increasing levels of oxidative stress
have been documented by excessive Ni2+
in plant tissue. Significant increases in
hydroxyl radicals, superoxide anions, nitric oxide and hydrogen peroxide have been
exhibited in plants (Chen et al., 2002). This increase in oxidative stress is not direct, but
by decreasing the number of antioxidant enzymes, reducing the plants capability to
scavenge radical oxygen species (ROS), leading to ROS accumulation and finally
oxidative stress (Chen et al., 2002).
Typically, excessive Ni2+
is a more common problem and has shown to affect
physiological and biochemical processes including decreased chlorophyll, lowered
photosynthetic and transpiration activities, reduced germination and impaired membrane
permeability associated with enhanced extracellular peroxidase activity (Ashraf et al.,
2011; Yang et al., 1996). Nickel toxicity symptoms include: mottling and necrosis of
Page 40
20
leaves and stunted growth of shoots and roots are due to nutrient imbalances and
deficiencies. Serpentine soils, commonly derived from ultramafic, or Mg2+
and Fe rich
rocks, such as peridotites, dunites and serpentinites contain high levels of Ni2+
, Fe, Mg2+
,
Co and Cr, but very low in calcium (Reeves et al., 1999). Plants found on these soils
tolerant toxic levels of Ni2+
through incorporation with organic acids include many
species exhibiting hyperaccumulation behavior where 10-30 mg-1
g-1
Ni2+
concentrations
are not uncommon (Marschner, 1995). In most plants Ni2+
content in vegetative organs is
between 1-10 μg g-1
dry weight (Marschner, 1995).
Warm-Season Turfgrasses
Golf course managers in the United States have historically established creeping
bentgrass (Agrostis stolonifera L.) for putting green surfaces in the transition zone.
However, managing quality creeping bentgrass putting greens in hot and humid climates
is challenging and costly, forcing turfgrass managers to look for alternatives (McCarty et
al., 2011). Therefore, other species have been introduced, evaluated, and installed to
replace cool-season turfgrass putting green surfaces including ultradwarf varieties of
bermudagrass, seashore paspalum, and fine leaf zoysiagrass varieties.
The ultradwarf bermudagrass varieties are vegetatively propagated turfgrasses
that provide finer leaf texture, greater density, and superior playing conditions than
‘Tifdwarf’ and other older dwarf varieties of bermudagrass. In addition, the hybrid
bermudagrasses are able to withstand high temperatures and drought events better than
creeping bentgrass (McCarty et al., 2011). The three most popular varieties of ultradwarf
bermudagrass in the transition zone and further south are ‘TifEagle’, ‘MiniVerde’ and
Page 41
21
‘Champion’. TifEagle was derived from a cobalt radiation induced mutant, whereas
Champion and MiniVerde were developed from field selections (Hanna and Elsner,
1999).
Although the ultradwarf varieties offer improved turf quality and playability than
older cultivars, they do present new management issues including thatch development
(Hollingsworth et al., 2005). Many studies have focused on putting green management of
hybrid bermudagrass putting greens including use of plant growth regulars (PGR) and N
rates (McCarty et al., 2011; McCullough et al., 2004; 2005; 2006; 2007 ), cultural
management, establishment, and mowing height (Guertal and Evans, 2006;
Hollingsworth et al., 2005) daily light requirements (Bunnell et al., 2005) and salinity
tolerance (Marcum and Pessarakli, 2006).
McCarty et al. (2011) determined that low doses of foliar applied trinexapac-ethyl
(TE) resulted in increased root mass of TifEagle agreeing with findings by McCullough
et al. (2004) under greenhouse conditions. In addition to increased root mass under PGR
programs, McCullough et al. (2006) found that applications of TE enhanced color and
nutrient retention in TifEagle rhizomes. During establishment, Guertal and Evans (2006)
found that TifEagle exhibited the greatest ground cover and shoot density at N rates of
3.4- 4.3 g N m-2
wk-1
and mowing heights greater than 3.2 mm. Findings by
Hollingsworth et al. (2005) found that the ultradwarf varieties may not require frequent,
deep vertical mowing for thatch control that previous dwarf bermudagrasses needed.
Bunnell et al. (2005) found that TifEagle bermudagrass requires a daily light integral of >
32.6 mol m-2
d-1
to maintain acceptable turfgrass quality and performance. In addition, it
Page 42
22
appears that afternoon shade can be extremely damaging to TifEagle growth (Bunnell et
al., 2005).
‘Diamond’ zoysiagrass [Zoysia matrella (L.) Merr.] is a highly rhizomatous and
stoloniferous vegetatively propagated selection from Texas A&M University that has
gained popularity on golf courses in the southern transition zone due to fine texture and
tolerance to shade, salt, and wear (Qian and Engelke, 1999; Qian et al., 2000; Stiglbauer
et al., 2009). Currently there are six golf courses in the Carolinas with Diamond
zoysiagrass putting greens (Personal communication, New Life Turf). Zoysiagrasses are
gaining popularity on golf courses due to their excellent wear tolerance, slow growth rate,
improved winter hardiness, and unique green color during the summer (McCarty, 2011).
Sladek et. al (2009) demonstrated that Diamond zoysiagrass exhibited excellent turf
quality under 50% shade, outperforming other zoysiagrass varieties.
A potential shortcoming of using Diamond zoysiagrass as putting greens is its
slow establishment rate. Patton et al. (2007) showed that Diamond zoysiagrass had the
slowest establishment rate of Z. matrella varieties due to the difference in partitioning of
dry matter to stems instead of leaves. Although slow to establish, Stiglbauer et al. (2009)
demonstrated that Diamond zoysiagrass can be established from sprigs in one growing
season and meet putting green expectations. Establishment time can be reduced
sprigging rates greater than 91 m-3
ha-1
and total N input between 20-35 g M-2
year-1
(Stiglbauer et al., 2009).
Seashore paspalum is a perennial warm-season turfgrass, and is native to tropical
and sub-tropical areas (Turgeon, 2011). Of the C4 turfgrasses used on golf courses,
Page 43
23
seashore paspalum is the most salt tolerant, and has potential to proliferate in the
turfgrass industry. Seashore paspalum is considered salinity tolerant (0-20 dsM-1
),
whereas the hybrid bermudagrasses are considered moderately tolerant at a range of (0-12
dsM-1
) (Carrow et al., 2001).
Maintenance of aesthetically pleasing and playable putting surfaces requires
extensive management and cultivation (Salaiz et al., 1995; Hartwiger et al., 2001;
Hollingsworth et al., 2005; McCarty et al., 2007; McCullough et al., 2007). A common
problem in putting green management is an accumulation of thatch. Thatch is a layer of
living and dead plant tissue that develops between turfgrass shoot tissue and the soil
surface (Turgeon, 2011). Comprising of stem, crown, and stolon tissue, thatch typically
contains high lignin contents and is resistant to decay (Beard, 1973). Thatch develops
when the accumulation rate of dead organic matter from the actively growing turf
exceeds the rate of decomposition (Beard, 1973). Problems associated with excessive
thatch include: increased disease and insect problems, localized dry spots, scalping, and
decreased heat, cold, and drought hardiness. Thatch management can be achieved
through several cultivation methods including, aeration and removal of cores, vertical
mowing (verticutting), and topdressing. Other chemical management techniques have
been evaluated to control thatch accumulation however, McCarty et al. (2007) found that
chemical management of thatch was not as effective as traditional cultivation and
topdressing combined.
Ball roll distance (BRD) is an important parameter measuring putting green
performance and can be influenced by: grass selection, mowing practices, fertilization,
Page 44
24
aeration, topdressing, brushing/grooming, PGR application, water management, and
surface rolling (McCarty, 2011). Koeritz and Stier (2009) found that BRD of creeping
bentgrass and velvet bentgrass was consistently reduced when height of cut (HOC)
increased. Application of N increases turf shoot growth, and results in wider and more
succulent leaf blades with slower BRD. Rolling golf putting greens is a maintenance
practice intended to provide a smooth and uniform putting surface with less resistance to
BRD (Hartwiger et al., 2001). Hartwiger et al. (2001) showed that benefits of rolling
were seen 48 hours after rolling treatments were applied. In addition to providing
increases in BRD, rolling can also be substituted for mowing. Throssel (1981) reported a
20-25 cm increase in BRD after mowing whereas rolling alone increased ball roll 13-20
cm. Cultural practices, including excessively low mowing heights, low N fertilization,
and reduced irrigation can increase the BRD on putting surfaces, but often conflict with
sound agronomic principles (Hartwiger, 2001). Prolonged management of BRD by
lowered HOC alone will result in undesirable putting green performance and increased
turfgrass stresses.
Due to the problem with relying on HOC alone to achieve increased BRD,
applications of plant growth regulators (PGR) are commonly used in putting green
management. Trinexapac-ethyl (TE) is a commonly used PGR in turfgrass management.
TE inhibits the plant’s ability to elongate by blocking gibberellic acid biosynthesis
(Baldwin, 2008). Typically, TE is utilized in turfgrass management to reduce mowing
frequency, and increase playability on putting surfaces. TE effectively inhibits GA20 to
GA1 production late in the mevalonic acid pathway suppressing shoot vertical growth.
Page 45
25
Research has shown that PGR use in turfgrass management enhances turfgrass quality,
playability and cultural practices: increases ball roll, reduces mowing frequency,
decreases weed pressure, enhances disease resistance, reduces turfgrass encroachment
and enhances turfgrass establishment (Baldwin, 2008). The benefit of increased BRD on
creeping bentgrass and ultradwarf bermudagrass putting surfaces by applications of TE
has been examined (McCullough et al., 2007; McCarty et al., 2011). The benefits of TE
applications on Diamond zoysiagrass are also documented. Qian and Engelke (1999)
hypothesized that improved plant carbohydrate reserves, improved root system, increased
canopy photosynthesis and enhanced turf quality can be achieved through applications of
TE under shade stress. Applications of TE on Diamond zoysiagrass reduced vertical
growth, leading to lowered clipping yields, and higher levels of nonstructural
carbohydrates leading to a potential increase in shade tolerance (Qian and Engelke,
1999). TE applications increased root length density, provided excellent TQ, reduced
vertical growth and did not reduce lateral re-growth and increased BRD compared to
control treatments (McCarty et al., 2011).
Foliar Fertilization
Fertilization is traditionally conducted by two delivery techniques: granular
application, targeting root absorption and liquid fertilization relying on leaf uptake of
nutrients. The development and use of foliar fertilization by the ChemLawn Corporation
in the 1960s revolutionized the home lawn care industry (McIver, 1990). Foliar
fertilization provides several advantages to the turfgrass manager including a quick color
response, easy modification of nutrient content, and the ability to mix with pesticides and
Page 46
26
micronutrients. (Totten et al., 2008). During a two year study, similar root masses were
recorded in creeping bentgrass and hybrid bermudagrass putting greens under 100%
foliar fertility and 100% granular fertility programs respectively (Liu et al., 2008). In
addition, Liu et al. (2008) found that foliar N fertilization didn’t cause reductions in root
growth.
The main downside to foliar fertilization is the inability to apply large amounts of
macronutrients (N, P, and K+) without the possibility of foliar burn and reduction in
turfgrass quality (Totten et al., 2008). To overcome this problem, turfgrass managers
commonly “spoon feed” low concentrations of N in short intervals by foliar sprays to
maintain uniform growth and reduce the risk of foliar injury. Uptake of foliar applied
nutrients depends greatly on several factors including but not limited to; chemical
composition and concentration of the nutrient applied, influence of wetting agents, age of
leaf tissue, and environmental conditions (Neumann, 1988). The most widely used foliar
N source for warm-season turfgrass and agriculture is urea [(NH2)2CO], due to its low
cost, high percentage of N (46% by mass), and completely soluble nature. Some studies
have suggested that urea is absorbed more rapidly by leaves than other N sources
presumably because non-polar uncharged molecular structures, such as urea, diffuse
through the cuticle more readily (Wittwer et al., 1959).
Nuemann (1988) reported that an increase in the concentration of foliar applied K+
induces a slight decrease in uptake expressed as a percentage of applied amount, but a
large increase in uptake in terms of weight of K+. Wetting agents and leaf age also
influence the uptake of foliar applied nutrients due to the reduction in contact angle of the
Page 47
27
solution applied and by the accumulation of total wax and lowered metabolism of older
leaves. Lastly, environmental factors also influence the ability of ion transport across the
cuticle and into leaf mesophyll. Schreiber (2001) reported that an increase in humidity
from 2 to 100% resulted in an increase of cuticular water flow by a factor between 2 and
3 which would presumably influence the rate of which foliar applied taken up by the
plant.
There are two major hypotheses on the pathway of uptake of foliar absorbed
chemicals; 1) uptake through stomata or 2) across the plant cuticle, facilitated by
hydrophilic pores in the cuticle and/or through cracks in the cuticular wax. Eichert and
Goldbach (2008) reported through the use of confocal microscopy and fluorescent tracers
that penetration of solutes via stomata can occur by diffusion along the pore surfaces
without infiltration. Numerous studies support the role of stomata in the foliar uptake of
solutes (Fernandez and Eichert, 2009). According to the solubility and mobility model
of cuticular penetration, diffusion of charged substances like organic ionic compounds
and inorganic ions across the lipophilic transport barrier of cuticles should not be
possible, however numerous studies have quantified uptake of such solutes over the past
50 years (Riederer and Muller, 2006). Recent research examining the uptake of charged
organic molecules has convincingly shown that polar and charged compounds in fact can
penetrate isolated astomatous cuticles as well as intact stomatous leaf surfaces (Riederer
and Muller, 2006). Numerous studies have concluded that ion uptake and movement
through this means of absorption relies on polar pores traversing the cutin polymer and
the waxy transport barrier.
Page 48
28
Tan et al. (1999) showed that 15
N assimilation was quickest in urea-fed plants,
and after 48 hours, assimilation in the whole plant was up to 76.9 % in urea fed plants but
only 33.7% and 43% in the nitrate and ammonium applied plants respectively. Urea is an
appropriate foliar N source due to its low ability to injure foliage, its rapid absorption and
translocation, fast assimilation and the wide and suitable range of solution pH (Tan et al.,
1999). Stiegler et al. (2011) found that foliar applied urea provided an efficient mode of
N delivery with minimal losses due to volatilization. Due to these properties foliar
fertilization of urea N accounts for a large portion of total fertility programs on golf
courses and sports fields each year. Through the use of foliar fertilization, play on the
golf course putting greens can commence shortly after application whereas granular
fertilizers would hinder aesthetics and playability.
Slow release or granular fertilizer applications on the putting surface requires
watering in, incorporation after cultivation (aeration, slicing) or long term persistence on
the putting surface until absorption/breakdown, which would reduce putting green quality
(Schlossberg and Schmidt, 2007). In addition to its obvious playability factor on golf
courses, foliar fertilization provides many benefits, including reduced leaching, quick
absorption, and more uniform growth. Foliar fertility also allows managers tank mix
with other pesticides, correct nutrient deficiencies quickly and achieve increased
uniformity of application. Totten et al. (2008) found that a fertility program utilizing
both foliar and granular fertilization was superior compared to relying on one method
exclusively on creeping bentgrass putting greens. Due to these facts, a combination of
granular and foliar fertilizations has been adopted by many turfgrass managers depending
Page 49
29
on the season and turf growth conditions (Liu et al., 2008). Lastly, absorption of foliar
applications of nutrients are not hindered by soil problems that can lead to reduced levels
of uptake (biological implications, enzyme activities, leaching, water content, binding,
etc.).
However, diverse responses have been recorded in literature examining the
recovery of 15
N among three N sources (NO3-, NH4
+, [(NH2)2CO]. Picchioni and
Quiroga-Garza (1999) found that recovery of soluble ammonium nitrate and ammonium
sulfate was higher than urea in ‘TifGreen’ bermudagrass. Total N recovered after
fertilization for ammonium sulfate and ammonium nitrate averaged 78% of the applied
N, whereas urea only averaged 66%. This finding is inconsistent with the suggestion that
foliar urea uptake is rapid, and less likely to leach. In addition, under suboptimal
growing conditions (decreasing photoperiod, reduced temperature) losses of foliar
applied fertilized increased to 46%-62% of the applied N (Picchinoi and Quiroga-Garza,
1999). Different results were found by Bowman and Paul (1992), where perennial
ryegrass fertilized with foliar urea, ammonium, and nitrate all exhibited similar uptake.
Page 50
30
CHAPTER III
FOLIAR AND ROOT UREA-N FERTILITY OF FIVE WARM-SEASON
TURFGRASSES UNDER SALINITY STRESS
Introduction
Commonly, fertilization of turfgrasses is achieved in two very different ways,
granular and foliar applications. Granular fertilization is a common practice in home
lawn and lower maintenance turfgrass areas. Granular fertilization targets root absorption
and allows turfgrass managers to apply greater amounts of each nutrient than foliar
fertilization at one given event and typically have greater longevities. Foliar fertilization
is typically practiced on intensively managed turfgrass areas including sports fields and
golf courses (McCarty, 2011). Foliar fertilization utilizes soluble mineral nutrient
sources applied to the leaf tissue of target plants. This method of fertilization gives
turfgrass managers the ability to quickly address nutrient deficiencies with precision and
the ability to tank mix fertilizers and pesticides together.
Water quality and use has become an important issue in turfgrass management.
Turfgrass managers in coastal areas have to deal with water quality issues. In addition, in
arid environments, where water use mandates and effluent water are being utilized to
conserve water use, turfgrass managers need management techniques to deal with salinity
stress and poor water quality for irrigation.
Proper turfgrass selection is of paramount importance when managing golf
courses and sports fields under environmental stresses. Five warm-season turfgrasses
examined in this study: three ultradwarf bermudagrass cultivars TifEagle, Champion, and
Page 51
31
MiniVerde, Diamond zoysiagrass, and Seadwarf seashore paspalum. These cultivars
were chosen based upon their salinity tolerance, turf quality, fine texture, and overall
performance in many turfgrass scenarios.
Due to the popularity of urea as an N source in turfgrass management, this study
was conducted to determine if the delivery method significantly influenced turfgrass
performance and physiology while under salinity stress. The objectives of this project
were 1) examine the nutrient status of five popular warm-season putting green turfgrass
species in response to salinity stress, 2) identify physiological changes in each species in
response to salinity stress and 3) determine the “best” delivery method of urea N (foliar,
or root).
Materials and Methods
Plant Materials
Experiments were conducted at the Clemson University Greenhouse Complex,
Clemson SC, from July-October 2009 (Run 1) and July-October 2010 (Run 2). Twenty
15.24 cm (2009) and 20.32 cm (2010) plugs of TifEagle, Champion, MiniVerde
ultradwarf bermudagrasses, Seadwarf seashore paspalum, and Diamond zoysiagrass
were harvested and washed free of soil from the research plots at Clemson and
transplanted into 25cm x 45cm polyvinyl chloride lysimeters containing 85%:15% (v:v)
sand:peat mixture to USGA specifications and 10.16 cm of gravel for drainage (USGA
Green Section Staff, 1993). Soil chemical properties are displayed in Table 3.1. The
turfgrass samples were established and acclimatized in the greenhouse for two months
before treatments commenced.
Page 52
32
Plant Culture and Treatment Procedures
During the grow-in, fertilization was applied with 10N-1.3P-4.2K and 5N-0P-
5.8K liquid fertilizers (Progressive Turf Fertilizer LLC., Ball Ground, GA) @ 14.65 kg-1
N ha with a CO2 pressurized backpack sprayer with a TeeJet 8002 VS nozzle calibrated
to deliver 560 L-1
ha twice and once at 9.75 kg N ha
-1 to mimic nutrient status of a typical
turfgrass putting green. The lysimeters were mowed twice weekly at 0.3175 cm with
clippings removed. Treatments commenced in July and continued with weekly foliar and
root applied urea N resulting in a total of 1.09 kg of total N for the 12 week study.
Urea N Treatments
For the foliar treatment 18.91 grams of urea N was dissolved in 500 ml of water
and 273. 7 ml was sprayed over the lysimeters with a CO2 pressurized backpack sprayer
with a TeeJet 8002 VS nozzle. For the root application of urea N 1.95 grams of urea
(Fisher Scientific) was dissolved in 1000 ml of water. Each lysimeter received 20 ml of
the urea solution delivered via 60 ml syringe into the root zone to ensure that no fertilizer
was absorbed by the foliage. Hoagland’s solution derived from Hoagland and Arnon
(1950) was applied twice (6 and 10 weeks) during the duration of the study (Table 3.2)
Saline and Fresh Water Irrigation
Salinity irrigation and fresh water irrigation volumes were obtained
gravimetrically. Saline irrigation water was comprised of 160 grams NaCl (Fisher
Scientific) dissolved in 20 L of water delivering 8,000 ppm NaCl. 25% of the available
volume in the lysimeter was flushed using saline or fresh irrigation at a volume of 3.295
L at the beginning of the experiment.
Page 53
33
Data Collection, Processing, Analysis
Parameters measured included: turf quality (TQ), leaf tissue nutrient analysis,
electrolyte leakage (EL), and proline accumulation. Visual TQ was rated weekly based
on color, density, texture, and uniformity of the turfgrass surface. Quality was evaluated
from 1 to 9, 1 = brown, dead turfgrass, 6 = minimal acceptable turfgrass, 9 = ideal green,
healthy turfgrass.
Tissue Nutrient Concentration Assay
Tissue N analysis was done by combustion utilizing a LECO FP528 N
combustion analyzer (St. Joseph, MI and mineral analysis of leaf tissue for P, K+, Ca
2+,
Mg2+
, Zn2+
, Mn2+
, Cu2+
, Fe, and S by HNO3/H2O2 digestion, then ICP. For leaf tissue
Na+ content, Weigh 1.0 g sample into a 150 mL beaker. Add 100 mL H2O and place on
stirrer for 30 min. Filter mixture with metal filter and pour filtrate into a large test tube.
Analysis was conducted using ICP-mass spectrometry.
Electrolyte Leakage Assay
Leaf electrolyte leakage (EL) was measured to evaluate cell membrane stability.
For EL analysis, 0.2-0.5 g fresh leaf tissue was harvested from each lysimeter and put in
a 50 ml centrifuge tube and kept on ice. Next, Millipore water was used to rinse the
clippings to ensure excess salt and fertilizer residue was removed. Following the rinse,
20 milliliters of Millipore water was added weighed and the tubes were incubated for 16-
24 hours at 4 ° C. The initial conductance (Ci) was recorded using a conductance meter
(AB30, Fisher Scientific, USA.) after incubation. Next, the leaf tissue was autoclaved for
50 minutes. Millipore water was added up to the original volume before the autoclave
Page 54
34
and the conductance of the incubated solution and the killed tissue was taken (Cmax).
Relative EL was calculated as (Ci/Cmax) *100.
Proline Content Assay
Proline was extracted from 100 mg of leaf tissue and determined
spectrophotometrically at 520 nm according to Bates (1973).
Data Analysis
All data were analyzed by JMP 9.0 (SAS Institute Cary, NC). Means were
separated by Fisher’s LSD. There appeared to be unusually large variation in the data.
To determine if the large variation could be attributed to a few unusual observations, an
analysis of the analysis model residuals was preformed. A box-plot (Tukey, Exploratory
Data Analysis, 1971) was constructed from the residuals and any residuals that were
unusually large or small were indicated on the box-plot as outliers. The outliers were
investigated to ensure they were not simply data entry errors. If the data were accurate
and an outlier, the observations associated with the outlier residuals were removed from
the data set, and the analysis repeated. If the analysis produced similar results, the large
variation was considered simply part of the experiment and not due to a few unusual
observations. If the analysis results changed, then the removal of the unusual
observations was considered and important step in finding the true impact
of the experimental factors.
Page 55
35
Results
Turf Quality
Turf quality (TQ) was influenced by the main effects of irrigation regime and
genotype. Overall averages of TQ were 5.98 and 7.05 for saline and fresh water
irrigation respectively. Saline irrigation reduced the mean TQ to under acceptable levels,
whereas overall TQ means for fresh water remained above 6. The main effect of
genotype exhibited differences in turf quality with Diamond and ‘Mini-Verde’ exhibiting
the highest overall means at 6.87 and 6.71 respectively. Seadwarf and TifEagle exhibited
similar turf qualities at 6.47 and 6.49 respectively. Champion had the lowest TQ mean at
6.04. Over the course of the twelve week study TQ fluctuated due to salinity stress,
genotype, and rating date. Fluctuations in TQ over the course of the study can be
visualized in Figure 3.2 which displays TQ over 12 rating dates as influenced by
genotype under salinity stress and Figure 3.1 under fresh water irrigation. Figure 3.3 also
demonstrates the reduction in TQ caused by salinity stress at the conclusion of the study.
N concentration
At six weeks, N content in the leaf tissue was not affected by any main effect;
however, there was a significant increase in N content in 2010 of the study (2.14 and 2.46
%DW respectively) (Table 3.3). A significant fertilizer regime*genotype interaction
occurred. Root applications of urea N resulted in significantly higher total N
concentration in Diamond and MiniVerde, whereas Seadwarf responded with higher N
concentrations from foliar applications. TifEagle and Champion didn’t exhibit a
difference in N concentration for either fertility regime. Under salinity stress, Seadwarf
Page 56
36
benefited from foliar fertilization which resulted in significantly higher concentrations of
N in the leaf tissue at 2.40 % DW compared to 1.96% DW under root applications of
urea. This was the only genotype that benefited from foliar fertilization under salinity
stress. MiniVerde and TifEagle exhibited significantly higher N concentrations through
root applications of urea under salinity stress, while the other genotypes did not show a
preference for either fertility regime. Under fresh water irrigation, Diamond and
MiniVerde displayed a greater N concentration in leaf tissue under root applications of
urea nitrogen. Under fresh water irrigation, TifEagle was the only genotype at six weeks
to display greater N concentration in leaf tissue under foliar fertility while Seadwarf and
Champion didn’t display change in N concentration under either fertility regime.
After 12 weeks, the main effect of irrigation regime was significant. Resulting in
significantly higher leaf tissue N concentration, 2.63 % DW under fresh water treatments,
compared to 2.44 % DW under salinity stress. At the conclusion of the study run 2
displayed greater overall N concentrations in leaf tissue (2.66%DW) than run 1 at (2.43
% DW). At 12 weeks an irrigation regime*genotype interaction was significant.
Reduced N concentrations in leaf tissue were displayed in Diamond and Seadwarf under
salinity stress, while the three ultradwarf bermudagrasses had similar N concentrations
under either irrigation regime. Under fresh water treatments, Diamond and MiniVerde
displayed significantly higher N concentrations under root applications of urea N.
TifEagle was the only genotype to exhibit higher N leaf tissue concentration under foliar
fertility and fresh water irrigation. Under salinity stress, Seadwarf was the only genotype
to display higher N concentrations in leaf tissue from foliar applications of urea N. All
Page 57
37
other genotypes exhibited similar N concentrations under salinity stress regardless of
fertility regime. There was a significant irrigation regime*run interaction, indicating that
in run 2 fresh water irrigation resulted in higher tissue N concentrations than salinity
irrigation water. In run 1, both fresh and saline irrigation water resulted in similar N
concentrations in leaf tissue. Lastly, in run 1, overall tissue N concentration was not
significantly different in both regimes. However, in run 2, there was a significant
difference in treatment effects on tissue N with root applications of urea resulted in
significantly higher leaf tissue N concentrations.
Phosphorus Concentration
At six weeks, phosphorus (P) concentrations within the leaf tissue were affected
significantly by irrigation regime, with fresh water irrigation resulting in higher P levels
(Table 3.4). Fresh water irrigation resulted in 0.26 % DW, whereas saline irrigation
reduced leaf P concentrations to 0.23% DW. Upon closer examination, an irrigation
regime*genotype interaction occurred. All genotypes exhibited higher P levels under
fresh water irrigation except Champion and TifEagle which didn’t show a difference in P
concentration under either irrigation regime. An irrigation regime*fertilizer
regime*genotype interaction was also significant. Under salinity irrigation, the only
genotype to display greater P concentrations from foliar applications of urea was
Seadwarf with a significant increase in P content from 0.18 % DW under root
applications of urea to 0.26% DW for foliar applications. However, under fresh water
irrigation, Seadwarf didn’t exhibit a preference for either fertility regime, showing similar
concentrations under each regime. TifEagle displayed higher P concentration in leaf
Page 58
38
tissue under foliar applications of urea under fresh water irrigation, while Diamond
demonstrated greater P concentrations under root fertility.
At 12 weeks there was a significant main effect of irrigation regime with a
decrease in P leaf tissue content under salinity stress from 0.29 % DW to 0.24 % DW.
However, an irrigation regime*genotype interaction was significant with fresh water
irrigation resulting in higher leaf P concentration in all genotypes except Champion.
Similar to the six week results of the study, an irrigation*fertilizer regime*genotype
interaction was exhibited. The only genotype to benefit from foliar urea N applications
under salinity stress was Seadwarf that displayed an increase in P content over root
applications (0.20 %DW, and 0.26% DW respectively). At the conclusion of the study,
data displayed that during run 2 root applications of urea resulted in significantly higher
levels of P in the leaf tissue, whereas in run 1 the overall P content was not significantly
different for either fertility regime.
Potassium Concentration
At the halfway point of the study, there was a significant irrigation regime main
effect on K+ concentration in the leaf tissue. Fresh water irrigation resulted in
significantly higher levels of K+ than salinity irrigation, 1.52 % DW and 1.16% DW
respectively (Table 3.5). Genotype effects and an interaction of genotype*irrigation
regime were also significant. At six weeks, TifEagle displayed the highest K+
concentration in the leaf tissue. Champion exhibited the greatest decrease in K+ due to
salinity stress at the halfway point of the study. K+ concentration in Champion leaf tissue
was 1.89 % DW under fresh water irrigation, whereas saline irrigation resulted in K+
Page 59
39
concentrations of less than 1 % DW. All other genotypes displayed similar K+
concentrations in leaf tissue under both irrigation regimes.
At 12 weeks, an irrigation main effect was exhibited with saline irrigation
significantly reducing overall tissue K+ concentration in leaf tissue from 1.72 % DW to
1.15 % K+ DW. A significant genotype main effect was exhibited with TifEagle and
Champion displaying the most elevated levels of K+ in the leaf tissue, while MiniVerde,
Diamond and Seadwarf all had similar K+ concentrations in leaf tissue (Table 3.5). A
highly significant irrigation regime*genotype interaction was exhibited. Under saline
irrigation treatments levels of K+ in leaf tissue significantly reduced in Champion,
Diamond, MiniVerde and Seadwarf. The largest decrease in K+ concentration in leaf
tissue was displayed in Champion with 2.38 %DW under control treatments, and less
than 1 % DW under salinity stress. TifEagle was the only genotype that didn’t exhibit
significantly decreased K+ concentrations under salinity stress (1.79 and 1.50 % DW
respectively for fresh and saline irrigation water). An irrigation regime*fertilizer
regime*genotype interaction was significant. Under fresh water irrigation, all genotypes
displayed similar K+ leaf concentrations under each fertilizer regime. However, under
salinity stress, MiniVerde displayed higher K+ concentration under root applications of
urea N, while TifEagle exhibited higher K+ concentration in leaf tissue under foliar
fertility. All other genotypes displayed similar leaf K+ concentrations under salinity
irrigation regardless of fertility regime.
Sodium Concentration
Page 60
40
At six weeks, irrigation regime, fertility regime, and genotype were significant in
the Na+ content of the leaf tissue (Table 3.8). Under salinity irrigation, Na
+ levels in the
leaf tissue reached 1.82 %, whereas fresh water irrigation only accumulated 0.26 % DW
Na+. Root applications of urea N resulted in higher Na
+ concentrations at 1.10 % DW in
leaf tissue compared to foliar treatments at 0.99 % DW. A highly significant interaction
of irrigation regime*genotype occurred (Figure 3.5). A highly significant irrigation
regime*fertilizer regime*genotype interaction was exhibited. Under salinity stress,
Diamond and TifEagle displayed significantly higher Na+ concentrations in leaf tissue
under root applications of urea N. Champion and MiniVerde didn’t show a difference in
Na+ content for either fertility regime under salinity stress. Seadwarf exhibited
significantly greater Na+ concentration in leaf tissue under foliar fertility than root
fertilization at 1.92 and 1.21 % Na+ respectively. All genotypes exhibited similar Na
+
concentrations in leaf tissue under fresh water irrigation regardless of the fertility regime.
Overall levels of Na+ concentration in leaf tissue were higher in run 2 at 1.10 % DW than
run 1 at 0.98 % DW.
At 12 weeks, there were significant main effects for irrigation regime, fertilizer
regime, and cultivar in the Na+ concentration of the leaf tissue (Table 3.8). An increase
in Na+ concentration in leaf tissue under saline irrigation accounted for an increase of
625% (0.32 % DW to 2.0 % DW). Under root urea N fertility plants exhibited higher
Na+ contents compared to foliar urea fertility at 1.29 % DW and 1.03 % DW respectively.
Significant interactions were also exhibited. A highly significant irrigation
regime*fertilizer regime occurred. Under saline irrigation, root applications of urea N
Page 61
41
resulted in significantly higher Na2+
concentration in leaf tissue than foliar applications
(2.22 % and 1.81 %). Overall levels of Na+ concentration under control conditions did
not differ between fertility regimes. Under salinity stress, Diamond exhibited the highest
levels of Na2+
in leaf tissue at 2.46 % DW. Secondly, a fertility regime*genotype
interaction significantly affected the Na+ concentration of leaf tissue. Root applications
of urea N resulted in significantly higher Na2+
concentrations in Champion, Diamond,
and TifEagle while ‘Seadwarf was the only genotype to exhibit higher Na+ concentration
in leaf tissue under the foliar fertility regime. Lastly, a highly significant irrigation
regime*fertilizer regime*genotype occurred. Under fresh water irrigation, all genotypes
regardless of fertility regime, exhibited similar Na+ concentrations in the leaf tissue.
However, under salinity stress, Champion, Diamond and TifEagle exhibited greater Na+
concentrations under root applications of urea, while ‘Seashore’ exhibited higher Na+
concentration under foliar fertility.
Calcium Concentration
Overall calcium levels in the leaf tissue were significantly reduced by saline
irrigation water treatments. Under fresh water irrigation Ca2+
concentration in leaf tissue
was 0.27% DW, and was reduced to 0.19% DW under salinity stress. In run 2
(0.24%DW), overall calcium concentration in leaf tissue was greater than run 1
(0.22%DW). An irrigation regime*fertilizer regime*genotype interaction was
significant. Under salinity irrigation, Seadwarf exhibited significantly higher Ca2+
concentration in leaf tissue under foliar urea N fertility while all other genotypes
demonstrated similar concentrations under either fertility regime.
Page 62
42
At the conclusion of the study, overall levels of Ca2+
in the leaf tissue were
reduced by saline irrigation, from 0.30 % to 0.18 % Ca2+
/DW. An irrigation
regime*genotype interaction was significant. All genotypes displayed reduced Ca2+
concentrations in leaf tissue under salinity stress. Secondly, a fertilizer regime*genotype
interaction was exhibited. Foliar applications of urea N resulted in higher Ca2+
concentration in leaf tissue of TifEagle, all other genotypes displayed similar
concentrations under either fertility regime. Overall Ca2+
levels in leaf tissue were higher
in run 2 than run 1, 0.29 and 0.19 %DW correspondingly.
Proline Accumulation
At six weeks, there was a significant irrigation regime treatment effect on proline
accumulation. Overall proline accumulation increased from 0.55 µg-1
g FW to 2.98 µg-1
g
FW under fresh and saline irrigation regimes respectively (Table 3.7). An interaction of
irrigation regime*fertilizer regime*genotype displayed that both fertility regimes led to
similar proline accumulations across all genotypes under fresh water irrigation.
However, under salinity stress, Diamond accumulated the most proline of all genotypes
under root applications while Seadwarf accumulated higher proline amounts with foliar
applications of urea N.
At the conclusion of the study, an irrigation main effect was displayed with
salinity stress increasing overall proline levels from 1.07 µg-1
g FW in fresh water
treatments to 6.18 µg-1
g FW in saline irrigation treatments. A significant genotype main
effect was exhibited at 12 weeks with Champion accumulating the highest levels of
proline at 4.92 µg-1
g FW (Table 3.7). An irrigation regime*fertilizer regime was
Page 63
43
significant at 12 weeks. Under salinity irrigation, plants receiving root applications of
urea accumulated more proline at 6.64 µg-1
g FW than plants receiving foliar fertility at
5.02 µg-1
g FW. An irrigation regime*genotype interaction was significant at the
conclusion of the study. All genotypes exhibited significantly higher levels of proline
under salinity stress, with Champion displaying the greatest difference in accumulation
from > 1 µg-1
g FW under fresh water irrigation to over 9 µg-1
g FW under salinity stress.
At 9.27 µg-1
g FW, Champion accumulated significantly higher proline than any other
genotype under salinity stress. A fertilizer regime*genotype interaction was significant.
Diamond MiniVerde and TifEagle all displayed higher proline accumulation under root
fertility, and Seadwarf accumulating significantly higher proline under foliar fertility
treatments. Lastly, an irrigation regime*fertilizer regime*genotype interaction was
displayed. Under fresh water irrigation treatments, all combinations of genotypes and
fertility regimes resulted in similar proline accumulations (Table 3.7). However, this
trend was not observed under salinity stress, where a diverse range of responses was
exhibited. Diamond MiniVerde and TifEagle accumulated higher levels of proline under
root applications of urea N. The most salt tolerant genotype, Seadwarf was the only grass
to exhibit higher proline accumulation under foliar applications of N. Overall levels of
proline increased from 2.27 µg-1
g FW in run 1 to 4.53 µg-1
g FW in run 2. A relationship
was exhibited between Na+ concentration in leaf tissue and the concentration of proline.
Each genotype was analyzed at the conclusion of the study and regression analyses were
conducted (Figures 3.7-3.12). Significant relationships were exhibited when increasing
Na+ concentration in leaf tissue resulted in elevated proline levels. Similar increases in
Page 64
44
Na+ concentration and proline accumulation were exhibited in barley leaves by Buhl and
Stewart (1983).
Electrolyte Leakage
At six weeks of the study saline irrigation resulted in a 2 fold increase in EL from
17.51 % in fresh water treatments to 33.56 % under salinity stress (Table 3.6). An
irrigation regime*genotype interaction was significant with all genotypes except TifEagle
displaying higher EL levels under salinity stress. A significant fertilizer
regime*genotype interaction was displayed. Foliar applications resulted in higher EL
levels in MiniVerde and Seadwarf whereas TifEagle displayed higher EL levels under the
root fertility regime. Lastly, an irrigation regime*fertilizer regime*genotype was
exhibited. Under fresh water irrigation treatments, Champion displayed higher EL levels
under foliar fertilization, while TifEagle exhibited higher EL under root fertility of urea
N. Under saline irrigation treatments, Diamond, MinVerde, and Seadwarf displayed
higher EL levels under foliar fertility of urea N. TifEagle was the only genotype under
salinity stress that exhibited lower EL levels under foliar fertility treatments, a decrease
from 33.99% to 20.31%.
At the conclusion of the study, there was a highly significant effect of EL due to
the irrigation regime. Saline irrigation significantly increased overall EL to 39.59% from
18.59% in fresh irrigation water. Irrigation regime*genotype interactions displayed that
under salinity irrigation, Champion exhibited significantly higher levels of EL than
TifEagle (47.77% and 36.47% respectively). Under fresh water irrigation, all genotypes
displayed similar EL levels. An irrigation regime*fertilizer regime*genotype interaction
Page 65
45
was significant. Under salinity stress Diamond exhibited significantly higher EL
readings with root applications of urea. MiniVerde displayed higher EL readings under
foliar applications of urea N (48.69% and 37.13% respectively). Champion, Seadwarf
and TifEagle had similar EL readings under either fertility regime. The data from run 2
had overall significantly higher EL at 33.90% compared to run 1 at 23.85%.
Discussion
At six weeks of the study, saline stress had no effect on urea N uptake which
disagrees with observations by Aslam et al. (1984) who observed reduced N uptake of
barley under salinity stress within hours of exposure. A diverse response among
genotypes was displayed under various irrigation and fertility regimes. The only
genotype to display greater N concentrations from foliar fertility under salinity stress was
Seadwarf. Under salinity stress, Seadwarf displayed a 22% increase N concentration by
DW in leaf tissue with foliar urea fertility. The opposite response was exhibited for
MiniVerde and TifEagle under salinity stress, where root applications of urea resulted in
higher N concentrations in leaf tissue. This trend was not observed for the fresh water
treatments where TifEagle was the only genotype at six weeks to display higher N
concentration under foliar fertility, while Diamond and MiniVerde displayed higher N
concentration in leaf tissue under root applications. Seadwarf and Champion didn’t
display change in N concentrations under either fertility regime.
At the conclusion of the study, saline irrigation significantly reduced overall leaf
tissue N concentration. This result agrees with findings by Bowman et al. (2006) in tall
fescue, Hawkins et al. (1993) in wheat, Pessarakli and Tucker (1988) and Flores et al.
Page 66
46
(2001) in tomato that showed reduced N uptake under salinity stress. There also were
diverse results among genotype and irrigation regimes. At the conclusion of the study,
Diamond and Seadwarf displayed lower N concentrations in their leaf tissue due to
salinity irrigation, while the ultradwarf bermudagrasses exhibited similar N levels under
either regime. Although Diamond and Seadwarf are considered the most salinity tolerant
of the genotypes tested, their N concentrations were significantly reduced by saline
irrigation, unlike the ultradwarf bermudagrasses genotypes. At 2.39 % DW and 2.28%
DW in Diamond and Seadwarf’ respectively, the N concentrations under salinity are
within the commonly considered sufficiency range for turfgrasses (Carrow et al., 2001).
Overall concentrations of P in leaf tissue were reduced at the six weeks, from 0.27
% DW in fresh water to 0.24% DW in saline treatments. At six weeks, P levels were
affected significantly by salinity and all genotypes exhibited higher P concentrations
under fresh water irrigation with the exception of Champion and TifEagle, which
displayed similar levels under both irrigation regimes. However, at the end of the
study, only Champion exhibited the same P levels in leaf tissue under either irrigation
regime. At six weeks, and also at the conclusion of the study, Seadwarf, the most
salinity tolerant genotype tested benefited from foliar applications of urea N under
salinity by exhibiting higher P concentrations in leaf tissue at 0.26%DW. Under root
fertility treatments, the P concentration of leaf tissue in Seadwarf fell to 0.18% DW,
which is considered deficient by Carrow et al. (2001). However, under fresh water
irrigation, Seadwarf didn’t exhibit a preference for either fertility regime, showing
similar concentration in leaf tissue under each regime. TifEagle displayed greater P
Page 67
47
concentration under foliar applications of urea under fresh water irrigation, while
Diamond demonstrated greater P levels under root fertility.
Salinity stress and P nutrition of plants is a complex interaction dependent on
several factors including: genotype, plant age, and composition and level of salinity
(Grattan and Grieve, 1999). This is evident in the results from this study, with many
conclusions being drawn from salinity stress and nutritional status of each genotype
examined. Champion exhibited similar P concentration in leaf tissue under either
irrigation regime while all other genotypes P levels were reduced under salinity stress.
A reduction of P concentrations in plant tissue is common under salinity stress;
however, there wasn’t evidence of P deficiency in any of the genotypes tested.
Maintaining adequate levels of K+ is critical for plant survival in saline
environments (Grattan and Grieve, 1999). At the midpoint of the study overall K+
concentrations within leaf tissue decreased to 1.18 % DW due to saline irrigation, which
is below the common sufficiency range in turfgrasses. Of all genotypes tested,
concentrations of K+ in the leaf tissue of Champion were reduced in the greatest amount
by saline irrigation at the conclusion of the study. Under fresh water irrigation
treatments, concentrations of K+ in Champion were sufficient in leaf tissue at 2.38
%DW, whereas saline irrigation reduced K+ concentrations less than 1 % DW. This
response was also seen at six weeks in the study. Under salinity stress, levels of K+ in
leaf tissue were significantly reduced in Champion, Diamond, MiniVerde, and
Seadwarf. TifEagle was the only genotype not to exhibit reduced K+ concentrations
under salinity treatments at 12 weeks.
Page 68
48
Potassium is an inorganic solute that is involved in osmoregulation by enhancing
water transport in the xylem and maintaining high cell turgor pressure (Carrow et al.,
2001). A decrease in K+ uptake under salinity stress can lead to higher concentrations of
Na+ in the vacuole. leading to decreases in critical K
+ metabolic roles. An increased
level of Na+ not only interferes with K
+ uptake by the roots, but it may also disrupt the
integrity of root membranes and alter their selectivity (Grattan and Grieve, 1999).
Turfgrasses grown in salt affected areas are commonly supplemented with
additional Ca2+
fertility. However, with elevated Na+ or Ca
2+ levels, turfgrasses often
require K+ in greater quantities than similar non-salt affected site, particularly when
frequent leaching of salts is conducted (Carrow et al., 2001). Ca2+
influences the K+/Na
+
selectivity by shifting the uptake ratio in favor of K+ at the expense of Na
+ due to
enhanced membrane integrity and reduction of K+ leakage from cells (Grattan and
Grieve, 1999). By the end of the study, overall levels of Ca2+
in leaf tissue were reduced
to deficiency levels at 0.18 % DW (Carrow et al., 2001). This reduction in leaf tissue
Ca2+
under salinity stress is expected because the uptake of Ca2+
is reduced due to ion
interactions, precipitation, and increases in ionic strength. All of these influences
decrease the availability of Ca2+
to the plant (Grattan and Grieve, 1999). Maintaining an
adequate concentration of calcium in salt stressed environments is an important aspect in
controlling the severity of ion toxicities. All genotypes experienced a significant
reduction in Ca2+
concentration in leaf tissue under salinity irrigation. An irrigation
regime*fertility regime*genotype interaction was displayed with MiniVerde responding
with higher Ca2+
concentration under salinity stress with root applications of urea N. As
Page 69
49
the salt concentration in the root zone increases, plant requirement for calcium also
increases. Elevated levels of Na+ replace Ca
2+ at cell membranes, especially root cells.
Calcium displacement causes loss of membrane integrity, leading to leakage of nutrients
and cell lysis as indicated by EL. Calcium deficiency has been reported to enhance
Pythium blight (Pythium spp.) and other disease susceptibility (Carrow et al., 2001).
Calcium plays an essential role in processes that preserve the structural and functional
integrity of plant membranes, stabilize cell wall structures, regulate ion transport and
selectivity, and control ion exchange behavior as well as cell wall enzyme activities
(Grattan and Grieve, 1999).
By six weeks of the study, overall concentrations of Na2+
in leaf tissue increased
due to irrigation regime. However, there were diverse results between genotype’s
ability to exclude Na+ ion uptake in the root zone. Under saline irrigation, Seadwarf
(1.57 % Na+) and TifEagle (1.64 % Na
+) exhibited significantly lowered levels of Na
+ in
their leaf tissue compared to the other species. Champion, Diamond, and MiniVerde
averaged 2.01 % Na+ within leaf tissue. Further interactions were displayed under
salinity stress for genotype and fertility regimes. Often relations between salinity and
mineral nutrient of horticultural crops are extremely complex (Grattan and Grieve,
1999). Under fresh water irrigation, all genotype displayed similar Na+ concentrations
in leaf tissue regardless of fertility regime. This was not displayed under salinity stress.
Diamond and TifEagle exhibited significantly higher Na+ concentrations in leaf tissue
under root applications of urea nitrogen, while Seadwarf exhibited significantly higher
Page 70
50
Na+ concentration in leaf tissue under foliar fertility than root fertilization at 1.92 and
1.21 % Na+ respectively.
By 12 weeks an overall increase in Na+ within the leaf tissue under saline
irrigation accounting for 646% increase (0.32 to 2.10 %). A fertility regime main effect
was displayed also that resulted in higher overall Na2+
concentration in leaf tissue under
root urea N fertility than foliar application at1.29 and 1.13 % Na+ respectively. At the
conclusion of the study, many interactions between salinity and fertility regimes were
displayed. Under salinity stress, root applications of urea N resulted in significantly
higher overall Na2+
concentrations in leaf tissue than foliar applications (2.25 % and
1.94 %). Overall levels of Na+ concentration in leaf tissue under control conditions did
not differ between fertility regimes. Under fresh water irrigation, all genotypes
regardless of fertility regime, exhibited similar Na+ concentrations in the leaf tissue.
However, under salinity stress, Champion, Diamond and TifEagle exhibited greater Na+
concentrations under root applications of urea, while ‘Seashore’ exhibited greater Na+
concentration under foliar fertility.
Studies focusing on salinity and its influence on mineral nutrition haven’t
examined foliar and root absorbed N treatments. Plants can respond to salinity by
excluding the salt ions or by including them. Under each response there are adaptations
to achieve salt tolerance. In excluders this includes: increased synthesis of organic
solutes and a decrease in surface area (arid climates/succulents). The ion includers rely
on salt compartmentalization, synthesis of compatible solutes, salt excretion, leaf drop
and re-translocation in phloem (Marschner, 1995).
Page 71
51
Halophytic grasses that are ion excluders rely on osmoptrotectants to maintain turgor.
These compatible osmolytes are organic compounds such as glycine betaine, proline and
to a lesser extent K+ and Ca
2+ (Lee et al., 2007). These two mechanisms for salinity
stress have been explored by Marcum and Pessarakli (2006) with exclusion and excretion
being the most effective methods. Marcum and Murdoch (1994) found that salinity
tolerance of C4 turfgrasses is related to Na+ and Cl
- restriction from shoots. Although we
found significantly higher levels of Na+ in the shoot tissue, the genotype examined most
likely compartmentalized the saline ions into the vacuole.
At six weeks of the study, saline irrigation significantly affected overall proline
accumulation in leaf tissue. An increase from 0.55 µg-1
g FW to 2.92 µg-1
g FW under
fresh and saline irrigation regimes respectively was displayed. Champion, Diamond and
MiniVerde exhibited higher proline accumulation under saline irrigation regime, while
proline accumulation for Seadwarf and TifEagle was similar for either irrigation regime.
An interaction of irrigation regime*fertilizer regime*genotype showed that both fertility
regimes led to similar proline accumulations across all genotypes under fresh water
irrigation. However, under salinity stress, Diamond accumulated more proline under root
applications while Seadwarf accumulated higher proline amounts with foliar applications
of urea N. Further examination of osmoprotectant accumulation and Na+ concentration
needs to be conducted in warm-season turfgrass management. Determination of Na+
threshold levels in leaf tissue could lead to a better understanding of salinity tolerance
and precision turfgrass management in salt affected environments.
Page 72
52
Electrolyte leakage (EL) was significantly affected by irrigation regime at six and
twelve weeks of the study. This plant response was expected due to the increase in saline
ions in the root-zone, leading to a deficiency in calcium. This deficiency leads to a
breakdown in the integrity of cell walls and membranes. Saline irrigation significantly
increased overall EL to 44.48% from 18.87% in fresh irrigation water. A significant
genotype effect was seen with Champion exhibiting significantly higher EL (34.14%)
than TifEagle (28.50%). All other genotypes had similar relative EL levels. Irrigation
regime*genotype interactions showed that under salinity irrigation, Champion exhibited
significantly higher levels of EL than TifEagle (47.77% and 36.47% respectively).
Under fresh water irrigation, all genotypes had similar EL levels. Under salinity stress
Diamond exhibited significantly higher EL readings with root applications of urea.
MiniVerde displayed higher EL readings under foliar applications of urea N (48.69% and
37.13% respectively). Ward et al. (1986) illustrated the importance of calcium for
selective ion uptake in plants under salinity stress. Through the restriction of Na+ influx
and translocation, elevated levels of calcium can protect plants from salt injury.
Conclusions
The examination of urea N delivery method has been conducted in common
warm-season turfgrasses under moderate salinity stress. Foliar and root applied urea N
resulted in similar N, P, and K+ concentrations in the leaf tissue of all genotypes
However, overall leaf tissue Na+ concentrations at the conclusion of the study were
significantly higher in most genotypes excluding examined, excluding Seadwarf under
root fertilization than foliar applied urea-N turfgrasses. The increase in Na+
Page 73
53
concentration in leaf tissue due to root applied urea was not expected and could be due to
soil related factors. Direct uptake of urea by roots is possible due to the evidence of urea
specific transporters and aquaporins that passively transport urea on many plants (Liu et
al., 2003). However, if the urea in the root-zone is hydrolyzed by urease present in the
soil, a small increase in soil pH will occur (Reynolds et al., 1985). This fluctuation in
soil pH due to the increased hydrolysis of urea following root applications could be
driving Na+ uptake. However, definitive conclusions of this theory cannot be made
without examining soil urease activity, and pH, and determining Na+ concentrations in
root tissue. A portion of the urea derived from fertilizer applications is being hydrolyzed
by soil borne urease, while there is evidence that urea can be taken up directly through
urea transporters and aquaporins on the root membrane (Liu et al., 2003). Further
research needs to be conducted to determine which N form is being taken up by the plant
in the largest quantities following root applied urea N and the soil pH fluctuations that
could possibly further explain the Na+ uptake which was recorded in this study.
Seadwarf, the most salinity tolerant genotype examined, exhibited significant
increases in N concentration under foliar urea N applications and slight improvements in
TQ under moderate salinity stress. In addition, foliar applications of urea N resulted in
elevated Na+ concentration in the leaf tissue of Seadwarf at the midpoint and conclusion
of the study, which was the only genotype to display such a response. At 6 weeks,
Seadwarf responded to foliar urea N applications with higher P concentrations in leaf
tissue, however at 12 weeks, P concentrations in leaf tissue were greater under root
Page 74
54
applied N. Findings from this study suggest that foliar applications of urea N provide an
alternative to traditional granular fertilization when root zone salinity is elevated.
Although TQ was initially reduced under salinity stress; a rebound in TQ was
displayed from the midpoint until the conclusion of the study. Salt stress mechanisms
including accumulation of proline could be contributing to the increase in TQ due to
better salt tolerance. Marcum and Pessarakli (2006) found that TifEagle, Champion, and
MiniVerde exhibited similar salt tolerances, however, results from this study suggest
otherwise. Champion displayed the greatest reduction in TQ among all genotypes tested
while responded to salinity stress with the greatest EL % and proline accumulations. It is
possible that warm-season turfgrasses, including Seadwarf, could possibly be Na+
deficient. Future research examining Na+ sufficiency concentrations needs to be
determined in common warm-season turfgrasses.
Due to the complexity of the interactions exhibited under salinity stress, it is
commonly difficult to draw definitive conclusions on the status of mineral nutrition
within turfgrasses. Multiple responses were displayed among genotypes under foliar urea
N fertilization and salinity stress. Seadwarf seashore paspalum displayed interesting
responses to salinity stress and fertility regime over the course of the study. Further
research examining Na+ and N transport and uptake needs to be determined in warm-
season turfgrasses to make recommendations for best nutrient management practices in
salt-affected areas. Urease activity in the soil and plant tissue following urea N
fertilization needs to be fully examined to determine nutrient uptake and assimilation in
an effort to maximize N use efficiency. Finally, Ni2+
nutrition and supplementation of
Page 75
55
warm-season turfgrasses needs to be researched due to Ni2+
’s essential role in the
hydrolysis of urea.
Page 76
56
Table 3.1. Soil chemical properties of 85%:15% (v:v) sand: peat used for the project Clemson University Greenhouse Research Complex.
Soil
pH
Buffer
pH
---------------------------------kg-1
ha---------------------------------- ---------------------% Base Saturation---------------
P
K
Ca
Mg
Zn
Mn
Cu
B
Na
CEC†
Acidity†
Ca
Mg
K
Na
Total
5.93 7.95 4.8 14.9 665.9 78.4 0.7 1.8 0.3 0.1 17.5 2.2 0.4 66.6 13 1 1.6 81.6
†Meq 100 g
56
Page 77
57
Table 3.2. Stock solutions and concentrations for micronutrient, NaCl,
phosphorus, and potassium solutions based on Hoagland and Arnon (1950)
Nutrient
Stock
Solution
Concentration
Experimental
Concentration
A. Micronutrient Stock
Boric Acid, H3BO3
Manganese chloride, MnCl2*4 H2O
Zinc sulfate, ZnSO4 *7 H2O
Copper sulfate, CuSO4 *5 H2O
Molybdic acid, MoO3*H2O
B. Fe (Sequestrene)
C. Sodium Chloride, NaCl
D. Phosphorus, P2O5 (0-30-0)
E. Potassium, K2O (0-0-25)
(g/L)
2.86
1.81
0.22
0.08
0.02
21.0
250
0.81
0.91 ml/L
1.90ml/L
1ml/L
1ml/L
Page 78
58
Table 3.3. Tissue N concentration in leaf tissue as influenced
by salinity regime, fertility regime, genotype, and run in
Clemson University Greenhouse Research Complex at two
harvest events (6 and 12 weeks after initiation of treatments).
Main effects
Salinity (S)
Control
8,000 ppm
Fertility Regime (F)
Foliar
Root
Genotype (G)
Seadwarf
Diamond
TifEagle
Champion
MiniVerde
LSD (0.05)
Run (R)
1
2
6 Week
12Week
-----------% DW---------
2.31
2.29
2.25
2.35
2.33
2.37
2.22
2.24
2.34
NS
2.14
2.46
2.63
2.44
2.52
2.56
2.56
2.57
2.51
2.44
2.62
NS
2.43
2.65
ANOVA
Source of variation†
S
F
G
R
S*F
S*G
F*G
S*F*G
S*F*R
S*G*R
F*G*R
S*F*G*R
NS
NS
NS
***
NS
*
**
**
NS
NS
NS
NS
**
NS
NS
**
NS
**
**
**
NS
NS
NS
NS
* Significant at the 0.05 probability level.
** Significant at the 0.01 probability level.
*** Significant at the 0.001 probability level.
† Main effect and interactions including Run (R) exhibited
differences in magnitude, not changes in trend.
Page 79
59
Table 3.4. Tissue P concentration in leaf tissue as influenced by
salinity regime, fertility regime, genotype, and run in Clemson
University Greenhouse Research Complex at two harvest
events (6 and 12 weeks after initiation of treatments).
Main effects
Salinity (S)
Control
8,000 ppm
Fertility Regime (F)
Foliar
Root
Genotype (G)
Seadwarf
Diamond
TifEagle
Champion
MiniVerde
LSD (0.05)
Run (R)
1
2
6 Week
12Week
--------------% DW-------------
0.26
0.23
0.25
0.25
0.25
0.26
0.24
0.24
0.26
NS
0.25
0.25
0.29
0.24
0.26
0.27
0.27
0.27
0.26
0.26
0.27
NS
0.26
0.27
ANOVA
Source of variation†
S
F
G
R
S*F
S*G
F*G
S*F*G
S*F*R
S*G*R
F*G*R
S*F*G*R
***
NS
NS
NS
NS
**
**
**
NS
NS
NS
NS
***
NS
NS
NS
NS
*
NS
**
NS
NS
NS
NS
* Significant at the 0.05 probability level.
** Significant at the 0.01 probability level.
*** Significant at the 0.001 probability level.
† Main effect and interactions including Run (R) exhibited
differences in magnitude, not changes in trend.
Page 80
60
Table 3.5. Tissue K+ concentration in leaf tissue as influenced
by salinity regime, fertility regime, genotype, and run in
Clemson University Greenhouse Research Complex at two
harvest events (6 and 12 weeks after initiation of treatments).
Main effects
Salinity (S)
Control
8,000 ppm
Fertility Regime (F)
Foliar
Root
Genotype (G)
Seadwarf
Diamond
TifEagle
Champion
MiniVerde
LSD (0.05)
Run (R)
1
2
6 Week
12Week
--------------% DW---------------
1.52
1.16
1.36
1.33
1.20
1.23
1.53
1.51
1.25
0.23
1.38
1.30
1.72
1.15
1.43
1.43
1.27
1.32
1.61
1.64
1.34
0.23
1.45
1.42
ANOVA
Source of variation†
S
F
G
R
S*F
S*G
F*G
S*F*G
S*F*R
S*G*R
F*G*R
S*F*G*R
***
NS
**
NS
NS
**
NS
NS
NS
NS
NS
NS
***
NS
**
NS
NS
***
NS
NS
NS
NS
NS
NS
* Significant at the 0.05 probability level.
** Significant at the 0.01 probability level.
*** Significant at the 0.001 probability level.
† Main effect and interactions including Run (R) exhibited
differences in magnitude, not changes in trend.
Page 81
61
Table 3.6. Electrolyte leakage in leaf tissue as influenced by
salinity regime, fertility regime, genotype, and run in Clemson
University Greenhouse Research Complex at two harvest
events (6 and 12 weeks after initiation of treatments).
Main effects
Salinity (S)
Control
8,000 ppm
Fertility Regime (F)
Foliar
Root
Genotype (G)
Seadwarf
Diamond
TifEagle
Champion
MiniVerde
LSD (0.05)
Run (R)
1
2
6 Week
12Week
-----------------%------------------
17.51
33.56
26.48
24.59
24.72
24.32
22.21
29.02
27.40
4.45
16.72
34.35
18.59
39.59
28.92
28.83
26.94
29.70
24.85
32.87
30.01
4.60
23.85
33.90
ANOVA
Source of variation†
S
F
G
R
S*F
S*G
F*G
S*F*G
S*F*R
S*G*R
F*G*R
S*F*G*R
***
NS
*
***
NS
***
***
***
NS
**
***
**
***
NS
*
***
NS
**
***
**
NS
NS
**
**
* Significant at the 0.05 probability level.
** Significant at the 0.01 probability level.
*** Significant at the 0.001 probability level.
† Main effect and interactions including Run (R) exhibited
differences in magnitude, not changes in trend.
Page 82
62
Table 3.7. Proline accumulation in leaf tissue as influenced by
salinity regime, fertility regime, genotype, and run in Clemson
University Greenhouse Research Complex at two harvest
events (6 and 12 weeks after initiation of treatments).
Main effects
Salinity (S)
Control
8,000 ppm
Fertility Regime (F)
Foliar
Root
Genotype (G)
Seadwarf
Diamond
TifEagle
Champion
MiniVerde
LSD (0.05)
Run (R)
1
2
6 Week
12Week
----------- µg-1
g FW -----------
0.55
2.98
1.68
1.85
1.25
2.52
1.27
2.09
1.70
1.04
1.53
2.00
1.07
6.18
3.86
3.40
3.00
4.19
3.01
4.92
3.02
1.17
2.32
4.93
ANOVA
Source of variation†
S
F
G
R
S*F
S*G
F*G
S*F*G
S*F*R
S*G*R
F*G*R
S*F*G*R
***
NS
NS
NS
NS
NS
*
*
NS
NS
NS
NS
***
NS
**
***
NS
**
***
***
NS
NS
NS
**
* Significant at the 0.05 probability level.
** Significant at the 0.01 probability level.
*** Significant at the 0.001 probability level.
† Main effect and interactions including Run (R) exhibited
differences in magnitude, not changes in trend.
Page 83
63
Table 3.8. Tissue Na+ concentration in leaf tissue as influenced
by salinity regime, fertility regime, genotype, and run in
Clemson University Greenhouse Research Complex at two
harvest events (6 and 12 weeks after initiation of treatments).
Main effects
Salinity (S)
Control
8,000 ppm
Fertility Regime (F)
Foliar
Root
Genotype (G)
Seadwarf
Diamond
TifEagle
Champion
MiniVerde
LSD (0.05)
Run (R)
1
2
6 Week
12Week
---------------%DW-------------
0.26
1.82
0.99
1.10
0.94
1.16
0.95
1.13
1.03
0.11
0.98
1.10
0.32
2.00
1.03
1.29
1.18
1.34
1.07
1.21
0.98
0.19
0.96
1.36
ANOVA
Source of variation†
S
F
G
R
S*F
S*G
F*G
S*F*G
S*F*R
S*G*R
F*G*R
S*F*G*R
***
**
***
**
*
***
***
***
NS
NS
NS
NS
***
***
**
***
***
**
***
***
NS
NS
*
*
* Significant at the 0.05 probability level.
** Significant at the 0.01 probability level.
*** Significant at the 0.001 probability level.
† Main effect and interactions including Run (R) exhibited
differences in magnitude, not changes in trend.
Page 84
64
Figure 3.1. Turf quality (0-9, >6 acceptable) of MiniVerde, TifEagle, Champion,
Diamond and Seadwarf under fresh water irrigation at the Clemson University
Greenhouse Complex over 12rating dates. Means were separated at P≤0.05 by protected
LSD.
Weeks
0 2 4 6 8 10 12
Turf
Qualit
y
3
4
5
6
7
8
9
Miniverde
TifEagle
Champion
Diamond
Seadwarf
Page 85
65
Weeks
0 2 4 6 8 10 12
Tu
rf Q
ua
lity
3
4
5
6
7
8
9 MinVerde
TifEagle
Champion
Diamond
Seadwarf
Figure 3.2. Turf quality (0-9, >6 acceptable) of MiniVerde, TifEagle, Champion,
Diamond and Seadwarf under salinity stress at the Clemson University Greenhouse
Complex over 12 rating dates. Means were separated at P≤0.05 by protected LSD.
Page 86
66
Figure 3. 3. Turf quality of five warm-season turfgrass genotypes under two salinty levels (0,8,000 ppm NaCl) at the
conclusion of the study.
66
Page 87
67
Figure. 3.4. The interaction of salinity stress and fertility regime on Na+ concentration %
DW in the leaf tissue at the conclusion of the study. Means were separated at P≤0.05 by
protected LSD.
Irrigation Regime
Fresh Salinity
Na
Co
nce
ntr
atio
n %
DW
0.0
0.5
1.0
1.5
2.0
2.5
Root
Foliar
Page 88
68
Species
Seadwarf Diamond TifEagle Champion MiniVerde
Na
Co
nce
ntr
atio
n %
DW
0.0
0.5
1.0
1.5
2.0
2.5
Fresh 0 ppm NaCl
Salinity 8,000 ppm NaCl
Figure 3.5. Na+ concentration % DW of MiniVerde, TifEagle, Champion, Diamond and
Seadwarf under both irrigation regimes at the Clemson University Greenhouse Complex
at 6 weeks after treatments began. Means were separated at P≤0.05 by protected LSD.
Page 89
69
Species
Seadwarf Diamond TifEagle Champion MiniVerde
Na
Co
nce
ntr
atio
n %
DW
0.0
0.5
1.0
1.5
2.0
2.5
3.0 Fresh 0 ppm NaCl
Salinity 8,000 ppm NaCl
Figure 3.6. Na+ concentration % DW of MiniVerde, TifEagle, Champion, Diamond and
Seadwarf under both irrigation regimes at the Clemson University Greenhouse Complex
at the conclusion of the study. Means were separated at P≤0.05 by protected LSD.
Page 90
70
Na Concentration % DW
0.0 0.5 1.0 1.5 2.0 2.5 3.0 3.5 4.0
Pro
line µ
g-1
g F
W
0
2
4
6
8
10
12
14
16
18
Figure 3.7. Regression of Na+ concentration (%DW) and proline concentration (µg
-1 g
FW) in Champion at the conclusion of the study at the Clemson University Greenhouse
Complex.
Proline µg-1
g FW = -0.03 + 3.99* Na% DW
R2=0.85
Page 91
71
Na Concentration % DW
0.0 0.5 1.0 1.5 2.0 2.5 3.0 3.5 4.0
Pro
line
µg
-1 g
FW
0
2
4
6
8
10
12
14
16
18
Figure 3.8. Regression of Na+ concentration (%DW) and proline concentration (µg
-1 g
FW) in Diamond at the conclusion of the study at the Clemson University Greenhouse
Complex.
Proline µg-1
FW = -0.21 + 3.16*Na % DW
R2=0.86
Page 92
72
Na Concentration % DW
0.0 0.5 1.0 1.5 2.0 2.5 3.0 3.5 4.0
Pro
line µ
g-1
g F
W
0
2
4
6
8
10
12
14
16
18
Figure 3.9. Regression of Na+ concentration (%DW) and proline concentration (µg
-1 g
FW) in MiniVerde at the conclusion of the study at the Clemson University Greenhouse
Complex.
Proline µg-1
g FW = -0.87 + 3.70*Na % DW
R2=0.76
Page 93
73
Na Concentration % DW
0.0 0.5 1.0 1.5 2.0 2.5 3.0 3.5 4.0
Pro
line
µg
-1 g
FW
0
2
4
6
8
10
12
14
16
18
Figure 3.10. Regression of Na+ concentration (%DW) and proline concentration (µg
-1 g
FW) in Seadwarf at the conclusion of the study at the Clemson University Greenhouse
Complex.
Proline µg-1g FW = -0.54 + 3.12*Na % DW
R2=0.69
Page 94
74
Na Concentration % DW
0.0 0.5 1.0 1.5 2.0 2.5 3.0 3.5 4.0
Pro
line µ
g-1
g F
W
0
2
4
6
8
10
12
14
16
18
Figure 3.11. Regression of Na+ concentration (%DW) and proline concentration (µg
-1 g
FW) in TifEagle at the conclusion of the study at the Clemson University Greenhouse
Complex.
Proline µg-1
g FW = -0.62 + 3.964*Na % DW
R2=0.82
Page 95
75
Na Concentration % DW
0.0 0.5 1.0 1.5 2.0 2.5 3.0 3.5 4.0
Pro
line
µg
-1 g
FW
0
2
4
6
8
10
12
14
16
18
Figure 3.12. Regression of Na+ concentration (%DW) and proline concentration (µg
-1 g
FW) in all genotypes at the conclusion of the study at the Clemson University
Greenhouse Complex.
Proline ug-1g FW = -0.47 + 3.56*Na % DW
R2=0.82
Page 96
76
CHAPTER IV
SUPPLEMENTAL NICKEL APPLICATIONS AND FOLIAR UREA
FERTILITY ON TWO WARM-SEASON TURFGRASS SPECIES UNDER SALINITY
STRESS
Introduction
Due to the similarities displayed in root and foliar N uptake in the previous study,
a second study was conducted to further examine foliar urea N fertility under salinity
stress. Foliar fertilization is commonplace in turfgrass management and urea N is the
most popular N source due to its solubility, high percentage of N by weight, low cost, and
relatively low burn potential. However, before the N in urea is available to the plant to
assimilate into organic N containing compounds it must be hydrolyzed by the Ni2+
containing enzyme urease. Stimulation of urea N metabolism has been observed in
several plant species with Ni2+
supplementation (Yang et al., 1996; Gerendas and
Sattelmacher, 1997b; Gerendas and Sattelmacher, 1999; Moraes et al., 2009). Due to the
popularity of urea as a N source in turfgrass management, it is surprising that Ni2+
supplementation has not yet been researched to potentially improve urea N metabolism
through the stimulation of urease. This is the first study examining Ni2+
supplementation
and urea N metabolism of several warm-season turfgrasses under salinity stress.
TifEagle bermudagrass and Diamond zoysiagrass were chosen due their salt tolerance,
and increasing popularity in turfgrass management. This study was conducted to further
examine their response to Ni2+
supplementation under foliar applied urea N and moderate
salinity stress.
Page 97
77
This study was designed to 1) assess urease activity in leaf tissue of two turfgrass
species after foliar applications of urea N, 2) determine the effect of supplemental Ni2+
applications on urease activity and amino acid content, 3) determine if moderate salinity
reduces urease activity and N metabolism in warm-season turfgrass leaf tissue, and 4)
establish if Ni2+
supplementation increases foliar urea N uptake and assimilation.
Materials and Methods
Experiments included two repeated studies at the Clemson University Greenhouse
Research Complex. Study 1 was conducted from May-August 2011 Greenhouse
conditions averaged 27.2°C temperature and 61.5 % relative humidity. Average
maximum and minimum temperatures were 33.4°C and 20.83°C respectively. Study II
was conducted from July-October 2011. Greenhouse conditions averaged 26.5°C
temperature and 59.7% relative humidity. Average maximum and minimum temperatures
were 32.9°C and 18.8°C respectively. Twenty four 15.24 cm plugs of each species
TifEagle, ultradwarf bermudagrasses and Diamond zoysiagrass were harvested from the
Clemson turfgrass research plots and thoroughly washed to remove soil before being
established in hydroponic culture. Each plug was placed into a 15.24 x 40 cm capped
PVC tube supplied with continuous aeration. Each plug was supported using 0.3175 cm
wooden dowel rods. Air was supplied with aquarium air pumps (Aqua Culture MK-
1504, Bentonville, AR) and 0.64 cm black flex PVC airline fit into 22.86 cm disposable
Pasteur pipettes (Fisher Scientific) to ensure proper depth in the hydroponic solution
allowing for consistent aeration. The plant material was established in nutrient solution
derived from Hoagland and Arnon (1950) with all macro and micronutrients supplied
Page 98
78
(Table 4.1). Salinity was induced in three stages during establishment, beginning with
2,000 ppm NaCl and 4,000 ppm NaCl the two weeks prior to treatment commencement.
For the duration of the study, N was removed from the hydroponic solution and 5,000
ppm NaCl was maintained for salinity treatments (Table 4.1). During establishment and
study the hydroponic solution was replaced weekly to maintain proper levels and nutrient
concentrations. Treatments consisted of two salinity levels (0 and 5,000 ppm NaCl) and
three Ni2+
levels supplied as NiCl2 [Control, 200 µg Ni2+
L-1
, and 400 μg Ni2+
L-1
(Table
4.1.)] to determine the effects of salinity stress and supplemental Ni2+
applications on N
metabolism. Weekly foliar applications of urea Nat 9.8 kg ha-1
at a carrier volume of 561
L-1
ha-1
were conducted to supply 0.81 kg N for the duration of the study. Applications
of bifenthrin (Talstar GC flowable) at 1.04L ha-1
were made three times during the
establishment for control of Banks grass mites (Oligonychus pratensis).
Turfgrass Harvest and Parameters Measured
Turfgrass clippings were harvested at three, six, and nine weeks of the study.
Roots were harvested at the conclusion of the studies and kept at 80°C until further
analysis. Parameters measured in turfgrass clippings included: urease activity, total
amino acid content, and tissue nutrient concentration.
Urease Assay
Methodology is listed in appendix B.
Amino Acid Assay
Methodology is listed in appendix B.
Mineral Nutrient Concentration Analysis
Page 99
79
Tissue nutrient concentrations were determined by the following methodologies:
Tissue N analysis was done by combustion utilizing a LECO FP528 N combustion
analyzer (St. Joseph, MI). Mineral analysis of leaf tissue for P, K+, Ca
2+, Mg
2+, Zn
2+,
Mn2+
, Cu2+
, Fe, and S by HNO3/H2O2 digestion, then analysis with ICP mass
spectrometry. Leaf tissue Na+ concentration was determined by weighing 1.0 gram
sample into a 150 mL beaker. One hundred milliliters H20 was added and placed on
stirrer for 30 min. The mixture was filtered with metal filter and pour filtrate into a large
test tube. Analysis was conducted using ICP mass spectrometry.
Data Analysis
Data were analyzed by ANOVA with JMP 9.0 (SAS Institute Inc. Cary, NC).
Mean separations were performed using a Fisher’s protected LSD test at 5% probability
level.
Results
Root mass
Root mass was significantly influenced by the main effect of irrigation regime and
cultivar. Saline irrigation significantly increased root mass over fresh water treatments.
Overall, the root mass of salinity stressed plants was 125.96 g m-2
, whereas fresh water
treatments exhibited an overall root mass of 112.05 g m
-2. Diamond exhibited
significantly higher root mass than TifEagle. At the conclusion of the study, the overall
root mass of Diamond was 169.10 g m
-2 and only 68.92 g
m
-2for TifEagle. Overall, the
mean root mass of the second run was higher than the first run at 126.24 and 111.78 g m
-
2. No significant interactions took place.
Page 100
80
Clipping Yield
Clipping yield was determined at the conclusion of the study. All green leaf
tissue was excised from each turfgrass sample, completely dried and weighed. All three
main effects significantly influenced clipping yield at the conclusion of the study.
Salinity treatments resulted in an average clipping yield of 490 g m
-2 compared to 449.04
g m-2
for fresh water treatments (Figure 4.7). Nickel supplementation increased dry
matter production in both turfgrass species examined. Clipping yields of 499.98, 466.80,
and 442.01 g m-2
were exhibited for 400 μg L-1
, 200 μg L-1
and control Ni2+
treatments
respectively. Diamond exhibited significantly higher clipping yield than TifEagle and the
conclusion of the study (Figure 4.8). Average clipping yield for Diamond was 550.96 g
m-2
compared to 388.23 g m-2
for TifEagle. A significant salinity*species interaction was
exhibited. Diamond had similar clipping yields under each salinity level; however,
TifEagle displayed an increase in clipping yield under salinity treatments. Under salinity
treatments, TifEagle exhibited an average clipping yield of 426.80 g m
-2 compared to
only 349.67 g m
-2 for fresh water treatments. Turfgrass growth can be visualized in
Figure 4.1.
N Concentration
N concentration in leaf tissue (% DW) was determined at 3 harvests (three, six
and nine weeks) during the study. At three weeks after the initiation of treatments
species significantly influenced N concentration in leaf tissue (Table 4.2). TifEagle
exhibited significantly higher N concentration in leaf tissue at 3.33% compared to
Diamond at 3.02%. The overall effect of run was significant in the N concentration at
Page 101
81
three weeks. Run 2 exhibited significantly higher N concentration in leaf tissue at 3.53%
compared to 2.81% for run 1. At six weeks, TifEagle displayed significantly higher N
concentration at 2.87% N in leaf tissue while Diamond exhibited 2.59 %. In addition to a
species main effect, Ni2+
level significantly influenced N concentration. Control plots
receiving no supplemental Ni2+
applications exhibited the greatest N concentration at
2.90% while 200 and 400 μg Ni2+
treatments exhibited similar N concentrations at 2.64
and 2.65 % respectively. This is the only harvest date where a reduction in N content in
leaf tissue was caused by supplemental Ni2+
applications (Table 4.2). The overall effect
of run was significant in the N concentration at six weeks. Run 2 exhibited significantly
higher N concentration in leaf tissue at 3.09% compared to 2.37% for run 1. At the
conclusion of the run the only main effect that significantly influenced N concentration in
leaf tissue was run. Run 1 exhibited overall N concentrations of 1.77 % DW whereas
run 2 exhibited 2.15 % DW.
Micronutrient Concentration
Reductions in manganese (Mn2+
) concentration were exhibited under Ni2+
supplementation. At three weeks, Mn2+
concentrations were 177.54, 164.20, and 156.38
mg kg-1
for 0, 200 and 400 μg Ni2+
L-1
treatments respectively. Six weeks after treatment
initiation, Mn2+
concentrations in leaf tissue showed reductions at the highest Ni2+
supplementation level. Mn2+
concentrations were 214.52 and 211.28 mg kg-1
for 200 μg
Ni2+
L-1
and control treatments whereas Mn2+
levels in leaf tissue in 400 μg Ni2+
L-1
only
exhibited 190.23 mg kg-1
. This same trend was observed at the conclusion of the study.
Mn2+
concentrations were 278.59 and 273.66 mg kg-1
for control and 200 μg Ni2+
L-1
Page 102
82
treatments whereas Mn2+
levels in leaf tissue in 400 μg Ni2+
L-1
only exhibited 253.53 mg
kg-1
.
Magnesium (Mg2+
) concentration in leaf tissue was also reduced by Ni2+
supplementation at three and six weeks. Supplemental Ni2+
levels of 200 and 400 μg
Ni2+
L-1
exhibited significantly lower Mg2+
concentrations at 1700.02 and 1670.90 mg kg-
1 compared to the control at 18330 mg kg
-1. At six weeks, control and 200 μg Ni
2+ L
-1
treatments exhibited similar Mg2+
concentrations in leaf tissue. Plants receiving 400 μg
Ni2+
L-1
displayed significantly lower Mg2+
concentrations at 1506.96 mg kg-1
than
control at 1625.13 mg kg-1
.
Calcium concentration was reduced by Ni2+
supplementation at six weeks of the
study. Only the highest Ni2+
level (400 μg Ni2+
L-1
) reduced Ca2+
levels compared to
control and 200 μg Ni2+
L-1
treatments. Other micronutrients including iron, zinc and
copper were not significantly influenced by Ni2+
supplementation.
Nickel Concentration
At three weeks after the initiation of treatments, Ni2+
level, species, and run main
effects significantly influenced Ni2+
concentration in leaf tissue (Table 4.3). As the Ni2+
level increased so did the Ni2+
concentration in leaf tissue. Concentrations of 1.75, 1.12,
and 0.42 mg kg-1
were exhibited for 400, 200 and control Ni2+
levels (Figure 4.6). At
three weeks, Diamond exhibited significantly higher Ni2+
concentrations at 1.30 mg kg-1
in leaf tissue compared to TifEagle which displayed >1 mg kg-1
Ni2+
concentration.
Overall Ni2+
levels were greater in run 1 at 1.21 mg kg-1
compared to run 2 where Ni2+
concentration in leaf tissue was 0.99 mg kg-1
. A significant Ni2+
level*species interaction
Page 103
83
took place at all harvest dates (Table 4.6). At six weeks, all three main effects
significantly influenced Ni2+
concentration in leaf tissue. Irrigation regime significantly
influenced Ni2+
concentration in leaf tissue with salinity irrigation resulting in higher
concentrations than fresh water irrigation. Ni2+
concentrations of 1.48 and 1.13 mg kg-1
were exhibited for salinity and fresh water irrigation respectively. The Ni2+
level
significantly affected Ni2+
concentration in leaf tissue at six weeks. As the Ni2+
level
increased so did the concentration in leaf tissue. Concentrations of 2.30, 1.31, and 0.31
mg kg-1
were exhibited for 400, 200 and control Ni2+
levels. At six weeks, Diamond
exhibited significantly higher Ni2+
concentrations at 1.73 mg kg-1
in leaf tissue compared
to TifEagle which displayed >1 mg kg-1
Ni2+
concentration. At nine weeks, all three
main effects significantly influenced Ni2+
concentration in leaf tissue. Irrigation regime
significantly influenced Ni2+
concentration in leaf tissue with fresh water irrigation
resulting in higher concentrations than saline water irrigation. Nickel concentrations of
4.87 and 3.84 mg kg-1
were exhibited for fresh and saline water irrigation respectively.
The Ni2+
level significantly affected Ni2+
concentration in leaf tissue at nine weeks. As
the Ni2+
level increased so did the concentration in leaf tissue. Concentrations of 8.47,
4.25, and 0.35 mg kg-1
were exhibited for 400, 200 and control Ni2+
levels. At nine
weeks, Diamond exhibited significantly higher Ni2+
concentrations at 6.18 mg kg-1
in leaf
tissue compared to TifEagle which displayed 2.53 mg kg-1
Ni2+
concentration. At nine
weeks, the Ni2+
concentration in leaf tissue was significantly higher in run 2 at 6.01 mg
kg-1
compared to run 1 at 2.71 mg kg-1
.
Urease Activity
Page 104
84
Urease activity was determined at three harvest dates (three, six, and nine weeks
after the initiation of treatments) during each study (Table 4.4). Three weeks after the
initiation of treatments, the urease activity was significantly affected by the main effects
of Ni2+
level and species. Both 200 and 400 μg Ni2+
treatments resulted in increased
urease activity compared to control treatments receiving no additional Ni2+
. Urease
activity (expressed as μmol NH4+ min
-1 g
-1) was 654.69, 563.60, and 185.13 for 400, 200,
and 0 μg Ni2+
treatments respectively. Both supplemental Ni2+
treatments were not
significantly different from each other. Diamond exhibited significantly higher urease
activity than TifEagle at three weeks. Urease activities of 545.65 and 389.96 μmol NH4+
min-1
g-1
were displayed for Diamond and TifEagle correspondingly. At six weeks the
only main effect to significantly influence urease activity was Ni2+
level. The same trend
was observed with both supplemental Ni2+
levels (200 and 400 μg) resulting in
significantly higher urease activity than control treatments (Figure 4.2). Both
supplemental Ni2+
treatments exhibited similar urease activities at 883.16 and 797.57
μmol NH4+ min
-1 g
-1. Experimental units not receiving supplemental Ni
2+ applications
exhibited significantly lower urease activity at 160.46 μmol NH4+ min
-1 g
-1. The same
trend was exhibited at the conclusion of the study. Both supplemental Ni2+
application
rates resulted in increased urease activity. Urease activities of 733.85 and 664.70 μmol
NH4+ min
-1 g
-1were exhibited for 400 and 200 ug Ni
2+ respectively. Control treatments (0
μg Ni2+
) exhibited urease levels of 202.61 μmol NH4+ min
-1 g
-1. At the conclusion of the
first run, overall urease activity levels were higher than the second run. 626.50 and
441.30 μmol NH4+ min
-1 g
-1 FW urease levels were exhibited for the 1
st and 2
nd runs
Page 105
85
respectively. Also, a significant salinity treatment* Ni2+
level interaction was exhibited.
At the 200 μg Ni2+
level, experimental units under salinity stress exhibited significantly
higher urease activity than fresh water irrigation. Urease activities of 757.46 and 571.93
μmol NH4+ min
-1 g
-1 were exhibited for salinity and fresh water irrigation treatments
respectively.
Amino Acid Content
Amino acid content was determined at three harvest dates (three, six, and nine
weeks after the initiation of treatments) during each study (Table 4.5). At three Weeks
after the initiation of treatments, Ni2+
level, species, and run main effects were
significant. Both supplemental Ni2+
applications increased the total amino acid content in
leaf tissues significantly over control treatments (Figure 4.3). Amino acid contents of
19.19 and 17.99 mg g
-1 FW
were exhibited for 400 and 200 μg Ni
2+ treatments
respectively. Diamond had higher amino acid contents in leaf tissue than TifEagle at
three Weeks. Amino acid contents of 18.22 and 15.50 mg g
-1 FW were exhibited in
Diamond and TifEagle respectively (Figure 4.4). Run 2 exhibited significantly higher
amino acid contents at 19.04 mg g
-1 FW than run 14.68 mg
g
-1 FW for run 1. At all
harvests there was a significant Ni2+
level*species interaction (Table 4.7). Diamond
exhibited significantly higher amino acid pools under 200 and 400 μg Ni2+
treatments
than control treatments. These two supplemental Ni2+
levels resulted in amino acid pools
greater in Diamond than TifEagle under the same treatment. There was a smaller range
of amino acid contents in the three Ni2+
levels in TifEagle. Both 200 and 400 μg Ni2+
levels resulted in similar amino acid contents at 15.65 and 16.79 mg g
-1 FW respectively,
Page 106
86
while the control treatments exhibited 14.05 mg g
-1FW
amino acid content, which was not
significantly different from the 200 μg Ni2+
treatment.
At six weeks after treatment initiation, the main effects of Ni2+
level and species
influenced amino acid content in leaf tissue of the turfgrasses. Supplemental Ni2+
applications increased total amino acid pools in leaf tissue at six Weeks. Both 200 and
400 μg Ni2+
treatments resulted in similar amino acid contents at 19.05 and 20.14 mg g
-1
FW respectively. In addition to Ni2+
level, species had a significant influence on amino
acid content with Diamond exhibiting 20.27 mg g
-1 FW while TifEagle displayed 14.04
mg g
-1 FW, a significant difference. At six weeks, there was a significant Ni
2+
level*species interaction (Table 4.7). Diamond exhibited significantly higher amino acid
pools under 200 and 400 μg Ni2+
treatments than control treatments. These two
supplemental Ni2+
levels resulted in amino acid pools higher in Diamond than TifEagle
under the same treatment. There was a smaller range of amino acid contents in the three
Ni2+
levels in TifEagle. Both 200 and 400 μg Ni2+
levels resulted in similar amino acid
contents at 15.12 and 14.70 mg g
-1 FW respectively, while the control treatments
exhibited 12.22 mg g
-1 FW amino acid content, not significantly different from the 400 μg
Ni2+
treatment.
At the conclusion of the study the main effects of Ni2+
level and species
significantly influenced the amino acid content in leaf tissue. Both supplemental Ni2+
levels increased total amino acid content in leaf tissue above the control treatments not
receiving additional Ni2+
. Amino acid contents of 48.36 and 48.11 mg g
-1 FW were
exhibited for 400 and 200 μg Ni2+
treatments respectively. Experimental units not
Page 107
87
receiving supplemental Ni2+
applications displayed significantly lower total amino acid
content at 26.55 mg g
-1 FW at the conclusion of the study. Species also significantly
influenced amino acid pools in leaf tissue, with Diamond exhibiting significantly higher
levels than TifEagle. At the conclusion of the study amino acid levels of 44.68 and 37.35
mg g
-1 FW were seen in Diamond and TifEagle respectively. The Ni
2+ level*species
interaction was significant at the conclusion of the study (Table 4.7). Diamond and
TifEagle exhibited significantly higher amino acid pools under 200 and 400 μg Ni2+
regimes than control treatments. However, amino acid pools in Diamond were
significantly higher than TifEagle under the same treatments. Under 200 μg Ni2+
applications, Diamond exhibited 55.33 mg g
-1 FW while TifEagle had amino acid
contents of 40.88 mg g
-1 FW. The same trend was also seen in the 400 μg Ni
2+ treatment
also.
Discussion
The stimulating effect of Ni2+
supplementation on urea grown plants is well
documented (Krogmeier et al., 1991; Gerendas et al., 1998; Gerendas and Sattelmacher,
1999; Tan et al., 2000). Supplemental applications of Ni2+
stimulated urease activity in
the leaf tissue over the course of the study which agrees with the findings of Krogmeier et
al. (1991), Gerendas et al. (1998), and Gerendas and Sattelmacher (1999) with soybean,
rice and spring rape respectively. Supplemental Ni2+
in the nutrient solution also
increased the total amino acid pool in leaf tissue, presumably due to enhanced urease
activity, which agrees with Gerendas and Sattelmacher (1999). Gerendas and
Sattelmacher (1999) contributed the increase in amino acid content to storage and
Page 108
88
transport forms (Gln, Asn, Glu, and Asp), suggesting that Ni2+
supplemented plants
posses a luxury N status, which leads to a high leaf N content, however, our findings
were different. Although an apparent stimulation of N metabolism took place over the
course of the study, overall N concentration in leaf tissue decreased.
Supplemental Ni2+
up to 0.1 mg-1
L-1
increased growth and chlorophyll content in
urea fed canola and supplementation promoted growth of urea fed tomato reporting that
enhancement in growth was probably due to improved urea N assimilation which also
lead to increases in N content of leaf tissue (Tan et al., 2000; Bybordi and Gheibi, 2009),
which did not occur in this study. Clipping yield (i.e. growth) increased by Ni2+
supplementation however; an overall reduction of N content was seen. An increase in
dry matter production with Ni2+
supplementation might be the responsible for diluting the
N content in leaf tissue, which disagrees with findings of Tan et al. (2000) which found
increases in both growth and N content in leaf tissue of tomato.
Amino acid contents in leaf tissue were also significantly influenced by species.
Over the course of the study, both Diamond and TifEagle accumulated amino acid
contents in their leaf tissue, with Diamond exhibiting significantly more than TifEagle.
However, TifEagle consistently displayed greater N concentrations in leaf tissue than
Diamond over the course of the study; and both species experienced a reduction in N
concentration as the study progressed. To further investigate this occurrence examination
in specific amino acid pools and N metabolites needs to be conducted. Witte (2011)
suggested that N starvation and decreases in growth could be the result of elevated amino
acid contents and urea as a sole N source, which is a possibility in this study. Elevated
Page 109
89
levels of total amino acids in leaf tissue might cause feedback inhibition and decrease the
plant’s need to absorb foliar applied urea N. This phenomenon could lead to excessive
volatilization from the leaf surface and poor fertilizer efficiency following foliar
applications of urea N.
An accumulation of Ni2+
in the leaf tissue was exhibited while N levels decreased
which disagrees with findings of Tan et al. (2000) and Khoshgoftarmanesh et al. (2011)
who found increases in N content in leaf tissue of lettuce with Ni2+
supplementation.
Nickel accumulated throughout the course of the study; as the Ni2+
level increased in the
nutrient solution, overall Ni2+
concentrations in leaf tissue increased respectively. This
result agrees with findings of Tan et al. (2000) in tomato. Critical toxicity levels in plants
are in the range of > 10 μg g-1
dry weight for sensitive, and > 50 μg g-1
dry weight in
moderately tolerant species (Marschner, 1995). At 400 μg Ni2+
L-1
, the highest level of
Ni2+
concentration in leaf tissue was 8.47 mg kg-1
. No visual toxicity symptoms were
exhibited at this level in either species, suggesting that TifEagle and Diamond are not
sensitive to elevated Ni2+
levels in leaf tissue. The control treatments, although
exhibiting significantly reduced levels of urease activity and amino acid content did not
express symptoms of N deficiency, therefore, it is likely that their Ni2+
concentrations in
leaf tissue were well above critical Ni2+
deficiency levels. Findings of Gerendas and
Sattelmacher (1999) showed that spring rape grown on urea with Ni2+
supplementation
did not influence concentrations of N in leaf tissue; however, this was recorded at six
weeks of the study.
Page 110
90
Visual signs of Ni2+
toxicity were not recorded throughout the study, although
interactions with micronutrients and N metabolism are possible. Reductions in Mn2+
,
Mg2+
, and Ca2+
concentrations agree with Gerendas and Sattelmacher (1999) where
concentrations of micronutrients were commonly found to be lower in the leaf tissue of
spring rape with Ni2+
additions, however many micronutrients including Cu2+
, Zn2+
and
Fe were not significantly influenced. Increasing Ni2+
supplementation levels could
further exacerbate micronutrient deficiencies leading to reduced enzyme function and
alteration of key physiological processes.
Salinity treatments did not significantly influence urease activity, amino acid content, or
N concentration throughout the study. However salinity significantly altered
concentrations of several nutrients including Ni2+
in leaf tissue. Salinity treatments
increased Ni2+
concentration in leaf tissue at six weeks; however, the opposite was true at
the conclusion of the study with fresh water treatments resulting in higher Ni2+
concentrations in leaf tissue. These findings suggest that moderate salinity stress can
influence micronutrient uptake in warm season turfgrass species. In addition, this finding
provides further evidence that Na+ and Ni
2+ uptake rely on similar uptake strategies
although the trend was not consistent throughout the duration of the study. Lastly, an
increase in clipping yield and root growth was also exhibited with moderate salinity
stress, indicating potential stimulation of growth. This response further supports the
possibility of warm-season turfgrasses requiring greater Na+ for normal growth and
physiological processes. Species utilizing C4 metabolism commonly require Na+ for
regenerating phosphoenolpyruvate, the substrate for the first carboxulation in the C4
Page 111
91
pathways (Taiz and Zeiger, 2010). Further examination of Na’s role and sufficiency
levels needs to be determined in warm-season turfgrass species.
Conclusions
The stimulation of N metabolism under foliar urea nutrition with Ni2+
supplementation has been achieved in two warm season turfgrass species. Although
urease activity and amino acid pools were increased under Ni2+
supplementation, an
overall decrease in N concentration in leaf tissue was observed over the course of the
nine week study. This finding could be the result of utilizing urea as the sole N source
which can cause reduced growth and symptoms of N starvation. To overcome these
potential problems with utilizing urea as the sole source of N, multiple N fertility sources
(NO3-, NH4
+) should be utilized. Salinity stress commonly reduces the macro and
micronutrient status within plants. However, a stimulation of growth was displayed
under moderate salinity stress which also led to increased Ni2+
concentration in leaf
tissue. This result supports the possibility of many warm-season turfgrasses possessing
greater Na+ requirements for optimum growth, especially in hydroponic conditions where
as tested in this experiment.
Nickel deficiency is not commonly seen in turfgrass management; however, when
urea is being utilized as a foliar N source, monitoring Ni2+
levels in soil and plant tissue
Ni2+
might prove beneficial. Many positive effects of Ni2+
supplementation have been
recorded. Nickel deficiency in pecan and other fruit trees is becoming more common
and it is possible that many horticulture crops possess a “hidden hunger” for Ni2+
. In
addition, Wood et al. (2012) has recorded the positive effects of Ni2+
supplementation on
Page 112
92
disease management of fruit trees. Future research should examine the positive effects of
Ni2+
supplementation on disease management of turfgrasses.
Further research needs to be conducted to examine supplemental Ni2+
applications
on warm season turfgrass supplied with various N sources and rates. Analysis of urea
and specific amino acid concentrations in plant tissues needs to be conducted. Through
examination of specific amino acids, it will be possible to more fully understand the
uptake, assimilation, and translocation of foliar applied urea N under the influence of
Ni2+
supplementation. The significance of Ni2+
supply depends on N source and critical
levels of Ni2+
in turfgrass tissue need to be determined in those scenarios. Lastly a
comprehensive investigation at Ni2+
nutrition needs to be conducted to determine positive
and negative effects of Ni2+
supplementation, including Ni2+
toxicity in turfgrasses.
Page 113
93
Table 4.1. Stock solutions and concentrations for pre-culture†, minus N‡, Ni2+
§, and
NaCl¶, solutions based on Hoagland and Arnon (1950)
Nutrient
Stock
Solution
Concentration
Experimental
Concentration
A. Ammonium acid phosphate, NH4H2PO4
B. Potassium nitrate, KNO3
C. Calcium nitrate CaNO3
D. Magnesium sulfate, MgSO4 *7H2O
E. Potassium sulfate, K2SO4
F. Magnesium sulfate, MgSO4
G. Calcium Phosphate Monobasic,
CaH2PO4
H. Micronutrient Stock
Boric Acid, H3BO3
Manganese chloride, MnCl2* 4 H20
Zinc sulfate, ZnSO4 * 7 H2O
Copper sulfate, CuSO4 * 5 H2O
Molybdic acid, MoO3*H2O
I. Fe (Sequestrene)
J. Sodium Chloride, NaCl
K. Nickel Chloride, NiCl2*6H2O
1M
1M
1M
1M
0.5 M
1M
0.05M
(g/L)
2.86
1.81
0.22
0.08
0.02
21.0
250
0.81
2 mM
3 mM
2 mM
1 mM
2.5 mM
2 mM
1 mM
1ml/L
1ml/L
†Pre-Culture Solution: The nutrient solution was prepared using the following mL of
stock solution per liter of final solution: 2ml of stock A; 3ml of stock B; 2ml of stock C;
1ml of stock D; 1 ml of stock H; 1 ml of stock I.
‡Minus N Solution: The nutrient solution was prepared using the following mL of stock
solution per liter of final solution: 5ml of stock E; 2 ml of stock F; 20 ml of stock G; 1 ml
of stock H; 1 ml of stock I.
§Ni Treatments: The nutrient solution was prepared using the following mL of stock
solution per liter of final solution: 1 ml of stock K for 200 μg/L Ni treatments; 2 ml of
stock K for 400 μg/L Ni treatments.
¶ NaCl Treatments: The nutrient solution was prepared using the following mL of stock
solution per liter of final solution: 10 ml/L of stock J.
Page 114
94
Table 4.2. N concentration in leaf tissue of ‘Diamond’ zoysiagrass
and ‘TifEagle’ bermudagrass as influenced by salinity regime, Ni
level, and species in Clemson University Greenhouse Research
Complex during 2011 at three harvest events (3,6 and 9 weeks after
initiation of treatments).
Main effects
Salinity (S)
Control
5,000 ppm
Ni Level (µg L-1
)
Control
200
400
LSD0.05
Species (SP)
Diamond
TifEagle
Run (R)
1
2
3 Week
6 Week
9 Week
-----------------% DW------------------
3.21
3.13
3.21
3.14
3.16
NS
3.02
3.33
2.81
3.53
2.74
2.72
2.90
2.64
2.65
0.14
2.59
2.87
2.37
3.09
1.99
1.92
2.01
1.99
1.88
NS
1.90
2.02
1.77
2.15
ANOVA
Source of variation†
S
Ni
SP
R
S*Ni
S*SP
Ni*SP
S*Ni*SP
S*R
Ni*R
S*Ni*R
SP*R
S*SP*R
Ni*SP*R
S*Ni*SP*R
NS
NS
***
***
NS
NS
NS
*
NS
NS
NS
***
NS
NS
NS
NS
***
***
***
NS
NS
NS
NS
NS
NS
NS
*
NS
NS
NS
NS
NS
NS
***
NS
NS
NS
NS
NS
NS
NS
NS
NS
NS
NS
* Significant at the 0.05 probability level.
** Significant at the 0.01 probability level.
*** Significant at the 0.001 probability level.
† Main effect and interactions including Run (R) exhibited
differences in magnitude, not changes in trend.
Page 115
95
Table 4.3. Ni concentration in leaf tissue of ‘Diamond’ zoysiagrass
and ‘TifEagle’ bermudagrass as influenced by salinity regime, Ni
level, and species in Clemson University Greenhouse Research
Complex during 2011 at three harvest events (3,6 and 9 weeks after
initiation of treatments).
Main effects
Salinity (S)
Control
5,000 ppm
Ni Level (µg L-1
)
Control
200
400
LSD0.05
Species (SP)
Diamond
TifEagle
Run (R)
1
2
3 Week
6 Week
9 Week
------------------mg kg-1
----------------
1.02
1.18
0.42
1.12
1.75
0.25
1.30
0.89
1.21
0.99
1.13
1.48
0.31
1.31
2.30
0.28
1.73
0.89
1.28
1.33
4.87
3.84
0.35
4.25
8.47
1.09
6.18
2.53
2.71
6.01
ANOVA
Source of variation†
S
Ni
SP
R
S*Ni
S*SP
Ni*SP
S*Ni*SP
S*R
Ni*R
S*Ni*R
SP*R
S*SP*R
Ni*SP*R
S*Ni*SP*R
NS
***
***
*
NS
NS
***
NS
**
NS
NS
NS
NS
NS
NS
**
***
***
NS
NS
NS
***
NS
NS
NS
NS
*
NS
NS
NS
*
***
***
***
NS
NS
***
NS
**
***
NS
*
NS
NS
NS
* Significant at the 0.05 probability level.
** Significant at the 0.01 probability level.
*** Significant at the 0.001 probability level.
† Main effect and interactions including Run (R) exhibited
differences in magnitude, not changes in trend.
Page 116
96
Table 4.4. Urease activity in leaf tissue of ‘Diamond’ zoysiagrass and
‘TifEagle’ bermudagrass as influenced by salinity regime, Ni level,
and species in Clemson University Greenhouse Research Complex
during 2011 at three harvest events (3,6 and 9 weeks after initiation of
treatments).
Main effects
Salinity (S)
Control
5,000 ppm
Ni Level (µg L-1
)
Control
200
400
LSD0.05
Species (SP)
Diamond
TifEagle
Run (R)
1
2
3 Week
6 Week
9 Week
---------μmol NH4+ min
-1 g
-1--------
486.91
448.70
185.13
563.60
654.69
134.50
545.65
389.96
486.61
449.01
587.75
639.71
160.46
797.57
883.16
170.91
639.36
588.10
587.81
639.65
533.14
534.30
202.61
664.70
733.85
134.80
545.11
522.32
626.13
441.30
ANOVA
Source of variation†
S
Ni
SP
R
S*Ni
S*SP
Ni*SP
S*Ni*SP
S*R
Ni*R
S*Ni*R
SP*R
S*SP*R
Ni*SP*R
S*Ni*SP*R
NS
***
**
NS
NS
NS
NS
NS
NS
NS
NS
NS
NS
NS
NS
NS
***
NS
NS
NS
NS
NS
NS
NS
NS
NS
NS
NS
NS
NS
NS
***
NS
**
*
NS
NS
NS
NS
***
NS
NS
NS
NS
NS
* Significant at the 0.05 probability level.
** Significant at the 0.01 probability level.
*** Significant at the 0.001 probability level.
† Main effect and interactions including Run (R) exhibited differences
in magnitude, not changes in trend.
Page 117
97
Table 4.5. Amino acid content in leaf tissue of ‘Diamond’ zoysiagrass
and ‘TifEagle’ bermudagrass as influenced by salinity regime, Ni
level, and species in Clemson University Greenhouse Research
Complex during 2011 at three harvest events (3,6 and 9 weeks after
initiation of treatments).
Main effects
Salinity (S)
Control
5,000 ppm
Ni Level (µg L-1
)
Control
200
400
LSD0.05
Species (SP)
Diamond
TifEagle
Run (R)
1
2
3 Week
6 Week
9 Week
-----------------mg g
-1 FW----------------
16.73
16.99
13.40
17.99
19.19
1.56
18.22
15.50
14.68
19.04
16.61
17.69
12.27
19.05
20.14
1.94
20.26
14.04
18.23
16.07
42.43
39.59
26.55
48.11
48.36
3.86
44.66
37.35
39.35
42.67
ANOVA
Source of variation†
S
Ni
SP
R
S*Ni
S*SP
Ni*SP
S*Ni*SP
S*R
Ni*R
S*Ni*R
SP*R
S*SP*R
Ni*SP*R
S*Ni*SP*R
NS
***
***
***
NS
NS
**
NS
NS
NS
NS
NS
NS
NS
NS
NS
***
***
**
NS
NS
***
NS
NS
NS
NS
NS
NS
NS
NS
NS
***
**
*
NS
NS
***
NS
NS
NS
NS
NS
NS
NS
NS
* Significant at the 0.05 probability level.
** Significant at the 0.01 probability level.
*** Significant at the 0.001 probability level.
† Main effect and interactions including Run (R) exhibited differences
in magnitude, not changes in trend.
Page 118
98
Table 4.6. Ni concentration (mg kg-1
) of leaf tissue of ‘Diamond’ zoysiagrass and
‘TifEagle’ bermudagrass as influenced by Ni level in Clemson University Greenhouse
Research Complex during 2011 at3,6, & 9 weeks.
Species
TifEagle
Diamond
Ni Level (µg L-
1)
Control
200
400
Control
200
400
3 wk
6 wk
9 wk
----------------------------------mg kg-1
-------------------
------
0.47d
0.96c
1.44b
0.34d
1.36b
2.42a
0.29d
0.99c
1.43b
0.30d
1.64b
3.26a
0.36d
2.75c
6.10b
0.15d
6.66b
13.14a
Means within a column followed by the same letter are not significant different at p≤0.05
by protected LSD.
Page 119
99
Table 4.7. Total amino acid content (mg-1
g-1
) of leaf tissue of ‘Diamond’ zoysiagrass and
‘TifEagle’ bermudagrass as influenced by Ni level in Clemson University Greenhouse
Research Complex during 2011 at 3,6, & 9 weeks.
Species
TifEagle
Diamond
Ni Level (µg L-
1)
Control
200
400
Control
200
400
3 wk
6 wk
9 wk
----------------------------------mg g
-1FW-----------------
------
14.05cd
15.65bc
16.79b
12.74d
20.33a
21.6a
12.32c
15.12b
14.70bc
12.22c
22.99a
25.58a
28.15c
40.88b
43.02b
24.96c
55.33a
53.70a
Means within a column followed by the same letter are not significantly different at
p≤0.05 by protected LSD.
Page 120
100
Figure 4.1. Images of Diamond (L) and TifEagle (R) growth under two salinity levels
(Control, 5,000 ppm NaCl) and three Ni2+ supplementation regimes (Control, 200, and
400 µg L-1
Ni2+) at the conclusion of the study.
Page 121
101
Weeks
2 4 6 8 10
m
ol N
H4
+ m
in-1
g-1
0
200
400
600
800
1000 Control
200 g Ni
400 g Ni
Figure 4.2. Urease activity (μmol NH4+ min
-1 g
-1FW) in leaf tissue of
‘Diamond’zoysiagrass and ‘TifEagle’ bermudagrass as influenced by Ni2+
level in the
Clemson University greenhouse research complex over three harvest dates during 2011.
Means were separated at p≤0.05 by protected LSD.
Page 122
102
Weeks
2 4 6 8 10
mg
-1g
-1 F
W
0
10
20
30
40
50
60
Control
200 g
400 g
Figure 4.3. Total amino acid content (mg g-1
FW) in leaf tissue of ‘Diamond’ zoysiagrass
and ‘TifEagle’ bermudagrass as influenced by Ni2+
level in the Clemson University
greenhouse research complex over three harvest dates during 2011. Means were
separated at p≤0.05 by protected LSD.
Page 123
103
Weeks
3 6 9
mg
-1g
-1 F
W
0
10
20
30
40
50Diamond
TifEagle
Figure 4.4. Total amino acid content (mg g-1
FW) in leaf tissue of ‘Diamond’ zoysiagrass
and ‘TifEagle’ bermudagrass in the Clemson University greenhouse research complex
over three harvest dates during 2011. Means were separated at p≤0.05 by protected LSD.
Page 124
104
Weeks
3 6 9
N c
on
cen
tratio
n %
/DW
0
1
2
3
4Diamond
TifEagle
Figure 4.5. Nitrogen concentration (% DW) in leaf tissue of ‘Diamond’ zoysiagrass and
‘TifEagle’ bermudagrass in the Clemson University greenhouse research complex over
three harvest dates during 2011. Means were separated at p≤0.05 by protected LSD.
Page 125
105
Weeks
3 6 9
Ni C
on
cen
tratio
n m
g k
g-1
0
2
4
6
8
10
12Control
200 g Ni
400 g Ni
Figure 4.6. Nickel concentration (mg kg-1
) in leaf tissue of ‘Diamond’ zoysiagrass and
‘TifEagle’ bermudagrass in the Clemson University greenhouse research complex over
three harvest dates during 2011. Means were separated at p≤0.05 by protected LSD.
Page 126
106
Figure 4.7. Main effect of Ni2+
level (µg L-1
) on clipping yield at the conclusion of the
study in the Clemson University greenhouse research complex during 2011. Means were
separated at p≤0.05 by protected LSD.
Ni Level g L-1
Control 200 400
Clip
pin
g Y
ield
g m
-2
0
100
200
300
400
500
600
Page 127
107
Figure 4.8. Clipping yield of Diamond zoysiagrass and TifEagle bermudagrass as
influenced by Ni2+
level (µg L-1
) at the conclusion of the study in the Clemson University
greenhouse research complex during 2011. Means were separated at p≤0.05 by protected
LSD.
Ni Level g L-1
Control 200 400
Clip
pin
g Y
ield
g m
-2
0
100
200
300
400
500
600
700Diamond
TifEagle
Page 128
108
CHAPTER V
NICKEL TOXICITY AND UREA N METABOLISM IN TWO WARM-SEASON
TURFGRASS SPECIES
Introduction
The stimulation of urea N metabolism by increases in urease activity and amino
acid pools with Ni2+
supplementation in warm-season turfgrasses was achieved in the
previous chapter. To further examine Ni2+
nutrition and urea N metabolism in TifEagle
bermudagrass and Diamond zoysiagrass, a third study was conducted. Ni2+
deficiency is
thought to not commonly occur in turfgrass management due to the very small
concentration required for plant metabolism. Due to this fact there has been little
research determining critical deficiency and toxicity levels in many plants, including
turfgrasses.
Typically, an elevated level of Ni2+
in plant tissue is more common due to
increased industrial pollution, and regions that possess serpentine soils containing
elevated levels of Ni2+
(Reeves et al., 1999; Chen et al., 2009). Nickel toxicity can
negatively affect plant health in a number of ways including: disruption of
photosynthesis, induction of micronutrient deficiencies, oxidative stress, and reduction of
growth. Currently there is a lack of research examining Ni2+
nutrition and toxicity in
turfgrasses. Based upon the Ni2+
concentrations in the leaf tissue, overall health, and urea
N metabolism of TifEagle and Diamond in the previous chapter, the goal of this study
was to further examine the influence of Ni2+
on plant metabolism by significantly
increasing Ni2+
supplementation levels.
Page 129
109
This study was conducted to 1) assess urea N metabolism of two turfgrass species
after foliar applications of urea nitrogen, 2) ) determine critical Ni2+
toxicity levels in two
warm-season turfgrasses, and 4) document Ni2+
toxicity symptoms and responses of two
turfgrass species.
Materials and Methods
Experiments included two repeated studies at the Clemson University Greenhouse
Research Complex. Study 1 was conducted from April 9th
-May 21st 2012 (6 weeks).
Greenhouse conditions averaged 25°C temperature and 59% relative humidity. Average
maximum and minimum temperatures were 31°C and 18°C respectively. Study II was
conducted from April 23rd
-June 4th
2012 (6 weeks). Greenhouse conditions averaged
26.5°C temperature and 63% relative humidity. Average maximum and minimum
temperatures were 31.5°C and 18.5°C respectively. Sixteen 15.24 cm plugs of each
species: TifEagle’, ultradwarf bermudagrasses and Diamond zoysiagrass were harvested
from turfgrass research plots at Clemson University and transplanted into 15.24 cm pots
and thoroughly watered and transferred into the Clemson University Greenhouse
Research Complex. Evapotranspiration (ET) was determined gravimetrically over a 72
hour period to determine water loss/irrigation requirement over the course of the study.
Prior to initiation of treatments, each pot was flushed with minus N nutrient solution
derived from Hoagland and Arnon (1950) (Table 5.1). Nickel treatments were applied to
replace ET 3x weekly. Weekly foliar applications of urea Nat 9.8 kg ha-1
at a carrier
volume of 561 L-1
ha-1
were conducted with a CO2 pressurized backpack sprayer.
Treatments consisted of four Ni2+
levels supplied as NiCl2 [Control, 400, 800, and 1600
Page 130
110
µM (Table 5.1)] to determine the effects of supplemental Ni2+
applications on N
metabolism. Weekly foliar applications of urea N at 9.8 kg ha-1
at a carrier volume of
561 L-1
ha-1
were conducted to supply 0.54 kg N for the duration of the study.
Applications of lambda-cyhalothrin (Scimitar GC) at 538.2 ml ha-1
were made twice
during the study for control of Banks grass mites (Oligonychus pratensis).
Turfgrass Harvest and Parameters Measured
Turfgrass clippings were harvested at the conclusion of the study. Roots were
harvested at the conclusion of the studies and kept at 80°C until further analysis.
Parameters measured in turfgrass clippings included: urease activity, total amino acid
content, tissue nutrient concentration and clipping yield.
Urease Assay
Methodology is listed in appendix B.
Amino Acid Assay
Methodology is listed in appendix B.
Mineral Nutrient Concentration Analysis
Tissue nutrient concentrations were determined by the following methodologies:
Tissue N analysis was done by combustion utilizing a LECO FP528 N combustion
analyzer (St. Joseph, MI). Mineral analysis of leaf tissue for P, K+, Ca
2+, Mg
2+, Zn
2+,
Mn2+
, Cu2+
, Fe, and S by HNO3/H2O2 digestion, then analysis with ICP mass
spectrometry. Leaf tissue Na+ concentration was determined by weighing 1.0 gram
sample into a 150 mL beaker. One hundred milliliters H2O was added and placed on
Page 131
111
stirrer for 30 min. The mixture was filtered with metal filter and pour filtrate into a large
test tube. Analysis was conducted using ICP mass spectrometry.
Data Analysis
Data were analyzed by ANOVA with JMP 9.0 (SAS Institute Inc. Cary, NC).
Mean separations were performed using a Fisher’s protected LSD test at 5% probability
level.
Results
Ni2+
Toxicity Symptoms
As Ni2+
concentration in leaf tissue increased the TQ decreased. Nickel toxicity
symptoms including black lesions and overall chlorosis were exhibited in the 400, 800
and 1600 µM Ni2+
treatments (Figures 5.1-5.7).
Clipping Yield
Clipping yield was significantly influenced by the main effect of species and Ni2+
level. Diamond exhibited significantly greater clipping yield at 927.40 g m-2
compared to
TifEagle at 629.40 g m-2
at the conclusion of the study. As Ni2+
level increased, clipping
yield decreased (Figures 5.5 & 5.6). Under control treatments receiving no additional
Ni2+
, overall clipping yield was 964.49 g m-2
. Clipping yields of 858.96, 704.20, and
585.95 g m-2
were exhibited for 400, 800 and 1600 µM Ni2+
respectively. Overall, 1600
µM Ni2+
treatments reduced clipping yield by 39% compared to the control. Under 1600
µM Ni2+
treatments Diamond exhibited a 34.1% reduction in clipping yield whereas
TifEagle exhibited a 46.4% overall reduction.
Page 132
112
N Concentration
N concentration in leaf tissue was significantly influenced by species (Table 5.3).
TifEagle exhibited significantly higher N concentration than Diamond at 2.17 and 1.78
%DW respectively. Overall N concentration in leaf tissue was not affected by Ni2+
level.
Phosphorus Concentration
Species significantly affected P concentration in leaf tissue (Table 5.3). TifEagle
exhibited significantly higher P contents than Diamond at 0.26 and 0.19 % DW
respectively. All supplemental Ni2+
levels resulted in significantly lower P concentration
in leaf tissue. Control plants exhibited 0.25, followed by 0.23, 0.21, and 0.21 for 800,
400 and 1600 µM Ni2+
levels respectively. All Ni2+
levels resulted in similar P
concentrations and were not significantly different from each other.
Potassium Concentration
Diamond exhibited significantly higher K+ concentration in leaf tissue than
TifEagle at 1.12 and 1.07 % DW respectively (Table 5.3).
Ni2+
Concentration
Nickel concentration in leaf tissue was significantly influenced by the main
effects of species and Ni2+
level (Table 5.4). TifEagle exhibited significantly more Ni2+
in leaf tissue than Diamond at 257.56 and 130.09 mg kg-1
respectively. As Ni2+
level
increased, the Ni2+
concentration in leaf tissue increased correspondingly. Plants not
receiving supplemental Ni2+
exhibited overall Ni2+
concentration of 27.91 mg kg-1
,
whereas Ni2+
concentrations of 101.28, 226.54, and 419.57 mg kg-1
were exhibited for
400, 800 and 1600 µM Ni2+
respectively.
Page 133
113
Fe
The main effect of Ni2+
level significantly influenced Fe concentration in turfgrass
leaf tissue at the conclusion of the study. Nickel concentrations ranged from 74.72 mg
kg-1
in 800 µM Ni2+
treated plants; to 53.95 mg kg-1
in 1600 µM Ni2+
treated plants, a
significant decrease (Table 5.4). However, control plants, not receiving any additional
Ni2+
exhibited similar Fe concentrations as 800 and 1600 µM Ni
2+ treated plants at 56.85,
63.27 and 53.95 mg kg-1
respectively. No clear reduction or trend could be observed.
Cu2+
TifEagle exhibited significantly higher Cu2+
concentration in leaf tissue than
Diamond at the conclusion of the study at 9.90 and 7.62 mg kg-1
respectively (Table 5.4).
Nickel level significantly influenced Cu2+
concentration in leaf tissue also. Control
plants receiving no additional Ni2+
exhibited the greatest Cu2+
concentration at 9.44 mg
kg-1
, followed by 8.95 and 8.69 mg kg-1
for 800 and 400 µM Ni2+
treatments respectively.
The lowest Cu2+
concentration was found in plants subjected to 1600 µM Ni2+
treatments
at 7.96 mg kg-1
, significantly lower than all other treatments.
Zn2+
TifEagle exhibited significantly higher Zn2+
concentration in leaf tissue than
Diamond at the conclusion of the study at 24.87 and 23.47 mg kg-1
respectively. Nickel
level influenced Zn2+
concentration in leaf tissue (Table 5.4). Zn2+
concentrations of
25.84, 24.71, 23.74 and 22.40 were exhibited for 1600, 800, 0, and 400 µM Ni2+
levels
respectively. There was no clear trend between Ni2+
and Zn2+
concentration observed. It
Page 134
114
might be possible that increasing Ni2+
level resulted in higher concentrations of Ni2+
in
leaf tissue. Treatments of 1600 µM Ni2+
resulted in the greatest Zn2+
concentration.
Mn2+
TifEagle exhibited significantly higher Mn2+
concentration in leaf tissue than
Diamond at the conclusion of the study at 181.06 and 101.48 mg kg-1
respectively (Table
5.4). Nickel level affected Mn2+
concentration in leaf tissue. Concentrations of Mn2+
were
reduced by the 400 µM Ni2+
level which exhibited significantly lower than all other Ni2+
levels at 126.04 mg kg-1
. Mn2+
concentrations of 152.63, 144.14, and 142.27 were
displayed for 1600, 0, and 800 µM Ni2+
treatments respectively. No clear trend was
observed for Ni2+
level and Mn2+
concentration in leaf tissue.
Mg2+
TifEagle exhibited significantly higher Mg2+
concentration in leaf tissue than
Diamond at the conclusion of the study at 2106.97 and 1313.44 mg kg-1
respectively.
Nickel level significantly affected Mg2+
concentration in leaf tissue at the conclusion of
the study (Table 5.4). All supplemental Ni2+
levels resulted in significantly lower Mg2+
concentration than control treatments. Plants not receiving additional Ni2+
exhibited
Mg2+
concentrations of 1828.71 mg kg-1
, whereas all other treatments resulted in
concentrations of approximately 1600 mg kg-1
, a significant reduction. Increasing Ni2+
caused reductions in Mg2+
concentration in leaf tissue, suggesting a similar uptake
strategy.
Urease Activity
Page 135
115
Urease activity was determined at the conclusion of the study. Both main effects
(species and Ni2+
level) significantly influenced urease activity in leaf tissue (Table 5.2).
TifEagle exhibited significantly higher urease activity than Diamond at the conclusion of
the study at 106.49 and 81.30 μmol NH4+ min
-1 g
-1 respectively. Nickel level
significantly influenced the urease activity in leaf tissue. As Ni2+
level increased so did
the urease activity in leaf tissue. At 1600 µM Ni2+
, the average urease activity was
113.49 μmol NH4+ min
-1 g
-1, followed by 102.0 and 93.74 μmol NH4
+ min
-1 g
-1 for 800
and 400 µM Ni2+
levels respectively, which were not significantly different from each
other. Control plants not receiving supplemental Ni2+
exhibited the lowest urease
activity at 66.36 μmol NH4+ min
-1 g
-1.
Amino Acid Content
Amino acid content was determined at the conclusion of the study. Diamond and
TifEagle exhibited similar amino acid contents at 29.78 and 31 mg g-1
FW respectively.
Nickel level was the only main effect that significantly influenced amino acid content in
the leaf tissue (Table 5.2). 1600 µM Ni2+
treatments exhibited the greatest amino acid
content in leaf tissue at 41.14 mg g-1
FW. Amino acid contents in leaf tissue began to
decrease with 800 µM Ni2+
and control treatments resulting in similar contents at 30.60
and 25.93 mg g-1
FW respectively. The lowest amino acid contents in leaf tissue were
found in 400 µM Ni2+
treated plants with an average content of 23.90 mg g-1
FW which
wasn’t statistically different from control treatments.
Page 136
116
Discussion
Nickel toxicity decreased TQ, clipping yield, and influenced nutrient
concentration in leaf tissue. Although both species experienced reductions in growth,
TifEagle displayed greater reductions in clipping yield than Diamond when treated with
1600 µM Ni2+
. Under 1600 µM Ni2+
treatments Diamond exhibited a 34.1% reduction in
clipping yield whereas TifEagle exhibited a 46.4% overall reduction compared to control
treatments. However, TifEagle exhibited greater urease activity, N, P, and micronutrient
concentration than Diamond. This result could be due to a concentration of nutrients in
the reduced growth of the TifEagle leaf tissue.
Increasing Ni2+
level didn’t correspond to a clear decrease in other micronutrient
concentrations. Zinc concentrations in the leaf tissue actually increased with Ni2+
supplementation while other micronutrients didn’t exhibit any trend (Table 5.4). This
result further supports that theory of Ni2+
sharing the same uptake and transport
mechanism of micronutrients including Cu2+
and Mg2+
.
Supplemental applications of Ni2+
stimulated urease activity in the leaf tissue over
the course of the study which agrees with the findings of Krogmeier et al. (1991),
Gerendas et al. (1998), and Gerendas and Sattelmacher (1999) with soybean, rice and
spring rape respectively. Supplemental Ni2+
in the nutrient solution also increased the
total amino acid pool in leaf tissue, presumably due to enhanced urease activity, which
agrees with Gerendas and Sattelmacher (1999). Gerendas and Sattelmacher (1999)
contributed the increase in amino acid content to storage and transport forms (Gln, Asn,
Glu, and Asp). To further investigate this occurrence examination in specific amino acid
Page 137
117
pools and N metabolites needs to be conducted. Witte (2011) suggested that N starvation
and decreases in growth could be the result of elevated amino acid contents and urea as a
sole N source, which is a possibility in this study. Elevated levels of total amino acids in
leaf tissue might decrease the plant’s need to absorb and assimilate foliar applied urea N.
Visual signs of Ni2+
toxicity were recorded throughout the study. Critical toxicity
levels in plants are in the range of > 10 mg kg-1
dry weight for sensitive, and > 50 mg kg-1
dry weight in moderately tolerant species (Marschner, 1995). Under 1600 µM Ni2+
treatments, overall concentrations of Ni2+
in leaf tissue were 419.57 mg kg-1
. At this
concentration a reduction in growth and TQ was displayed and Ni2+
toxicity was likely
the cause. Plants receiving 400 and 800 µM Ni2+
also displayed reductions in growth
and overall TQ while control plants exhibited no toxicity symptoms and overall Ni2+
concentrations of 27.91 mg kg-1
. Nickel concentrations for 400 and 800 µM treatments
were 101.28 and 226.54 respectively, suggesting that the critical Ni2+
toxicity level in
warm season turfgrass begins at a range >25 mg kg-1
.
Conclusions
This is the first study examining Ni2+
toxicity and urea N metabolism of warm-
season turfgrasses. Stimulation of N metabolism was displayed through increases in
urease activity and amino acid content, however, increased Ni2+
concentration in leaf
tissue led to symptoms of toxicity, changes in nutrient status, reduction in growth,
decreases in TQ, and leaf necrosis. Due to the responses of Diamond and TifEagle under
Ni2+
stress the critical Ni2+
toxicity level in begins at a range >25 mg kg-1
. Nickel
Page 138
118
concentrations in leaf tissue greater than 25 mg kg-1
caused reductions in growth and
symptoms of toxicity.
This study examined Ni2+
toxicity using an 85:15 (sand: peat) root-zone which is
commonly used on putting surfaces throughout the world. The previous chapter
examined Ni2+
supplementation under solution culture and moderate salinity stress.
Different responses in nutrient status and urea N metabolism within plants were displayed
between these two studies which is common when comparing between soil and solution
culture. Under solution culture, amino acid levels were greater in Diamond than TifEagle
under moderate Ni2+
supplementation. However, TifEagle displayed greater overall N
concentration in leaf tissue than Diamond. In this experiment, a more direct examination
of Ni2+
supplementation and toxicity was displayed without the additional influence of
moderate salinity stress. TifEagle exhibited greater N, P, and micronutrient
concentrations in leaf tissue than Diamond under Ni2+
stress but displayed a greater
reduction in growth. This finding could be a result of a concentration of the mineral
nutrients in the reduced shoot growth of TifEagle.
Future research examining Ni2+
nutrition and toxicity needs to be conducted to
determine Ni2+
requirement under several N sources and multiple turfgrasses.
Additionally, research needs to be conducted to examine if Ni2+
supplementation aids in
foliar recovery of applied urea N and if foliar applications of Ni2+
can be made. Lastly,
research should focus on Ni2+
requirement of turfgrasses along with long term ecological,
physiological, and environmental implications of Ni2+
supplementation in turfgrass
environments.
Page 139
119
Table 5.1. Stock solutions and concentrations for nutrient solutions based
on Hoagland and Arnon (1950).
Nutrient
Stock Solution
Concentration
G. Magnesium sulfate, MgSO4 *7H2O 1M
H. Potassium sulfate, K2SO4 0.6 M
I. Magnesium sulfate, MgSO4 1M
D. Calcium Phosphate Monobasic,
CaH2PO4
0.05M
E. Micronutrient Stock (g/L)
Boric Acid, H3BO3 2.86
Manganese chloride, MnCl2*4H20 1.81
Zinc sulfate, ZnSO4 * 7H2O 0.22
Copper sulfate, CuSO4 * 5 H2O 0.08
Molybdic acid, MoO3*H2O 0.02
F. Fe (Sequestrene) 21.0
G. Nickel chloride, NiCl2*6H2O 0.81
Minus N Solution: The nutrient solution was prepared using the
following mL of stock solution per liter of final solution: 5ml of stock B;
2 ml of stock A; 20 ml of stock D; 1 ml of stock E; 1 ml of stock F.
Ni Treatments: The nutrient solution was prepared using the following
mL of stock solution per liter of final solution: 0 µM : 0 ml/L;400 µM :
25ml/L;800 µM : 50ml/L;1600 µM : 100ml/L
Page 140
120
Table 5.2. Urease activity and amino acid content in leaf tissue of
‘Diamond’ zoysiagrass and ‘TifEagle’ bermudagrass as influenced
by Ni level, and species in Clemson University Greenhouse
Research Complex during 2012.
Main effects
Ni Level µM (Ni)
Control
400
800
1600
LSD0.05
Species (SP)
Diamond
TifEagle
Urease
Amino Acid
-μmol NH4+ min
-1 g
-1- ------mg g
-1-------
66.3
93.7
102.0
113.49
12.60
81.30
106.49
25.9
23.9
30.6
41.1
5.6
29.7
31.0
ANOVA
Source of variation
Ni
SP
Ni*SP
***
***
**
***
NS
NS
* Significant at the 0.05 probability level.
** Significant at the 0.01 probability level.
*** Significant at the 0.001 probability level.
Page 141
121
Table 5.3. Macronutrient concentration (%DW) in leaf tissue of ‘Diamond’
zoysiagrass and ‘TifEagle’ bermudagrass as influenced by Ni level, and species in
Clemson University Greenhouse Research Complex during 2012.
Main effects
Ni Level µM (Ni)
Control
400
800
1600
LSD0.05
Species (SP)
Diamond
TifEagle
Nitrogen
Phosphorus
Potassium
------------------------------% DW----------------------------------
2.05
1.96
1.91
2.00
NS
1.78
2.17
0.25
0.21
0.23
0.21
0.01
0.19
0.26
1.13
1.09
1.07
1.11
NS
1.07
1.12
ANOVA
Source of variation
Ni
SP
Ni*SP
NS
***
NS
***
***
NS
NS
**
*
* Significant at the 0.05 probability level.
** Significant at the 0.01 probability level.
*** Significant at the 0.001 probability level.
Page 142
122
Table 5.4. Micronutrient concentration (mg kg-1
) in leaf tissue of ‘Diamond’ zoysiagrass and ‘TifEagle’ bermudagrass
as influenced by Ni level and species in Clemson University Greenhouse Research Complex during 2012.
Main effects
Ni Level µM (Ni)
Control
400
800
1600
LSD0.05
Species (SP)
Diamond
TifEagle
Ni
Fe
Cu
Zn
Mn
Mg
---------------------------------------------------------mg kg-1
------------------------------------------------------
27.91
101.28
226.54
419.57
49.35
130.09
257.56
56.85
63.27
74.72
53.95
15.45
57.52
66.52
9.44
8.69
8.95
7.96
0.65
7.62
9.90
23.74
22.40
24.71
25.84
1.65
23.47
24.87
144.14
126.04
142.27
152.63
14.50
101.48
181.06
1828.71
1683.30
1685.89
1642.91
105.82
1313.44
2106.97
ANOVA
Source of variation
Ni
SP
Ni*SP
***
***
***
*
NS
**
**
**
NS
**
*
***
*
***
***
*
***
*
* Significant at the 0.05 probability level.
** Significant at the 0.01 probability level.
*** Significant at the 0.001 probability level.
122
Page 143
123
Figure 5.1. Nickel toxicity symptoms on leaf tissue of Diamond (L) and TifEagle (R) under1600 µM Ni treatments.
123
Page 144
124
Figure 5.2. Nickel toxicity symptoms on leaf tissue of Diamond (L) and TifEagle (R) under 800 µM Ni treatments.
124
Page 145
125
Figure 5.3. Nickel toxicity symptoms on leaf tissue of Diamond (L) and TifEagle (R) under 400 µM Ni treatments.
125
Page 146
126
Figure 5.4. Nickel toxicity symptoms on leaf tissue of Diamond (L) and TifEagle (R) under control treatments.
126
Page 147
127
Figure 5.5. TifEagle bermudagrass growth reduction under five Ni2+
levels (Control, 400, 800, 1600 µM Ni2+
)
127
Page 148
128
Figure 5.6. Diamond zoysiagrass growth reduction under five Ni2+
levels (Control, 400, 800, 1600 µM Ni2+
)
128
Page 149
129
Figure 5.7. Diamond zoysiagrass and TifEagle TQ under five Ni2+
levels (Control, 400,
800, 1600 µM Ni2+
) at the conclusion of the study in the Clemson University greenhouse
research complex during 2012.
Page 150
130
CHAPTER VI
ROOT AND FOLIAR 15
N UREA RECOVERY OF THREE WARM-SEASON
TURFGRASS SPECIES
Introduction
Granular and foliar fertilization are the two most common ways to apply mineral
nutrients to turfgrasses. Granular fertilization targets root uptake while foliar fertilization
targets nutrient uptake through leaf tissue. Greater amounts of nutrients can be supplied
through granular fertility programs, however many benefits have been found with foliar
programs (Liu et al., 2008). Although commonly practiced in turfgrass management,
little is known about the uptake and assimilation of foliar applied fertilizers.
Labeled 15
N urea was utilized to examine the uptake, recovery, and distribution
of foliar and root applied fertilizers. Typically, research projects examining the
differences between root and shoot uptake of various N sources commonly employ
applications of granular fertilizers. Picchioni and Quiroga-Garza (1999) found that
‘TifGreen’ bermudagrass exhibited the greatest loss of applied 15
N under soluble urea
fertilization, reporting that plants under urea fertility regimes exhibited the smallest N
yield in leaf tissue compared to ammonium sulfate and ammonium nitrate fertility
programs. To more accurately examine the differences between root and leaf uptake,
soluble urea N was delivered directly to the root zone with a large syringe or by a CO2
pressurized sprayer. By utilizing this methodology, actual differences between uptake
and movement through the plant could be more thoroughly assessed.
Page 151
131
To further compare the two common delivery methods of urea N this study was
conducted to 1) assess 15
N recovery of three popular warm season turfgrass species
following foliar and root applications of urea nitrogen, 2) determine the effect of fertility
regime on 15
N recovery, and 3) establish fertilization recommendations for optimal
fertilizer recovery/efficiency.
Materials and Methods
Six 20.32 cm plugs of ‘Mini-Verde’ bermudagrass, and Diamond zoysiagrass, and
Seadwarf seashore paspalum were harvested from research plots at the Cliffs Research
Facility (Marietta, SC) in December 2009. The plugs were thoroughly washed of excess
root zone mix and transferred into 1 gallon plastic pots filled with 85%:15% sand: peat
v:v (USGA Green Section Staff, 1993) and irrigated until free drainage occurred. The
pots were then transferred into the Greenhouse Research Complex at Clemson
University. The turfgrasses were allowed to acclimatize establish before further
management was conducted. After a week in the greenhouse, fertilization took place
using Progressive Turf Products (Ball Ground, GA) 10N-1.3P-4.2K foliar fertilizer.
Fertilization took place on December 18th
2009 and January 29th
2010 delivering 9.77 kg-
1ha
-1 at 560 L
-1ha
-1. Two preventative applications of Daconil Ultrex (chlorothalinil)
were done. Pots were mown to a uniform height (1.27 cm) on February 25th
2010.
Treatment Procedure
Foliar applications of labeled urea @ 2% enrichment were applied at a rate of
9.77 kg ha
-1 with a pressurized Co2 backpack sprayer calibrated to deliver 560 L ha
-1. To
prepare the 15
N solution, 3.93 g of 2% labeled urea-N (Icon Isotopes, Summit, NJ) was
Page 152
132
mixed in 114.1 ml ddi water and thoroughly mixed in a 1L volumetric flask. Root
applications of urea N were prepared by diluting 1.94 g labeled urea @ 2% enrichment
into 1,000 ml H2O. Twenty ml of this solution was applied to five different areas in the
root zone with a 60 ml carpet syringe (Ideal Instruments HD AC14) to ensure uniform
application across each experimental unit. Total N delivered was determined in both
nutrient solutions (root and foliar). Samples were collected in Petri dishes and
thoroughly washed with 100 ml de-ionized distilled H2O before being tested for total N
by Kjeldahl digestion.
Sample Harvest
Turfgrass clippings, thatch and roots were harvested 8 hours after treatments were
applied from three replicate pots of each cultivar using a 10.8 cm soil probe. Leaf tissue
was sampled using electric clippers (Wahl) and placed into coin envelopes and dried at
80°C. The remaining sample including root material and thatch were divided, separated,
and placed into labeled paper bags and dried at 80° C until further analysis. Soil samples
were taken from each pot, placed in paper bags and dried at 80° C until further analysis.
15N Analysis
Analysis of isotopic 15
N in tissue samples and fertilizer applied was determined at
the University of Illinois at Urbana-Champaign using the automated Rittenburg technique
(Mulvaney et al., 1990), on a Nuclide/MAAS 3-60-RMS double mass spectrometer
(Nuclide Corporation, Bellefonte, PA). Recovery of 15N was determined by the
following: Recovery of fertilizer N in any fraction is calculated as:
100 x (S - B)/ (F - B)
Page 153
133
Where S is the atom % 15
N for the sample under analysis, F is the atom % 15
N for
the fertilizer used, and B is the atom % 15
N with no addition of labeled N (sometimes
assumed to be 0.3663 at. % 15
N, but likely closer to 0.370 at. % 15
N and preferably
determined for a control soil with no addition of labeled fertilizer). Further calculations
were made to determine total 15
N recovery that was derived from the labeled source.
Data Analysis and Experimental Design
The study was completely randomized design with three replications and a
factorial treatment arrangement with three turfgrass species and two fertility regimes.
Data was analyzed by ANOVA with JMP 9.0 (SAS Institute Inc. Cary, NC). Mean
separations were performed using a Fisher’s protected LSD test at 5% probability level.
Results
15N Recovery
Recovery of 15
N labeled urea was measured 8 hours after application in clippings,
thatch, roots and soil. Results of 15
N recovery will be determined by each respective
plant part, total recovery, and recovery in soil
Leaf tissue
Recovery of 15
N labeled urea in leaf tissue was significantly influenced by fertility
regime. When applied as a foliar application, recovery at 8 hours was 30.94% whereas
root applied urea resulted in a recovery of only 9.17% (Figure 6.1).
Thatch
Recovery of 15
N labeled urea in thatch was significantly influenced by fertility
regime. When applied as a root application, recovery at 8 hours was 18.73% whereas
Page 154
134
foliar applied urea resulted in a recovery of only 2.85% (Figure 6.2). Recovery in thatch
was also influenced by species, and an interaction between fertility regime*species.
Diamond exhibited recoveries of 14.11% in thatch tissue, which was significantly higher
than the recovery in Seadwarf at 7.03%. MiniVerde exhibited similar levels of labeled
urea in thatch tissue as MiniVerde and Seadwarf at 11.25%, which was not statistically
different from either species. The interaction of fertility regime*species further displays
the influence of fertility regime on 15
N thatch recovery. All root applications of urea N
resulted in significantly higher recoveries in thatch tissue than foliar treatments. Within
root treatments, Diamond and MiniVerde exhibited similar 15N recoveries at 24.53 and
20.82%, which were both significantly increased over recovery in Seadwarf at 10.84%.
Root tissue
Recovery of 15
N labeled urea in root tissue was significantly influenced by
fertility regime. When urea was applied as a root application, recovery at 8 hours was
19.48% whereas foliar applied urea resulted in a recovery of only 3.76% in root tissue
(Figure 6.3).
Total 15
N recovery and soil 15
N retention
Overall 15
N recovery in plant tissue was not significantly influenced by fertility
regime or species. Overall recovery for foliar fertilization was 37.56% compared to
47.39% for root applications of urea (Figure 6.4). Recoveries of 47.62%, 44.66%, and
35.14 % were exhibited for Seadwarf, Diamond, and MiniVerde respectively (Figure
6.5). At 8 hours after treatments were made, significantly more labeled urea was found in
the soil of plants receiving root applications. 15
N recovery of 5.55% was exhibited for
Page 155
135
root applications whereas foliar applications of urea resulted in only 0.83% recovery in
the soil (Figure 6.6).
Discussion
Total plant recovery of 15
N labeled urea derived from fertilizer was not
significantly different in either fertility regime or species tested. Although not
statistically different, root applications of urea N resulted in 10% higher total 15
N
recovery than foliar treatments at 8 hours after application. Stiegler et al. (2011) found
overall foliar absorption ranging from 38-62% for TifEagle bermudagrass under field
conditions, which is slightly greater than foliar recovery in the present study at 37.56%.
In addition, foliar absorption values ranging from 30-60% were found by in many cool-
season turfgrass species (Bowman and Paul, 1989; Bowman and Paul, 1990; Bowman
and Paul, 1992). Henning et al. (2009) quantified foliar urea-N uptake of 25-30% on
creeping bentgrass within 6 hours after application. There were also differences in total
plant recovery across species although not statistically significant. MiniVerde displayed
the lowest total 15
N recovery at 8 hours at 35.14%, which was much lower than Diamond
and Seadwarf at 44.66% and 47.62% respectively. Differences in 15
N recovery displayed
in these studies could be due to environmental conditions, species, methodology, and
sampling techniques.
Stiegler et al. (2011) found that foliar applications of 1.25 g N m-2
were less
efficient than 0.5 g N m-2
when expressed as percent of applied N in creeping bentgrass
and bermudagrass putting surfaces. Foliar and root applications of 0.97 g N m-2
were
used in this study. It is possible that reducing the N rate could increase total recovery in
Page 156
136
the turfgrass. Due to the possibility that increased N rates could result in precipitation of
the N out of the spray droplet on the leaf tissue and therefore reduce total absorption
(Stiegler et al., 2011).
Recovery of labeled urea in each plant part was significantly influenced by
fertility regime, and was anticipated. Foliar applications of urea resulted in higher
recovery in leaf tissue while root applications resulted in elevated 15
N recoveries in root
tissue. Total 15
N recovery was also significantly higher in root applications than foliar
fertilization. In addition to recovery in specific plant tissue, root applications of urea N
resulted in significantly higher 15
N retention in soil than foliar applications, however
overall recovery of 15
N derived from fertilizer was higher in root treatments. The 10%
overall reduction in 15
N recovery for foliar treatments could be due to a number of
factors, including volatilization. However, foliar fertilization resulted in significantly less
15N urea in the soil. This is beneficial due to the problems with fertilizer loss, leaching,
ecological implications, etc.
The disparity, although not statistically different, in total 15
N recovery due to
fertility regime is worth examining more closely. 15
N labeled urea retained in the soil
(5.55%) 8 hrs after root applications has the ability to be taken up by the plant potentially
increasing the overall recovery over time. Foliar treatments resulted in 15
N recovery in
the soil of <1%. Leaching and volatilization losses were not quantified for this study,
and account for the large portion of N lost when sampling took place.
Page 157
137
Conclusions
Foliar fertilization has become commonplace in turfgrass management due to the
ability of managers to tank mix fertility programs with pesticides to correct plant
deficiencies while controlling turfgrass pests. Based on our results, foliar and root
applications of urea N resulted in overall recovery in plant tissue of 37 and 47%.
Significant fertilizer loss (up to 63% of applied N) was exhibited that could be due to a
number of reasons. More research is necessary to increase the uptake of applied urea N
in foliar and root delivery methods.
Many management strategies have been employed to improve fertility uptake and
retention in turfgrass ecology. In addition to traditional management strategies, one
approach might examine and potentially modify the turfgrass cuticle to improve foliar
penetration of soluble N sources. In addition, Stiegler et al. (2011) suggests using low
application rates (< 0.5 g N m-2
), waiting several hours to maximize foliar absorption, and
watering in residual unabsorbed N off the canopy into the rootzone will maximize uptake
efficiency. Further examination of N rates and carrier volume could prove beneficial in
increasing foliar applied urea N recovery.
Secondly, urea must be hydrolyzed by the nickel dependent enzyme urease before
it can be incorporated into organic N containing compounds. Through examination of
urea N metabolism and hydrolysis, it might be possible to improve foliar and root
recovery. Further research into N metabolism needs to be conducted to examine reduce
fertility inputs while increasing plant uptake and assimilation. Long term (>8hours)
Page 158
138
recovery, partitioning and uptake efficiency needs to be conducted to further examine the
differences in delivery method of urea N in warm-season turfgrass management.
Page 159
139
Fertility Regime
Foliar Root
%1
5N
Re
co
ve
ry
0
10
20
30
40
Figure 6.1. Overall % 15
N recovery in leaf tissue following foliar and root
applications of labeled urea N at the Clemson University greenhouse research
complex 8 hours after treatments were initiated. Means were separated at P≤0.05
by protected LSD.
Page 160
140
Fertility Regime
Foliar Root
% 1
5N
Recovery
0
5
10
15
20
25
Figure 6.2. Overall % 15
N recovery in thatch tissue following foliar and root applications
of labeled urea N at the Clemson University greenhouse research complex 8 hours after
treatments were initiated. Means were separated at P≤0.05 by protected LSD.
Page 161
141
Fertility Regime
Foliar Root
% 1
5N
Recovery
0
5
10
15
20
25
Figure 6.3. Overall % 15
N recovery in root tissue following foliar and root applications of
labeled urea N at the Clemson University greenhouse research complex 8 hours after
treatments were initiated. Means were separated at P≤0.05 by protected LSD.
Page 162
142
Fertility Regime
Foliar Root
Tota
l %
15N
Recovery
0
10
20
30
40
50
60
Figure 6.4. Total % 15
N recovery following foliar and root applications of labeled urea N
at the Clemson University greenhouse research complex 8 hours after treatments were
initiated. Means were separated at P≤0.05 by protected LSD.
Page 163
143
Species
Seadwarf Diamond MiniVerde
To
tal %
15N
Re
co
ve
ry
0
10
20
30
40
50
60
Figure 6.5. Total % 15
N recovery of Diamond, MiniVerde and Seadwarf at the Clemson
University greenhouse research complex 8 hours after treatments were initiated. Means
were separated at P≤0.05 by protected LSD.
Page 164
144
Fertility Regime
Foliar Root
% 1
5N
Re
co
ve
ry
0
1
2
3
4
5
6
7
Figure 6.6. Total % 15
N recovery in soil following foliar and root applications of labeled
urea N at the Clemson University greenhouse research complex 8 hours after treatments
were initiated. Means were separated at P≤0.05 by protected LSD.
Page 165
145
CHAPTER VII
EFFECTS OF VARYING RATES OF NITROGEN AND TRINEXAPAC-ETHYL ON
PUTTING GREEN PERFORMANCE OF ‘DIAMOND’ ZOYSIAGRASS IN THE
TRANSITION ZONE
Introduction
Turfgrasses managers in the Southern transition zone and further south have had a
difficult choice when deciding what turfgrass species to establish on putting greens. The
choices have commonly been between creeping bentgrass and dwarf bermudagrass
varieties. Developments in turfgrass genetics and breeding has led to ultradwarf
bermudagrass varieties that are more heat and drought tolerant than their bentgrass
counterparts (McCarty, 2011). However, these relatively new ultradwarf varieties have
their limitations too, including shade and cold tolerance. To further complicate the
choice, a new turfgrass option for putting greens are fine leafed zoysiagrass cultivars
including Diamond (Menchyk et al., 2012).
Diamond is a fine textured warm-season turfgrass with excellent shade, salt, and
cold tolerance. Atkinson et al. (2011) found that Diamond zoysiagrass could be grown
successfully at putting green mowing heights with the application of trinexapac-ethyl
(TE) under 60% shade. The popularity of Diamond zoysiagrass has grown in the past
few years with many fairway, tee, and collar installations on golf courses. Recently,
turfgrass managers in the Southeast USA have begun to utilize Diamond on putting
greens. However, little is known about the management, health, and performance of fine
Page 166
146
leafed zoysiagrass cultivars in such a scenario. This study was conducted to examine the
management of Diamond zoysiagrass in a putting green scenario.
The objective of this study was to evaluate the influence of foliar applied
ammonium nitrate, and trinexapac-ethyl on Diamond zoysiagrass putting green
performance by (1) measuring ball roll distance (speed), (2) determining surface
firmness, (3) measuring thatch accumulation (4) examining tissue nutrient concentrations,
and (5) measuring turf quality.
Materials and Methods
Plant Material
Diamond zoysiagrass was established by sprigs (New Life Turf) on July 8, 2008
at the Cliffs Research Facility in Marietta, SC. The plots were constructed as USGA
specification greens with an 85:15 root-zone and subsurface drainage (USGA green
section, 1993). For the duration of the growing season the plots were mowed daily at
3.2mm. During winter dormancy, the plots were not mowed, covered, over-seeded, or
painted.
Treatment
Treatments of 4.9, 9.8, and 14.7 kg N ha-1
ammonium nitrate were applied
foliarly. Trinexapac- ethyl (TE; Primo MAXX (EC) 11.3% ai. Syngenta Chem. CO.,
Greensboro, NC.) was applied at 0 L a.i ha-1
or 0.017 L a.i ha-1
. Treatments in 2009 were
initiated on July 28th
and finished on September 10th
. In 2010, treatments began on May
20th
and terminated on August 25th
. For the duration of the study in 2009 total N
treatments lasted 7 weeks totaling – 34.3, 68.6, and 102.9 kg N ha-1
, respectively, for the
Page 167
147
three treatments. For the duration of the study in 2010 total N treatments lasted 15 weeks
resulting in 73.5,147, and 220.5 kg N ha-1
, respectively, for the three treatments. TE
applications for 2009 and 2010 were the same and totaled 0.120 L ai/ha starting in July
and ending in September at a biweekly rate of 0.017 L a.i ha-1
. Treatments were applied
using a CO2 pressurized backpack sprayer delivering 561 L ha -1
. Plots measuring 0.91 x
3.66 M were arranged in a completely randomized design with three replications.
Parameters Measured
Weekly readings of turf quality were performed. Color, texture, density, and
playability were factored into the ratings (1-9 >6 acceptable, where 1=dead turf and 9 =
perfect turf). Thatch was measured monthly, coinciding with Trufirm™ readings. Four
subsamples were taken in each plot corresponding to the four firmness readings with a
soil sampler. Each thatch sample was oven-dried at 72 Co for 48 hours. Loss on ignition
(thatch ash-free) data was determined as follows. After drying the samples, shoot and
excess root materials were excised and a dry weight of the remaining thatch was
recorded. Samples were then ashed at 525 Co for 2 hours using a muffle furnace
(Omegalux LMF-A550). The ashed weight was recorded and the total organic material
was determined. Surface firmness was measured using Trufirm™ (USGA) monthly.
Trufirm measures the penetration in fractions of an inch. Four subsamples were taken in
each plot and averaged. Ball rolling distance was measured using a Stimpmeter (USGA)
weekly. Means were analyzed using JMP Version 9 (Cary, NC).
Page 168
148
Results
Turf Quality
Turf quality was significantly influenced by the main effect of N fertility rate.
14.7 kg N ha-1
treatments exhibited significantly higher TQ than plots receiving 4.9 kg N
ha-1
and 0 kg N ha-1
weekly. Treatments of 14.7 and 9.8 kg N ha-1
exhibited similar TQ
during the study at 6.99 and 6.96 respectively. Only control treatments displayed TQ
values below the acceptable level of 6.0 (Figure 7.1). TE had no main effect on TQ
throughout the study. TQ was significantly influenced by the month in which it was
recorded, due to fluctuations in seasonal turfgrass growth. Differences in overall TQ
were exhibited across the 8 months, however only November 2010 exhibited overall TQ
values below the minimally acceptable level. The main effect of year was significant in
turf quality, with 2010 exhibiting significantly lower values. This result was possibly due
to the duration of treatments during 2010 season, and can be more fully examined in the
N level*year interaction which was highly significant. During 2009, all of the N levels
resulted in very similar TQs ranging from 6.57 to 7.01. During 2010, the TQ values were
more varied, ranging from 4.63 for the control treatments, to 7.40 for 14.7 kg N ha-1
treatments. A month*year interaction was also seen, where every month except
September in 2009 resulted in significantly higher TQ values. In September of both
years, the TQ was not significantly different.
Clipping Yield
Clipping yield was significantly affected by the main effect of N level, TE regime
and harvest date. Increases in clipping were exhibited as N rate increased. Control plots
Page 169
149
receiving 0 kg N ha-1
exhibited 2.83 g m-2
, whereas 3.42, 3.99, and 4.72 g m-2
clipping
yields were displayed for 4.9, 9.8 and 14.7 kg N ha-1
respectively. TE decreased clipping
yield significantly with control plots exhibiting 4.29 g m-2
, a 32% increase over plots
receiving TE at 3.19 g m-2
. The date in which clippings were harvested significantly
affected the yield. The greatest yield occurred in August 2009 at 5.97 g m-2
, followed by
4.76, 2.69, and 1.53 g m-2
for July 2010, August 2010, and September 2009 respectively.
N level* harvest date interaction took place that exhibited that in 2009, both harvests
resulted in similar clipping yields across all N levels. This is probably due the duration
of treatments in 2009. In 2010, a clear and significant N level affect was exhibited at
both harvest dates. At each harvest in 2010, increasing N rates led to increased clipping
yields. In July 2010, applications of 14.7 kg N ha-1
resulted in a clipping yield of 6.94 g
m-2
, whereas N levels of 9.8, 4.9, and 0 kg N ha-1
displayed yields of 5.38, 3.99, and 2.74
g m-2
respectively. The August harvest exhibited the same trend with clipping yields of
4.30, 3.19, 2.19, and 1.07 g m-2
for each N level. Lastly, TE regime* harvest date
interaction was significant and displayed that at each harvest, TE reduced clipping yield
over the control plots not receiving TE (Table 7.3).
N Concentration
N concentration of leaf tissue, expressed in %DW, was significantly affected by N
rate (Table 7.2). As N rate increased, the N concentration of the leaf tissue increased.
Under 14.7 kg N ha-1
treatments, leaf tissue N concentration reached 3.14 %/DW,
whereas control treatments receiving 0 kg N ha-1
exhibited 2.20 % N / DW. TE regime
had no effect on N concentration of leaf tissue. However, there was a main effect of time
Page 170
150
on N concentration. Over the course of the study there were four harvests. In 2009,
harvests took place in August and September and in 2010, July and August. The August
2009 harvest exhibited the greatest overall N concentration in leaf tissue at 3.40%/DW.
Each harvest was significantly different with both 2009 harvests exhibited higher N
contents than both 2010 harvests. The lowest N concentration in leaf tissue was
exhibited in August 2010 at 2.22 %/DW. An N rate*harvest date interaction took place.
During the August 2009 harvest, each fertility level resulted in significantly higher N
concentration in the leaf tissue, except 4.9 kg ha-1
which was similar to the control
fertility level. The September 2009 harvest resulted in N concentrations being similar in
all treatments except for plots receiving 9.8 kg ha-1
N, which were significantly higher
than control treatments (0 kg N ha-1
). The July 2010 harvest exhibited significant
differences for each fertility level. N concentrations were highest in 14.7 kg N ha-1
treatments (3.46% DW) and decreased as fertility level decreased (1.60 % DW, Control).
The August 2010 harvest exhibited the same trend as the previous month, with N
concentrations in leaf tissue decreasing as the fertility level decreased. (2.81 % DW –
14.7 kg ha, 1.64% DW-Control).
Phosphorus Concentration
P concentration of leaf tissue expressed in %DW was significantly affected by N
rate. 9.8 and 14.7 kg N ha-1
rates exhibited similar P concentrations (0.42 and 0.44
%/DW) and were both significantly higher than 4.9 and 0 kg N ha-1
treatments (0.39 and
0.37 %DW). TE regime had no affect on P concentrations throughout the study.
Harvest date exhibited a significant change in P concentration. August 2009 and July
Page 171
151
2010 harvests were similar at (0.45 and 0.43 %DW) and significantly higher than
September 2009 and August 2010 harvests, which were both significantly different at
0.39 and 0.36 % DW respectively. An N rate*harvest date interaction took place. Over
the course of the study there were four harvests. In 2009, harvests took place in August
and September and in 2010, July and August. During August and September 2009
harvests there weren’t any significant differences among N fertility levels. The July 2010
harvest displayed that 14.7 and 9.8 kg N ha-1
treatments resulted in similar P
concentration in leaf tissue. 4.9 kg N ha-1
and control treatments (0 kg N ha-1
) exhibited
similar P concentration in leaf tissue, and were significantly less than 14.7 and 9.8 kg N
ha-1
treatments. August 2010 harvest exhibited a similar trend as the July 2010 harvest.
14.7 and 9.8 kg N ha-1
treatments resulted in the same P concentration in leaf tissue.
Secondly, 9.8 and 4.9 kg N ha-1
treatments were similar, however 4.9 was exhibited
significantly less P concentration than 14.7 kg N ha-1
treatments. Control treatments
receiving 0 kg N ha-1
had the lowest P concentration in leaf tissue.
Potassium Concentration
Potassium concentration of leaf tissue was not significantly affected by N rate.
However TE regime influenced K+ concentrations in leaf tissue. The main effect of TE
reduced K+ concentrations in leaf tissue from 1.14 %DW under control to 1.05 %DW
under .017 L a.i ha-1
TE. Harvest date significantly influenced K+ concentrations of leaf
tissue. Each harvest was significantly different from each other with July 2010 averaging
the greatest K+ concentration at 1.34 %DW and decreasing to 1.12, 1.05 and 0.87 % DW
for August 2010, August 2009, and September 2009 respectively. An N rate*harvest date
Page 172
152
interaction took place. Over the course of the study there were four harvests. In 2009,
harvests took place in August and September and in 2010, July and August. The August
2009 harvest didn’t exhibit any differences in K+ concentration among N fertility levels.
For the September 2009 harvest, the control, 4.9 and 9.8 kg N ha-1
treatments were not
significantly difference in K+ concentration, however 14.7 kg N ha
-1 treatments were
significantly decreased. The July 2010 harvest exhibited differences in K+ concentration
due to N fertility levels. 14.7 kg N ha-1
treatments were significantly higher than 4.9 and
control treatments. However, 14.7 and 9.8 kg N ha-1
were not significantly different in
K+ concentration in leaf tissue. Similar results were displayed for the August 2010
harvest. 14.7 and 9.8 kg N ha-1
treatments exhibited similar in K+ concentration.
However, they were both significantly higher in K+ concentration than 4.9 and control
treatments, which were significantly different from each other at 1.08 and 0.95 % DW
respectively. A TE regime*harvest date interaction took place. No significant
differences in K+ concentration among TE regimes for the August 2009 September 2009
harvests. For the July and August 2010 harvests, control treatments of TE (0 L ai. ha-1
)
resulted in significantly higher K+ concentrations in leaf tissue. In July 2010, an 8 %
decrease in K+ concentration was exhibited due to the addition of TE. (1.39, 1.28 %
DW). In the following month, a 14.88 % decrease in K+ concentration was seen due to
applications of TE.
Ball Roll Distance
Ball roll distance (BRD) was significantly affected by N rate. The greatest BRD
was displayed by the control treatments receiving 0 kg/ha N and continued to decrease as
Page 173
153
N rate increased. BRD of 245.13, 235.93, 231.19, and 229.80 cm were exhibited as N
rate increased (Figure 7.3). A 10 cm decrease of BRD was displayed as N rate increased
from 0 to 14.7 kg ha-1
weekly. McCarty (2011) found that for each kilogram of N applied
annually, per hectare 10 cm decreases in speeds occur. The main effect of TE treatments
did not influence BRD. The month in which readings were taken significantly affected
BRD. Overall BRD increased as turf growth slowed late into the season. BRD values of
214.95 cm were exhibited in August and increased to 245.45 cm by November, an
increase of 12.42%. The main effect of year was significant with 2010 BRD values being
significantly higher than 2009 at 240.44 and 230.58 cm respectively. Significant N
rate*TE regime interactions were seen. Control (0 kg N ha-1
) treatments benefited from
TE applications, increasing BRD by 6.77 cm. However 14.7 kg N ha-1
treatments
displayed decreased BRD when TE was applied. BRD values for 4.9 and 9.8 kg N ha-1
treatments did not differ with TE regime. A significant N level*month interaction
occurred. For all months, control plots exhibited the highest BRD values (Figure 7.2). In
August and September, BRD increased as N level decreased, with each N level being
significantly different. However, in October 4.9, 9.8 and 14.7 kg N ha-1
N levels resulted
in similar BRD values. During November the same trend was exhibited. A TE regime*
month interaction exhibited varied results. During the months of August and September
TE increased BRD over plots not receiving TE, however the opposite was true for
October and November where non TE plots exhibited significantly higher BRD values.
Like TQ, an N level*year interaction was exhibited, however during 2009 no difference
in BRD was seen across N levels. In 2010, the BRD increased as N level decreased.
Page 174
154
Control treatments in 2010 resulted in the highest BRD values, at 260.84 cm, whereas 9.8
and 14.7 kg N ha-1
treatments resulted in BRD values of 230 cm. TE applications in
2009 resulted in significantly higher BRD values than non TE plots, however in 2010
there was not any significant difference. A month*year interaction was exhibited.
During 2009, the highest BRD values were displayed in October and November and were
not significantly different. Overall values in September averaged 234.32 cm and BRD
values in August were the lowest of all at 204.32 cm. For 2010, November BRD values
were significantly higher than all other months at 248. 97 cm. September and October
exhibited similar BRD values in 2010, and August displayed the lowest BRD in 2010 at
225.60 cm.
Trufirm
Firmness was significantly affected by the main effects N level, TE regime,
month and year. An increase in N rate decreased surface firmness, presumably due to the
increase in leaf tissue leading to a more cushioned response. 14.7 kg N ha-1
weekly
resulted in a Trufirm reading of 1.26 cm (depth of penetration). As N rate decreased,
surface firmness increased, resulting in readings of 1.22, 1.19, and 1.16 cm penetration
for 9.8, 4.9 and 0 kg N ha-1
(Figure 7.4). Surface firmness as measured by the Trufirm
was influenced by TE regime. A slight, but significant 0.015 cm decrease in penetration
was exhibited under TE. Month had a significant effect on surface firmness. Penetration
varied from 1.23 to 1.19 cm in the months recorded. October exhibited the most firmness
at 1.19 cm of penetration, similar to November at 1.20 cm, which were both more firm
than August at 1.23 cm. The plots in 2010 were more firm than 2009. A decrease in
Page 175
155
overall penetration from 1.24 to 1.18 cm was exhibited. A significant N level*TE regime
interaction was exhibited. Under 4.9 kg N ha-1
treatments, applications of TE resulted in
an increase in surface firmness (1.22 cm to 1.16 cm). Whereas at 14.7 kg N ha-1
,
applications of TE decreased firmness from 1.24 to 1.28 cm. An N level *year
interaction was displayed. 4.9 kg N ha-1
and control plots exhibited firmer conditions in
2010. In 2009, 14.7 kg N ha-1
exhibited the greatest penetration at 1.26 cm, all other N
levels resulted in similar firmnesses. In 2010 there was more separation between N
levels and their respective firmness levels. 14.7 kg N ha-1
displayed the greatest
penetration at 1.26 cm which was consistent with 2009. Readings of 1.21, 1.15, and 1.10
cm were displayed for 9.8. 4.9 and control N levels respectively. Month*year interaction
was exhibited. October was the only month where firmness levels were similar in both
years. All other months displayed firmer conditions in 2010.
Thatch Depth
Thatch depth was significantly influenced by the main effect of N level. 4.9 kg N
ha-1
and control treatments resulted in similar overall thatch depths of 2.30 and 2.24 cm
respectively. 14.7 and 9.8 kg N ha-1 treatments were similar at 2.14 and 2.11 cm. TE
applications had no affect on thatch depth. There was a significant effect of month and
year on thatch depth. November exhibited the greatest overall thatch depth at 2.41 cm.
October displayed the second greatest thatch depth at 2.24 cm, while September and
August had similar depths at 2.11 and 2.03 cm respectively. Overall, thatch depths in
2010 were greater than 2009 at 2.29 and 2.11 cm respectively. An N level* year
interaction was significant. During 2010, all N levels resulted in similar thatch depths.
Page 176
156
However, in 2009 14.7 and 9.8 kg N ha-1
exhibited significantly less thatch depth than
control or 4.9 kg N ha-1
treatments. Month*year was also significant. In 2009, October
and November exhibited similar thatch depths at 2.32 and 2.23 cm respectively. August
exhibited an overall thatch depth of 2.09 cm while September had the lowest at 1.80 cm.
In 2010, the same trend was not exhibited. November displayed the greatest thatch depth
at 2.59 cm, significantly higher than September at 2.42 cm, October (2.16 cm) and
August 1.98 cm.
Thatch Accumulation (Loss on Ignition)
LOI was significantly influenced by the main effect of year. In 2010, LOI values
were significantly higher than 2009 at 1259.7 and 841.54 g m-2
respectively.
Discussion
The total amount of N supplied was different in the two years that this study was
conducted. In 2009 total N treatments lasted 7 weeks totaling – 34.3, 68.6, and 102.9 kg
N ha-1
, respectively, for the three treatments however, in 2010 total N treatments lasted
15 weeks resulting in 73.5,147, and 220.5 kg N ha-1
, respectively, for the three
treatments. Due to this difference in total fertility, the results from 2010 were more
clearly defined and separated between N levels. An N level*year interaction was
significant for every parameter except LOI (Table 7.1). N level significantly influenced
N and P concentrations in leaf tissue over the course of the study. McCarty (2011) stated
that zoysiagrasses should generally not be fertilized with more than 146.49 kg-1
ha-1
over
the growing season. Due to this recommendation and desire to reduce overall inputs in
turfgrass management, weekly spoon feeding low concentrations of N over the course of
Page 177
157
the growing season is suggested. As N level increased during the study, putting green
performance as indicated by BRD and surface firmness began to decrease. Therefore
fertilization of 147 kg-1
N ha-1
or less is a good starting point for Diamond zoysiagrass
putting green management, with additional quick release N sources following cultivation
events to promote growth and recovery.
Although the main effect of N level did not influence K+ concentration in leaf
tissue, TE regime did. Overall reductions were seen under TE application, although the
potential benefits of TE applications far outweigh the potential reduction in K+
concentration. Soper et al. (1988) found that thatch and tiller density of ‘Meyer’
zoysiagrass was increased by N applications. No increase in thatch depth was observed
under PGR treatments, which agrees with findings of Soper et al. (1988). Additional
research in utilizing TE in Diamond putting green performance needs to be conducted.
PGR applications can potentially increase ball roll distance due to the reduction in
vertical growth and leaf surface area; however the main effect of TE did not influence
overall BRD in this study (Table 7.1). There are many cultivation and management
techniques utilized to improve putting green performance including rolling, topdressing,
decreasing HOC, and water management. Salaiz et al. (1995) documented increases in
BRD with a reduction of HOC, however a decrease in TQ and root production was
exhibited. A decrease in HOC, increase in PGR application rate, rolling, and cultivation
could increase ball roll on Diamond putting greens. A conservative 3.2 mm HOC was
utilized in the study however; Stiglbauer et al. (2009) found that Diamond can be
maintained at a 2.5 mm HOC without scalping or winter survival issues. Increases in
Page 178
158
BRD due to reductions in have been well documented in bentgrass and seashore
paspalum (Fagerness et al., 2000; Kopec et al., 2007; Pease et al., 2011). In addition to
increases in BRD, annual bluegrass putting greens can be maintained by increasing
mowing and/or rolling without increasing anthracnose severity (Inguagiato et al., 2009).
No cultivation was performed during the 2 year study period. Thatch and mat
management techniques need to be evaluated in Diamond zoysiagrass putting greens.
Extensive cultivation as tested by Hollingsworth et al. (2005) on ultradwarf bermudagrass
would not be advised due to the slow growth habit of Diamond zoysiagrass.
Hollingworth et al. (2005) found that extensive cultivation on ultradwarf bermudagrasses
was too intensive to maintain acceptable TQ and playability. Although a slow growth
habit is desirable in many turf management scenarios, it could hinder the playability of
Diamond zoysiagrass putting surfaces for a prolonged time following core aeration.
McCarty et al. (2007) showed that core aeration decreased BRD up to 14 days after
cultivation on creeping bentgrass putting green surfaces. This reduction in BRD could be
much longer due to the slow growth habit of Diamond. Hollingsworth et al. (2005) found
that thatch depth was not affected by N source. However, in this study, N level did
influence total thatch depth. More interesting was the main effect of time and how it
showed thatch accumulation throughout the growing season (Figure 7.5). Moisture
readings were not taken during this study. Surface firmness could be influenced on the
moisture in the upper 2.54 cm of the soil/thatch. There was a significant month and year
main effect. To more fully understand what might cause these fluctuations in firmness
additional moisture data must be taken. Diamond zoysiagrass has the potential to be
Page 179
159
installed and utilized successfully in putting green scenarios. A balance between TQ and
putting green performance needs to be found to determine optimum N fertility level.
Additional research needs to be conducted to examine N fertility management, lowered
HOC, increased PGR rate/application intervals, rolling, and other cultivation techniques
for thatch and mat control.
Conclusions
Diamond zoysiagrass has the ability to become another warm-season turfgrass
option for putting greens in the southern transition zone. However, before widespread
use of fine leaf zoysiagrass cultivars is considered many issues need to be resolved.
Based on finding of this project, N fertilization of Diamond zoysiagrass in putting green
applications should begin with 147 kg-1
N ha-1
or less over the growing season.
Additional quick release N sources should be used following cultivation events to
promote growth and recovery. As total N input surpassed 147 kg-1
N ha-1
putting green
performance suffered. An obvious increase in thatch depth and accumulation was
displayed during the two year study. Cultivation, surface management, PGR use, and
fertility regimes need to be determined to optimize putting green performance and overall
turfgrass health of Diamond zoysiagrass in putting green scenarios.
Page 180
160
Table 7.1. Surface firmness (cm of penetration) of Diamond
zoysiagrass as influenced by N rate, TE level, and year across three
rating dates at the Cliffs Environmental Turfgrass Research Facility
in Marietta, SC.
Main effects
NRate (N)
0
4.9
9.8
14.7
LSD0.05
TE Level (TE)
Control
0.017 L a.i ha-1
Year (Y)
2009
2010
August September October November
-----------------cm of penetration------------------
1.20
1.20
1.23
1.28
0.04
1.23
1.22
1.28
1.18
1.15
1.20
1.23
1.28
0.04
1.23
1.20
1.24
1.19
1.14
1.17
1.21
1.25
0.04
1.19
1.19
1.20
1.18
1.15
1.19
1.21
1.24
0.03
1.21
1.19
1.22
1.17
ANOVA
Source of variation
N
TE
Y
N*TE
N*Y
TE*Y
N*TE*Y
**
NS
***
NS
NS
NS
NS
***
NS
**
NS
*
NS
NS
***
NS
NS
*
*
NS
NS
***
NS
**
*
**
NS
NS
* Significant at the 0.05 probability level.
** Significant at the 0.01 probability level.
*** Significant at the 0.001 probability level.
Page 181
161
Table 7.2. Ball roll distance (cm) of Diamond zoysiagrass as
influenced by N rate, TE level, and year across three rating dates at
the Cliffs Environmental Turfgrass Research Facility in Marietta,
SC.
Main effects
NRate (N)
0
4.9
9.8
14.7
LSD0.05
TE Level (TE)
Control
0.017 L a.i ha-1
Year (Y)
2009
2010
August September October November
---------------------------cm-------------------------
222.8
217.8
212.0
207.0
3.99
212.6
217.3
204.3
225.6
250.9
244.4
234.0
228.9
4.50
235.7
243.4
234.5
244.6
252.9
240.8
237.6
237.3
4.46
244.0
240.3
241.7
242.5
254.6
240.7
240.9
245.4
5.37
248.4
242.4
241.9
248.9
ANOVA
Source of variation
N
TE
Y
N*TE
N*Y
TE*Y
N*TE*Y
***
**
***
NS
***
NS
NS
***
***
***
**
***
NS
NS
***
*
NS
NS
***
***
NS
***
**
***
*
***
NS
NS
* Significant at the 0.05 probability level.
** Significant at the 0.01 probability level.
*** Significant at the 0.001 probability level.
Page 182
162
Table 7.3. Turf Quality of Diamond zoysiagrass as influenced by N
rate, TE level, and year at the Cliffs Environmental Turfgrass
Research Facility in Marietta, SC.
Main effects
NRate (N)
0
4.9
9.8
14.7
LSD0.05
TE Level (TE)
Control
0.017 L a.i ha-1
Year (Y)
2009
2010
August September October November
----------------------(1-9, >6)-----------------------
6.02
6.93
7.15
7.23
0.35
6.88
6.78
6.97
6.69
6.06
7.12
7.04
6.95
0.27
6.81
6.77
6.75
6.84
5.86
6.95
7.05
7.15
0.27
6.69
6.82
7.0
6.51
5.09
6.25
6.62
6.59
0.27
6.15
6.13
6.43
5.85
ANOVA
Source of variation
N
TE
Y
N*TE
N*Y
TE*Y
N*TE*Y
***
NS
*
NS
***
NS
NS
***
NS
NS
NS
***
NS
NS
***
NS
***
NS
***
NS
NS
***
NS
***
NS
***
NS
NS
* Significant at the 0.05 probability level.
** Significant at the 0.01 probability level.
*** Significant at the 0.001 probability level.
Page 183
163
Table 7.4. Thatch depth of Diamond zoysiagrass as influenced by N
rate, TE level, and year at the Cliffs Environmental Turfgrass
Research Facility in Marietta, SC.
Main effects
NRate (N)
0
4.9
9.8
14.7
LSD0.05
TE Level (TE)
Control
0.017 L a.i ha-1
Year (Y)
2009
2010
August September October November
----------------------------cm------------------------
2.11
2.08
1.92
2.02
NS
2.02
2.04
2.09
1.98
2.17
2.20
2.0
2.07
NS
2.14
2.08
1.80
2.42
2.28
2.37
2.15
2.16
0.18
2.24
2.24
2.32
2.16
2.42
2.53
2.36
2.32
NS
2.39
2.42
2.23
2.59
ANOVA
Source of variation
N
TE
Y
N*TE
N*Y
TE*Y
N*TE*Y
NS
NS
NS
NS
NS
NS
NS
NS
NS
***
NS
NS
NS
*
*
NS
*
NS
**
NS
NS
NS
NS
***
NS
NS
NS
NS
* Significant at the 0.05 probability level.
** Significant at the 0.01 probability level.
*** Significant at the 0.001 probability level.
Page 184
164
Table 7.5. Clipping yield of Diamond zoysiagrass as influenced by
N rate and TE level at the Cliffs Environmental Turfgrass Research
Facility in Marietta, SC.
Main effects
NRate (N)
0
4.9
9.8
14.7
LSD0.05
TE Level (TE)
Control
0.017 L a.i ha-1
2009
2010
August September July August
--------------------------g m-2
------------------------
5.90
5.78
5.49
5.65
NS
6.44
4.97
1.28
1.38
1.56
1.63
NS
1.75
1.17
2.62
3.81
5.14
6.62
0.78
4.92
4.17
1.02
2.09
3.05
4.11
0.39
3.27
1.86
ANOVA
Source of variation
N
TE
N*TE
NS
***
NS
NS
**
NS
***
*
NS
***
***
***
* Significant at the 0.05 probability level.
** Significant at the 0.01 probability level.
*** Significant at the 0.001 probability level.
Page 185
165
Table 7.6. N concentration of Diamond zoysiagrass leaf tissue as
influenced by N rate and TE level at the Cliffs Environmental
Turfgrass Research Facility in Marietta, SC.
Main effects
NRate (N)
0
4.9
9.8
14.7
LSD0.05
TE Level (TE)
Control
0.017 L a.i ha-1
2009
2010
August September July August
--------------------------g m-2
------------------------
3.15
3.35
3.53
3.60
0.12
3.38
3.43
2.44
2.66
2.74
2.69
NS
2.68
2.59
1.60
2.16
2.67
3.46
0.47
2.42
2.53
1.64
2.01
2.42
2.81
0.14
2.22
2.22
ANOVA
Source of variation
N
TE
N*TE
***
NS
*
NS
NS
*
***
NS
NS
***
NS
NS
* Significant at the 0.05 probability level.
** Significant at the 0.01 probability level.
*** Significant at the 0.001 probability level.
Page 186
166
Figure 7.1. Turf quality as affected by N level and time (1-9, >6 acceptable) Means were
separated at P≤0.05 by protected LSD.
August September October November
4.5
5.0
5.5
6.0
6.5
7.0
7.5
0 kg N ha-1
4.9 kg N ha-1
9.8 kg N ha-1
14.7 kg N ha-1
Page 187
167
August September October November
BR
D (
cm
)
200
210
220
230
240
250
260
0 kg N ha-1
4.9 kg N ha-1
9.8 kg N ha-1
14.7 kg N ha-1
Figure 7.2. Ball roll distance (cm) as affected by N level and time. Means were separated
at P≤0.05 by protected LSD.
Page 188
168
Aug 2009 Sept 2009 Oct 2009 Nov 2009 Aug 2010 Sept 2010 Oct 2010 Nov 2010
Th
atc
h D
ep
th (
cm
)
1.4
1.6
1.8
2.0
2.2
2.4
2.6
2.8
3.0
0 kg N ha-1
4.9 kg N ha-1
9.8 kg N ha-1
14.7 kg N ha-1
Figure 7.3. Main effect of N level on thatch depth over 4 harvest dates and 2 years.
Means were separated at P≤0.05 by protected LSD.
Page 189
169
CHAPTER VIII
SUMMARY AND PERSPECTIVES
Primary objectives of this dissertation were to determine the effect of urea N
delivery method on warm-season turfgrass under salinity stress, the influence of Ni2+
supplementation on urea N metabolism, and the consequence of Ni2+
toxicity on urea N
metabolism and turfgrass performance. Secondary objectives include determining if Ni2+
supplementation aids foliar uptake of urea N. In addition, a field study was conducted to
examine Diamond zoysiagrass putting green management through various N fertility
rates and applications of plant growth regulators.
A greenhouse study was conducted in 2009 and repeated in 2010 examining foliar
and root applied urea N to five warm-season turfgrasses under salinity stress. Foliar and
root applied urea N resulted in similar N, P, and K+ concentrations in the leaf tissue of all
genotypes. However, overall leaf tissue Na+ concentrations at the conclusion of the study
were significantly higher in most genotypes excluding Seadwarf, receiving root applied
urea N than foliar applied urea. The increase in Na+ concentration in leaf tissue due to
root applied urea was not expected and could be due to complex soil salinity related
factors and the N form being absorbed by root tissue. Liu et al. (2003) showed that
specific high-affinity transporters and aquaporins are responsible for urea uptake in the
root-zone. Due to this fact, urea hydrolysis in the soil and the N form being absorbed by
plants could influence the pH in the root zone and stimulate uptake of Na+ in turfgrasses
under salinity stress. Future research should be conducted to examine the level of urease
activity in the soil, soil pH, and N form being absorbed following applications of root
Page 190
170
applied urea N under salinity stress to determine what is causing the stimulation of Na+
uptake. In addition, research examining N absorption needs to be fully examined to
determine nutrient uptake and assimilation in an effort to maximize N use efficiency in
salt-affected areas. Finally, Ni2+
nutrition and supplementation of warm-season
turfgrasses needs to be researched due to Ni2+
’s essential role in the hydrolysis of urea in
an effort to decrease N losses following urea N fertilization.
A second study was conducted in the greenhouse further examining urea N foliar
fertilization with Ni2+
supplementation under moderate salinity stress. Diamond
zoysiagrass and TifEagle ultradwarf bermudagrass were selected due to their
performance in the first study and subjected to weekly foliar urea N applications, three
supplemental Ni2+
levels, and moderate salinity stress. Results of this study revealed a
stimulation of urease activity and an increase in total amino acids due to Ni2+
supplementation. However, a reduction in total N concentration was displayed over the
course of the study which can occur when plants grow on a single N source. Due to
findings in this study, multiple N sources (NO3-, NH4
+) should be utilized in turfgrass
management. Increases in overall growth were displayed under moderate salinity stress
in Diamond and TifEagle. This result supports the theory that warm-season turfgrasses
require greater concentrations of Na+ to maintain optimal growth.
Although Ni2+
deficiency is not commonly thought of as an issue in turfgrass
management; there is evidence that highlights Ni2+
’s essential role in plant metabolism
and deficiency in pecan. Nickel deficiency in pecan and other fruit trees is becoming
more common and it is possible that many horticulture crops possess a “hidden hunger”
Page 191
171
for Ni2+
(Wood et al., 2004a; 2004b). In addition, Wood et al. (2012) has recorded the
positive effects of Ni2+
supplementation on disease management of fruit trees. Fe and
elevated concentrations of transition metals (V, Cr, Co, Cu2+
, Zn2+
, and Mo) induced Ni2+
deficiency in pecan (Wood, 2011). Due to the popularity of foliar applied Fe and
micronutrient fertilizers in turfgrass management to correct nutrient deficiencies and
increase turf color/quality, it is possible that Ni2+
deficiencies are occurring.
Further research needs to be conducted to examine Ni2+
supplementation on warm
season turfgrass supplied with various N sources and rates. The significance of Ni2+
supply depends on N source and critical concentrations of Ni2+
in turfgrass tissue need to
be determined in those scenarios. A comprehensive investigation of Ni2+
nutrition in
turfgrasses also needs to be conducted to determine micronutrient interactions and
deficiencies. Lastly, the positive and negative effects of Ni2+
supplementation need to be
determined, including Ni2+
toxicity and disease management of turfgrasses.
A third greenhouse study was conducted to examine the effect of Ni2+
toxicity on
the health and performance of Diamond zoysiagrass and TifEagle bermudagrass.
Stimulation of urea N metabolism was displayed through increases in urease activity and
amino acid content in leaf tissue. However, increased Ni2+
concentration in leaf tissue
led to symptoms of toxicity, changes in nutrient status, reduction in growth, decreases in
TQ, and leaf necrosis. Findings from this study suggest the critical Ni2+
toxicity level in
Diamond zoysiagrass and TifEagle bermudagrass begins at a range >25 mg kg-1
. Leaf
tissue Ni2+
concentrations greater than 25 mg kg-1
caused reductions in turf growth and
symptoms of toxicity.
Page 192
172
Additional research needs to be conducted to examine if Ni2+
supplementation
aids in foliar recovery of applied urea N and if foliar applications of Ni2+
can be made.
Lastly, research should focus on Ni2+
requirement of turfgrasses along with long term
ecological, physiological, and environmental implications of Ni2+
supplementation in
turfgrass environments.
A fourth experiment was conducted in the greenhouse to determine the
differences in 15
N recovery after foliar and root applications of urea N in three warm-
season turfgrasses. Results from this study indicate that foliar and root applications of
15N resulted in overall recovery of 37 and 47% respectively. Significant fertilizer loss
(up to 63% of applied N) was exhibited which could be due to a number of reasons
including leaching and ammonia volatilization from the leaf surface following
applications of urea. Numerous nutrient management strategies have been employed to
improve foliar fertility uptake and retention in turfgrass ecology including fertility rate,
application timing, N source, and spray volume. Comprehensive research needs to be
conducted to account for the significant losses in N following foliar applications of
nutrients.
A chapter of this dissertation also addressed the lack of literature on zoysiagrass
putting green management. Fine leafed zoysiagrasses have become another warm-season
turfgrass option for putting greens, however there are many questions regarding their
fertility management and playability in such scenarios. A field study was conducted to
examine the effect of foliar N application rates, and plant growth regulator use on
Diamond zoysiagrass putting green performance. Based on our results, Diamond
Page 193
173
zoysiagrass has the ability to become another warm-season turfgrass option for putting
greens in the southern transition zone. However, before widespread use of fine leaf
zoysiagrass cultivars is considered many issues need to be resolved. N fertilization of
Diamond zoysiagrass in putting green applications should begin with 147 kg-1
N ha-1
or
less over the growing season. Additional quick release N sources should be used
following cultivation events to promote growth and recovery. As total N input surpassed
147 kg-1
N ha-1
putting green performance suffered. Cultivation, surface management,
PGR use, and fertility regimes need to be determined to optimize putting green
performance and overall turfgrass health of Diamond zoysiagrass in putting green
scenarios.
Urea is the most commonly used foliar N source in turfgrass management and
agriculture. Although a great N source, nitrogen use efficiency in turfgrass management
and crop production is generally below 50% resulting in economical losses and also
creating ecological problems like groundwater contamination. Previous research efforts
aiming to improve foliar applied N use efficiency in turfgrass management have focused
on application technique, without examining the N metabolism and plant physiology.
Before urea can be utilized as an N source by the plant it must be hydrolyzed by
the Ni2+
dependent enzyme urease in the cytosol. Numerous studies have proven the
benefit of Ni2+
supplementation in stimulating urea N metabolism and overall plant health
in numerous crops. However, there is a lack of research examining Ni2+
nutrition and the
stimulation of urea N metabolism by Ni2+
supplementation in turfgrasses and most
horticultural crops. This dissertation began to address the lack of literature on Ni2+
Page 194
174
nutrition, supplementation, and toxicity in turfgrass management. Many positive
responses were recorded over the course of the experiments. Increases in urease activity
within the cytosol led to elevated amino acid pools. However, reductions in total N
concentration of leaf tissue were displayed. More research focusing on Ni2+
supplementation is necessary to determine the long term effect and potential benefit in N
use efficiency.
Many questions remain regarding the effect of Ni2+
supplementation and long
term ecological issues. Future research regarding urea N metabolism and Ni2+
supplementation should focus on foliar applications of Ni2+
, the effects of tank mixing
Ni2+
with foliar urea N fertilizers, Ni2+
’s effect on overall plant health and disease
management.
Page 196
176
Appendix A
Illustrations
Illustration A-1: Polyvinylchloride lysimeters in the Clemson University Greenhouse
Research Facility.
Page 197
177
Illustration A-2: Root applications of soluble urea N were made using a 60 ml syringe in
the Clemson University Greenhouse Research Facility.
Page 198
178
Illustration A-3: Making a root application of soluble urea N in the Clemson University
Greenhouse Research Facility.
Page 199
179
Illustration A-4: Hydroponic pre-culture and establishment in the Clemson University
Greenhouse Research Facility.
Page 200
180
Illustration A-5: Hydroponic culture in the Clemson University Greenhouse Research
Facility.
Page 201
181
Illustration A-6: Constant aeration was supplied during hydroponic culture in the
Clemson University Greenhouse Research Facility.
Page 202
182
Illustration A-7: Measuring ball roll distance on Diamond zoysiagrass with a modified
Stimpmeter at the Cliffs Environmental Turfgrass Research Facility in Marietta, SC.
Page 203
183
Illustration A-8: Measuring surface firmness of Diamond zoysiagrass with Trufirm™
(USGA) at the Cliffs Environmental Turfgrass Research Facility in Marietta, SC.
Page 204
184
Illustration A-9: Overview of Diamond zoysiagrass plot located at the Cliffs
Environmental Turfgrass Research Facility in Marietta, SC.
Page 205
185
Appendix B
Laboratory Procedures
Urease Assay
Urease activity was determined spectrophotometrically at 636 nm by the methods
of Witte and Medina-Escobar (2001) with modifications. Fresh turfgrass leaf tissue (0.1
g) was extracted in 50 mM phosphate buffer (pH 7.5) containing 1.5% PVPP, 50 mM
NaCl, and 1 mMEDTA with mortar and pestle on ice. Immediately before extraction
DTT and PMSF were added to a final concentration of 20 and 0.1mM respectively.
Following extraction, samples were centrifuged at 4°C for 10 min (14,000 rpm). The
supernatants were transferred into new 1.5ml tubes and centrifuged again under the same
conditions for 20 min. The clarified extract was removed and kept on ice. Five hundred
microliters of Sephadex (G-25 medium) containing 25 mM phosphate buffer, 25 mM
NaCl and 0.5 mM EDTA slurry was added to a spin column and pre-spun at 700 g for 1
min. One hundred microliters of each sample was added to the center of the gel and the
column was spun again for 2 min at 700 g. Approximately 100 μl was recovered. In 1.5
ml tubes, 90 μl of sample from spin column was added to 1 μl of 5 M urea. The tubes
were vortexed and placed into a 50°C heat block for 3 min. Tubes were removed and
spun to collect any condensate. Twenty microliter samples were added to 980 μl H2O,
100 μl phenol nitroprusside and 200 μl hypochloride reagent. After the reagents were
added the tubes were closed immediately to avoid ammonia losses, mixed well and
placed into a 50°C heat block for a minimum of 20 min after which desired color
Page 206
186
development was achieved. Urease activity was based on a standard curve of ammonium
chloride. Measurements were made at 636 nm on a spectrophotometer.
Urease reagent preparation
Seven grams of phenol and 34 g nitroprusside (disodium
pentacyanonitrosylferrate) were dissolved in 80 ml dH2O and then made up to 100 ml.
This reagent was stored at 4°C in a dark bottle. The hydrochloride reagent was prepared
by dissolving 2.96 g NaOH in 140 ml of dH20, adding 29.74 g Na2HPO4*12 H2O, and
dissolving it completely. NaOCl solution (12%) was added and the pH was adjusted to
12.0 with NaOH and the volume was adjusted to 200 ml with dH2O. This was stored in a
dark bottle at room temperature.
Ammonium Chloride Standard Curve.
y = 0.0033x + 0.0061 R² = 0.9997
0
0.2
0.4
0.6
0.8
1
1.2
1.4
1.6
0 50 100 150 200 250 300 350 400 450
Page 207
187
Amino Acid Assay
Amino acid content was extracted from fresh leaf tissue and determined
spectrophotometrically at 570 nm by the methods of Zhang et al. (2011). One hundred
milligrams of fresh turfgrass tissue were ground with a mortar and pestle and extracted
in 2.5 ml 0.05 sodium phosphate buffer containing 0.2 mM eDTA and 1 % PVP.
Extracts were centrifuged at 13,000 rpm for 20 minutes. The supernatants were collected
for the amino acid assay. To each test tube 200 μl extract or standard (glycine solution)
were added along with 550 μl dH2O, and 500 μl diluted cyanide solution (2 ml mM
NaCN was brought up to 100 ml final volume with 0.2 M acetate buffer and 500 μl
ninhydrin solution [3% {w/v} ninhydrin in ethylene glycol momomethyl ether {2-
methoxythanaol}]). The top of each tube was covered with a marble and incubated in
boiling water for 20 min. Then 10 ml isopropyl alcohol and water (1:1 v/v) were added
to each tube. After vortexing, the tubes were allowed to cool. Absorbance was measured
on a spectrophotometer at 570 nm. Total amino acid content was calculated based on a
standard curve of glycine.
Page 208
188
Glycine Standard Curve.
y = 0.0027x - 0.0067 R² = 0.9781
-0.1
0
0.1
0.2
0.3
0.4
0.5
0.6
0.7
0.8
0 50 100 150 200 250 300
Page 209
189
Appendix C
Copyright Permission Documentation
Figure 2.1 Reprinted from Plant Science, Volume 175, Wei-Hong Wang, Barbara Kohler,
Feng- Qui Cao, Lai-Hua Liu, Molecular and physiological aspects of urea transport in
higher plants, 467-477, 2008, with permission from Elsevier.
Figure 2.2 Reprinted from Journal of Plant Nutrition and Soil Science, Joska Gerendas,
Joseph C. Polacco, Sharyn K. Freyermuth, Burkhard Sattelmacher, 241-256, 2000, with
permission from John Wiley and Sons.
Figure 2.3 Reprinted from Plant Science, Volume 180, Claus-Peter Witte, Urea
metabolism in plants, 431-477, 2011, with permission from Elsevier.
Page 210
190
REFERENCES
Ashraf, M.Y., R. Sadiq, M. Hussain, M. Ashraf, and M.S.A. Ahmad. 2011. Toxic effect of
nickel (Ni) on growth and metabolism in germinating seeds of sunflower (Helianthus
annus L.). Biol Trace Elem Res. 143: 1695-1703.
Aslam, M., R. Huffaker, and D.W. Rains. 1984. Early effects of salinity on nitrate assimilation
in barley seedlings. Plant Physiol. 76: 321-325.
Atkinson, J., L.B. McCarty, and H.Liu. 2011. Diamond zoysiagrass in shade. Golf Course
Management. July. 82-84.
Baldwin, C. M. 2008. Variable approaches investigating light quality and quantity impacts on
warm and cool season-turfgrasses. Ph.D. Dissertation. Clemson University. Clemson,
SC.
Bai, C., C.C. Reilly, and B. W. Wood. 2006. Nickel deficiency disrupts metabolism of ureides,
amino acids, and organic acids of young pecan foliage. Plant Physiol. 140: 433-443.
Bailey, J.S. 1999. Varying the ratio of 15N labeled ammonium and nitrate N supplied to
creeping bent: effects on N absorption and assimilation, and plant growth. New
Phytologist. 143(3): 503 - 512.
Bates, L.S. 1973. Rapid determination of free proline for water stressed studies. Plant Soil
39:205-207.
Beard, J.B. 1973. Turfgrass Science and Culture. Prentice-Hall Inc. Englewood Cliffs, N.J.
Bowman, D. C and J. L Paul. 1989. The foliar absorption of urea-N by Kentucky bluegrass turf.
J. Plant Nutr. 12:659-673.
Bowman, D.C. and J.L. Paul. 1990. The foliar absorption of urea-N by tall fescue and creeping
bentgrass turf. J. Plant Nutr. 13(9):1095-1113.
Bowman, D. C and J. L Paul. 1992. Foliar absorption of urea, ammonium, and nitrate by
perennial ryegrass turf. J. Amer. Soc. Hort. Sci. 117(1):75-79.
Bowman, D.C. 2003. Daily vs. periodic N addition affects growth and tissue Nin perennial
ryegrass turf. Crop Sci. 43:631-638.
Bowman, D.C., G.R. Cramer, and D.A. Devitt. 2006. Effect of salinity and N status on nitrogen
uptake by tall fescue turf. Journal of Plant Nutrition, 29:1481-1490.
Page 211
191
Brown, P.H., R.M. Welch, and E.E. Cary. 1987a. Nickel: A micronutrient essential for higher
plants. Plant Physiol. 85: 801-803.
Brown, P.H., R.M. Welch, E.E., Cary, R.T. Checkai. 1987b. Beneficial effects of nickel on plant
growth. Journal of plant nutrition. 10:2125-2135.
Buhl, M.D., and C.R. Stewart. 1983. Effects of NaCl on proline synthesis and utilization in
excised barley leaves. Plant Physiol. 72: 664-667.
Bunnell, B.T., L.B. McCarty, J.E. Faust, W.C. Bridges Jr., and Nihal Rajapakse. 2005.
Quantifying a daily light integral requirement of a ‘TifEagle’ bermudagrass golf green.
Crop Sci. 45:569-574.
Bybordi, A. and M. H. Gheibi. 2009. Growth and chlorophyll content of canola plants supplied
with urea and ammonium nitrate in response to various nickel levels. Not Sci Biol. 1 (1):
53-58.
Cataldo, D. A., T.R. Garland, and R.E. Wildung. 1978a. Nickel in plants. I. Uptake and kinetics
using intact soybean seedlings. Plant Physiol. 62: 563-565.
Cataldo, D. A., T.R. Garland, R.E. Wildung, and H. Drucker. 1978b. Nickel in plants. II.
Distribution and chemical form in soybean plants. Plant Physiol. 62: 566-570.
Carrow, R.N., D.V. Waddington, and P.E. Rieke. 2001. Turfgrass Soil Fertility and Chemical
Problems. Assessment and Management. John Wiley and Sons Inc. Hoboken, NJ.
Carrow, R.N., and R.R. Duncan. 1998. Salt-Affected Turfgrass Sites, Assessment and
Management. Ann Arbor Press. Chelsea, MI.
Chen, C., D. Huang, and J. Liu. 2009. Functions and toxicity of nickel in plants: recent advances
and future prospects. Clean. 37(4-5): 304-313.
Delauney, A.J., and D.P. S. Verma. 1993. Proline biosynthesis and osmoregulation in plants.
The Plant Journal. 4(2), 215-223.
Dixon, N.E., Gazola, C., Blakely, R.L. and B. Zerner. 1975. Jack bean urease (EC 3.5.1.5), a
metalloenzyme. A simple biological role for nickel? J. Am. Chem. Soc. 97: 4131-4133.
Eichert, T., and H.E. Goldbach. 2008. Equivalent pore radii of hydrophilic foliar uptake routes
in stomatous and astomatous leaf surfaces – further evidence for a stomatal pathway.
Physiol. Plant 132: 491-466.
Eskew, D.L., R.M. Welch, and W.A. Norvell. 1984. Nickel in higher plants. Further evidence of
an essential role. Plant Physiology 76(3):691-693.
Page 212
192
Eskew, D.L., and R.M. Welch. 1983. Nickel: An essential micronutrient for legumes and
possibly all higher plants. Science. 222:621-623.
Fagerness, M.J., F.H. Yelverton, J. Isgrigg III, and R.J. Cooper. 2000. Plant growth regulators
and mowing height affect ball roll and quality of creeping bentgrass putting greens.
HortScience. 35(4): 755-759.
Fernandez, V. and T. Eichert. 2009. Uptake of hydrophilic solutes through plant leaves: current
state of knowledge and perspectives of foliar fertilization. Critical reviews in plant
science. 28: 36-68.
Food and Agriculture Organization. 2008. FAOSTAT statistics database (http://faostat.fao.org)
Flores, P., M. Carvajal, A. Cerda, and V. Martinez. 2001. Salinity and ammonium/nitrate
interactions on tomato plant development, nutrition, and metabolites. Journal of Plant
Nutrition. 24(10): 1561-1573.
Frankenberger, W.T. Jr., and F.T. Bingham. 1982. Influence of salinity on soil enzyme
activities. Soil Sci. Soc. Am. J. 46.
Gerendas, J., J.C. Polacco, S.K. Freyermuth, and B. Sattelmacher. 1999. Significance of nickel
for plant growth and metabolism. J. Plant. Soil. 162: 241-256.
Gerendas, J. and B. Sattelmacher. 1999. Influence of Ni supply on the growth and N
metabolism of Brassica napus L. grown with NH4NO3 or urea as N source. Annals of
Botany. 83: 65-71.
Gerendas, J., Z. Zhu, and B. Sattelmacher. 1998a. Influence of N and Ni supply on N
metabolism and urease activity in rice (Oryza satvia L.). Journal of Experimental
Botany. 49: 1545-1554.
Gerendas, J., J.C. Polacco, S.K. Freyermuth, and B. Sattelmacher. 1998b. Co does not replace
Ni with respect to urease activity in zucchini (Curcurbita pepo convar. giromontiina) and
soybean (Glycine max). Plant and Soil. 203: 127-135.
Gerendas, J. and B. Sattelmacher. 1997a. Significance of Ni supply for growth, urease activity
and the concentrations of urea, amino acids and mineral nutrients of urea grown plants.
Plant and Soil.190: 153-162.
Gerendas, J. and B. Sattelmacher. 1997b. Significance of N source (urea vs. NH4NO3) and Ni
supply for growth, urease activity and N metabolism of zucchini (Cucurbita pepo convar.
giromontiina). Plant and Soil. 196: 217-222.
Page 213
193
Grattan, S.R. and C.M. Grieve. 1999. Salinity-mineral nutrient relations in horticultural crops.
Scientia. Horticulurae. 78: 127-157.
Guertal, E.A. and D.L. Evans. 2006. Nitrogen rate and mowing height effects on TifEagle
bermudagrass establishment. Crop Sci. 46: 1772-1778.
Hanna, W.W., and J.E. Elsner. 1999. Registration of ‘TifEagle’ bermudagrass. Crop Sci.
39:1258
Hare, P.D. and W.A. Cress. 1997. Metabolic implications of stress induced proline
accumulation in plants. Plant Growth Regulation 21: 79-102.
Hartwiger, C.E., C.H. Peacock, J.M. DiPaola, and D.K. Cassel. 2001. Impact of light-weight
rolling on putting green performance. Crop Sci. 41: 1179-1184.
Hawkins, H.J., and O.A.M. Lewis, 1993. Effect if NaCl salinity, N form, calcium and potassium
concentration on N uptake and kinetics in Triticum aestivum L. cv. Gamtoos. New
Phytol. 124: 171-177.
Henning, S., B. Branham, and R. Mulvaney. 2009. Foliar uptake efficiency of creeping
bentgrass as affected by spray volume, adjuvants, tank-mixing, and fertilizer formulation.
In 2009 annual meeting abstracts. ASA, CSSA, and SSSA, Madison, WI.
Hirai, M., R. Kawai-Hirai, T Hirai, and T Ueki. 1993. Structural change of Jack Bean urease
induced by addition of surfactants studied with synchrotron-radiation small angle X-ray
scattering. Eur J. Biochem. 215:55-61.
Hollingsworth, B.S., E.A. Guertal, and R.H. Walker. 2005. Cultural management and N source
effects on ultradwarf bermudagrass cultivars. Crop Sci. 45:486-493.
Hoagland, D.R., and D.I. Arnon. 1950. The water culture method for growing plants without
soil. Ext. Circ. No. 346:2-32. California Agric. Exp. Stn., Berkeley, CA.
Hogan M.E., I.E. Swift, and J. Done. 1983. Urease assay and ammonia release from leaf tissues.
Phytochemistry 22:663–667.
Inguagiato, J.C., J.A. Murphy, and B.B. Clarke. 2009. Anthracnose disease and annual
bluegrass putting green performance affected by mowing practices and lightweight
rolling. Crop Sci. 49: 1454-1462.
JMP, Version 9. SAS Institute Inc., Cary, NC, 1989-2011.
Page 214
194
Kant, S., P. Kant, H. Lips, and S. Barak. 2007. Partial substitution of NO3 by NH4 fertilization
increases ammonium assimilating enzyme activities and reduces the deleterious effects of
salinity on the growth of barley. Journal of Plant Physiology. 164: 303-311.
Khoshgoftarmanesh, A.H., F. Hosseini, and M. Afyuni. 2011. Nickel supplementation effect on
the growth, urease activity and urea and nitrate concentrations in lettuce supplied with
different Nsources. Scientia Horticulturae. 130: 381-385.
Koertiz, E.J., and J.C. Stier. 2009. Nitrogen rate and mowing height effects on velvet and
creeping bentgrasses for low-input putting greens. Crop Sci. Vol. 49:1463-1472.
Kopec, D.M., J.L. Walworth, J.J. Gilbert, G.M. Sower, and M. Pessarakli. 2007. ‘SeaIsle 2000’
paspalum putting surface response to mowing height and N fertilizer. Agron. J. 99:133-
140.
Krogmeier, M.J., G.W. McCarty, D.R. Shogren, and J. M. Bremner. 1991. Effect of nickel
deficiency in soybeans on the phytotoxicity of foliar-applied urea. Plant and Soil. 135:
283-286.
Lee, G.J, R.R. Duncan, and R. N. Carrow. 2007. Nutrient uptake responses and inorganic ion
contribution to solute potential under salinity stress in halophytic seashore paspalums.
Crop Sci. 47: 2504-2512.
Lewis, O.A.M., and S. Chadwick. 1983. An 15
N investigation into N assimilation in
hydroponically grown barley (Hordeum vulgare L. CV. Clipper) in response to nitrate,
ammonium and mixed nitrate and ammonium nutrition. New Phytol. 95: 635-646.
Lewis, O.A.M., E,O., Leidi and S.H. Lips. 1989. Effect of N source on growth response to
salinity stress in maize and wheat. New Phytol. 111: 155-160.
Liu, H., C. M. Baldwin, F. W. Totten, and L. B. McCarty. 2008. Foliar fertilization for
turfgrasses. II International Conference on Turfgrass Science and Management for
Sports Fields. Acta Hort. (ISHS) 783:323-332.
Liu, L.H., U. Ludewig, W.B. Frommer, and N. von Wiren. 2003. AtDUR3 encodes a new type
of high-affinity urea/H+ symporter in Arabidopsis The plant cell. Vol 15. 790-800.
Marcum, K.B. and C.L. Murdoch. 1994. Salinity tolerance mechanisms of six C4 turfgrasses.
J.Amer.Soc.Hort.Sci. 119(4): 779-784.
Marcum, K.B., S.J. Anderson and M.C. Engelke. 1998. Salt gland ion secretion: A salinity
tolerance mechanism among five zoysiagrass species. Crop Sci. 38:132-146
Page 215
195
Marcum, K.B and M. Pessarakli. 2006. Salinity tolerance and salt gland excretion efficiency of
bermudagrass turf speciess. Crop Sci. 46: 2571-2574.
Marschner, H. 1995. Mineral Nutrition of Higher Plants. Second Edition. Academic Press
Limited. San Diego, CA.
McCarty, L.B. 2011. Best Golf Course Management Practices. 3rd
Edition. Prentice Hall
Upper Saddle River, NJ.
McCarty, L.B., T.G. Willis, J.E. Toler and T. Whitwell. 2011. ‘TifEagle’ bermudagrass
response to growth regulators and mowing height. Agron. J. 103:988-994.
McCarty, L.B., M.F. Gregg, and J.E. Toler. 2007. Thatch and mat management in an
established creeping bentgrass golf green. Agron. J. 99: 1530-1537.
McCrimmon, J.N., and K.J. Karnok. 1992. Nform and the seasonal root and shoot response of
creeping bentgrass. Commun. Soil Sci. Plant Anal. 23 (9&10). 1071-1088.
McCullough, P.E., H. Liu, L.B. McCarty, and J.E. Toler. 2007. Trinexapac-ethyl application
regimens influence growth, quality, and performance of bermudagrass and creeping
bentgrass putting greens. Crop Sci. 47:2138-2144.
McCullough, P.E., H. Liu, L.B. McCarty, and T. Whitwell. 2004. Response of ‘TifEagle’
bermudagrass to seven plant growth regulators. HortScience. 39: 1759-1762.
McCullough, P.E., H. Liu, L.B. McCarty, T. Whitwell, and J.E. Toler. 2006. Bermudagrass
putting green growth, color, and nutrient portioning influenced by nitrogen and
trinexapac-ethyl. Crop Sci. 46: 1515-1525.
McCullough, P.E., L.B. McCarty, H. Liu, and T. Whitwell. 2005. Response of ‘TifEagle’
bermudagrass (Cynodon dactylon x Cynodon transvaalensis) to ethephon and trinexapac-
ethyl. Weed Technol. 19: 251-254.
McIver, T. 1990. Liquid vs. Dry: the pendulum swings. Landscape Management. 29: 26-27.
Menchyk, N.A., F.G. Bethea Jr., and H. Liu. 2012. Diamond not in the rough. Green section
record. Vol. 50. (9). April 27, 2012.
Menegassi, A., G.E. Wasermann, D. Olivera-Serero, A.B. Becker-Ritt, A.H.S. Martinelli, V.
Feder, and C.R. Carlini. 2008. Urease from cotton (Gossypium hirsutum) seeds:
Isolation, physiochemical characterization, and antifungal properties of the protein. J.
Agric. Food Chem. 56: 4399-4405.
Page 216
196
Merigout, P., M. Lelandais, F. Bitton, J.P. Renou, X. Briand, C. Meyer, and F. Daniel-Vedele.
2008. Physiological and transcriptomic aspects of urea uptake and assimilation in
Arabidopsis plants. Plant Physiol. 147: 1225-1238.
Merigout, P., V. Gaudon, I Quillere, X. Briand, and F. Daniel-Vedele. 2008. Urea use
efficiency of hydroponically grown maize and wheat. Journal of Plant Nutrition. 31:
427-443.
Moraes, M.F., A.R. Reis, L. A. C. Moraes, J.L. Junior, R. Vivian, C.P. Cabral and E. Malavolta.
2009. Effects of molybdenum, nickel, and N sources on the mineral nutrition and growth
of rice plants. Communications in soil science and plant analysis. 40: 3238-3251.
Mulvaney, R.L., C.L. Fohriner, V.J. Bojan, M.M Michlik, and L.F. Herzog. 1990. A
commercial system for automated N isotope-ratio analysis by the Rittenburg technique.
Rev. Sci. Instrum. 61: 897-903.
Meyer-Bothling, L.E. and J.C. Polacco. 1987. Mutational analysis of the embryo-specific
urease locus of soybean. Mol. Gen. Genet. 209: 439-444.
Neumann, P.M., 1988. Plant Growth and Leaf Applied Chemicals. CRC Press. Boca Raton, FL.
Nourbakhsh, F. and C.M. Monreal. 2004. Effects of soil properties and trace metals on urease
activities of calcareous soils. Biol. Fertil. Soils. 40: 359-362.
Patton, A.J., J.J. Volenec, and Z.J. Reicher. 2007. Stolon growth and dry matter partitioning
explain differences in zoysiagrass establishment rates. Crop Sci. 47:1237-1245.
Pease, B.W., E.J. Koeritz, D.J., Soldat and J.C. Stier. 2011. N source and rate effects on velvet
bentgrass putting green turf. Crop. Sci. 51: 342-352.
Peng, Y.H., Y.F. Zhu, Y.Q. Mao, S.M. Wang, W.A. Su and Z.C. Tang. 2004. Akali grass resists
salt stress through high [K+] and an endodermis barrier to Na
+. J. Exp. Bot. 55(398):939-
949.
Pessarakli, M. and D.M. Kopec. 2008. Competitive growth responses of three cool-season
grasses to salinity and drought stresses. Acta HortScience. ISHS. Vol. 783:169-174
Pessarakli, M. and T.C. Tucker. 1988. Dry matter yield and nitrogen-15 uptake by tomatoes
under sodium chloride stress. Soil Sci. Soc. Am. J. 52:698-700.
Picchioni, G.A. and H.M. Quiroga-Garza. 1999. Growth and N partitioning, recovery, and
losses in Bermudagrass receiving soluble sources of labeled 15nitrogen. J. Amer. Soc.
Hort. Sci. 124 (6): 719-725.
Page 217
197
Polacco, J.C. and M.A. Holland. 1993. Roles of urease in plant cells; in Internationl review of
cytology. (Jeon, K.W., and J. Jarvik eds.) 145:65-103. Academic Press Inc. San Diego,
CA.
Qian, Y.L. and M.C. Engelke. 1999. Influence of trinexapac-ethyl on diamond zoysiagrass in a
shade environment. Crop Sci. 39: 202-208.
Qian, Y.L., M.C. Engelke, and M.J.V. Foster. 2000. Salinity effects on Zoysiagrass speciess and
experimental lines. Crop Sci. 40: 488-492.
Qian, Y.L, S.J. Wilhelm, and K.B Marcum. 2001. Comparative responses of two Kentucky
bluegrass speciess to salinity stress. Crop Sci. 41:1895-1900.
Reynolds, C.M., D.C. Wolf, and J.A. Armbruster. 1985. Factors related to urea hydrolysis in
soils. Soil. Sci. Soc. Am. J. Vol. 49: 104-108.
Reeves, R.D., A.J.M., Baker, A. Borhidi, and R. Berazain. 1999. Nickel hyperaccumulation in
the serpentine flora of Cuba. Annals of Botany. 83: 29-38.
Riederer, M. and C. Muller. 2006. Biology of the plant cuticle. Blackwell Publishing Ltd.
Annual Plant Reviews, Volume 23.
Sajwan, K.S., W.H. Ornes, T.V. Youngblood, and A.K. Alva. 1996. Uptake of soil applied
cadmium, nickel, and selenium by bush beans. Water Air Soil Poll. 91:209-217.
Salaiz, T.A., G.L. Horst, and R.C. Shearman. 1995. Mowing height and vertical mowing
frequency effects on putting green quality. Crop Sci. 35:1422-1425.
Schlossberg, M.J. and J. P. Schmidt. 2007. Influence of Nrate and form on quality of putting
greens cohabited by creeping bentgrass and annual bluegrass. Agron. J. 99: 99-106.
Schreiber, L. 2001. Effect of temperature on cuticular transpiration of isolated cuticular
membranes and intact leaf disks. Journal of Experimental Botany. 52:1893-1900.
Seregin, I.V., A.D. Kozhevnikova. 2006. Physiological role of nickel and its toxic effects on
higher plants. Russ.J. Plant Physiol. 53:257-277.
Sladek, B.S., G.M. Henry, and D.L. Auld. 2009. Evaluation of zoysiagrass genotypes for shade
tolerance. HortScience. 44:1447-1451.
Sirko, A. and R. Brodzik. 2000. Plant ureases: Roles and regulation. Acta Biochimica
Polonica. Vol. 47: 1189-1195.
Page 218
198
Stiegler, J.C., M.D. Richardson, D.E. Karcher, T.L. Roberts, and R.J. Norman. 2011. Field
based measurement of ammonia volatilization following foliar applications of urea to
putting green turf. Crop Sci. 51: 1767-1773.
Stiglbauer, J.B., H. Liu, L.B. McCarty, D.M. Park, J.E. Toler, and K. Kirk. 2009. ‘Diamond
zoysiagrass putting green establishment affected by sprigging rates, N sources, and rates
in the southern transition zone. HortScience. 44 (6): 1757-1761.
Soper, D.Z., J.H. Dunn, D.D. Minner, and D.A. Sleper. 1988. Effects of clipping disposal, N
and growth retardants on thatch and tiller density in zoysiagrass. Crop Sci. 28:325-328
Tabatabai, M.A., 1977. Effects of trace elements on urease activity in soils. Soil Biol. Biochem.
Vol. 9: 9-13.
Taiz, L., and E. Zeiger. 2010. Plant Physiology. Fifth Edition. Sinauer Associates, Inc.
Sunderland, MA.
Tan, X.W., H. Ikeda, and M. Oda. 2000. Effects of nickel concentration in the nutrient solution
on the N assimilation and growth of tomato seedlings in hydroponic culture supplied
with urea or nitrate as the soil N source. Scientia Horticulturae. 84: 265- 273.
Tan, X.W., H. Ikeda, and M. Oda. 1999. Absorption, translocation, and assimilation of foliar
applied urea compared with nitrate and ammonium in tomato plants. Soil. Sci. Plant
Nutr. 45 (3): 609-616.
Throssel, C.S. 1981. Management factors affecting putting green speed. M.S. Thesis. The
Pennsylvania State University, State College, PA.
Torello, W.A. and D.J. Wehner. 1983. Urease activity in a Kentucky Bluegrass turf. Agronomy
Journal. 75: 654-656.
Torello, W.A., and L.A. Rice. 1986. Effects of NaCl stress on proline and cation accumulation
in salt sensitive and tolerant turfgrasses. Plant and Soil. 93: 241-247.
Totten, F.W., H. Liu, L.B. McCarty, C.M. Baldwin, D.G. Bielenberg, and J.E. Toler. 2008.
Efficiency of foliar versus granular fertilization: A field study of creeping bentgrass
performance. Journal of Plant Nutrition. 31:972-982.
Turgeon, A. J. 2011. Turfgrass Management 9th
Edition. Prentice Hall. Upper Saddle River,
NJ.
USGA Green Section Staff, 1993. USGA Recommendations for Putting Green Construction.
USGA Green Section Record. March/April. 1993.
Page 219
199
Verbruggen, N. and C. Hermans. 2008. Proline accumulation in plants: a review. Amino acids.
35:753-759.
Wang, W. H., B. Kohler, F.Q. Cao, and L. H. Liu. 2008. Molecular and physiological aspects of
urea transport in higher plants. Plant Science. 175: 467-477.
Ward, M.R., M. Aslam, and R.C. Huffaker. 1986. Enhancement of nitrate uptake and growth of
barley seedlings by calcium under saline conditions. Plant Physiol. 80, 520-524.
Witte, C.P. 2011. Urea metabolism in plants. Plant Science. 180: 431-438.
Witte, C.P., S.A., Tiller, M.A. Taylor. 2002. Leaf urea metabolism in potato. Urease activity
profile and patterns of recovery and distribution of 15N after foliar urea application in
wild-type and urease-antisense transgenics. Plant Physiol. 128:1129-1136.
Witte, C.P. and N. Medina-Escobar. 2001. In-gel detection of urease with nitroblue tetrazolium
and quantification of the enzyme from different crop plants using the indophenols
reaction. Analytical Biochemistry 290: 102-107.
Wittwer, S. H and F. G Teubner. 1959. Foliar absorption of mineral nutrients. Annual Rev.
Plant Phys. 10:13-30.
Wood, B.W., C.C. Reilly, C.H. Bock, and M.W. Hotchkiss. 2012. Suppression of pecan scab by
nickel. HortScience. Vol 47(4): 503-508.
Wood, B.W. 2011. Iron induced nickel deficiency. HortScience. (Supplement) S133. 46. (9).
Wood, B.W., C.C. Reilly, and A.P. Nyczepir. 2004a. Mouse ear of pecan: I. symptomatology
and occurrence. Hort Science. 39(1): 87-94.
Wood, B.W., C.C. Reilly, and A.P. Nyczepir. 2004b. Mouse ear of pecan: II. Influence of
nutrient applications. HortScience. 39(1): 95-100.
Yang, X., V.C. Baligar, D.C. Martens, and R.B. Clark. 1996. Plant tolerance to nickel toxicity:
II Nickel effects on influx and transport of mineral nutrients in four plant species.
Journal of Plant Nutrition. 19(2): 265-279.
Yusuf M, F.Q, H.S., and A. Ahmad. 2011. Nickel: An Overview of Uptake, essentiality and
toxicity in plants. Bull. Environ. Contam. Toxicol. 86: 1-17.
Zhang, X., K. Wang, E.H. Ervin, C. Waltz, and T. Murphy. 2011. Metabolic changes during
cold acclimation and deacclimation in five bermudagrass varieties. I. proline, total amino
acid, protein, and dehydrin expression. Crop Sci. 51: 838-846.
Page 220
200
Zonia, L.E., N.E. Stebbins, and J.C. Polacco. 1995. Essential role of urease in germination of
nitrogen-limited Arabidopsis thaliana seeds. Plant Physiol. 107: 1097-1103.