11
Follow the Money: Declining corporate contribution to the public good Wendy Patton, Senior Associate 4/20/2011
| Date post: | 22-Dec-2015 |
| Category: |
Documents |
| View: | 214 times |
| Download: | 0 times |

Follow the Money: Declining corporate contribution to the public good
Wendy Patton, Senior Associate4/20/2011
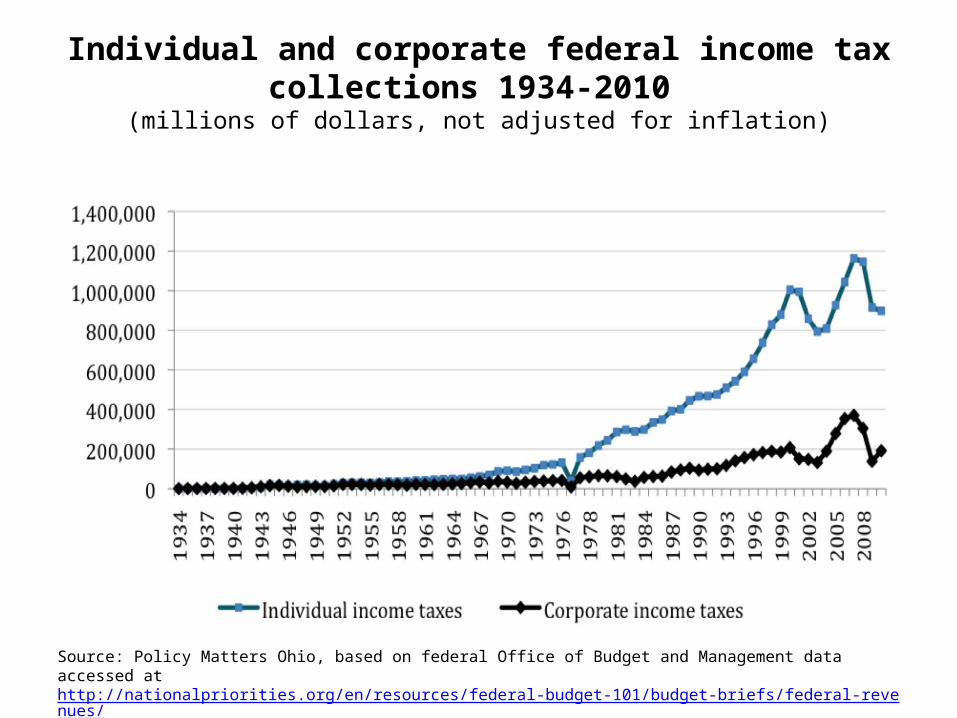
Individual and corporate federal income tax collections 1934-2010
(millions of dollars, not adjusted for inflation)
Source: Policy Matters Ohio, based on federal Office of Budget and Management data accessed at http://nationalpriorities.org/en/resources/federal-budget-101/budget-briefs/federal-revenues/ http://www.whitehouse.gov/sites/default/files/omb/budget/fy2012/assets/hist02z1.xls (4/17/2011)
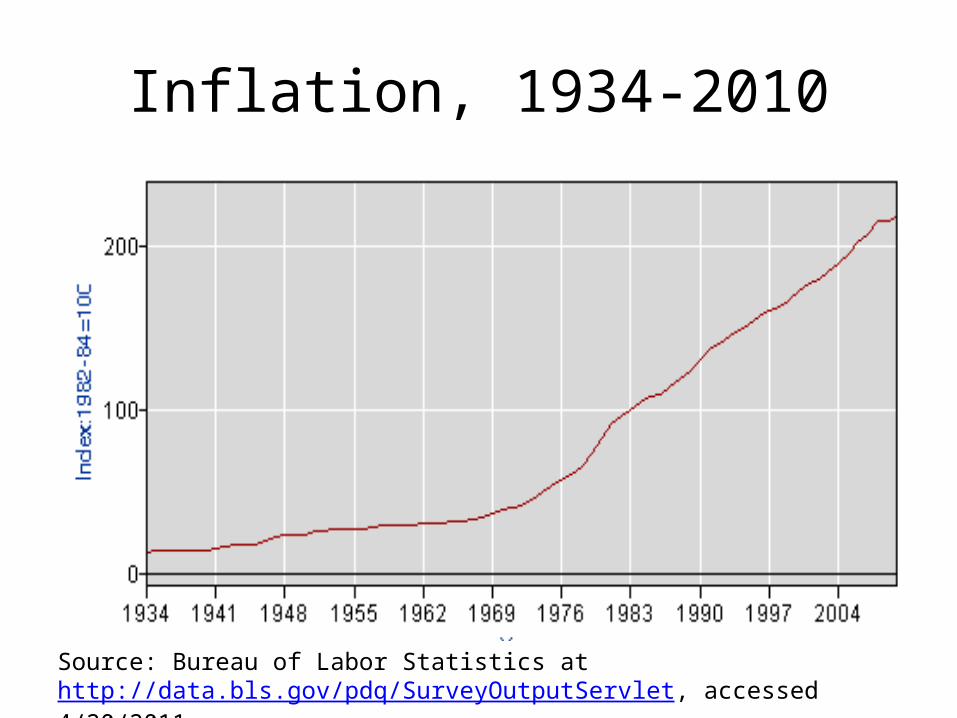
Inflation, 1934-2010
Source: Bureau of Labor Statistics at http://data.bls.gov/pdq/SurveyOutputServlet, accessed 4/20/2011
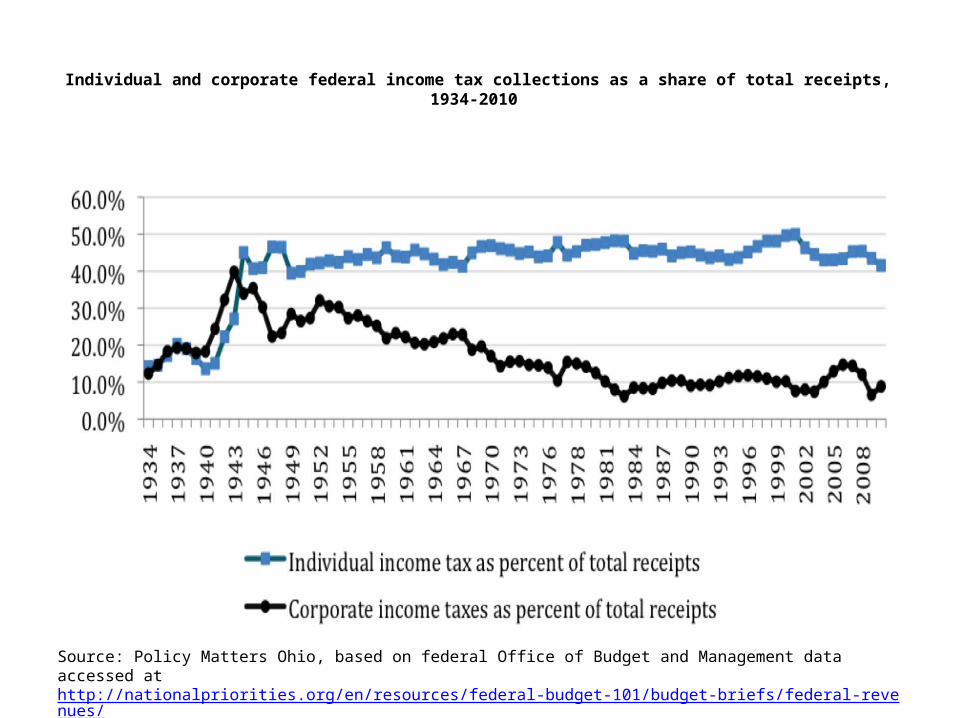
Individual and corporate federal income tax collections as a share of total receipts, 1934-2010
Source: Policy Matters Ohio, based on federal Office of Budget and Management data accessed at http://nationalpriorities.org/en/resources/federal-budget-101/budget-briefs/federal-revenues/ http://www.whitehouse.gov/sites/default/files/omb/budget/fy2012/assets/hist02z1.xls (4/17/2011)
Corporate share of taxes have declined
Between 1960 and 2010 corporate income taxes went from 23% of total federal revenues to 7%.
Supply side economics justifies corporate flight from civic responsibilities
Tax loopholes, avoidance mechanisms– Accelerated depreciation – Stock options for top executives– Tax credits Offshore tax sheltering– Weakening of the Alternative Minimum Tax for
Corporations
Tax Loopholes
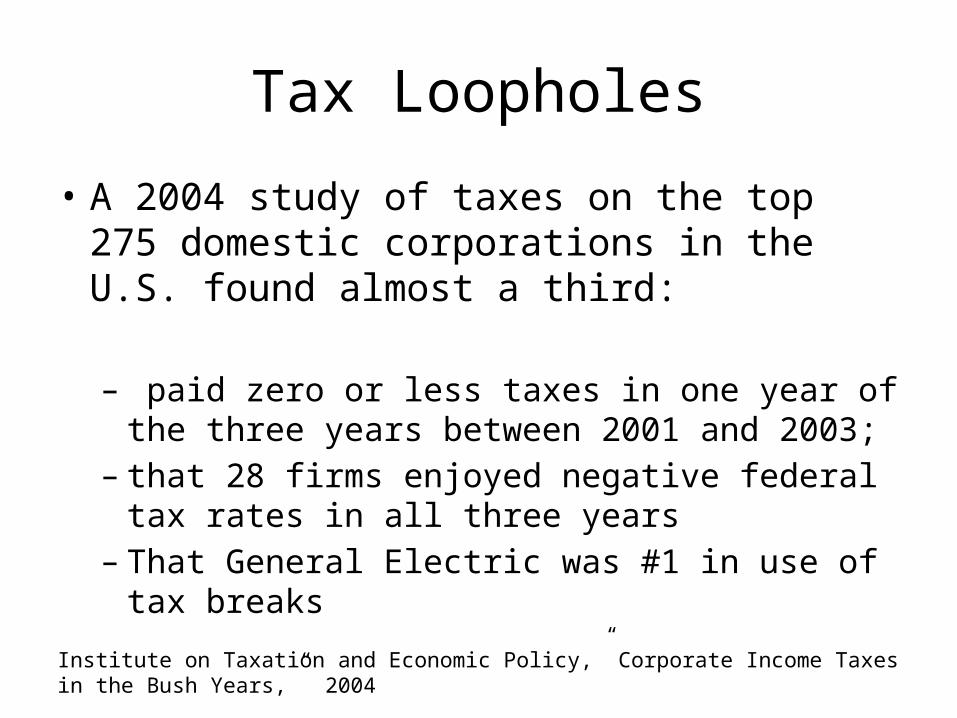
• A 2004 study of taxes on the top 275 domestic corporations in the U.S. found almost a third:
– paid zero or less taxes in one year of the three years between 2001 and 2003;
– that 28 firms enjoyed negative federal tax rates in all three years
– That General Electric was #1 in use of tax breaks
Institute on Taxation and Economic Policy,” Corporate Income Taxes in the Bush Years,” 2004

Does it work?
• A $70.9 billion tax incentive through accelerated depreciation over 2001-2003 was intended to spur capital investment and create jobs.
• On average, the 275 firms studied received $175 million each from this tax incentive.
• Total investment at the top 275 companies studied dropped by 12 percent between 2001 and 2002
• …and by another 3 percent between 2002 and 2003.Institute on Taxation and Economic Policy,” Corporate Income Taxes in the Bush Years,” 2004

General Electric
• General Electric, the nation’s largest company, reported worldwide profits of $14.2 billion in 2010, and said $5.1 billion of the total came from its operations in the United States, but it paid no taxes here; instead, it claimed a tax benefit of $3.2 billion.
• The company has eliminated a fifth of its work force in the United States while increasing overseas employment.
• In that time, G.E.’s accumulated offshore profits have risen to $92 billion from $15 billion.
David Kocieniewski, G.E.’s Strategies Let It Avoid Taxes Altogether, New York Times, March 24, 2011, http://www.nytimes.com/2011/03/25/business/economy/25tax.html?sq=Immelt%20taxes&st=cse&scp=4&pagewanted=all Accessed 4/17/2011.
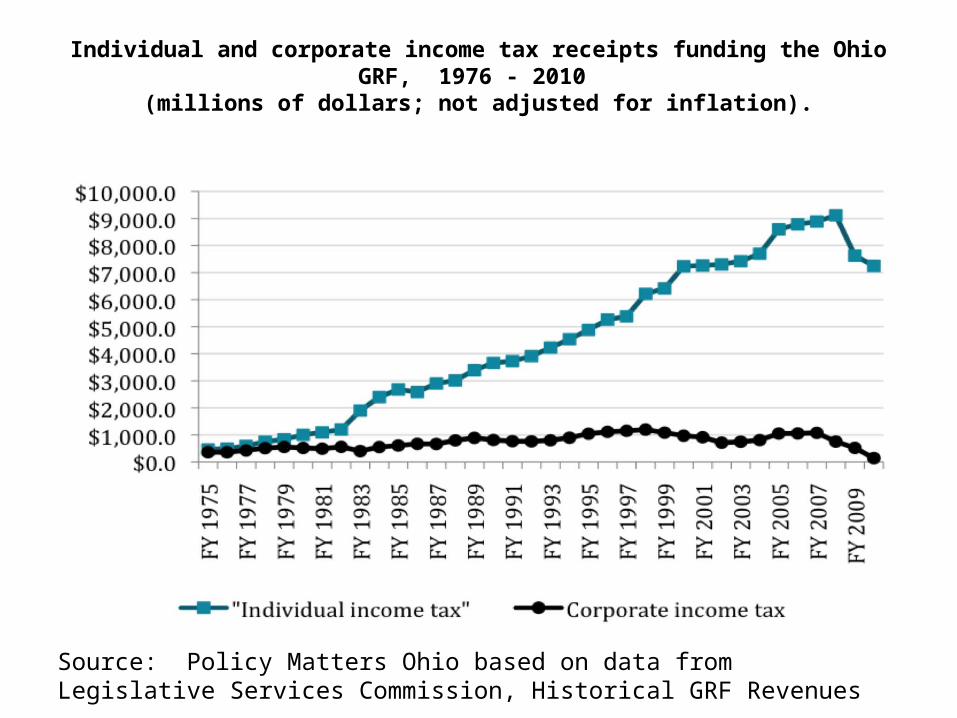
Individual and corporate income tax receipts funding the Ohio GRF, 1976 - 2010 (millions of dollars; not adjusted for inflation).
Source: Policy Matters Ohio based on data from Legislative Services Commission, Historical GRF Revenues
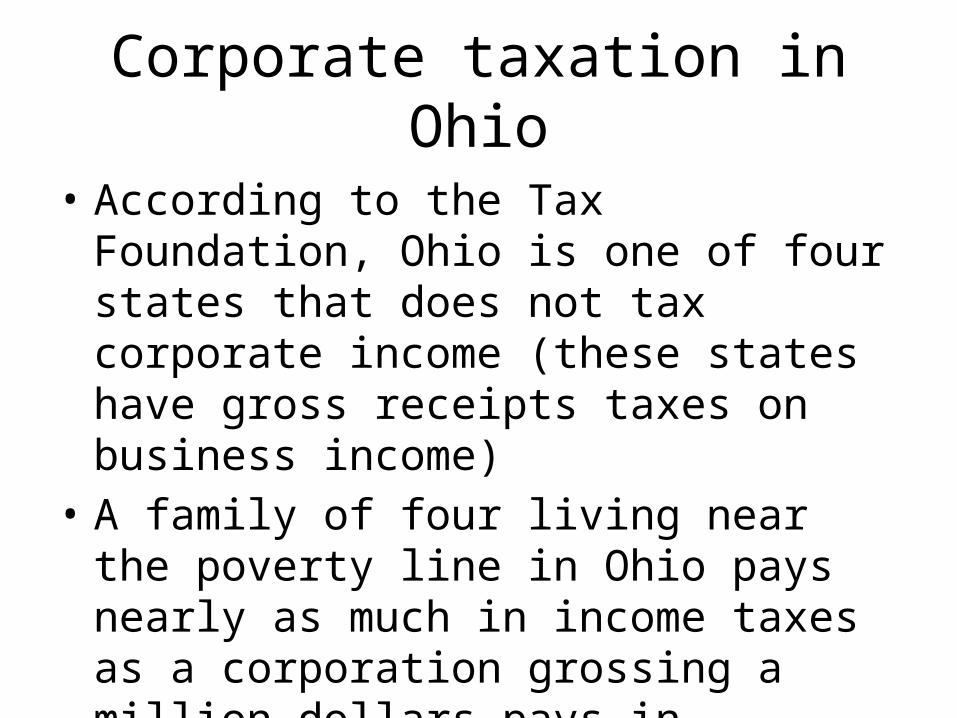
Corporate taxation in Ohio
• According to the Tax Foundation, Ohio is one of four states that does not tax corporate income (these states have gross receipts taxes on business income)
• A family of four living near the poverty line in Ohio pays nearly as much in income taxes as a corporation grossing a million dollars pays in Commercial Activity Tax.

2005 overhaul of Ohio taxes gave biggest tax cut in 70 years, failed to deliver jobs
Ohio’s share of the nation’s jobs: Total non-farm employment and manufacturing employment
Source: BLS, CES, non-agricultural employment, annual averages
2000 2001 2002 2003 2004 2005 2006 2007 2008 2009 20100.00%
1.00%
2.00%
3.00%
4.00%
5.00%
6.00%
7.00%
5.91% 5.80% 5.80% 5.81% 5.74% 5.70% 5.63% 5.56% 5.51%5.31% 5.38%
4.27% 4.20% 4.18% 4.15% 4.11% 4.06% 3.99% 3.95% 3.92% 3.88% 3.87%
Ohio manufacturing jobs Ohio total employment


