Prefatory Note The attached document represents the most complete and accurate version available based on original copies culled from the files of the FOMC Secretariat at the Board of Governors of the Federal Reserve System. This electronic document was created through a comprehensive digitization process which included identifying the best- preserved paper copies, scanning those copies, 1 and then making the scanned versions text-searchable. 2 Though a stringent quality assurance process was employed, some imperfections may remain. Please note that this document may contain occasional gaps in the text. These gaps are the result of a redaction process that removed information obtained on a confidential basis. All redacted passages are exempt from disclosure under applicable provisions of the Freedom of Information Act. 1 In some cases, original copies needed to be photocopied before being scanned into electronic format. All scanned images were deskewed (to remove the effects of printer- and scanner-introduced tilting) and lightly cleaned (to remove dark spots caused by staple holes, hole punches, and other blemishes caused after initial printing). 2 A two-step process was used. An advanced optimal character recognition computer program (OCR) first created electronic text from the document image. Where the OCR results were inconclusive, staff checked and corrected the text as necessary. Please note that the numbers and text in charts and tables were not reliably recognized by the OCR process and were not checked or corrected by staff.
Transcript
Prefatory Note
The attached document represents the most complete and accurate version available based on original copies culled from the files of the FOMC Secretariat at the Board of Governors of the Federal Reserve System. This electronic document was created through a comprehensive digitization process which included identifying the best-preserved paper copies, scanning those copies,1 and then making the scanned versions text-searchable.2 Though a stringent quality assurance process was employed, some imperfections may remain.
Please note that this document may contain occasional gaps in the text. These gaps are the result of a redaction process that removed information obtained on a confidential basis. All redacted passages are exempt from disclosure under applicable provisions of the Freedom of Information Act.
1 In some cases, original copies needed to be photocopied before being scanned into electronic format. All scanned images were deskewed (to remove the effects of printer- and scanner-introduced tilting) and lightly cleaned (to remove dark spots caused by staple holes, hole punches, and other blemishes caused after initial printing). 2 A two-step process was used. An advanced optimal character recognition computer program (OCR) first created electronic text from the document image. Where the OCR results were inconclusive, staff checked and corrected the text as necessary. Please note that the numbers and text in charts and tables were not reliably recognized by the OCR process and were not checked or corrected by staff.
Confidential (FR) Class II FOMC
Part 2August 15 1996
CURRENT ECONOMICAND FINANCIAL CONDITIONS
Recent Developments
Prepared for the Federal Open Market Committee
By the staff of the Board of Governors of the Federal Reserve System
Confidential (FR) Class III FOMC
August 15, 1996
RECENT DEVELOPMENTS
Prepared for the Federal Open Market Committeeby the staff of the Board of Governors of the Federal Reserve System
__ _ _
_
DOMESTIC NONFINANCIALDEVELOPMENTS
DOMESTIC NONFINANCIAL DEVELOPMENTS
The limited data now available for the third quarter suggest
some slackening in the pace of economic expansion since the spring,
but just how much is far from clear. Although private domestic
final demand appears to be decelerating, lean inventory positions at
midyear may be prompting some restocking. Employment continues to
expand at a pace sufficient to maintain the tautness in the labor
market that produced a pickup in wage gains in the first half of the
year. However, major price measures have shown no signs of
underlying acceleration.
GDP in the Second Quarter
According to BEA's advance estimate, real GDP grew 4.2 percent
at an annual rate in the second quarter of 1996. As shown in the
table, we anticipate a downward revision to this figure, to about
3.7 percent. In particular, June inventory investment came in below
BEA's expectations. For final sales, revised estimates of June
retail sales will likely pare the advance estimate of PCE. Although
no new source data have become available, the second-quarter
estimate of federal purchases looks oddly high and seems likely to
be revised down. New information on construction put in place and
capital goods shipments lead us to expect an upward revision to
second-quarter business fixed investment. In addition, after
reviewing the other available second-quarter information, we think
that BEA's assumptions for imports in June may have been too skimpy.
SECOND-QUARTER GDP GROWTH(Billions of 1992 chained dollars)
Teenagers 52.7 53.5 52.9 52.6 52.5 53.5 51.4 52.220-24 years old 77.0 76.6 76.1 76.9 77.0 77.5 76.5 76.6Men, 25 years and older 76.0 76.0 75.6 76.0 76.1 76.0 76.3 76.4Women, 25 years and older 58.1 58.3 58.5 58.4 58.6 58.6 58.7 58.9
193156-20-21
-7-1
-1325
10119283537
-1.234.341.6
II-3
Labor Market Developments
Labor market indicators have been mixed of late. Private
nonfarm payroll employment rose 156,000 in July, a pace considerably
slower than the average monthly increase of 219,000 for the first
half of the year. And, with a 0.4 hour decline in average weekly
hours, production-worker hours dropped back sharply to a level equal
to the second-quarter average.
In the household survey, however, total employment increased
274,000 last month--maintaining the rapid pace of the first half.
The labor force participation rate rose 0.2 percentage point in
July, again reaching 66.9 percent--its high point for the year.
Since bottoming out at 66.4 percent in the fourth quarter of 1995,
the participation rate has returned to levels more consistent with
our estimate of its trend. The rebound in participation has been
widespread across demographic groups; only the rate for teenagers
has shown a decline since the end of 1995.
The published unemployment rate edged up to 5.4 percent in
July, from 5.3 percent in June; however, on a concurrently
seasonally adjusted basis, the rate was 5.4 percent in both months.
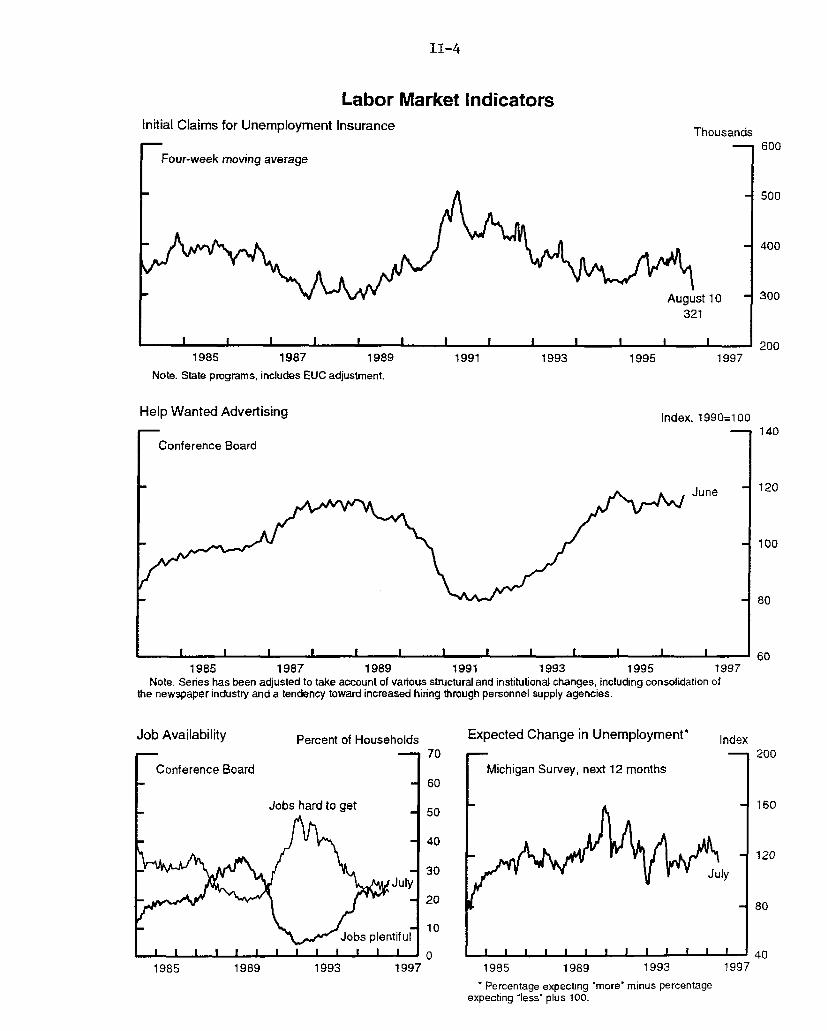
Other recent indicators also suggest continued labor market
strength. Initial claims for unemployment insurance have averaged
331,000 per week since the beginning of July--the lowest level for
any six-week period since early 1995.1 The adjusted Help Wanted
Index rose appreciably in June, to the high end of the range that
has prevailed for the past two years. Consumers' appraisals of job
availability improved considerably in July in the Conference Board's
survey of consumer attitudes. The July Michigan survey of consumers
similarly showed an improvement in expectations for unemployment
over the next twelve months.
According to the BLS, output per hour in the nonfarm business
sector edged down at an annual rate of 0.1 percent in the second
quarter--a figure the staff expects to be revised down to a
1. Claims were volatile in July and early August, rising to370,000 during the week ended July 6 and then falling sharply to
294,000 during the week ended July 27, before rebounding somewhat in
the first two weeks of August. This volatile pattern--seen eachJuly for the past three years--reflects the inability of seasonal
factors to account for annual variation in the timing of summer
layoffs in the automobile and textile industries. In addition,unusually small layoffs at GM this year--as the automaker attemptedto rebuild its inventories--contributed to the especially lowJuly 27 claims figure.
II-4
Labor Market IndicatorsInitial Claims for Unemployment Insurance
rFour-week moving average
Thousands
August 10321
--- 1 -- I--- -- I--- -- l l i i1985 1987 1989
Note. State programs, includes EUC adjustment.
Help Wanted Advertising
I Conference Board
1991 1993 1995 1997
Index, 1990=100
June
1985 1987 1989 1991 1993 1995 1997Note. Series has been adjusted to take account of various structural and institutional changes, including consolidation of
the newspaper industry and a tendency toward increased hiring through personnel supply agencies.
Job Availability
FConference Board
Percent of Households Expected Change in Unemployment*
1985 1989 1993
SPercentage expecting "more" minus percentageexpecting "less' plus 100.
600
500
400
300
200
140
120
100
80
60
Index
19971985 1989 1993 1997
II-5
PUBLISHED LABOR PRODUCTIVITY(Percent change from preceding period at compound annual rate;
based on seasonally adjusted data)
1995 1996 19 9 5 :Q2
to
19941 19951 Q3 Q4 Q1 Q2 1996:Q2
Output per hour
Total business .3 .3 1.7 -.6 2.0 .5 .9Nonfarm business .5 .3 2.0 -1.1 1.8 -.1 .7Manufacturing 4.5 3.5 5.3 3.7 5.6 1.5 4.0
1. Changes are from fourth quarter of preceding year to fourthquarter of year shown.
2. The nonfinancial corporate sector includes all corporations doingbusiness in the United States with the exception of banks, stockand commodity brokers, finance and insurance companies; the sectoraccounts for about two-thirds of business employment.
Productivity in the Nonfarm Business Sector
1992 Chain-weighted dollars per hour
1990 1993 19961984 19871975 1978 1981
II-6
GROWTH IN SELECTED COMPONENTS OF INDUSTRIAL PRODUCTION(Percent change from preceding comparable period)
Proportion1995:Q4 19941 19951
1996 1996
01 Q2 May June July
-Annual rate- --Monthly rate---
Total indexPrevious
ManufacturingMotor veh. and partsAircraft and parts
Manufacturing excludingmotor vehicles,aircraft, and parts
Consumer goodsDurablesNondurables
Business equipmentOffice and computingIndustrialOther
Defense andspace equipment
Construction supplies
MaterialsDurablesNondurables
MiningUtilities
Memo:Information-related products2
100,0
86.55.51,7
79,2
23.13.7
19.4
13.63.14.36.1
1.7
5.3
28.720.38.2
6.07.5
11.2
6.66.6
7.68.6-7.9
8.0
4.76.44.4
13.129.68.68.4
-10.5
8.0
10.512.16.9
1.2.2
1.61.6
1.4-2.6
-17.1
2.2
.1-.4.2
7.736.23.5.8
-7.3
-. 4
3.46.3-2.8
-1.86.2
3.03.0
2.4-20.764.0
3.0
.2-5.41.2
13.948.44.14.9
-1.7
.6
3.67.1
-5.0
1.98.9
6.05.6
6.546.515.2
4.0
-.77.4-2.2
8.241.4-3.2-1.4
5.9
5.5
6.44.0
12.5
8.8.0
.5.5
.5
.31,2
.5.2
.8
.1
.02.5-. 4-. 5
.6
1.1
.8
.8
.8
-.21.2
.6.5
.72.7.5
.6
.03.6-. 7
1.11.9-.5.2
.1
2.2
.81.0.3
1.7-1.5
.1
.34.3.3
.0
-. 1-. 1
.0
-. 11.7-. 2-. 4
-.5
.0
.4
.5
.1
-.3-1.8
20.7 21.4 21.6 19.3 1.4 1.4 1.3
1. From the final quarter of the previous period to the final quarter of the periodindicated.2. Includes computer equipment, computer parts, semiconductors, communications
equipment, and selected instruments.
CAPACITY UTILIZATION(Percent of capacity; seasonally adjusted)
1988-89 1967-95 1995 1996 1996
High Avg. Q2 Q1 Q2 May June July
Total industry
Manufacturing
Primary processingAdvanced processing
84.9
85.2
89.083.5
82.1
81.4
82.680.7
83.7
83.0
87.681.0
82.8
81.6
85.280.1
83.2
82.1
86.080.4
83.2
82.0
86.080.3
83.4
82.3
86.580.6
83.2
82.3
86.280.7
II-7
0.6 percent decline. Nonfarm output now is estimated to have risen
3.7 percent at an annual rate (1/2 percentage point below the
published BLS number), while hours worked jumped 4.2 percent (annual
rate). Over the four quarters ended in the second quarter, labor
productivity rose 0.5 percent--a bit less than in the year-earlier
period.
Industrial Production
Industrial production edged up 0.1 percent in July, following
three consecutive months of strong growth. 2 Manufacturing output
posted a 0.3 percent gain that was mostly offset by declines in
utilities and in mining; electricity generation dropped sharply for
a second month, as a result of unseasonably cool weather, and coal
production fell. Roughly two-thirds of the gain in manufacturing
production was the direct result of a strong advance in the output
of motor vehicles and parts. The remainder of the increase occurred
in the output of information-related products and the production of
aircraft and parts. The growth in these areas of manufacturing
was tempered by lackluster production of non-auto consumer durables
and industrial equipment.
Production of motor vehicles in July--13.4 million vehicles at
an annual rate--came in well above both the announced schedules in
place at the beginning of the month and the strong pace in June.
With the pickup in production, the days' supply of cars moved back
to more comfortable levels. In contrast, the days' supply of light
trucks was at the upper end of the range that has prevailed since
early 1995. Some of the surge in production may reflect
precautionary stockbuilding against the possibility of a strike by
2. The July estimate of manufacturing activity shows anincrease despite the considerable drop in manufacturing hoursreported in the BLS payroll survey. Several factors account forthis divergence: First, physical product data for paper,paperboard, and motor vehicles were strong compared with thecorresponding hours data. Second, some of the decreases in hoursoccurred in industries that have lower value-added weights in IPthan employment shares. Third, a few industries showed sharpdecreases in hours because of unusually timed vacation periodsduring the payroll survey reference week that should have a smallereffect on output for the month as a whole. Finally, we werecautious in reading the July decline in hours for the computer andoffice equipment industry too literally because weakness in thesehours through June did not turn out to be consistent with otherinput indicators.
3. The continuing strike at a McDonnell Douglas plant, whichstarted on June 5 and involves about 6,700 workers, had a negligibleeffect on manufacturing output.
II-8
Consumer Goods
Selected Components ofIndustrial Production, by Market Group
Note: Components may not sum to totals because of rounding.
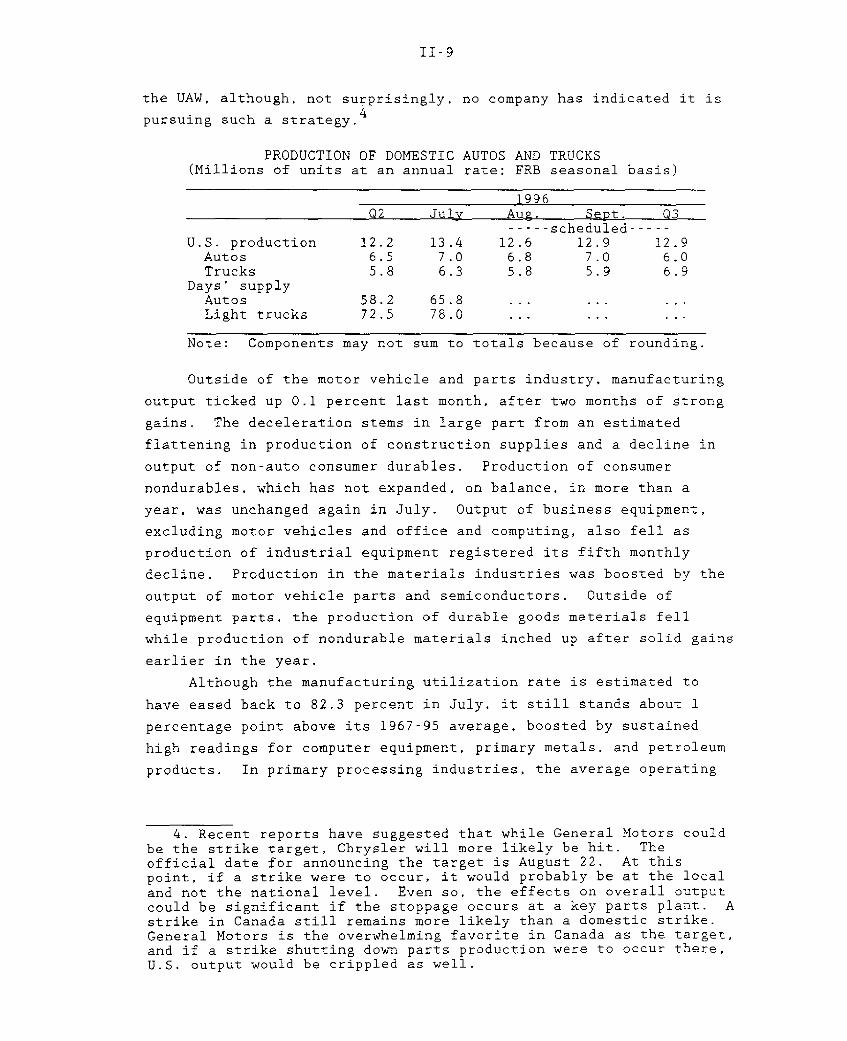
Outside of the motor vehicle and parts industry, manufacturing
output ticked up 0.1 percent last month, after two months of strong
gains. The deceleration stems in large part from an estimated
flattening in production of construction supplies and a decline in
output of non-auto consumer durables. Production of consumer
nondurables, which has not expanded, on balance, in more than a
year, was unchanged again in July. Output of business equipment,
excluding motor vehicles and office and computing, also fell as
production of industrial equipment registered its fifth monthly
decline. Production in the materials industries was boosted by the
output of motor vehicle parts and semiconductors. Outside of
equipment parts, the production of durable goods materials fell
while production of nondurable materials inched up after solid gains
earlier in the year.
Although the manufacturing utilization rate is estimated to
have eased back to 82.3 percent in July, it still stands about 1
percentage point above its 1967-95 average, boosted by sustained
high readings for computer equipment, primary metals, and petroleum
products. In primary processing industries, the average operating
4. Recent reports have suggested that while General Motors couldbe the strike target, Chrysler will more likely be hit. Theofficial date for announcing the target is August 22. At thispoint, if a strike were to occur, it would probably be at the localand not the national level. Even so, the effects on overall outputcould be significant if the stoppage occurs at a key parts plant. Astrike in Canada still remains more likely than a domestic strike.General Motors is the overwhelming favorite in Canada as the target,and if a strike shutting down parts production were to occur there,U.S. output would be crippled as well.
II-10
SALES OF AUTOMOBILES AND LIGHT TRUCKS(Millions of units at an annual rate; FRB seasonals)
Note. Components may not add to totals because of rounding. Data on salesof trucks and imported autos for the most recent month are preliminary andsubject to revision.1. Excludes the estimated effect of automakers' changes in reporting periods.2. Excludes some vehicles produced in Canada that are classified as imports
by the industry.
GM and Ford Fleet Sales
CONFIDENTIAL Millions of units1.5
1.25
1
0.75
0.5
0.25
0
Marketing Incentives for Light Vehicles(FRB seasonals)
Constant dollars per vehicle
1992 1993 1994 1995 1996
Data from J.D. Powers, deflated by CPI for new motor vehicles.1993 1994 1995 1996
II-11
rate dropped to 86.2 percent in July, above its long-term average
but below the high levels seen in early 1995.
Personal Income and Consumption
Consumer spending evidently has weakened somewhat on average in
the past couple of months after expanding briskly in the spring.
Nonetheless, the fundamentals suggest that this should be no more
than a temporary pause; The underlying trend in income appears
solid, and recent readings on consumer sentiment have been very
positive.
Sales of new light vehicles, adjusted for changes in reporting
periods, dropped in July from the 15.1 million unit pace in
June. 5 Most of the weakness owed to a cutback in fleet sales by
General Motors--by 0.5 million units, primarily in autos--while GM's
retail sales were about unchanged (confidential).6 Consumer
demand for light vehicles remained at a high level in July, and
consumers' appraisals of buying conditions for new vehicles remained
positive, encouraged by a continuation of sizable sales incentives.
Total nominal retail sales moved up 0.1 percent in July,
despite a steep decline in spending at automotive dealers. 7
Nominal outlays in the retail control category, which excludes sales
at automotive dealers and building material and supply stores, rose
0.5 percent. Within the retail control category in July, gains in
outlays at food, drug, and "other durable goods" stores more than
offset weak spending elsewhere. Many industry analysts have
attributed the July weakness in some of the more discretionary
categories of retail sales (such as apparel and furniture) to two
special factors. First, the Olympics may have kept potential
5. The major Japanese firms counted sales during the first coupleof days of July as June sales. We estimate that this shift reducedsales in July by about 0.2 million units. Sales in June were notdistorted, however, because the May reporting period was extendedinto early June. Thus, the dip in July sales was an offset to theupward boost to May sales. The major Japanese firms intend tocontinue shifting their reporting periods as they see fit as long asthe reporting period for Ford is different from that of GM andChrysler.
6. General Motors may have deliberately curbed fleet sales inJuly to ensure that consumers were not inhibited by limitedsupplies. At the beginning of July, inventories of General Motors'autos were particularly lean, and with most assembly plants closedduring the first two weeks of July, the prospects of limited stocksrestricting overall sales likely increased. This situation alsolikely played some role in the firm's decision to step up productionwell beyond initial plans for the second half of the month.
7. Sales of fleet vehicles typically occur through the dealernetwork and thus are captured in the retail sales data.
Total pre-tax household income grew rapidly in the second
quarter, boosted in part by a spurt in private wages and salaries in
June. However, real disposable income increased at only a
1-1/2 percent annual rate during the quarter, and with robust
8. BEA has in the past made a judgmental adjustment to the"spectator sports" subcategory of recreation services to captureincreases in spending associated with major sports events. Forexample, BEA estimated that real outlays on spectator sports grew atan annual rate of 41 percent in the third quarter of 1984, when theOlympics were held in Los Angeles. This increase contributed lessthan 0.1 percentage point to annualized growth in total PCE in thatquarter, however.
Indicators of Housing Demand(Seasonally adjusted; FRB seasonals)
Builders' Rating of New Home SalesDiffusion index
Aug. (p) -
1I_ I .
1988 1989 1990 1991 1992 1993 1994 1995 1996Note. The index is calculated from National Association of Homebuilders data as the proportion of respondents rating current sales as good
to excellent minus the proportion rating them as poor.
MBA Index of Mortgage Loan Applications for Home PurchaseIndex
Aug. 9
80
40
+0
40
80
250
200
150
100
SI I I I I
1990 1991 1992 1993 1994 1995
Note. MBA index equals 100 on March 16, 1990, for NSA series.
Consumer Homebuying Attitudes
1996
Diffusion index
I I I I I I I I
19961988 1989 1990 1991 1992 1993 1994 1995Note. The homebuying attitudes index is calculated from Survey Research Center data as the proportion of respondents
rating current conditions as good minus the proportion rating such conditions as bad.
II-18
BUSINESS CAPITAL SPENDING INDICATORS(Percent change from preceding comparable period;
based on seasonally adjusted data, in current dollars)
1995 1996 1996
Q4 Q1 Q2 May June July
Producers' durable equipment
Shipments of nondefense capital goods 3.0 -.5 2.7 2.8 -.2 n.a.Excluding aircraft and parts 3.1 .8 1.3 .3 2.7 n.a.Office and computing 5.1 3.7 -1.8 .1 -.1 n.a.Communications equipment 7.7 -.3 4.4 4.2 5.5 n.a.All other categories 1.4 .0 1.7 -.6 3.1 n.a.
Shipments of complete aircraft I -3.9 1.4 10.4 38.2 -43.0 n.a.
Sales of heavy trucks 6.4 -2.2 1.2 10.0 -6.9 .1
Orders of nondefense capital goods 8.8 3.1 -6.7 11.1 -5.2 n.a.Excluding aircraft and parts 3.4 3.1 -1.9 -.3 1.9 n.a.Office and computing 7.5 2.1 .4 -1.2 1.4 n.a.Communications equipment 2.3 8.7 -8.4 -7.7 8.0 n.a.All other categories 2.2 2.2 -1.1 1.8 .7 n.a.
1. From the Current Industrial Report "Civil Aircraft and Aircraft Engines."Monthly data are seasonally adjusted using FRB seasonal factors constrained toBEA quarterly seasonal factors. Quarterly data are seasonally adjusted usingBEA seasonal factors.
2. Based on 1992 chain-weighted data; percent change, annual rate.n.a. Not available.
II-19
buying has remained about unchanged in recent months after rising in
the spring.
Price increases for new and existing homes slowed in the second
quarter of this year. The constant-quality new home price index
rose just 1.9 percent from the year-earlier level; this rise was
roughly in line with the moderate rates of increase in 1995. The
reduced growth of new home prices occurred despite a rapid increase
in lumber prices and may reflect an effort by builders to avoid
creating "sticker shock" that could result from a combination of
rising mortgages rates and increasing home prices. A survey of home
builders showed that concern about lumber prices and supply
increased substantially in the second quarter but that somewhat
greater concern was expressed about housing affordability. The
repeat-sales price index for existing homes rose 5.1 percent, year
over year, in the second quarter, down only slightly from its pace
in the first quarter--the highest since late 1989.
Multifamily housing starts dropped 20 percent in June,
continuing the up-and-down pattern that has prevailed so far this
year. The vacancy rate for multifamily rental units edged up in the
second quarter, compared with a year earlier, marking the third
consecutive quarter in which vacancies have risen on a year-over-
year basis; this suggests that apartment construction for the nation
as a whole has outpaced demand.
Business Fixed Investment
According to BEA's advance estimate, real business fixed
investment increased at an annual rate of only 0.5 percent in the
second quarter. Key source data released subsequently suggest that
this estimate will be revised upward to something over 3 percent, a
pace still much lower than the 11.6 percent gain posted in the first
quarter. Smoothing through the quarterly swings, growth over the
first half probably was about 7-1/4 percent at an annual rate, just
a little above the 6.4 percent rise over the four quarters of 1995.
These figures are below the peak rates of the cycle, as would be
expected on the basis of waning accelerator effects and moderating
cash flow growth.
Factoring in shipments data for June, we estimate that real
outlays for PDE rose between 4 and 5 percent at an annual rate in
the second quarter, compared with a 13 percent annual pace in the
first quarter. Real domestic aircraft outlays were particularly
weak. While shipments by domestic producers increased 10 percent
II-20
Orders and Shipments of Nondefense Capital Goods
Office and Computing EquipmentBillions of dollars
- Shipments------- Orders
__ h June
I-,
S -
1992 1993 1994 1995
Communications Equipment
Shipments------- Orders
1996
Billions of dollars
-1June
* a
I I I I
1992 1993 1994 1995
Other Equipment (Excluding Aircraft, Computing, and Communications Equiptment)
-Shipments------ Orders ,A -'
I *' ' t
1996
Billions of dollars
June
1-'
1994 1995 19961992 1993
II-21
Total Building
Nonresidential Construction and Contracts(Six-month moving average)
Note. For contracts, total includes private only, while individual sectors include public and private.
' "
II-22
(quarterly rate) in the second quarter, an unusually large fraction
of these shipments was exported. All told, the large drop in
domestic aircraft outlays subtracted about 3 percentage points from
real PDE growth in the second quarter.
Outlays for real office and computing equipment posted another
hefty gain in the second quarter, although growth was down from the
stratospheric rate posted in the first quarter. While expenditures
tailed off in nominal terms, real expenditures were amplified by an
accelerated decline in BEA's computer deflator, which dropped 20
percent at an annual rate in the second quarter versus 15 percent in
the first. The fast descent of computer prices reflected in part a
pass-through of the recent sharp decline in semiconductor9
prices.
Other components of PDE continued to grow at a steady clip in
the second quarter. Real business purchases of communications
equipment increased at an annual rate of 10 percent, a slight
step-up from the first-quarter pace. Purchases of other types of
equipment advanced at about the same brisk pace as in the first
quarter, with outlays for industrial equipment posting an especially
noteworthy increase.
Very little information is available to get a fix on PDE for
the current quarter. Nominal bookings for office and computing
equipment rose in June but were about flat for the second quarter as
a whole. Given the sharp price declines experienced in that sector
on net over the past few months, this suggests that unit sales
likely are holding up well.1 0 Elsewhere, the picture is more
9. The continued strength in this sector may seem surprising,given that many computer and semiconductor manufacturers have seentheir stock prices drop off sharply. Memory chip manufacturerMicron, for example, has lost about three-quarters of its value overthe past year. IOmega, a "hot" disk drive manufacturer has lostmore than half of its value since May. Such corrections havegenerally affected semiconductor manufacturers, who facedramatically increased competitive forces this year spawned by rapidcapacity growth, and trendy new technology issues, whose shareprices arguably far outstripped any sensible valuation. Incontrast, such blue chip computer companies as Intel, Microsoft, andCompaq have posted very positive earnings reports and have seentheir share prices move quite favorably.
10. Anecdotal reports suggest that office and computing equipmentwill continue to be a source of strength for the remainder of theyear. Indeed, a hardware upgrade wave may occur over the comingmonths. Microsoft announced the release of the MS Windows NT 4.0operating system on July 31. This new operating system, which isexpected to be in heavy demand by corporate users, incorporates animproved user interface, built-in Internet access, and expanded(Footnote continues on next page)
II-23
mixed. Bookings for communications equipment dropped back
significantly in the second quarter, suggesting a slowing in
shipments of these goods in the third quarter. On the other hand,
orders for nondefense capital goods besides aircraft and information
processing equipment--the segment for which orders have the most
value as a leading indicator--increased in April, May, and June
after a sharp drop in March. In addition, unfilled orders for these
goods remained at a relatively healthy level, suggesting continued
gains in this component in the months ahead.
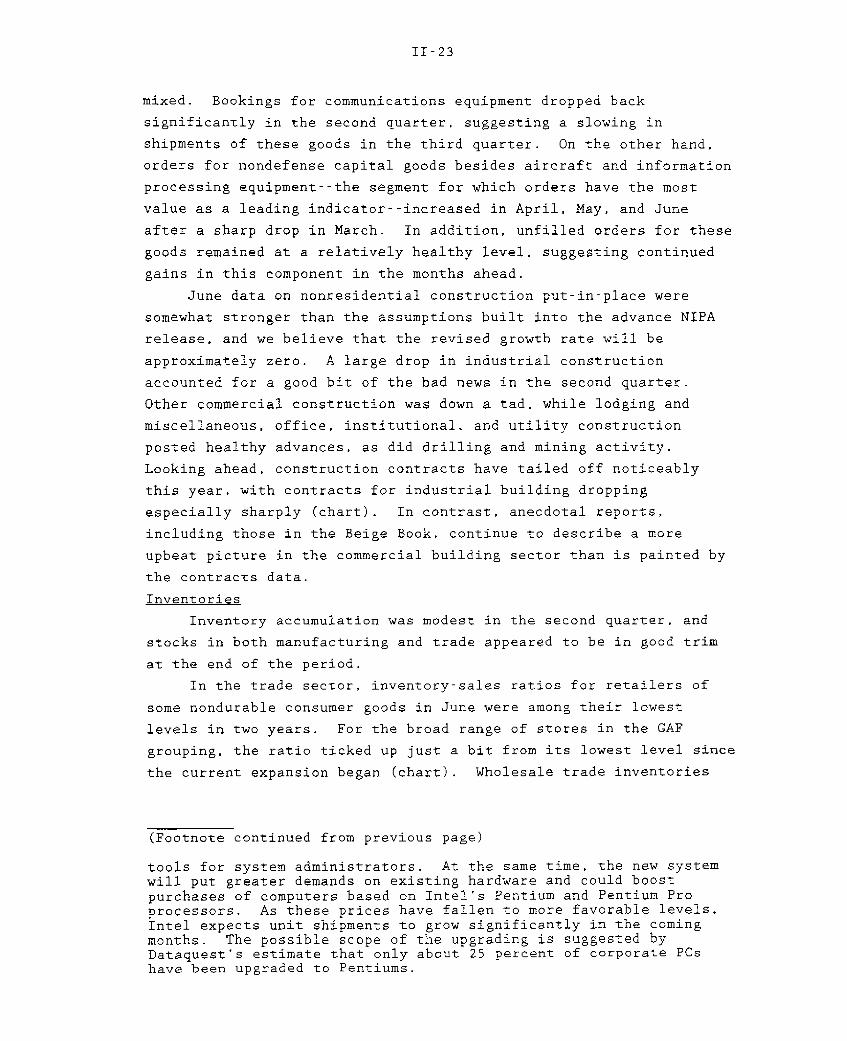
June data on nonresidential construction put-in-place were
somewhat stronger than the assumptions built into the advance NIPA
release, and we believe that the revised growth rate will be
approximately zero. A large drop in industrial construction
accounted for a good bit of the bad news in the second quarter.
Other commercial construction was down a tad, while lodging and
miscellaneous, office, institutional, and utility construction
posted healthy advances, as did drilling and mining activity.
Looking ahead, construction contracts have tailed off noticeably
this year, with contracts for industrial building dropping
especially sharply (chart). In contrast, anecdotal reports,
including those in the Beige Book, continue to describe a more
upbeat picture in the commercial building sector than is painted by
the contracts data.
Inventories
Inventory accumulation was modest in the second quarter, and
stocks in both manufacturing and trade appeared to be in good trim
at the end of the period.
In the trade sector, inventory-sales ratios for retailers of
some nondurable consumer goods in June were among their lowest
levels in two years. For the broad range of stores in the GAF
grouping, the ratio ticked up just a bit from its lowest level since
the current expansion began (chart). Wholesale trade inventories
(Footnote continued from previous page)
tools for system administrators. At the same time, the new systemwill put greater demands on existing hardware and could boostpurchases of computers based on Intel's Pentium and Pentium Proprocessors. As these prices have fallen to more favorable levels.Intel expects unit shipments to grow significantly in the comingmonths. The possible scope of the upgrading is suggested byDataquest's estimate that only about 25 percent of corporate PCshave been upgraded to Pentiums.
II-24
CHANGES IN MANUFACTURING AND TRADE INVENTORIES(Billions of dollars at annual rates;based on seasonally adjusted data)
1995 1996 1996
Q4 Q1 Q2 Apr. May June
Book value basis
Total 13.9 16.7 13.9 53.0 -17.4 6.0Excluding wholesale and
Note. Components may not sum to totals because of rounding.1. A shift in payment timing occurs when the first of the month falls on a
weekend or holiday. The monthly and fiscal year to date outlays for defense,Medicare, income security, and "other" have been adjusted to account for thisshift.
2.1-55.5
-. 758.3
7.1
-39.3
126.122.519.032.713.67.62.213.415.2
151.960.835.926.9
2.145.637.08.6
1158.4203.9172.4251.7118.667.019.5
167.9157.4
1018.0442.3380.4141.579.6368.3118.289.3
1180.7201.2180.1262.0130.268.519.9
175.3143.3
1090.5491.8401.6174.083.8
385.8128.784.2
22.3-2.77.8
10.311.61.5
.47.4
-14.0
72.549.521.232.54.2
17.610.5-5.1
1.9-1.34.54.19.82.32.34.4
-8.9
7.111.25.6
23.05.24.88.9
-5.7
II-27
fell again in June, with the biggest declines in stocks of apparel
and electrical goods; inventories held by most types of wholesale
establishments remained in line with sales.
In manufacturing, inventory corrections continued through June.
Excluding the volatile aircraft series, factory stocks fell at an
annual rate of $11.2 billion (book value) in June and $9.8 billion
for the second quarter as a whole. The sizable cutbacks left
inventories in most industries well-aligned with new orders and
shipments, and the stock-sales ratio for the manufacturing sector as
a whole in June about matched the low last seen in January 1995.
Much of manufacturers' recent book-value inventory liquidation
occurred in stocks of materials and supplies, where declining prices
likely played a part; the runoff may also reflect cautious plans for
near-term production.
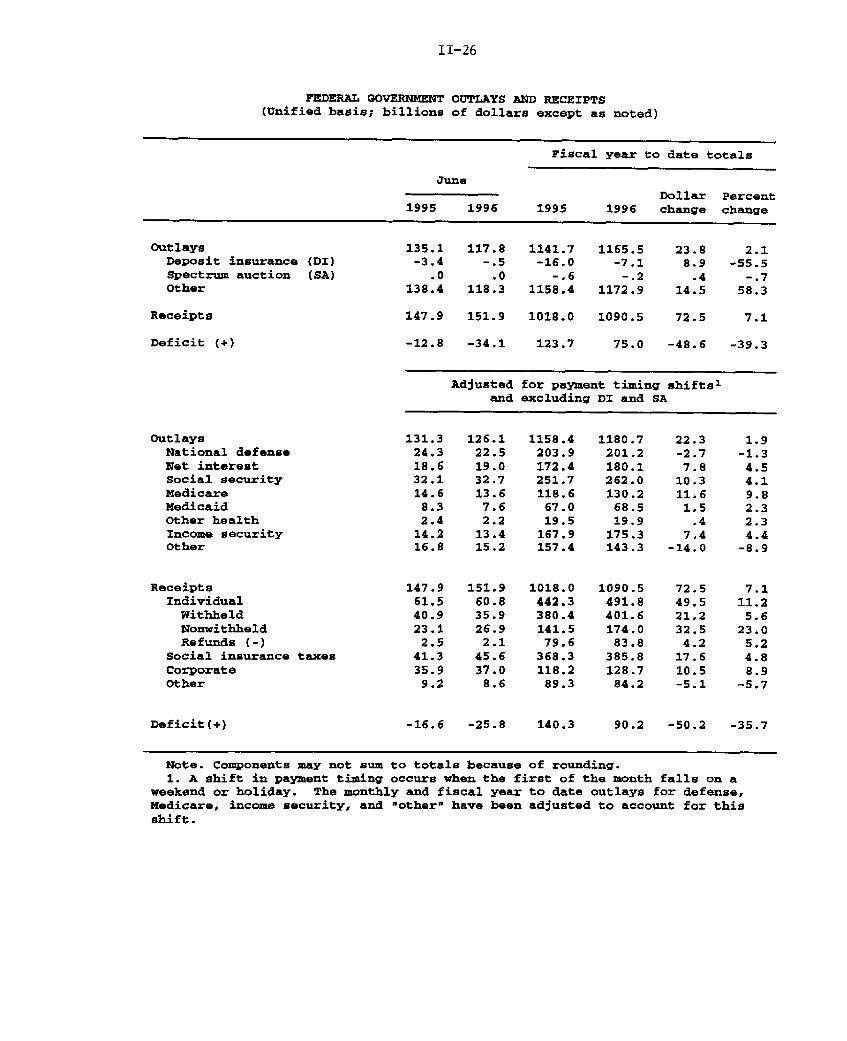
Federal Government
The incoming news on the unified budget for fiscal 1996 has
continued to be favorable. For the first nine months of the fiscal
year, the budget deficit was $75 billion, $49 billion less than last
year.
Strong corporate profits and a probable increase in capital
gains realizations by individuals have raised receipts so far this
fiscal year 7 percent over the same period last year. Much of the
11 percent year-over-year growth in individual income taxes was
recorded in April nonwithheld taxes; according to Treasury data, the
April surge in nonwithheld taxes reflected extraordinary strength in
both final payments on 1995 liability and the first quarterly
estimated payment on 1996 liability. The second quarterly payment
on 1996 liability apparently was also large, as individual
nonwithheld taxes in June were 16 percent higher than last year.
The growth of outlays (adjusted for timing shifts and certain
financial transactions) was a subdued 2 percent so far this fiscal
year, owing in part to reductions in discretionary appropriations.
In addition, Medicaid outlays have risen only 2 percent, reflecting
restrained growth in health-care costs, tightened restrictions on
disbursements for disproportionate share hospitals, and an overall
slowing in caseloads.
Real federal expenditures for consumption and gross investment
increased at an 8.4 percent annual rate in the second quarter,
according to BEA's advance estimate. Large gains were recorded in
both the defense and the nondefense categories. The jump in outlays
II-28
ADMINISTRATION BUDGET AND ECONOMIC PROJECTIONS
1996 1997 1998 1999 2000 2001 2002
Budget projections(Billions of dollars; fiscal years)
March Policy Deficit
ChangesTechnical ReceiptsOther
July Policy Deficit
Outlays
Receipts
146
-27-2
117
1570
1453
140
-9-5
126
1631
1505
98 64 28
-106
94
1680
1586
-7
-3
55
1716
1661
-7-9
11
1759
1748
-8 -44
-8-10
-26
1808
1834
-8-9
-61
1864
1925
Nominal GDP
Real GDP
CPI-U
Economic assumptions(Calendar years)
------------------ Percentage change, Q4 to Q4 ------------------
Note. The projections assume that the President's tax and spending proposals areenacted.
Source. Mid-Session Review of the 1997 Budget, Office of Management and Budget,July 16. 1996.
II-29
for defense was in line with the data on a unified basis. However,
the second-quarter increase in nondefense spending appears a bit
anomalous, as such growth does not appear in the corresponding
unified budget accounts: consequently, we are anticipating a
downward revision in the estimate.
The Administration released its Mid-Session Review of the
Budget on July 16. The budget estimates incorporate revised
economic and technical assumptions, the effects of legislation
enacted between March and mid-July, and changes in proposed
policies. Under the President's proposals, the Administration now
projects that the deficit will be $117 billion in fiscal 1996, edge
up to $126 billion in fiscal 1997, and then fall steadily--turning
to surplus in fiscal 2001 and 2002. Relative to its March
projections, most of the Administration's revisions were attributed
to the unexpectedly large increase in individual income tax
collections in April, which resulted in upward revisions to receipts
of $27 billion in fiscal 1996 and about $10 billion in subsequent
years. The largest changes to economic assumptions were to ten-year
Treasury yields and near-term GDP growth; both were revised up.
Welfare reform legislation was recently passed by Congress, and
the President is expected to sign it shortly. The bill establishes
the Temporary Assistance for Needy Families block grant to replace
the main federal cash assistance program, Aid to Families with
Dependent Children, and three smaller, related programs. While each
state will have wide discretion in designing its program, it must
meet certain conditions in order to avoid a reduction in its federal
grant. In particular, (1) except in hardship cases, it cannot use
federal funds to provide assistance to families that have already
received five years of benefits after the effective date of the
block grant, (2) it must move a specified percentage of welfare
recipients into qualifying work-related activities, and (3) its
outlays for fiscal years 1997 through 2001 must equal or exceed
75 percent of its fiscal 1994 expenditures on the displaced federal
programs. The bill also consolidates several child care programs
into a single Child Protection block grant program, significantly
reduces public assistance payments to legal and illegal aliens,
reduces food stamp allotments, and limits the time that able-bodied
adults, age 18 to 50 without dependents, may receive food stamps
without working.
II-30
Other legislation passed by Congress raises the minimum wage,
reduces taxes for small businesses, reinstates the airline ticket
tax, and enacts a package of health insurance reforms.
State and Local Governments
Real spending by state and local governments jumped 6 percent
at an annual rate in the second quarter. This followed weather-
related weakness during the winter quarter and reflected strong
advances in real compensation and construction. State and local
government employment rose 40,000 in July, nearly twice the average
monthly increase during the first six months of the year. As in
June, the biggest advance was among educational workers employed by
local governments, a category for which seasonal adjustment is
especially difficult.
A recent survey from the National Conference of State
Legislatures confirms the continuing improvement in state general
fund budgets, as ending balances increased as a percentage of
expenditures for the fourth consecutive year in fiscal 1996. The
strengthening picture is attributed to rising revenues combined with
restrained growth in spending. Reserves are expected to remain
strong in fiscal 1997. Outlays for corrections once again should
increase rapidly, and spending on higher education is expected to
increase at its fastest pace since the late 1980s as states try to
restore funding. Meanwhile, growth in spending for Medicaid is
expected to slow to around 4 percent, owing to declining caseloads,
federal reform actions, and state managed-care programs. The survey
was taken before the federal welfare reform was enacted, but the
states anticipated a further drop in outlays for AFDC this year on
the expectation that the expanding national economy and various
welfare reform measures in many states would help reduce growth in
caseloads.
The recently passed federal welfare legislation is supportive
of state programs that seek to reduce caseloads, and states will no
longer have to receive federal waivers before reducing payments or
imposing time limits. However, some provisions of the new federal
bill--especially those affecting immigrants--could result in greater
state funding of services. In addition, the administrative burdens
of several programs likely will rise.
Labor Costs
Recent data on hourly compensation indicate that labor costs
are gradually accelerating. In the second quarter, the employment
II-31
cost index (ECI) for private industry workers rose at an annual rate
of 3.2 percent, somewhat faster than its first-quarter pace of
2.9 percent and the 2.6 percent rate registered in the second half
of 1995. Over the year ended in June, ECI hourly compensation
increased 2.9 percent--about a quarter percentage point above the
low for the twelve-month change in the series reached in the second
half of 1995.
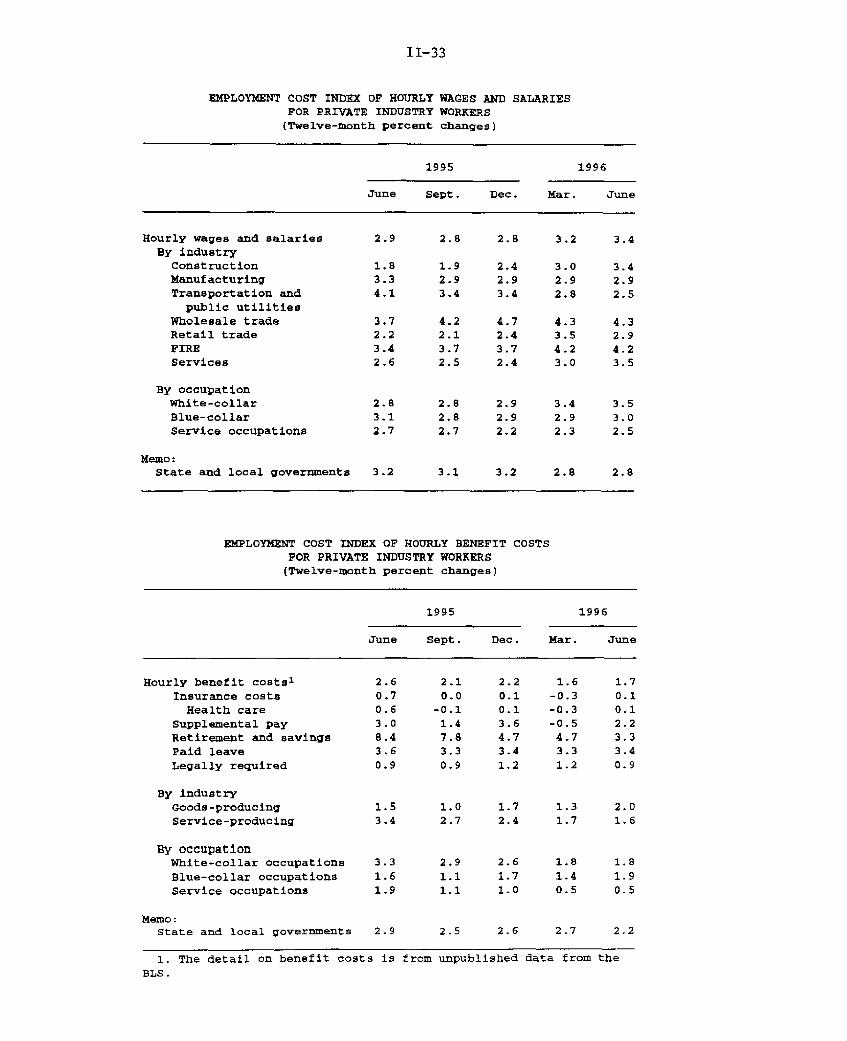
The wages and salaries component of the ECI rose 3.6 percent
(annual rate)--apart from the 4-1/4 percent surge in the first
quarter, the biggest increase since the second quarter of 1991. One
factor was the rapid acceleration in the wages and salaries of sales
workers in wholesale trade and in finance, insurance, and real
estate. But outside of sales workers, growth in wages and salaries
was 1/4 percentage point higher in the past twelve months than in
the year-earlier period, with greater wage gains for professional
specialty workers and managerial workers leading the way.
Benefits costs were up at a 2.7 percent annual rate in the
second quarter, but this came after essentially no change in the
first three months of this year and did not reverse a favorable
trend. 1 1 The twelve-month change in hourly benefits costs was
smaller than in the year-earlier period; this slowing largely
reflected decelerating costs for health insurance, workers'
compensation, retirement and savings, and nonproduction bonuses.
Compensation per hour in the nonfarm business sector, as
measured by the productivity and costs (P&C) data, rose 3.7 percent
at an annual rate in the second quarter and 3.8 percent over the
past year. The second-quarter increase in compensation per hour was
somewhat faster than that in the ECI, but discrepancies between12
these two measures are common. In the present instance, faster
growth in the wages and salaries component of P&C compensation was
only partially offset by slower growth in the benefits component.
11. The current report corrected processing errors in thepreviously published figures for 1995:Q4 and 1996:Q1. The mostnotable change was a 2.1 percentage point downward revision to thegrowth in benefits costs in 1995:Q4. For total compensation, growthin 1995:Q4 was revised down 0.6 percentage point. Growth in 1996:Q1was not revised, as a downward revision to wages and salaries wasoffset by an upward revision to benefits. The general effect of thecorrections was to smooth the progression of compensation gains overthe past few quarters.
12. On a quarterly basis, the absolute difference between the twomeasures has averaged 1.5 percentage points (annual rate) since1980.
II-32
EMPLOYMENT COST INDEX OF HOURLY COMPENSATIONFOR PRIVATE INDUSTRY WORKERS
1995
June Sept. Dec. Mar. June
----- Quarterly percent(compound annual
Total hourly compensation 1
Wages and salariesBenefit costs
By industryConstructionManufacturingTransportation and
public utilitiesWholesale tradeRetail tradeFIREServices
By occupationWhite-collarBlue-collarService occupations
Memo:State and local governments
Total hourly compensationExcluding sales workersWages and salaries
Excluding sales workersBenefit costs
2.6 2.6 2.9 3.23.0 2.6 4.3 3.62.4 2.1 -0.3 2.7
3.0 3.0 2.6 2.32.2 3.2 1.9 3.84.2 3.2 1.9 2.5
4.1
-1.05.93.7
2.5 3.5 3.12.6 2.2 3.20.3 1.3 2.6
2.8 2.5 2.8
----- Twelve-month percent change----
By industryConstructionManufacturingTransportation and
public utilitiesWholesale tradeRetail tradeFIREServices
By occupationWhite-collarBlue-collarService occupations
Memo:State and local governments
1.4 2.2 2.6 2.72.3 2.6 2.5 2.83.8 3.7 3.1 3.0
2.8 2.8 3.0 3.02.3 2.4 2.5 2.62.4 1.9 1.9 2.0
3.0 2.9 2.8 2.6
1. Seasonally adjusted by the BLS.
1996
change-------rate)
II-33
EMPLOYMENT COST INDEX OF HOURLY WAGES AND SALARIESFOR PRIVATE INDUSTRY WORKERS(Twelve-month percent changes)
1995 1996
June Sept. Dec. Mar. June
Hourly wages and salaries 2.9 2.8 2.8 3.2 3.4By industry
Construction 1.8 1.9 2.4 3.0 3.4Manufacturing 3.3 2.9 2.9 2.9 2.9Transportation and 4.1 3.4 3.4 2.8 2.5
Workers' Compensation Insurance State Unemployment InsurancePercent Percent
14 . . . 25
12 20
10
4 .5
20
-5
II-35
The latest data on labor costs are average hourly earnings in
July, which fell 0.2 percent after a 0.8 percent rise in June. The
decline reflected changes in the composition of employment by
industry, and adjusting for these mix shifts, average hourly
earnings were unchanged in July. Taking a longer view, average
hourly earnings have risen 3.1 percent over the past year--in line
with the 3.2 percent rise in the comparable ECI for wages and
salaries of production or nonsupervisory workers.
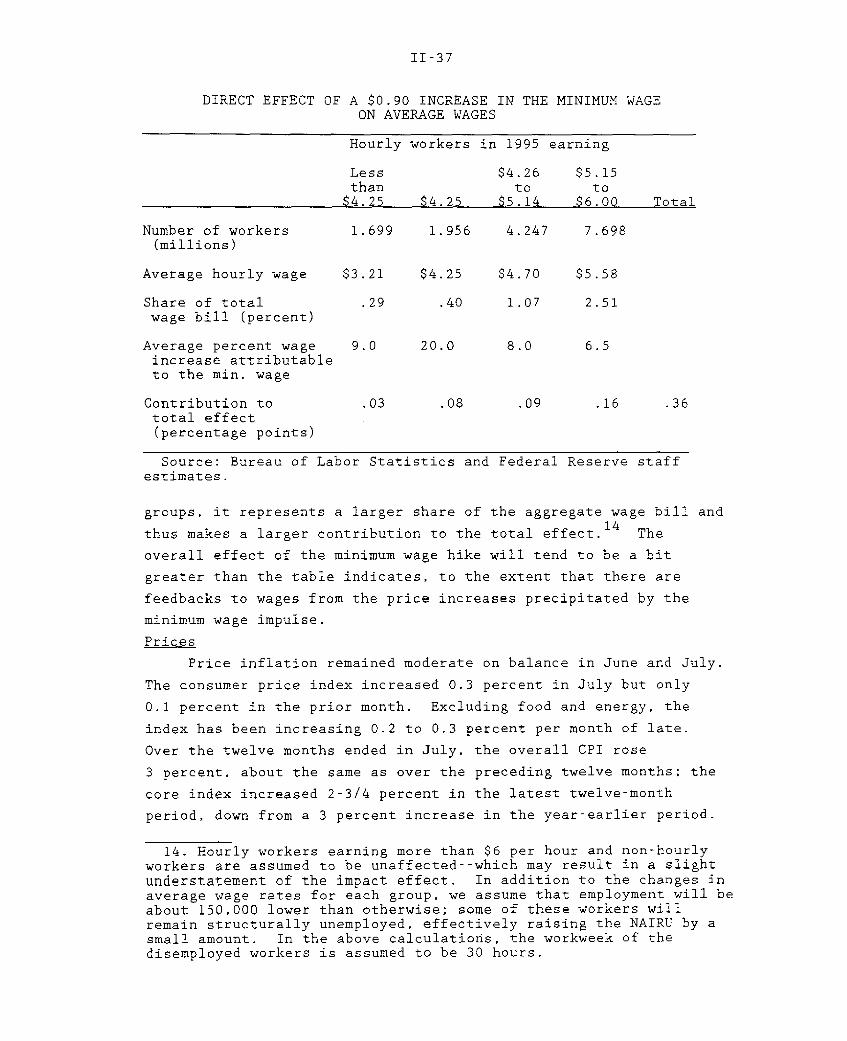
An additional development that will shortly affect labor costs
is the recent passage of legislation to raise the federal minimum
wage a total of $0.90 per hour: from $4.25 per hour to $4.75 per
hour on October 1, 1996 and to $5.15 per hour on September 1, 1997.
The staff estimates that the direct effect of the 90-cent increase
will be to raise the average wage between 0.3 percent and
0.4 percent by September 1997 or a bit less than 0.2 percent in each
of the two years. As shown in the table, workers earning the
current minimum of $4.25 per hour (the second column) accounted for
less than 1/2 percent of the aggregate wage bill in 1995, and we
assume that this group's average hourly wage will increase about
20 percent.13 Some workers reporting current wage rates less
than $4.25 per hour (the first column) will likely receive wage
increases in step with the minimum wage, while others, including
tipped employees whose total hourly earnings already exceed $5.15 or
workers not covered by the legal minimum (such as certain
agricultural workers) may not receive any increase. Averaging
across these groups, we are assuming a 9 percent average increase in
the hourly wage for those workers currently earning less than the
minimum. Workers with wage rates somewhere between the current
minimum and the new higher minimum (the third column) constitute a
larger share of the aggregate wage bill and are assumed to receive
wage increases averaging about 8 percent to bring them up to the new
minimum. We also expect to see ripple effects on workers earning
just above the new, higher minimum wage (the fourth column) as
employers act to partially maintain the current structure of
relative wages. Although the assumed percentage increase in the
average wage rate of this latter group is smaller than for the other
13. The legislated increase in the statutory minimum wage is21.2 percent, but some would receive increases during the periodanyway. In the second through fourth columns we have madeallowances for this.
II-36
PUBLISHED LABOR PRODUCTIVITY AND COSTS, NONFARM BUSINESS SECTOR(Percent change from preceding period at compound annual rate;
Finished consumer foods (23.4)Finished energy (13.4)Finished goods less food
and energy (63.2)
Consumer goods (38.5)Capital equipment (24.7)
Intermediate materials (100) 3
Intermediate materialsless food and energy (82.6)
Crude materials (100) 4
2.61.23.0
1.1
2.110.4-2.2
3.8
3.62.65.1
15.5
3.4 2.04.1 12.92.7 2.8
1.4
2.1-0.4-0.2
3.3
3.22.73.7-3.7
4.218.42.5
0.6
1.5 2.48.6 -5.81.0 -1.8
0.7-2.20.2
.0
0.3-1.1-0.5
0.5-0.40.3
.0
0.2-0.1-0.1
3.0
3.12.93.7
-16.2
4.0 0.55.3 21.2
1.5 0.6
6.1 -0.2 -0.2
7.4 -1.8 -3.4
2.413.1
1.1
1.40.4
1.6-2.1
0.2
0.3-0.1
0.2-0.9
0.1
-0.10.3
1.8 -0.5 -0.3
-0.1
-0.1 11.6 19.2 17.5 -2.3
Crude food materials (44.7)Crude energy (31.4)Crude materials less
food and energy (23.9)
1.0-9.413.8
24.715.1-13.5
-0.982.5-8.9
39.712.3
-10.2
-0.3
1.2
2.71.4
-1.6
1.4-7.7-1.4
1. Relative importance weight for CPI, December 1995.2. Relative importance weight for PPI, December 1995.3. Relative importance weight for intermediate materials, December 1995.4. Relative importance weight for crude materials, December 1995.
II-39
Retail energy prices have begun to follow crude oil prices back
down: The CPI for energy fell 2.2 percent in June and 0.4 percent
in July, after three months of large increases. Gasoline prices
posted large declines in June and July, while fuel oil prices have
been falling since May. Electricity rates were about flat, on
balance, in June and July, although consumer rebates for some
utilities in June generated large monthly swings.
Retail food prices increased 0.5 percent in July after a
0.7 percent increase in June. Meat prices pushed up food prices in
both months; fruit and vegetable prices were responsible for the
especially large increase in June. Prices of poultry and pork have
continued to increase rapidly, reflecting higher costs of feed
grains. Beef prices have also begun to be affected by rising feed
costs; earlier in the year, beef prices had been depressed by the
slaughter of cattle in anticipation of higher feed costs.
The CPI for commodities other than food and energy was
unchanged for the third consecutive month in July. Over the past
six months, nonfood, non-energy goods prices have increased just
0.4 percent at an annual rate, down from a 2.3 percent pace in the
previous six-month period. Among categories contributing to this
deceleration were apparel and housekeeping supplies. The
deceleration in apparel prices may reflect exchange rate
developments, as the strength in the dollar early this year
depressed import prices. Prices of housekeeping supplies have
likely benefited from recent declines in input costs, notably for
paper and chemicals. Used car prices, which are quite volatile,
have also contributed to the recent deceleration in CPI goods
prices.
The CPI for services other than energy increased 0.3 percent in
June and July, in line with the average pace over the past year and
a half. Owners' equivalent rent--the largest component of the CPI--
increased 0.3 percent in July and just 0.1 percent in June, bringing
the increase over the past six months to 2.7 percent at an annual
rate, down from 3.6 percent over the preceding twelve-month period.
The volatile airfares component of the CPI has increased rapidly so
far this year. Looking ahead, a 10 percent federal air ticket tax
was reinstated in recent legislation, and, ceteris paribus, should
lead to further increases in air fares beginning this month.
II-40
Commodity Price Measures
Journal of Commerce IndexRatio scale, index, 1990=100
Note. Weekly data, Tuesdays. Vertical lines on small panels indicate week of last Greenbook. The Journal of Commerce index is based almostentirely on industrial commodities, with a small weight given to energy commodities, and the KR-CRB spot price index consists entirely of industrialcommodities, excluding energy. The KR-CRB futures index gives about a 60 percent weight to food commodities and splits the remaining weight roughlyequally among energy commodities, industrial commodities, and precious metals. Copyright for Journal of Commerce data is held by CIBCR, 1994.
II-41
BROAD MEASURES OF INFLATION(Four-quarter percent changes)
1993 1994 1995 1996Q2 Q2 02 02
Product prices
GDP chain-type priceindex 2.6 2.2 2,6 2.1
GDP deflator 2.6 2.1 2.6 2.1
Nonfarm business chain- 2.6 2.1 2.5 1.7type price index
Expenditure Prices
Gross domestic purchases 2.5 2.0 2.7 2.0chain-type price index
Less food and energy 2.6 2.2 2.7 1.8
PCE chain-type priceindex 2.8 2.1 2.7 2.1
Less food and energy 3.0 2.5 2.6 1.8
PCE deflator 2.8 2.1 2.7 2.0Less food and energy 3.0 2.4 2.6 1.7
CPI 3.1 2.4 3.0 2.9Less food and energy 3.4 2.8 3.0 2.7
Median CPI 3.0 2.9 3.1 3.0
1. Excluding housing.
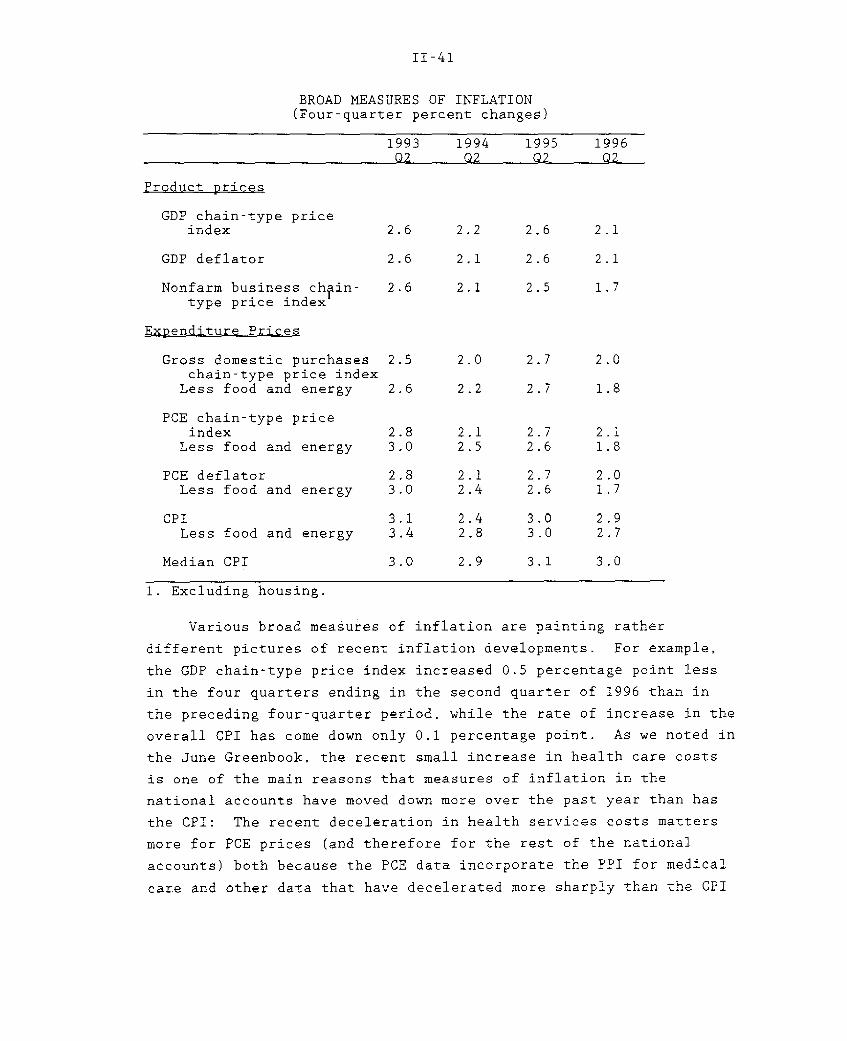
Various broad measures of inflation are painting rather
different pictures of recent inflation developments. For example,
the GDP chain-type price index increased 0.5 percentage point less
in the four quarters ending in the second quarter of 1996 than in
the preceding four-quarter period, while the rate of increase in the
overall CPI has come down only 0.1 percentage point. As we noted in
the June Greenbook, the recent small increase in health care costs
is one of the main reasons that measures of inflation in the
national accounts have moved down more over the past year than has
the CPI: The recent deceleration in health services costs matters
more for PCE prices (and therefore for the rest of the national
accounts) both because the PCE data incorporate the PPI for medical
care and other data that have decelerated more sharply than the CPI
1. Changes, if not specified, are from thethe last week of the period indicated.
2. Week of the June Greenbook.
last week of the preceding year to
-23.53.4
-11.7
-. 6.5
36.0-4.5
.48.4
-15.5
-9.124.99.9
37.09.86.4
.0
44.2
-5.0-9.71.5.0
-7.7.7.0
.6-2.1
18.811.5
13.87.2
17.2
10.08.01.9
3.7-14.2
5.7-2.1
-1.0
2.51.1.9
3.9
-32.4-4.8
-23.1
.3-6.5
75.7-9.1
32.414.323.7
7.322.0-1.3
86.08.3
40.4-7.8
-6.3
-5.0-13.2
6.71.5
II-43
for medical services, and because the PCE chain-type price index
puts a larger weight on medical services than does the CPI. 1 5
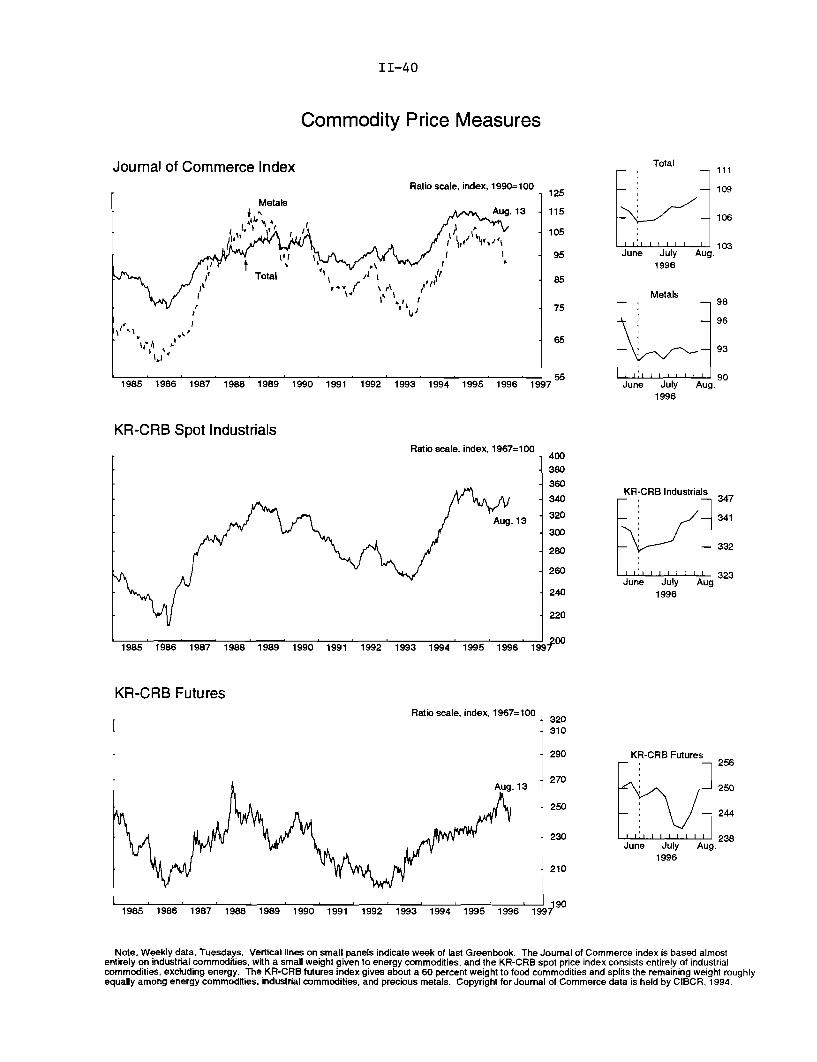
Industrial materials prices have continued to fall so far this
year: The PPI for intermediate materials excluding food and energy
is down 1-1/4 percent through July, while the Journal of Commerce
industrial materials price index is off about 3 percent so far this
year. Apart from the general lack of pressure on industrial
capacity, a number of special factors have contributed to the
continued softness in nonfarm metals prices in particular. Most
notably, copper prices have plummeted in recent weeks after an
attempt by a Sumitomo Corporation unit to corner the copper market
was exposed. Less dramatically, aluminum prices have been depressed
over the past year or so by increased exports by Russia and other
nations of the former Soviet Union, where reduced defense
expenditures have freed capacity for the export market.16 Reduced
defense spending may also be restraining increases in the prices of
other metals, such as zinc and manganese, because the federal
government has been reducing its stockpiles as part of the ongoing
downsizing of the defense establishment.
Agriculture
Spot prices of agricultural crops have been extremely volatile
since June. The spot price for corn rose sharply in early July as
dry weather in the Corn Belt threatened this year's crop, but it
then began to drop in mid-July when rainfall in the Midwest reduced
fears of a poor harvest. This week it has surged once again in
response to a surprisingly low USDA estimate of the harvest. The
cash price of wheat, which has been less volatile, has generally
trended lower since June but remains in a high range by historical
standards.
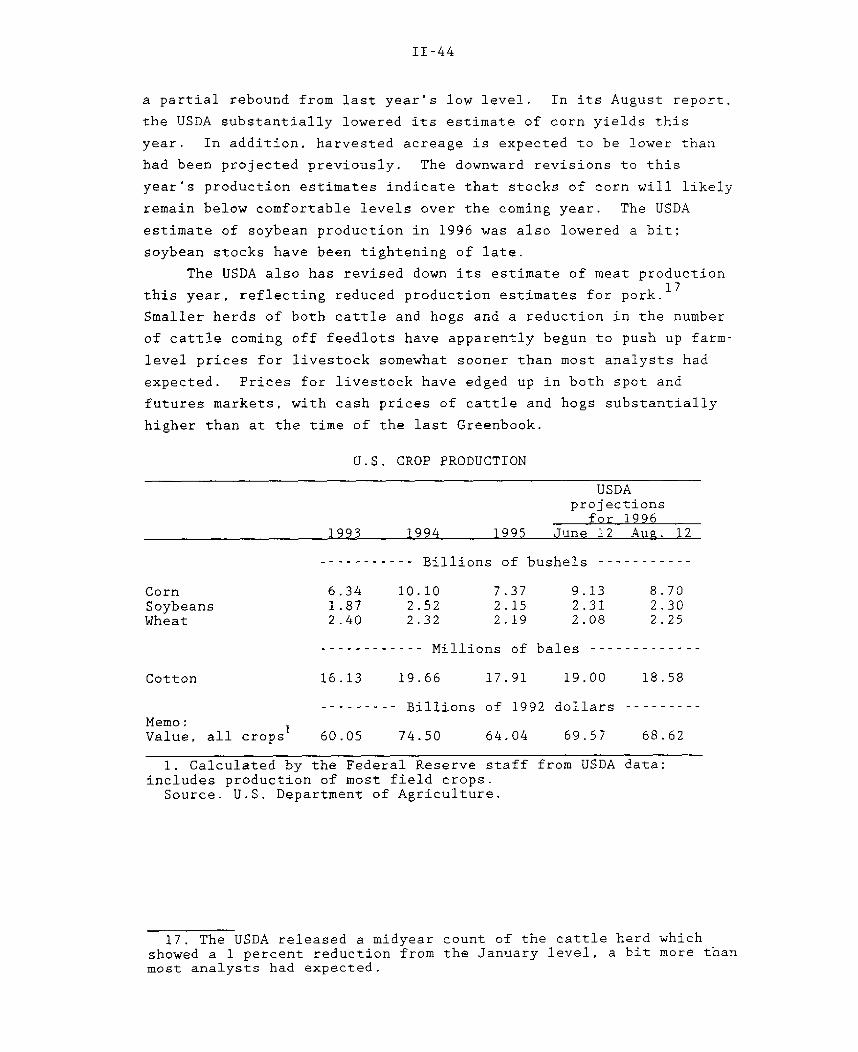
The latest USDA crop production estimates, which now
incorporate data from actual field surveys of wheat, corn, and
soybeans, indicate that total crop output in 1996 is likely to show
15. Another factor that has contributed to smaller increases inthe PCE chain-type price index than in the CPI in recent years isthe use of more up-to-date weights in the PCE index than in the CPI.The PCE chain-type price index uses weights from years adjacent tothe period for which the price change is calculated, whereas the CPIcurrently uses weights from the 1982-to-1984 period. We estimatethat the difference in weights may explain 0.2 percentage point ofthe difference between the CPI and PCE inflation rates in recentyears. The CPI will get revised weights--for the 1993-to-1995period--in January 1998.
16. An earlier agreement to curtail production by the formerSoviet nations has unraveled over the past year.
II-44
a partial rebound from last year's low level. In its August report,
the USDA substantially lowered its estimate of corn yields this
year. In addition, harvested acreage is expected to be lower than
had been projected previously. The downward revisions to this
year's production estimates indicate that stocks of corn will likely
remain below comfortable levels over the coming year. The USDA
estimate of soybean production in 1996 was also lowered a bit;
soybean stocks have been tightening of late.
The USDA also has revised down its estimate of meat production
this year, reflecting reduced production estimates for pork. 1 7
Smaller herds of both cattle and hogs and a reduction in the number
of cattle coming off feedlots have apparently begun to push up farm-
level prices for livestock somewhat sooner than most analysts had
expected. Prices for livestock have edged up in both spot and
futures markets, with cash prices of cattle and hogs substantially
--------- Billions of 1992 dollars ---------Memo:Value, all crops 60.05 74.50 64.04 69.57 68.62
1. Calculated by the Federal Reserve staff from USDA data;includes production of most field crops.
Source. U.S. Department of Agriculture.
17. The USDA released a midyear count of the cattle herd whichshowed a 1 percent reduction from the January level, a bit more thanmost analysts had expected.
DOMESTIC FINANCIALDEVELOPMENTS
III-T-1
Selected Financial Market Quotations'(Percent except as noted)
1996 Change to Aug. 14, from
Instrument Feb. FOMC, July Feb. FOMC, July
low July 2 high Aug. 14 low July 2 high
Short-term rates
Federal funds2
Treasury bills'
3-month6-month1-year
Commercial paper
1-month3-month
Large negotiable CDs'
1-month3-month6-month
Eurodollar deposits'
1-month3-month
Bank prime rate
Intermediate- and Long-term Rates
U.S. Treasury (constant maturity)
3-year10-year30-year
Municipal revenue (Bond Buyer)*
Corporate-A utility, recently offered
High-yield corporate6
Home mortgages'
FHLMC 30-yr fixed rateFHLMC I-yr adjustable rate
Stock exchange index
5.37
5.185.275.48
5.485.50
5.385.455.64
5.345.47
8.25
6.406.806.94
6.20
7.99
10.12
8.295.98
5.39
5.215.405.64
5.505.59
5.445.595.83
5.385.56
8.25
6.627.067.19
6.24
8.23
10.36
8.426.01
-. 13 -. 15
.12 -.09
.28 -.10
.16 -.26
.00 -.22
.76 -. 16
.00 -.53
.63 -.18
.42 -.13
Record high 1996 Percentage change to Aug. 14, from
1. One-day quotes except as noted.2. Average for two-week reserve maintenance period closest to date shown. Last observation is the average for the maintenance period ending
August 14, 1996.3. Secondary market.4. Bid rates for Eurodollar deposits at 11 a.m. London time.5. Most recent observation based on one-day Thursday quote and futures market index changes.6. Merrill Lynch Master II high-yield bond index composite.7. Quotes for week ending Friday previous to date shown.
Selected Interest Rates
Short-TermPercent
I I I I I I
1990 1991 1992 1993 1994 1995 1996
Daily
FOMC7/2
Federal funds
*
.
*.-..- -* ---... - -
Three-month T-bill
6/28 7/5 7/12 7/19 7/26 8/2 8/91996
Long-TermPercent Percent
Weekly/Daily
FOMC7/2
Mortgage rate(weekly)
Corporate bond ***.(weekly)
Thirty-year T-bond(daily)
I I I I I I I I
6/28 7/5 7/12 7/19 7/26 8/2 8/91996
Monthly- Prime rate (daily)----- Federal funds-- Three-month Treasury bil....-.... Discount rate (daily)
Percent
1990 1991 1992 1993 1994 1995 1996
DOMESTIC FINANCIAL DEVELOPMENTS
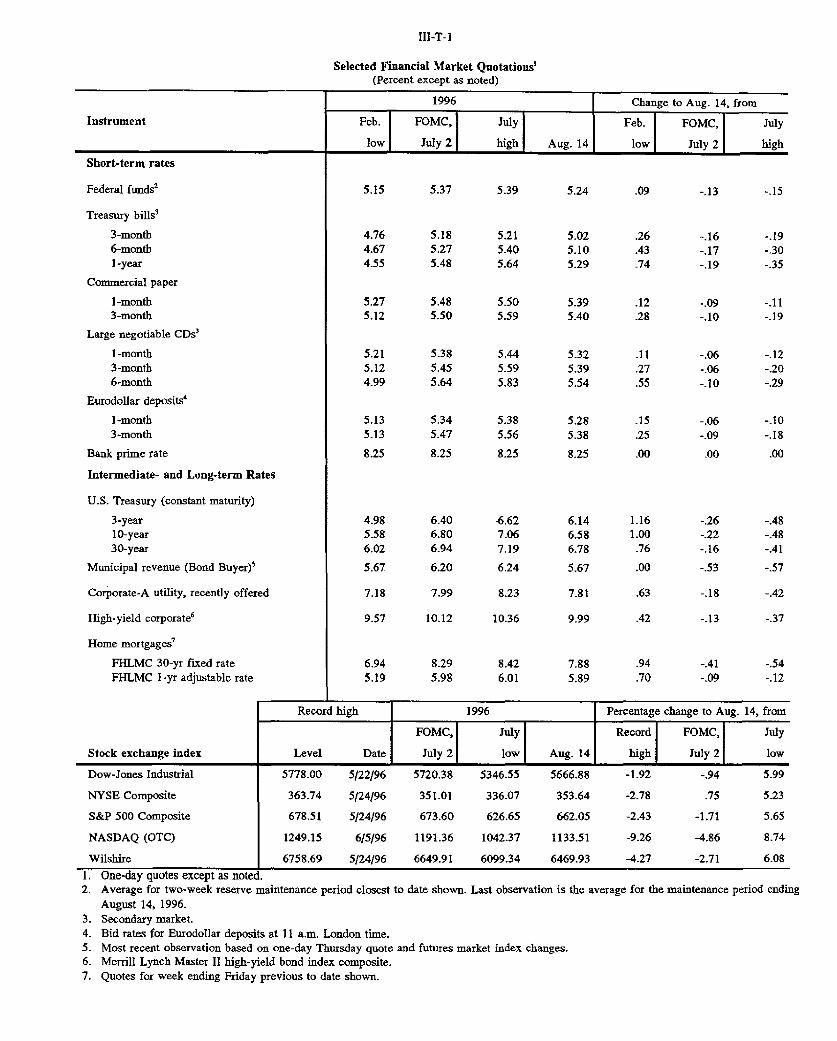
On balance, economic data released in recent weeks seem to have
diminished concerns somewhat among market participants that the
economy is overheating, and the associated bond market rally has
more than rolled back the jump in long-term yields posted in early
July. The thirty-year Treasury bond rate has declined about
40 basis points from its high last month and 15 points on net over
the intermeeting period, leaving it at its lowest level since April.
The markets remain jittery, however, exhibiting substantial
volatility in response to each piece of news.
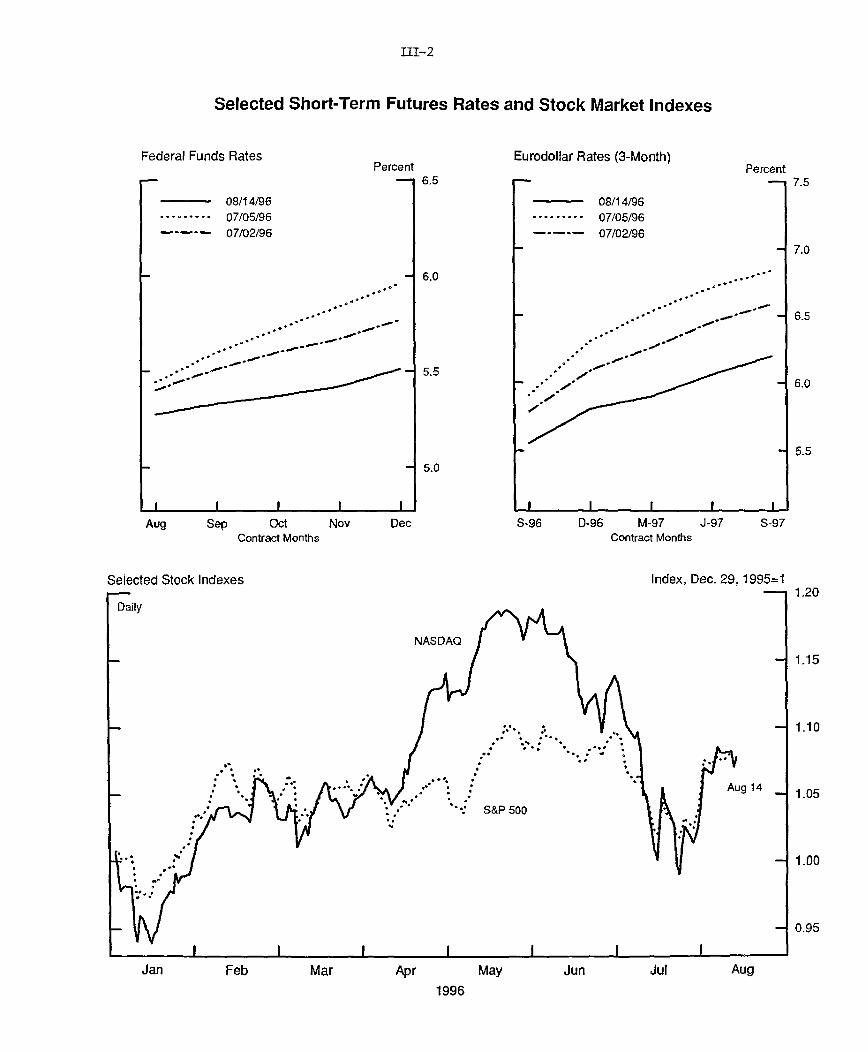
Short-term rates have declined as well. Investors apparently
had been convinced that the stronger-than-expected June employment
report, released immediately after the July FOMC meeting, portended
a System tightening action in August. Data releases since then,
along with the Humphrey-Hawkins testimony, eroded that conviction,
and rates on federal funds futures contracts now indicate that even
a modest tightening in the near term is viewed as not very likely
(chart, top panels).
Turbulent conditions have frequently prevailed in the stock
market as well, with intraday movements in the S&P 500 reaching
their highest level in more than five years. Stock prices declined
along with bond prices early in the intermeeting period and then
fell sharply in mid-July after several high-tech companies released
disappointing news about earnings and sales. By late in the month,
the S&P 500 was 7-1/2 percent below the peak reached in the spring,
while the NASDAQ Composite was down nearly 17 percent (chart, bottom
panel). Stock prices then began to recover, lifted by the rally in
the bond market and generally reassuring earnings reports. By mid-
August, the NYSE Composite index, the S&P 500, and the Dow had
almost returned to their record highs, but the NASDAQ Composite
remained well below its peak.
Borrowing by nonfederal sectors was moderate in the second
quarter and appears to have remained so early in the current
quarter. In the household sector, consumer credit growth has
continued to slow, while mortgage debt growth likely has subsided
further from the brisk first-quarter pace. Borrowing by
nonfinancial firms has been held down by still-healthy cash flows
and modest inventory investment. As has been true for a while,
III-1
III-2
Selected Short-Term Futures Rates and Stock Market Indexes
Federal Funds Rates
08/14/96......... 07/05/96----- 07/02/96
Percent
- r,
Eurodollar Rates (3-Month)
08/14/96......... 07/05/96
---- 07/02/96
Aug Sep Oct Nov DecContract Months
S-96 D-96 M-97 J-97 S-97Contract Months
Selected Stock Indexes Index, Dec. 29, 1995=1
Percent- 7.5
1.20
1.15
1.10
1.05
1.00
0.95
Jan Feb Mar Apr May Jun Jul Aug
1996
,,
- 5.0
III-3
state and local governments continue to pay down their outstanding
debt. The broad monetary aggregates decelerated last month, while
growth in bank credit remained sluggish.
Stock Market and Mutual Funds
Stock price movements over the past two months reflect a
cooling of enthusiasm for smaller, speculative companies. The
Russell 2000--a diversified index of small companies--has moved
lower in sync with the computer-laden NASDAQ Composite.
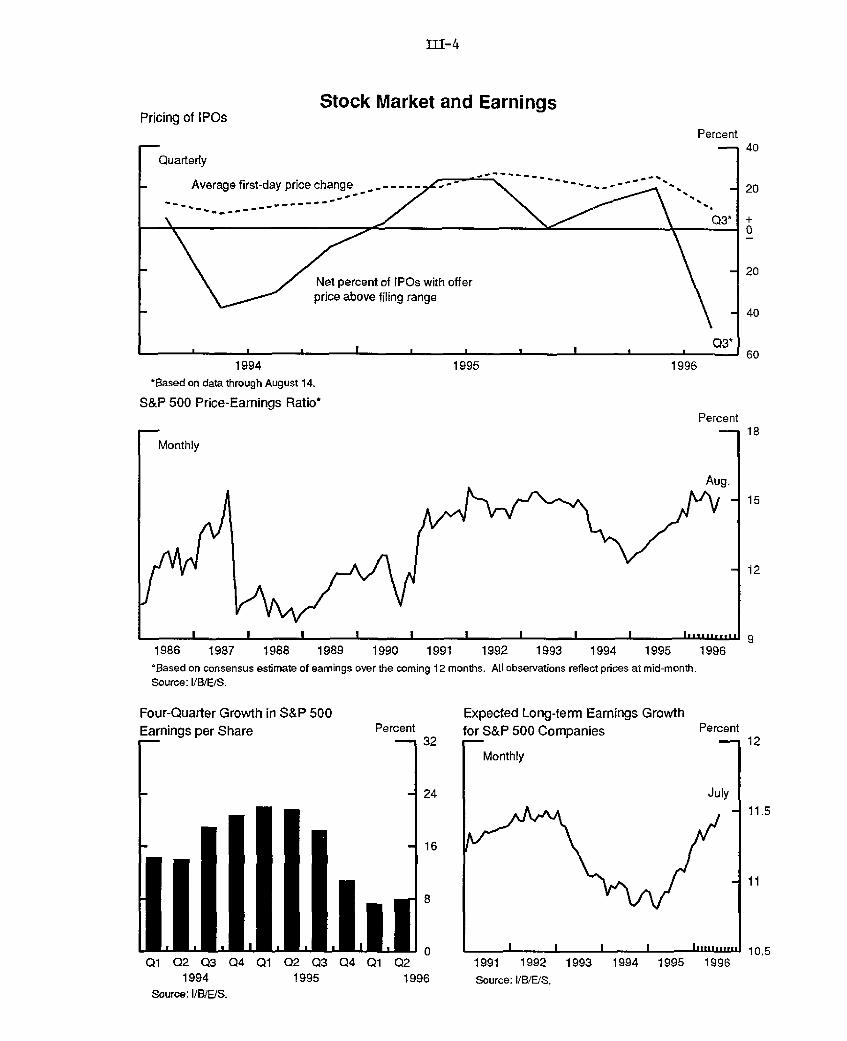
Furthermore, investor ardor for initial public offerings has
weakened quite a bit, although better-quality firms still have
access to the market. On net, nearly 20 percent of the IPOs
completed in the second half of June were priced below the low end
of the range filed in the registration statements about six weeks
earlier, a sharp reversal from the pattern in the spring, and this
measure turned even more negative in July and the first half of
August (chart, top panel). In addition, the average first-day price
increase for IPOs has fallen to a two-year low so far this quarter,
albeit from a high level.
The decline in broad equity indexes since midyear has left only
a modest imprint in standard measures of stock valuation. The
price-earnings ratio for the S&P 500 remains at the high end of the
range of the past decade (middle panel). The P-E ratio for the
NASDAQ Composite came down somewhat in July as well but was still
elevated by historical standards.
With nearly all reports on second-quarter earnings now in,
operating income appears to have remained on a healthy growth path.
Operating earnings at S&P 500 firms are estimated to have increased
about 8 percent for the year ending in June, near what was posted in
the previous quarter but well below the very rapid gains from
mid-1994 to mid-1995 (lower left panel). Analysts expect
earnings growth to pick up by year-end and hold extremely bullish
views about long-term prospects (lower right panel), even though the
economy is thought to be pressing against capacity.
Retail investors' accumulation of stocks likely flagged in
July, as net sales of equity mutual funds declined substantially
from the record pace in the first half of the year (chart, upper
panel). Equity funds actually posted a net outflow in the week
1. The closest analogue to this measure in the national incomeand product accounts is book profits after tax. That measure, whichcovers all U.S. corporations, also has decelerated from the highgrowth rates posted from mid-1994 to mid-1995.
Pricing of IPOs
Quarterly
L
Stock Market and Earnings
Percent
Average first-day price change _,----
Net percent of IPOs with offerprice above filing range
18. Large time deposits, gross19. Net due to related foreign
institutions
20. U.S. government depositsat commercial banks
2.9
2.7 -4.7
-0.1 -1.3
6.6 8.3 3.9 8.8 . . . 477.7
1.5 -1.0 -6.6 . . .
0.0 -5.6 5.1 5.1 .
1. For the years shown, fourth quarter-co-fourth quarter percent change. For the quarters shown, based onquarterly averages.
2- Sum of seasonally adjusted Ml, retail money market funds, savings deposits, and small time deposits.3. Sum of retail money funds, savings deposits, and small time deposits, each seasonally adjusted separately.4. Sum of large time deposits, institutional money funds, RP liabilities of depository institutions, and
Eurodollars held by U.S. addressees, each seasonally adjusted separately.5. Net of holdings of depository institutions, money market mutual funds, U.S. government, and foreign banks
and official institutions.6. M2 less demand deposits7. For the years shown, "average monthly change" is the fourth quarter-to-fourth quarter dollar change,
divided by 12. For the quarters shown, it is the quarter-to-quarter dollar change, divided by 3.p--Preliminary.
Aggregate
Level(bil. $)July 96
(p)
248.5
22.0
III-8
COMMERCIAL BANK CREDIT(Percentage change; seasonally adjusted annual rate)1
Level,1996 1996 1996 1996 1996 Jul
Type of credit 1995 Q1 Q2 May Jun Jul 1996(billions of )
1. Total loans and securities 8.7 5.3 2.5 1.4 1.6 .9 3,671.1
2. Securities 3.5 .6 -3.0 8.1 -10.0 -6.7 974.8
3. U.S. government -3.1 -2.5 .5 15.0 -11.3 -.2 707.7
4. Other2 25.6 8.4 -11.9 -9.1 -7.0 -23.8 267.1
5. Loans3 10.7 7.1 4.6 -1.1 5.9 3.7 2,696.3
6. Business 11.5 7,3 5.0 3.6 4.7 5.5 741.3
7. Real estate 8.5 4.9 3.2 1.9 3.6 1.3 1,103.4
8. Home equity 5.2 5.6 -.5 -6.0 -6.0 6.0 79.8
9. Other 8.7 4.8 3.6 2.5 4.2 .9 1,023.6
10. Consumer 10.7 6.7 4.9 -5.9 12.4 4.5 512.0
11. Adjusted4 17.6 13.7 9.4 -.7 16.9 7.1 666.1
12. Security 14.4 -3.3 -8.0 -46.1 -7.3 -26.3 80.3
13. Other5 18.4 21.2 13.0 -2.4 10.4 16.9 259.3
1. Monthly levels are pro rata averages of Wednesday data. Quarterly and annual levels (not shown) are simpleaverages of monthly levels and levels for the fourth quarter respectively. Growth rates shown are percentage changes in consecutivelevels, annualized but not compounded.2. Includes municipal securities, foreign government securities, corporate bonds, equities, and trading account assets.3. Excludes interbank loans.4. Includes estimates of consumer loans that have been securitized by banks and are still outstanding.5. Includes loans to nonbank financial institutions, farmers, state and local governments, banks abroad, foreigngovernments, and all others not elsewhere classified. Also includes lease financing receivables.
Securities' Share of Bank Credit(Adjusted for FIN 39 and FAS 115; Seasonally adjusted)
PercentS32
/ July 31
I I I 1 I i -
1988 1990 1992 1994 1996- I I I I I [I I •-1111111~11
1980 1982 1984 1986
III-9
Security holdings at banks, which had grown sluggishly for the
last two years, contracted in June and July. In part, this behavior
seems to represent a return to a more typical relationship between
security holdings and bank credit (chart). In the early 1990s, when
bank loan portfolios were troubled and banks became highly cautious
lenders, the share of securities in bank portfolios climbed
substantially. Beginning in 1994, after bank capital positions
became comfortable again and loan demand strengthened, the
securities share began to decline. This trend has continued in
1996, even as loan demand has moderated.
The subdued lending in recent months does not appear to have
been driven by a more restrictive posture on credit availability.
Banks reported strong earnings for the second quarter, and capital
positions are favorable. Results from the August Senior Loan
Officer Survey showed some tightening for loans to households, but
otherwise banks reported little change in loan supply.
Household Sector
Household borrowing is estimated to have moderated in the
second quarter, and the sparse data available do not point to a
rebound in the current quarter. Much of the slowing reflects weaker
growth in consumer credit, which slid to a 7-1/2 percent annual rate
last quarter, despite some firming in June (table and chart). In
July, consumer loans at banks grew at a 7 percent rate after
adjusting for securitization, somewhat below its second-quarter
pace.
The deceleration in consumer debt probably owes more to slower
growth in demand for credit than to a cutback in supply. Interest
rates on consumer loans have been fairly steady this year (table),
and unused lines of credit on credit card accounts at commercial
banks continued to expand very rapidly through the first quarter,
reaching $1.2 trillion. Furthermore, any tightening of standards in
granting new credit lines would not prevent people from drawing on
existing lines of credit.
That said, tighter lending standards may exert some damping
effect on consumer credit growth going forward. Banks are
continuing to scrutinize their consumer lending programs and, on
net, have become less willing to make consumer loans in recent
months according to participants in the August loan officer survey
(chart, middle panel). A tightening of standards was most evident
in the credit card area, where delinquencies and charge-offs have
III-10
GROWTH OF CONSUMER CREDIT(Percent change; seasonally adjusted annual rate)
Note. Annual data are averages of quarterly data for commercial bank rates andof monthly data for auto finance company rates.
1. Average of "most common" rate charged for specified type and maturity duringthe first week of the middle month of each quarter.
2. The rate for all accounts is the stated APR averaged across all credit cardaccounts at all reporting banks. The rate for accounts assessed interest is theannualized ratio of total finance charges at all reporting banks to the total averagedaily balances against which the finance charges were assessed (excludes accounts forwhich no finance charges were assessed).
3. For monthly data, rate for all loans of each type made during the month
regardless of maturity.e estimate based on data from Bank Rate Monitor.n.a. Not available.
1971 1976 1981 1986 1991*Weighted responses of banks more willing to lend minus those tess willing.
Issuance of Home Equity Loan SecuritiesBillions of Dollars
- 35
- I1991 1992
* At an annual rate.Source: Inside Mortgage Securities.
I1993 1994
1996
Index
1996
-.-1995 1996
III-12
risen the most, although a number of respondents reported tightening
standards for other installment loans as well. Asked specifically
about the use of credit scoring to evaluate applications, 90 percent
of the card-issuing banks employed this tool, and 40 percent of
those had set cutoff scores at more restrictive levels in the past
three months.
Among the few data series now available on consumer loan
repayments in the second quarter, the captive auto finance companies
experienced a rise in delinquency rates to a historical high, after
a decline in the first quarter. Earlier, these companies indicated
that they had anticipated an uptrend as a result of having
liberalized credit standards in 1993-94 to help boost car sales.3
A definitive estimate of mortgage debt growth for the second
quarter cannot be made until data become available from Call
Reports, but the heavy issuance of mortgage-backed securities
suggests that, all else equal, loan originations were quite strong.
Real estate loan growth at commercial banks slowed last quarter, but
some of that deceleration apparently owed to heavy securitization of
home equity loans: During the first half of the year,
securitizations at all lenders were about double the pace set last
year, and the second-quarter volume was the highest on record
(bottom panel). Growth in real estate loans at commercial banks
remained modest in July.
Business Finance
Gross issuance of bonds by nonfinancial corporations in July
backed off from the strong pace of the previous two months (table).
Speculative-grade issuance accounted for most of the decline,
falling to less than half its average monthly pace during the first
half of the year. Market contacts indicated that a number of highly
speculative offerings that had been on the calendar were postponed
or withdrawn as investors backed away amidst the turbulence in the
capital markets last month. Of the investment-grade bonds issued in
July, some of the proceeds were used to pay down commercial paper.
As a result, outstanding commercial paper of nonfinancial firms
2. A more detailed summary of the August loan officer survey isincluded in an appendix to the Greenbook.
3. The level of the delinquency rate at captive finance companieshas also been boosted a bit by the shift away from loans towardleasing. Leases are not included in the loan delinquency data, andlease customers tend to be better credit risks than the averageborrower.
III-13
GROSS ISSUANCE OF SECURITIES BY U.S. CORPORATIONS 1
(Billions of dollars; monthly rates, not seasonally adjusted)
1996
Type of security 1994 1995 Q1 Q2P May P June P JulyP
Note. Excludes mortgage pass-through securities issuedby FNMA and FHLMC.
n.a. Not available.
III-17
At its midquarter refunding announcement, the Treasury
clarified several aspects of its proposal to issue index-linked
debt. Even though it has not fully decided the characteristics of
the new bonds, it announced that they will be eligible for the
Treasury's stripping program from the date of issuance and that it
will eventually issue several maturities of inflation-protected
securities. The Treasury also announced that it will make the
complete specifications known in September and may conduct an
auction for the new debt instruments before the end of the year.
Fannie Mae and Freddie Mac have been under increased scrutiny
in recent months, with both the Treasury and the Congressional
Budget Office claiming that these institutions fail to pass on to
mortgage borrowers all of the implicit subsidies they receive from
the government. These government-sponsored enterprises have strong
political support, and the market evidently sees little chance that
the agencies would be privatized, as spreads on their securities to
comparable Treasuries have remained tight.
The House Banking Committee approved a plan to fund the
payment of interest on the Financing Corporation (FICO) bonds issued
to finance the savings and loan bailout. A floor vote could be
scheduled in early September. The bonds' principal is backed by
zero-coupon Treasury securities, but interest is currently paid out
of the premiums of the Savings Association Insurance Fund. The
House Banking Committee's plan would require thrifts to pay
58 percent of the annual interest payments for three years, while
banks would pay the remainder; thereafter, payments would be
proportional to deposit holdings, implying that banks would pay
roughly three-quarters of FICO interest. Yield spreads on FICO
securities suggest that the market has been placing negligible odds
on default all through the recent legislative wrangling.
Municipal Financing
Gross offerings of long-term municipal debt decreased to
$11 billion in July from about $18 billion in June (table). Both
new capital issuance and refundings were down in July, consistent
with the usual seasonal pattern, and remained relatively low in
early August. In contrast, retirements increased substantially in
July, causing a sharp reduction in the supply of outstanding
municipal debt. Partly as a result, the tax-exempt yield on thirty-
year bonds fell to 81 percent of that of comparable Treasury bonds
in early August, the lowest level in a year.
II-18
GROSS OFFERINGS OF MUNICIPAL SECURITIES(Billions of dollars: monthly rates, not seasonally adjusted)
Total tax-exempt
Long-term 1RefundingsNew capital
Short-term
Total taxable
1993
27.2
23.315.77.6
3.9
.7
1994
16.1
12.84.08.8
3.3
.7
1995
14.9
12.13.68.5
2.8
.7
Q1 Q2
14.3
12.74.97.8
1.6
.5
1996
19.0
15.43.9
11.5
3.6
.5
Jun. Jul.
25.6 17.7
17.62.9
14.7
8.0
11.21.89.4
6.5
Note. Includes issues for public and private purposes.1. Includes all refunding bonds, not just advance refundings.
Rating Changes for Long-Term Municipal DebtBillions of dollars
L Upgrades
I Downgrades
n r- H N
1990 1991 1992 1993 1994 1995 1996*At an annual rateSource: Standard & Poors
III-19
The credit quality of municipal debt, as measured by changes in
ratings, improved in the first half of the year (chart). Virtually
all sectors of the municipal market experienced a net upgrade. The
only deterioration occurred among utilities, which accounted for
more than 90 percent of all municipal debt downgraded in the first
half. As in the private sector, municipal utilities face heightened
competitive pressures as a result of ongoing deregulation.
APPENDIX
THE AUGUST SENIOR LOAN OFFICER OPINION SURVEY ONBANK LENDING PRACTICES
The August 1996 Senior Loan Officer Opinion Survey on BankLending Practices posed questions about changes in bank lendingstandards and terms, changes in loan demand by businesses andhouseholds, credit-scoring models used to evaluate credit cardapplications, charge-off rates on consumer loans, and commercialcredit card programs.
The survey results showed little change in lending standardsfor loans to businesses but a tightening of standards for loans toconsumers. Lending standards for commercial and industrial loans toborrowers of all sizes were generally unchanged, as were standardsfor commercial real estate loans. Standards for home mortgages werealso about unchanged, but many banks tightened standards for creditcard and other consumer installment loans.
Loan terms were reportedly eased moderately for businesses buttightened somewhat for consumers. Terms were eased for businessloans to borrowers of all sizes, although more banks reported easingthem for large borrowers than for small borrowers. Terms on creditcard loans, especially credit limits, were tightened by many banks,and a few banks tightened terms on other consumer installment loans.
Changes in demand for bank loans were mixed across loan types.Several banks reported increased demand for commercial andindustrial loans, and a few reported increased demand for commercialreal estate loans. However, demand for home mortgages wasreportedly weaker at many banks while, for consumer installmentloans, the number of respondents who reported weaker demand wasabout the same as the number who reported stronger demand.
Regarding credit-scoring models, most banks use such models toevaluate some or all of their credit card applications, and abouthalf of those banks said that they had tightened the cutoff scoresnecessary to qualify for a card. Responses to other specialquestions indicate that many banks are charging off consumer loansat a higher-than-expected rate given the delinquency rate on theseloans at their bank. These banks attribute this development largelyto a rise in bankruptcies with a short intervening period ofdelinquency. A series of special questions on commercial creditcard programs found that many banks have adopted such programs overthe past few years, but the credit balances represent only a smallfraction of commercial and industrial loans.
Lending to Businesses
As in May, the survey found little change, on net, in lendingstandards for business loans to firms of all sizes over the pastthree months (chart). A few banks, on net, eased standards forloans to large corporations, but standards for smaller firms wereessentially unchanged. The survey again found an easing of terms oncommercial and industrial loans; about a quarter of the banks, onnet, eased spreads over base rates for loans to large andmiddle-market firms, although only about 5 percent, on net, easedspreads for small businesses (chart). The proportions that reported
III-A-1
III-A-2
easing spreads were a bit smaller than in the May survey, continuingthe downward trend evident over the past year. The proportion thatreported reducing credit line costs was similar to the proportionthat reported easing spreads over base rates. Smaller proportionseased other terms, including maximum credit line sizes, loancovenants, and collateralization requirements. In contrast,respondents that are U.S. offices of foreign banks indicated aslight tightening of both standards and terms on commercial andindustrial loans. Those banks that eased terms or standardsindicated that they did so primarily because of increasedcompetition from other banks and, to a lesser extent, from nonbanklenders. Those banks that tightened terms or standards indicatedthat they did so because of a reduced tolerance for risk and becauseof reduced competition from other banks.
On net, between 10 and 20 percent of respondents indicated anincrease in demand for commercial and industrial loans, with thelargest proportion reporting increased demand from small businesses(chart). Banks attributed changes in demand to variations in theircustomers' investment in inventories, plant, and equipment and tosubstitution toward and away from other sources of finance. Banksalso indicated that demand from large corporations and middle-marketfirms was boosted by merger and acquisition financing.
Domestic respondents reported a slight tightening of standardsfor commercial real estate loans while foreign respondents indicatedlittle change in standards for these loans. Small net proportionsof both foreign and domestic respondents experienced an increase indemand for commercial real estate loans.
Lending to Households
The survey found little evidence of changing standards forhome mortgages; only two banks indicated tighter standards and allthe rest reported no change. About a quarter of the banks, on net,reported weaker demand for these loans (chart). This reportedweakness is in line with the recent modest growth in the outstandingvalue of these loans at commercial banks but is at odds with recentstrength in the housing market.
The survey results were generally supportive of the view thatbanks are pulling back, somewhat, in their lending to consumers. Asin May, a small net fraction of the respondents--less than tenpercent--reported a decline over the preceding three months intheir willingness to make consumer installment loans. Theseresults represent the first two consecutive surveys finding a netreduction in willingness to make consumer installment loans since1981. Moreover, larger net proportions of banks reported havingtightened consumer loan standards and terms than did so in May.Nearly half of the banks tightened their standards for approvingcredit card applications and about a quarter tightened standards forother consumer installment loans. Nearly a third of the bankslowered their credit limits on new or existing credit card accounts,and smaller proportions increased spreads over market rates oncredit cards and other consumer installment loans. Banks reportedlittle net change in demand for consumer installment loans.
In response to special questions, about 90 percent of thebanks reported using credit-scoring models to evaluate some or allof their credit card applications. Of those using such models, 40percent had made the average cutoff score to qualify for a credit
III-A-3
card more restrictive over the past three months and just over halfhad done so over the past year.
Responses to other special questions revealed that two-thirdsof the banks are charging off consumer loans at a higher rate thanthey would have expected at current delinquency rates, given theirpast experience. Virtually all of the banks experiencing highercharge-off rates indicated that a very important reason for the highrate was that more customers were declaring bankruptcy with littleor no intervening period of delinquency. Many banks also indicatedthat a larger fraction of their delinquent loans were remainingdelinquent long enough to be charged off.
Commercial Credit Cards
A series of special questions asked banks about commercialcredit card programs. Commercial card products include businesscards, which are generally for smaller businesses; corporate cards,which are generally for travel and entertainment expenses incurredby large corporations; and purchasing cards, which are generally formodest business purchases, other than for travel and entertainment,by large corporations. About two-thirds of the respondentsindicated that they currently offer at least one of these types ofcredit card, and many banks offer all three. Of the programs, thelargest number of banks offered business cards, followed bycorporate and then purchasing cards. About half of the banksoffering one or more of these programs had started them within thepast three years, and many of them reported growth in outstandingsover the past year of more than 10 percent. Nevertheless, theoutstanding balances on these cards do not represent a largefraction of business lending. Almost all the banks said that thebalances account for less than 2 percent of their commercial andindustrial loans and less than 5 percent of their lending to smallbusinesses. When asked about their plans to start new programs, afew banks expressed an intention to offer business or corporatecards in the near future while a somewhat larger number planned tooffer purchasing cards.
Measures of Supply and Demand for C&I Loans, by Size of Firm Seeking Loans
Net Percentage of Domestic Respondents Tightening Standards for C&I Loans Percent
- LargeS.....- Medium--- Small
1990 1991 1992 1993 1994 1995 1996
Net Percentage of Domestic Respondents Increasing Spreads of Loan Rates over Base Rates Percent
-Large- - * Medium
Small
1990 1991 1992 1993 1994 1995 1996
Net Percentage of Domestic Respondents Reporting Stronger Demand for C&I Loans Percent
1993 1994 1995 1996
Measures of Supply and Demand for Loans to Households
Net Percentage of Domestic Respondents Tightening Standards for Mortgages to Individuals Percent40
30
20
10
-10
1991 1992 1993 1994 1995 1996
Net Percentage of Domestic Respondents Indicating More Willingness to Make Consumer Installment Loans Percent80
-60
40
20
-20
-4C
-6C
- .8C
1966 1970 1974 1978 1982 1986 1990 1994
Net Percentage of Domestic Respondents Reporting Stronger Demand for Loans to Households Percent
- - 200C
-6C
| r , , I I o nI I ,nsI I , , - 84
INTERNATIONAL DEVELOPMENTS
INTERNATIONAL DEVELOPMENTS
U.S. International Trade in Goods and Services
The deficit in U.S. international trade in goods and services
widened in May. Exports were 1 percent higher than the downward-
revised April level, while imports rose 2-1/2 percent. Data for
June will be released on Tuesday, August 20.
NET TRADE IN GOODS & SERVICES(Billions of dollars, seasonally adjusted)
Annual rates Mo1995 1995 1996
nthly rates1996
Q4 Q1 Q2e/ Mar Apr MayReal NIPA 1/Net exports of G&S -107.6 -84.9 -104.0 -121.7
Goods, net -173.4 -152.1 -171.0 -194.7 -14.5 -15.6 -16.9Services, net 68.4 74.5 73.5 71.8 6.4 6.0 6.0
1. In billions of chained (1992) dollars.e. BOP data are two months at an annual rate.Source. U.S. Dept. of Commerce, Bureaus of Economic Analysis and Census.
In April-May, the deficit in net exports at an annual rate was
substantially larger than in the first quarter, back to levels last
recorded a year earlier.
Exports of goods and services were 1-1/2 percent higher in
April-May on average than in the first quarter, with most of the
increase in deliveries of aircraft and shipments of gold abroad1.
Over the past year, the value of exports rose 7 percent (Q2e/Q2).
Imports of goods and services were 4 percent higher in April-
May on average than in the first quarter, with two-thirds of the
increase attributable to oil and transfers of gold. The remaining
increase was predominantly in automotive products (reflecting the
strength of sales) and consumer goods. Partly offsetting these
increases was a sharp decline in imported semiconductors. The
strong pick-up in imports in the first five months of the year is
consistent with rising U.S. domestic demand.
1Gold transferred from foreign holdings at the Federal Reserve Bank
of New York is recorded first as an import into the United States and
shows up as an export when gold is shipped out of the country.
IV-1
IV-2
8-14-96
U.S. International Trade in Goods and Services(Seasonally adjusted annual rate)
Net ExportsBillions of dollars
1989 1990 1991 1992 1993 1994 1995 1996
Selected NIPA ExportsRatio scale, billions of chained (1992) dollars
20
+0
20
40
60
80
100
120
140
160
1989 1990 1991 1992 1993 1994 1995 1996
NIPA Exports and ImportsRatio scale, billions of chained (1992) dollars
1220
1020
820
620
4201989 1990 1991 1992 1993 1994 1995 1996
Selected NIPA ImportsRatio scale, billions of chained (1992) dollars
S180
/ - 160
Consumer goods140
V - 120
100•s ;-, Automotive /
Tnd. supplies ex oil ^achinery
ex computers &semiconductors
I I I I I,, I, 60
1989 1990 1991 1992 1993 1994 1995 1996
IV-3
U.S. EXPORTS AND IMPORTS OF GOODS AND SERVICES(Billions of dollars, SAAR, BOP basis)
The quantity of oil imported during April and May was well
above the 1996-Ql rate. A larger than normal seasonal inventory
accumulation that has rebuilt stocks from historically low levels
offset the seasonal decline in oil consumption. Preliminary
Department of Energy statistics indicate that oil imports continued
at a brisk pace in June, due to a pick-up in consumption and a
continuation of the rebuilding of oil stocks, but fell in July as
consumption declined and the accumulation of stocks ceased.
After a sharp rise in April, the price of imported oil fell
back in May and decreased sharply in June. Spot WTI declined more
than $0.80 per barrel in June, averaging $20.45 per barrel. The
decline in oil prices from April through June reflected an unwinding
of temporary shocks to the oil market (unusually cold weather in
North America and Japan and weather related production disruptions
in the North Sea and Australia). Although Iraq reached an agreement
with the United Nations in early July to export a limited quantity
of oil (estimated to be 800,000 b/d) under U.N. supervision, oil
prices have remained firm since then because of uncertainty
regarding the timing of these oil flows. Prices rose nearly a dollar
per barrel in July and have changed little in August. Spot WTI is
now trading in the $22.00 per barrel range.
Prices of Non-oil Imports and Exports
Prices of non-oil imports decreased in the second quarter at a
rate that was slightly more than in the two previous quarters. The
prices of imported capital goods and industrial supplies fell
sharply. These decreases were only partly offset by substantial
price increases in a broad array of imported foods (coffee, grains,
and vegetables).
Prices of exports increased in the second quarter with most of
the rise due to a rapid increase in agricultural prices (especially
grains). On balance, prices of non-agricultural exports fell, with
continued declines seen in prices of industrial supplies and
computers.
U.S. International Financial Transactions
The pace of foreign official inflows into the United States
slowed sharply in the second quarter from the record pace of the
first quarter. (See line 1 of the Summary of U.S. International
IV-6
Transactions table.) Intervention purchases of dollars by the G-10
countries were modest. In addition, the increases in holdings by
several developing countries in Latin America in the first quarter
were partially reversed in the second quarter. In July and early
August partial information from FRBNY suggests that increases in
official holdings in the United States picked up somewhat.
Net portfolio investment by private foreigners in U.S.
securities (line 4) exceeded U.S. investment in foreign securities
(line 5) by a wider margin in the second quarter than in the first.
Private foreign net purchases of U.S. Treasury securities (line 4a)
picked up from the first-quarter pace, largely reflecting the
volatile transactions of financial institutions in the Caribbean.
The large net purchases of U.S. Treasury securities by official and
private foreigners in the first half of 1996 brought the foreign
share of U.S. Treasury securities privately held to almost 29
percent at the end of June, the highest level in recent decades.
Private foreign net purchases of U.S. corporate and government
agency bonds (line 4b) were also large in the second quarter, as
were foreign net purchases of U.S. corporate stocks (line 4c).
U.S. net purchases of foreign securities (line 5) in the
second quarter were substantial, but below the first-quarter pace.
Net purchases of foreign bonds (line 5a) fell sharply and purchases
of stocks (line 5b) also declined. In the second quarter, the
United Kingdom replaced Japan as the single country where U.S. net
purchases of stocks were largest. During the first half of 1996
there was a modest pickup in U.S. investor interest in emerging
stock markets in Asia and Latin America, but net purchases remained
far below the 1993 peak rate.
Banks continued to report substantial net capital outflows in
the second quarter on a month-end basis (line 3). On a monthly
average basis, net outflows also were recorded from U.S. banking
offices to their own foreign offices and IBFs (see line 1 of the
International Banking Data table). These outflows coincided with
slow growth in U.S. commercial bank credit and a pickup in growth of
large time deposits.
IV-7
SUMMARY OF U.S. INTERNATIONAL TRANSACTIONS(Billions of dollars, not seasonally adjusted except as noted)
1995 19961994 1995
Q3 Q4 Q1 Q2 May Jun
Official capital
1. Change in foreign official reserveassets in U.S. (increase. +)
a. G-10 countries
b. OPEC countries
c. All other countries
2. Change in U.S. official reserveassets (decrease. +)
Private capital
Banks
3. Change in net foreign positionsof banking offices in the U.S.
Securities 2
4. Foreign net purchases ofU.S. securities (+)
a. Treasury securities3
b. Corporate and other bonds4
c. Corporate stocks
5. U.S. net purchases (-) offoreign securities
a. Bonds
b. Stocks
Other flows (quarterly data. s.a.)
6. U.S. direct investment (-) abroad
7. Foreign direct investment in U.S.
8. Other (inflow + )5
U.S. current account balan s. a
Statistical discrepanc (s.a.
38.0 109.8
28.9
-3.3
12.4
5.3
33.1
4.3
72.5
-9.7
102.6 -30.1
39.6 10.8 52.2 13.0 2.5 6.2
5.6
6.2
27.7
-1.9
-3.6
-2.1
16.6
.2
28.5
-. 8
24.5
*
-7.0 10.0 -28.7
3.5
5.3
4.2
-. 5
-11.2
6.0
2.1
-5.5
-. 4
6.8 -26.7
92.9 190.6 69.8 23.5 48.5 60.9 21.5 22.8
34.7
53.9
4.3
-57.3
99.8
82.6
8.2
-98.8
37.4
27.0
5.3
-35.7
1.8
17.7
4.0
-32.5
12.0
32.7
3.8
-34.5
31.8
22.7
6.4
-19.9
9.9
10.2
1.4
-3.6
14.2
7.6
.9
-9.4
-9.2 -48.5 -13.6 -18.7 -12.0 -2.6 -. 5 -1.9
-48.1 -50.3 -22.1 -13.8 -22.5 -17.2 -3.1 -7.5
-54.5 -95.5 -38.0 -44.1 -26.8
49.8 60.2 25.0 14.8 29.5
-42.1 -9.8 27.4 18.3 2.9
-148.4 -148.2 -37.7 -30.4 -35.6
-13.7 31.5 -41.5 29.4 -7.5 n.a n.a n.a
Note. The sum of official capital, private capital, the current account balance, and the statisticaldiscrepancy is zero. Details may not sum to totals because of rounding.
1. Changes in dollar-denominated positions of all depository institutions and bank holding companiesplus certain transactions between broker-dealers and unaffiliated foreigners (particularly borrowingand lending under repurchase agreements). Includes changes in custody liabilities other than U.S.Treasury bills.2. Includes commissions on securities transactions and therefore does not match exactly the data on
-U.S. international transactions published by the Department of Commerce.3. Includes Treasury bills.4. Includes U.S. goverment agency bonds.5. Transactions by nonbanking concerns and other banking and official transactions not shown elsewhere
plus amounts resulting from adjustments made by the Department of Commerce and revisions in lines 1through 5 since publication of the quarterly data in the Survey of Current Business.n.a. Not available. " Less than $50 million.
IV-8
INTERNATIONAL BANKING DATA 1
(Billions of dollars)
1992 1993 1994 1995 1996
Dec. Dec. Dec. Dec. Mar. May Jun. Jul.**
1. Net claims of U.S. -71.6 -122.1 -224.0 -260.0 -260.1 -253.5 -245.0 -245.7banking offices(excluding IBFs) onown foreign officesand IBFs
a. U.S.-charteredbanks
b. Foreign-charteredbanks
2. Credit extended to U.S.nonbank residents
a. By foreign branchesof U.S. banks
b. By Caribbeanoffices of foreign-chartered banks
3. Eurodollar holdings ofU.S. nonbank residents
a. At all U.S.-chartered banks andforeign- charteredbanks in Canada andthe United Kingdom
b. At the Caribbeanoffices of foreign-chartered banks
MEMO: Data as recorded in thetransactions accounts
1. Data on lines 1 through 3 are from Federal Reserve sources and sometimes differ intiming from the banking data incorporated in the U.S. international transactionsaccounts.
Lines la, Ib, and 2a are averages of daily data reported on the FR 2950 and FR2951.Lines 2b and 3b are end-of-period data reported quarterly on the FFIEC 002s.Line 3a is an average of daily data (FR 2050) supplemented by the FR 2502 and end-of-
quarter data supplied by the Bank of Canada and the Bank of England. There is a break inthe series in April 1994.
Lines 4 and 5 are end-of-period data estimated by BEA on the basis of data provided bythe BIS, the Bank of England. and the FR 2502 and FFIEC 002s. It includes some foreign-currency denominated deposits and loans. Source: SCB** Data for the month of July 1996 were only available up through July 29.
IV-9
Foreign Exchange and Foreign Financial Markets
The weighted-average dollar has declined 1-3/8 percent on
balance since the time of the July FOMC meeting. Contributing to
the dollar's decline was a reduction of market expectations about
the pace of U.S. activity and the consequent probability of a near-
term tightening of U.S. monetary policy.
Against individual currencies, the dollar's movements during
the period have been diverse. The dollar has declined 2-1/4 percent
against the mark, but it has moved down significantly less against
many other major European currencies, as doubts reemerged about the
timetable for, and perhaps even the ultimate success of, European
Monetary Union (EMU). The decision of the Bundesbank Council to
leave the German RP rate unchanged after its July 25 meeting took
markets by surprise, coming as it did after numerous statements from
Council members indicating that such a reduction would not be
unreasonable, and resulted in a strengthening of the mark against
many of the other European currencies. The French franc came under
additional downward pressures, sinking to a 4-month low against the
mark during the period, amid rumors--later denied--that high-level
French and German officials had met to discuss delaying the start of
EMU, reports that France's fiscal deficit may come in well over the
Maastricht criterion of 3 percent of GDP in 1997, and indications
that the French government was seeking to pressure Bank of France
Governor Trichet into taking an easier policy stance to help the
ailing French economy. While the Bank of France did on separate
occasions lower its money-market intervention rate and its 5-to-10-
day RP rate 5 and 15 basis points, respectively, during the period,
both short-term and long-term differentials between market rates in
France and Germany have widened somewhat.
Despite the steady policy of the Bundesbank, the Bank of Italy
lowered its discount rate during the period 3/4 percentage point to
8-1/4 percent, as the Italian inflation rate in both June and July
came in below 4 percent. The move had been widely anticipated and
caused little immediate reaction in the markets.
IV-10
Weighted Average Exchange Value of the Dollar(Daily data)
Exports2 60.8 79.5 21.9 23.6 7.6 n.a.Current Account 2 -29.5 -0.7 -0.5 n.a..1. Percentage change from previous period.2. Billions of U.S. dollars, NSA
credits. The loan originally was announced on June 19 as being for
$3 billion, which Mexico had intended to use, along with additional
funds previously raised in international capital markets, to prepay
$4.7 billion in medium-term swaps from the ESF. Due to high demand,
the size of the loan was increased to $6 billion, permitting a
larger repayment to the ESF, along with a repayment of $1 billion to
the International Monetary Fund.
In Argentina, there is continued evidence that the economy is
recovering. June industrial production (SA) showed an increase of
1.7 percent compared with a year earlier, although it fell 4.7
percent from May. In part because the recovery has been slower than
expected, unemployment increased slightly in May to 17.1 percent
from 16.4 percent in October 1995. Notwithstanding higher economic
activity, inflation has remained low, with July consumer prices 0.1
percent above their year-earlier level, and the trade surplus rose
in the second quarter. International reserves less gold and
securities have reached new highs since last year's drain and were
$14.4 billion at end-July, about unchanged from their level at the
end of 1995.
Argentina's $2.5 billion fiscal deficit in the first half of
this year was $1 billion over the target agreed with the IMF, in
part reflecting the slow pace of economic recovery and congressional
delays on the approval of the privatization of nuclear plants and
the hydroelectric dam, Yacyreta. To reduce the deficit, the
government announced a series of public payroll reduction measures
IV-24
ARGENTINE ECONOMIC INDICATORS(Percent change from year earlier except where noted)
1994 1995 1996 1996
Q1 Q2 Jun Jul
Real GDP 7.4 -4.4 -3.2 n.a. ... ...
Industrial Production (SA) 5.7 -6.2 -9.1 2.6 1.7 n.a.
Unemployment Rate (%)2 11.7 17.4 ... 17.1 ...
Consumer Prices 1 3.9 1.5 -0.3 -0.1 0.1 0.5
Trade Balance 3 -4.0 3.0 0.2 1.3 0.2 n.a.
Current Account 3 -9.9 -3.2 . ... .. ...1. Percentage change from previous period.2. Unemployment figures available only in May and October of each year. Theannual figure is the average of the two surveys.3. Billions of U.S. dollars, NSA
that will save an estimated $2 billion per year. These measures
were not well received by Argentines, and the largest union
federation, the CGT, led a general strike on August 8th.
Increasing political pressures over the fiscal adjustment
measures renewed frictions between President Menem and Finance
Minister Cavallo, culminating in Menem's ouster of Cavallo on July
26. Roque Fernandez, formerly the President of the Central Bank,
replaced Cavallo as Finance Minister on July 29. The new Central
Bank President, Pedro Pou, was previously vice president of the
Central Bank. Financial market reaction to Cavallo's departure,
following a short initial period of instability, subsequently was
calm in Argentina and elsewhere in Latin America as Fernandez vowed
to continue with current economic policy and renegotiate targets
with the IMF.
In spite of public dissatisfaction with fiscal tightening, on
August 12, the government announced a wide-ranging set of tax
increases that will more than offset a reduction in the general
value-added tax from 21 percent to 20 percent. The government
estimates that the new package, on balance, will yield $1.2 billion
in 1996 and $4 billion in 1997.
In Brazil, industrial production (SA) has been essentially
flat so far this year, indicating that the economy has yet to resume
strong growth. Inflation picked up slightly in the last couple of
months, but has remained low by Brazilian standards. The cumulative
trade deficit for January to June was $0.3 billion, compared with a
$4.3 billion deficit a year earlier. International reserves at the
end of June totalled $60 billion (liquidity concept), up
IV-25
considerably from $31.5 billion a year ago, despite a payment of
nearly $1.4 billion to the Paris Club at the end of June. However,
Brazil had $263 million in net foreign capital outflows in June,
against inflows of $345 million in May.
BRAZILIAN ECONOMIC INDICATORS(Percent change from year earlier except where noted)
1994 1995 1996 1996
Q1 Q2 Jun Jul
Real GDP 5.9 4.2 -2.1 n.a. ... ...
Industrial Production (SA) 1 7.9 3.6 -1.5 n.a. -1.1 n.a.