Content last modified 02/09/2012. Prefatory Note The attached document represents the most complete and accurate version available based on original files from the FOMC Secretariat at the Board of Governors of the Federal Reserve System. Please note that some material may have been redacted from this document if that material was received on a confidential basis. Redacted material is indicated by occasional gaps in the text or by gray boxes around non-text content. All redacted passages are exempt from disclosure under applicable provisions of the Freedom of Information Act.
Transcript
Content last modified 02/09/2012.
Prefatory Note The attached document represents the most complete and accurate version available based on original files from the FOMC Secretariat at the Board of Governors of the Federal Reserve System. Please note that some material may have been redacted from this document if that material was received on a confidential basis. Redacted material is indicated by occasional gaps in the text or by gray boxes around non-text content. All redacted passages are exempt from disclosure under applicable provisions of the Freedom of Information Act.
Class II FOMC - Restricted (FR)
Part 1 December 6, 2006
CURRENT ECONOMICAND FINANCIAL CONDITIONS
Summary and Outlook
Prepared for the Federal Open Market Committeeby the staff of the Board of Governors of the Federal Reserve System
Class II FOMC - Restricted (FR)
December 6, 2006
Summary and Outlook
Prepared for the Federal Open Market Committeeby the staff of the Board of Governors of the Federal Reserve System
Class II FOMC—Restricted (FR)
Domestic Developments
I-1
Incoming data on the major components of aggregate demand appear to support our view that economic activity has slowed to below its potential rate of growth. Spending and production in some sectors look even weaker than we were anticipating at the time of the October Greenbook. In contrast, the indicators from the labor market have generally been stronger than we were expecting, with few signs of an appreciable slowing in the pace of hiring and with a noticeable further decline in the unemployment rate. In constructing our forecast of aggregate activity, we have given greater weight to the data on spending and industrial production. Measurement problems in the motor vehicle sector appear to be distorting the quarterly pattern of real GDP growth this year; we estimate that, in the absence of this distortion, growth over the second half would be roughly 1½ percent at an annual rate, a shade below our previous projection. Our longer-run forecast for real activity is not much different from the one in the October Greenbook. We now anticipate a slightly lower dollar, higher stock market, and lower long-term interest rates than in our previous projection, but the additional stimulus implied by these factors has been roughly offset by the consequences for consumer spending of a larger downward revision to the level of labor income than we had been anticipating.1 All told, we continue to project that real GDP growth will step up to 2¼ percent in 2007 and 2½ percent in 2008 as the drag from the contraction in residential construction gradually diminishes. We expect this path for GDP growth to push the unemployment rate above 5 percent by the middle of 2008. Although the unemployment rate eventually returns to the same level as in the previous projection, labor markets are a little tighter over much of the forecast period, an influence that, by itself, would imply slightly greater upward pressure on price inflation. However, this effect is about offset by the sharp downward revision to compensation gains in recent quarters, which implies a higher level of the markup this year and hence, in our view, less price pressure going forward. In the end, our inflation forecast is the same as in the last Greenbook, with core PCE price inflation projected to edge down from 2.4 percent this year to 2.1 percent in 2008. The slowing in inflation reflects a further abatement of the effects of higher energy and import prices, a projected step-down in rent increases from this year’s outsized pace, and the emergence of a small amount of slack toward the end of the forecast period.
1 The revision to second-quarter compensation is described in more detail in Part 2.
I-2 Class II FOMC—Restricted (FR) Part 1: Summary and Outlook, December 6, 2006
Key Background Factors We continue to assume that the FOMC will keep the federal funds rate at 5¼ percent through the first half of 2008 and then lower it to 5 percent in late 2008. In contrast, financial market participants have marked down their expected policy path beyond the December meeting; by late 2008, the downward revision amounts to about 50 basis points. Assuming our typical adjustment for the term premium, this additional easing would be consistent with the federal funds rate falling to a bit less than 4¼ percent by the end of 2008. Interest rates on longer-term securities also have declined since the October Greenbook; however, we assume that long-term rates will move up next year as term premiums rise and market participants come to realize that the federal funds rate will remain higher than they currently expect. Broad equity prices have risen about 4 percent since the October Greenbook, leading us to raise our starting point for share prices by this amount. As in previous Greenbooks, we assume that stock prices will increase at an annual rate of 6½ percent over the next two years, a pace that would roughly maintain risk-adjusted parity with the returns on long-term Treasury securities. Meanwhile, the incoming data on housing prices have shown a deceleration in line with our expectations, with the OFHEO purchase-only price index up at an annual rate of just 1½ percent in the third quarter. We expect this measure of house prices to rise 1¼ percent in both 2007 and 2008, the same pace as in our previous projection. With regard to our fiscal policy assumptions, we continue to expect that federal spending in 2007 will be boosted by higher defense purchases. However, we raised our projection of defense purchases in 2008 in light of preliminary reports suggesting that future supplemental appropriations requests would be larger than we had been anticipating. We made no changes to our assumptions about nondefense purchases. On the revenue side, we have maintained our assumption that the research and experimentation tax credit and alternative minimum tax relief will be extended through 2008. On net, federal fiscal policy is expected to provide an impetus to real GDP growth of about 0.3 percentage point in 2007 and 0.1 percentage point in 2008. In the unified budget, we project a deficit of $247 billion for fiscal year 2007. For fiscal year 2008, we project that the deficit will rise to $285 billion as spending continues to increase and as receipts decelerate to a pace that is more in line with that of nominal income. On net, our deficit projections are close to those in the last Greenbook.
Class II FOMC -- Restricted (FR)
Key Background Factors Underlying the Baseline Staff Projection
2003 2004 2005 2006 2007 20080
1
2
3
4
5
6
7
0
1
2
3
4
5
6
7Percent
Federal Funds Rate
Quarterly average
Note. The assumed federal funds rate is unchanged from the
October Greenbook.
Note. In each panel, shading represents the projection period.
Current Greenbook
October Greenbook
Market forecast
2003 2004 2005 2006 2007 20083
4
5
6
7
8
9
3
4
5
6
7
8
9Percent
Long-Term Interest Rates
Quarterly average
Baa corporate rate October GB
10-yearTreasury rate October GB
2003 2004 2005 2006 2007 200870
2102003:Q1=100, ratio scale
70
90
110
130
150
170
190
210Quarter-end
Equity Prices
Wilshire 5000
October GB
2003 2004 2005 2006 2007 200890
1702003:Q1=100, ratio scale
90
110
130
150
170Quarterly
House Prices
OFHEO purchase-only index
October GB
2003 2004 2005 2006 2007 200816
32
48
64
80
16
32
48
64
80
Dollars per barrel
Crude Oil Prices
Quarterly average
West Texasintermediate
October GB
2003 2004 2005 2006 2007 200875
80
85
90
95
100
105
75
80
85
90
95
100
1052003:Q1=100
Broad Real Dollar
Quarterly average
October GB
I-3
I-4 Class II FOMC—Restricted (FR) Part 1: Summary and Outlook, December 6, 2006
The foreign exchange value of the dollar has depreciated about 2 percent since the October Greenbook, and in response, we have lowered our starting point for the projected path of the real trade-weighted dollar. We assume that the dollar will depreciate a bit more than ½ percent per year through the end of the forecast period, which leaves the path of the dollar a little lower than in our last projection. Meanwhile, with incoming data on economic growth abroad roughly in line with what we were expecting, we continue to project that foreign GDP will rise about 3¼ percent in 2007 and 2008. The spot price of West Texas intermediate (WTI) crude oil has risen about $2.50 per barrel since the October Greenbook, to about $62.50 per barrel, close to our previous projection. With a variety of factors around the world continuing to restrain supply, and with global demand anticipated to remain solid, market participants expect prices to move up further over the next two years. Consistent with the quotes from futures markets, we assume that the price of WTI will gradually rise to $70 per barrel by 2008. This path for oil prices is little changed from that assumed in our previous forecast. Recent Developments and the Near-Term Outlook We estimate that measured real GDP rose at an annual rate of 2 percent in the third quarter, 1 percentage point more than we had projected in the October Greenbook.2 However, all of that difference reflects an unexpected jump in motor vehicle output, which we believe is due to some anomalies in the way that the Bureau of Economic Analysis (BEA) measures the output of that sector of the economy. The chief evidence of those anomalies is the fact that the real value of new motor vehicle output in the national accounts is currently estimated to have risen at an annual rate of 28 percent in the third quarter even though motor vehicle assemblies declined at an annual rate of 600,000 units. On the BEA’s numbers, new motor vehicle output contributed 0.7 percentage point to the growth of real GDP last quarter; in contrast, we have translated the decline in assemblies into a 20 percent drop in the IP index for motor vehicles, which is consistent with new motor vehicle output subtracting 0.3 percentage point from GDP growth.3
2 Our estimate incorporates data that were not available when the BEA published its preliminary
estimate of 2.2 percent. 3 We see two reasons for this discrepancy. First, the BEA infers motor vehicle output from data on
sales, on net international trade, and on inventory changes rather than measuring it directly using data on production; we think that this procedure led to an understatement of real output growth in the first half and an overstatement of growth in the third quarter. Second, the BEA deflates the unit values of light trucks in inventory using the PPI for light trucks. A questionable drop in the reported level of this index that is
Domestic Developments Class II FOMC—Restricted (FR) I-5
Summary of the Near-Term Outlook (Percent change at annual rate except as noted)
2006:Q3 2006:Q4 Measure Oct.
GB Dec. GB
Oct. GB
Dec. GB
Real GDP 1.0 2.0 2.3 1.3 Private domestic final purchases 2.3 2.0 1.7 1.2 Personal consumption expenditures 2.9 2.9 3.1 3.1 Residential investment -18.8 -18.7 -20.8 -23.8 Business fixed investment 12.0 9.4 5.8 4.1 Government outlays for consumption and investment .8 2.0 3.0 3.4
In putting together our GDP forecast, we have assumed that the unwinding of these anomalies will hold down growth this quarter by about ½ percentage point.4 At the same time, we have interpreted recent data as suggesting a slightly lower pace of real output growth outside of motor vehicles this quarter than we had assumed in our previous projection. As a result, we have marked down our forecast for measured GDP growth in the fourth quarter by 1 percentage point, to an annual rate of 1¼ percent. Adjusting for our estimate of the measurement problem, our current forecast would show real GDP growth of about 1 percent in the third quarter and nearly 2 percent in the fourth quarter. The latest BEA release also included a sharp downward revision to the previously published estimate of wages and salaries in the second quarter. Indeed, this adjustment, which brings on board information from unemployment insurance tax records, effectively reversed the earlier upward revision that the BEA made to the first quarter and now suggests that the entire first-quarter spike in wages and salaries was transitory; we had previously assumed that only about half of that spike would be transitory. Largely as a consequence of this revision, we have marked down our forecast of growth in real disposable income this year by ½ percentage point, to 3 percent, which leaves the saving
relevant for valuing end-of-quarter stocks led to a sharp increase in the BEA’s estimate of the real value of light truck inventories in the third quarter that we believe distorted the published estimate of GDP growth.
4 The fourth-quarter unwinding is smaller than the overstatement in the third quarter because some of that overstatement was an offset to opposite-signed measurement errors in the first half of the year.
I-6 Class II FOMC—Restricted (FR) Part 1: Summary and Outlook, December 6, 2006
rate in this projection noticeably lower than in the October Greenbook. Given the typical lags in the response of spending to changes in income, the lower level of income in this projection results in a somewhat slower projected pace of growth of consumer spending over the forecast period. Manufacturing production appears to have decelerated in recent months. After rising at an annual rate of about 4½ percent in the third quarter, factory output is projected to be little changed in the fourth quarter. The anticipated dropback in output growth this quarter primarily reflects small cuts in factory production outside of the high-tech and transportation categories, most notably in the components of IP associated with residential construction. Motor vehicle assemblies are expected to remain close to their third-quarter pace as automakers hold production at a level intended to pare excess inventories. In contrast, high-tech output appears to be on track for another sizable increase this quarter, especially in the production of semiconductors and communications equipment. The labor market has held up surprisingly well in light of the deceleration suggested by the incoming data on spending, construction, and industrial production. Private payroll employment gains during the past four months averaged more than 100,000 per month, and the unemployment rate declined noticeably over that period, to 4.4 percent in October. In response, we have raised our near-term forecast for private employment to show increases of 100,000 per month in both November and December and have lowered our forecast of the unemployment rate in these months by a couple of tenths, so that the jobless rate is now projected to average 4.5 percent for the fourth quarter as a whole. That said, we still expect the pace of hiring to drop back in the near future; the higher level of initial claims for unemployment insurance seen in recent weeks may be an early sign of that slowing. Consumer spending has been well maintained in recent months, supported by ongoing job gains, declining energy prices, and increases in stock market wealth. Although sales of light motor vehicles stepped down to an annual rate of 16 million units in October and November from a 16½ million unit pace in the third quarter,
Moreover, outlays for other goods and services rose
a robust 0.4 percent in October; more-timely indicators point to smaller gains in November and December. All told, we expect real PCE to rise at an annual rate of
m1raw01
Typewritten Text
.
Domestic Developments Class II FOMC—Restricted (FR) I-7
3 percent in the fourth quarter, a pace similar to its third-quarter rate and in line with our previous projection. The latest data on the housing sector suggest that builders are acting more aggressively than we had expected to reduce their elevated backlogs of unsold new homes, despite some signs of a leveling off in housing demand. In particular, starts of new single-family homes fell more than we were expecting in October; with permit issuance down sharply as well, we reduced our forecast for single-family starts in the fourth quarter to an annual rate of 1.2 million units. Starts and permits in the multifamily sector have also edged down, on net, in recent months, although the current level of starts is not much below its longer-run average. Consistent with our forecast for starts, the projected contraction in residential construction this quarter—at an annual rate of almost 24 percent—is somewhat larger than that in our previous projection and subtracts about 1½ percentage points from the growth of real GDP. Real outlays for equipment and software (E&S) are projected to decelerate from a 7¼ percent annual rate of growth in the third quarter to a 3 percent pace in the fourth quarter. After increasing sharply in the third quarter, purchases of transportation equipment are expected to change little this quarter, with a small decline in business spending on motor vehicles and an increase in outlays for aircraft. In addition, both the recent data on orders and shipments and anecdotal information from the communications industry point to some slowing in the rate of growth of business spending on high-tech equipment. Demand for other types of equipment also appears to have softened in recent months, although the still-high level of orders relative to that of shipments should mitigate the extent of the deceleration in investment spending in this category. We have marked down our near-term forecast for nonresidential construction in response to incoming data. Outlays for drilling and mining structures in the third quarter came in well below our previous forecast, and counts of drilling rigs in operation have slipped recently. In addition, the latest reading on construction put in place points to a more noticeable deceleration than we were expecting in construction outlays for other types of structures. Nonetheless, our forecast for spending in this sector is still relatively robust, with a projected increase of 6½ percent (annual rate) this quarter after a 15 percent advance in the third quarter.
I-8 Class II FOMC—Restricted (FR) Part 1: Summary and Outlook, December 6, 2006
Our near-term forecast of real nonfarm inventory investment is distorted by the measurement problem in the BEA estimate of motor vehicle output that we noted earlier.5 Cutting through this measurement issue, we expect motor vehicle stocks to be above desired levels at the end of this year despite the subdued pace of production. Outside of motor vehicles, inventory-sales ratios also appear to have edged up recently in a number of industries. Given our expectation that businesses will adjust production promptly to deal with emerging supply-demand imbalances, we are looking for some slowing in the pace of stockbuilding this quarter. As a result, we project that nonfarm inventory investment excluding motor vehicles and parts will subtract about ¼ percentage point from real GDP growth in the fourth quarter. In the government sector, real federal expenditures on consumption and gross investment rose at an annual rate of only 1½ percent in the third quarter, held down by a further decline in defense spending. Consistent with readings from the latest monthly and daily Treasury statements, we anticipate that defense spending will rebound to a level more consistent with current appropriations; as a result, we project that total federal outlays will rise at a 4¼ percent pace in the fourth quarter. In the state and local sector, real expenditures rose at an annual rate of 2½ percent in the third quarter, as further sizable gains in employment more than offset a small decline in construction spending. We project that real spending by state and local governments will accelerate to a 3 percent pace this quarter, reflecting continued employment growth and a step-up in construction spending. In the external sector, the BEA estimates that real net exports subtracted ¼ percentage point from real GDP growth in the third quarter, about half of the drag that we had projected in the October Greenbook; the difference is mainly due to a smaller rise in imports than we had estimated. In the fourth quarter, real net exports are projected to add ½ percentage point to real GDP growth, a somewhat larger contribution than in our previous projection. The large downward revision to wages and salaries in the second quarter significantly altered the recent pattern of growth in nonfarm compensation per hour. Hourly compensation is now reported to have fallen at an annual rate of about 1 percent in the second quarter and to have risen at a 2½ percent pace in the third quarter. Recent
5 In particular, we believe that the level of motor vehicle inventory investment is overstated in the third
quarter, contributing to measured topline GDP growth. As that overstatement in inventories is worn off during the fourth quarter, real GDP growth will be held down.
Domestic Developments Class II FOMC—Restricted (FR) I-9
monthly readings on average hourly earnings have led us to nudge up our projected increase in compensation in the fourth quarter. Nevertheless, the projected rise in hourly compensation for 2006 as a whole now stands a little below 5 percent, 1½ percentage points less than in our previous projection. The incoming data on consumer price inflation have been mixed. The core CPI rose just 0.1 percent in October, less than what we were expecting. In contrast, the core PCE price index rose a bit more than 0.2 percent, a few basis points higher than in our previous projection; this small miss boosted our forecast for core PCE price inflation to an annual rate of 2.6 percent in the fourth quarter. Recent information still points to a sharp drop in consumer energy prices this quarter, and accordingly we continue to look for a small decline in the overall PCE price index. The Longer-Term Outlook for the Economy We project that real GDP will rise about 2¼ percent in 2007, with the pace of activity restrained by a further—albeit smaller—contraction in residential investment. With the housing market anticipated to stabilize by the end of next year, we project real GDP to accelerate to a 2½ percent rate of growth in 2008. This GDP forecast is very similar to the one in the last Greenbook, as a small boost from the lower dollar and somewhat more favorable financial conditions is roughly offset by the restraint implied by the downward revision to income indicated in the most recent NIPA release. However, resource utilization next year is projected to be a little tighter in this forecast than in the October Greenbook, given the lower-than-anticipated starting point for the unemployment rate. Household spending. After a 3¼ percent increase this year, real personal consumption expenditures are projected to rise 2½ percent in 2007 and 2008. Although we expect that moderate gains in real disposable income will continue to support consumer spending in coming quarters, the upward impetus to PCE growth from household wealth is projected to wane next year and turn negative in 2008. With interest rates drifting up as well, we anticipate that consumer spending will increase less than income over the forecast period. As a result, we project that the saving rate will rise from negative 1¼ percent in the third quarter of 2006 to about 1 percent by the end of 2008. Our current forecast for real PCE is a touch weaker than the one in the October Greenbook; as noted earlier, the sizable downward revision to income in this projection implies slower growth in consumer spending for a while, given the usual lags.
I-10 Class II FOMC—Restricted (FR) Part 1: Summary and Outlook, December 6, 2006
Projections of Real GDP (Percent change at annual rate from end of
As noted above, the incoming data suggest that homebuilders are aggressively scaling back new projects in response to the uncomfortably high level of inventories of new single-family homes. We have carried over some of the greater weakness into next year as well, leaving our forecast for single-family housing starts in 2007 at 1.2 million units, about 50,000 units below our previous projection. Given our expectation that the demand for housing will stabilize, this pace of starts should make a significant dent in the current oversupply of new homes by the end of next year. At that point, we think that starts will begin to turn up again, and we project them to run at a 1.3 million unit pace by the end of 2008. Multifamily starts, which have edged down only a little over the course of this year, are projected to be 330,000 units next year and then return to a 350,000 unit pace in
Domestic Developments Class II FOMC—Restricted (FR) I-11
2008. All told, real residential investment is expected to decline another 7½ percent in 2007 and then to rise 1½ percent in 2008. Business spending. We expect growth in business spending on equipment and software to step down from 6 percent this year to 3¾ percent in 2007 before picking back up to 5½ percent in 2008. In large part, this pattern of E&S spending reflects the projected path of outlays for equipment other than high tech and transportation, which tend to move in response to changes in business output; in addition, outlays on motor vehicles are expected to be held down in 2007 by the payback for truck purchases made this year ahead of the new EPA regulations that take effect in January. In contrast, real outlays for high-tech equipment and software are projected to rise about 9 percent in both 2007 and 2008 with the support of continued spending by telecommunication service providers on fiber optic networks and strong demand for products that embody the latest wave of advances in semiconductor and computer technologies. Nonresidential construction spending is projected to decelerate from about a 12½ percent advance this year to 4½ percent in 2007 and 1 percent in 2008. As in previous Greenbooks, we expect the projected moderation in the growth of both business equipment spending and employment to restrain the demand for nonresidential space. In addition, we continue to project that outlays for drilling and mining will decelerate from their very rapid pace of the past few years in response to the relatively stable projected level of prices for crude oil and natural gas. Although inventories currently appear high relative to sales in a few sectors, our forecast continues to assume that businesses are moving promptly to keep their stocks roughly in line with sales and that they will continue to do so over the remainder of the projection period. As a result, inventory investment is expected to be a relatively neutral factor for real GDP growth in both 2007 and 2008. Government spending. Real federal expenditures on consumption and investment are projected to rise 2¼ percent in 2007 and 1½ percent in 2008. Real defense spending is expected to increase 3¼ percent in 2007, a rate consistent with currently enacted appropriations for regular defense activities and supplemental spending for military operations in Iraq and Afghanistan. For 2008, we expect defense spending to rise another 2 percent on the assumption that the Congress will approve additional supplementary appropriations for that year. Given current budget authority and our assumption that the Congress and the Administration will continue to keep a fairly tight lid on increases in
I-12 Class II FOMC—Restricted (FR) Part 1: Summary and Outlook, December 6, 2006
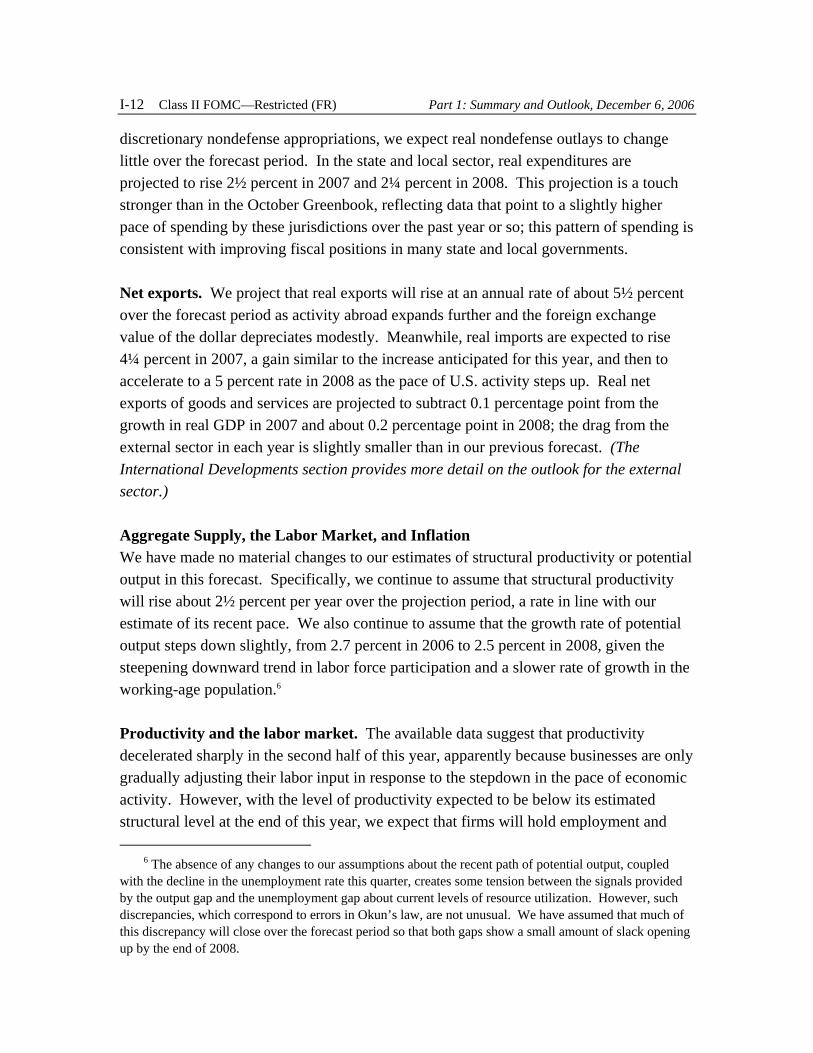
discretionary nondefense appropriations, we expect real nondefense outlays to change little over the forecast period. In the state and local sector, real expenditures are projected to rise 2½ percent in 2007 and 2¼ percent in 2008. This projection is a touch stronger than in the October Greenbook, reflecting data that point to a slightly higher pace of spending by these jurisdictions over the past year or so; this pattern of spending is consistent with improving fiscal positions in many state and local governments. Net exports. We project that real exports will rise at an annual rate of about 5½ percent over the forecast period as activity abroad expands further and the foreign exchange value of the dollar depreciates modestly. Meanwhile, real imports are expected to rise 4¼ percent in 2007, a gain similar to the increase anticipated for this year, and then to accelerate to a 5 percent rate in 2008 as the pace of U.S. activity steps up. Real net exports of goods and services are projected to subtract 0.1 percentage point from the growth in real GDP in 2007 and about 0.2 percentage point in 2008; the drag from the external sector in each year is slightly smaller than in our previous forecast. (The International Developments section provides more detail on the outlook for the external sector.) Aggregate Supply, the Labor Market, and Inflation We have made no material changes to our estimates of structural productivity or potential output in this forecast. Specifically, we continue to assume that structural productivity will rise about 2½ percent per year over the projection period, a rate in line with our estimate of its recent pace. We also continue to assume that the growth rate of potential output steps down slightly, from 2.7 percent in 2006 to 2.5 percent in 2008, given the steepening downward trend in labor force participation and a slower rate of growth in the working-age population.6 Productivity and the labor market. The available data suggest that productivity decelerated sharply in the second half of this year, apparently because businesses are only gradually adjusting their labor input in response to the stepdown in the pace of economic activity. However, with the level of productivity expected to be below its estimated structural level at the end of this year, we expect that firms will hold employment and
6 The absence of any changes to our assumptions about the recent path of potential output, coupled with the decline in the unemployment rate this quarter, creates some tension between the signals provided by the output gap and the unemployment gap about current levels of resource utilization. However, such discrepancies, which correspond to errors in Okun’s law, are not unusual. We have assumed that much of this discrepancy will close over the forecast period so that both gaps show a small amount of slack opening up by the end of 2008.
Domestic Developments Class II FOMC—Restricted (FR) I-13
Decomposition of Structural Labor Productivity Nonfarm Business Sector
NOTE. Components may not sum to totals because of rounding. For multiyear periods, the percent change is the annual average from Q4 of the year preceding the first year shown to Q4 of the last year shown. 1. Percentage points.
1. Percent, average for the fourth quarter. 2. Percent difference between actual and potential GDP in the fourth quarter of the year indicated. A negative number indicates that the economy is operating below potential.
I-14 Class II FOMC—Restricted (FR) Part 1: Summary and Outlook, December 6, 2006
Inflation Projections (Percent change, Q4 to Q4, except as noted)
1. December to December. hours worked on a trajectory roughly consistent with slightly above-trend increases in productivity in both 2007 and 2008. As a result, payroll employment gains are projected to moderate from roughly 100,000 per month in the second half of this year to about 75,000 per month in 2007 and 65,000 per month in 2008. With these gains below our estimate of trend increases in employment, the unemployment rate is expected to rise above 5 percent by the middle of 2008.7
7 As noted in the last Greenbook, we estimate that the monthly pace of payroll employment growth
consistent with no change in the unemployment rate will slow from about 105,000 in the current quarter to roughly 80,000 in 2008.
Domestic Developments Class II FOMC—Restricted (FR) I-15
Prices and wages. Core PCE inflation is projected to edge down from 2.4 percent this year to 2.3 percent in 2007 and 2.1 percent in 2008. As in previous Greenbooks, this forecast reflects the diminishing indirect effects of the earlier increases in energy prices, declining relative import prices, and smaller increases in rents. Overall PCE price inflation is projected to pick up in 2007 to 2.8 percent as energy prices rebound in the first half of that year; in 2008, total PCE prices are expected to rise at the same rate as core prices as the increases in energy prices moderate. Hourly compensation in the nonfarm business sector is projected to rise about 5 percent in 2007 and 2008, similar to this year’s pace, as the effects of some persistent tightness in the labor market and assumed increases in the federal minimum wage are roughly offset by the projected decline in price inflation.8 We are projecting a somewhat sharper acceleration in the employment cost index—from 3¼ percent in 2006 to just over 4 percent in 2007 and 2008, bringing it more in line with other measures of wage growth. Financial Flows and Conditions Domestic nonfinancial debt is projected to rise at an annual rate of 6½ percent in the fourth quarter, bringing total growth for the year to 7½ percent. We expect the rate of growth to slow a bit further in 2007 and 2008 as borrowing by households, businesses, and state and local governments slows. Household debt is projected to increase at an annual rate of 6¼ percent in the fourth quarter, largely because of the continued sharp decline in mortgage borrowing. We expect some further moderation in household borrowing over the forecast period as home values appreciate only slightly. Although the extraordinary rise in household debt in recent years has pushed the financial obligations ratio well above its historical range, net worth is relatively high, and delinquency rates on consumer and mortgage loans generally have been quite low. Nonetheless, our outlook for higher mortgage rates and sluggish housing markets, in which some homeowners will experience outright declines in home values, suggests that some erosion in household financial conditions is to be expected.
8 On current proposals, we assume that the hourly federal minimum wage will rise from its current
level of $5.15 to $5.85 in April 2007, to $6.55 in April 2008, and to $7.25 in April 2009. However, we anticipate that these increases will have only a small effect on hourly compensation growth—less than 0.1 percentage point in each year—because of the small number of workers whose wages will be affected by the higher federal wage floor.
I-16 Class II FOMC—Restricted (FR) Part 1: Summary and Outlook, December 6, 2006
With two months of data for corporate securities and bank loans now in hand for the current quarter, we project that nonfinancial business debt will expand at an annual rate of about 7½ percent; that rise would be about the same as in the third quarter and down from 9 percent over the first half of the year. We anticipate that business debt will expand at a more moderate rate over the remainder of the forecast period as recent outsized equity retirements and commercial mortgage borrowing subside. The projected drawdown of liquid assets and the absence of a further material rise in profits are expected to take some of the shine off corporate balance sheets, which may cause default rates to rise a bit from their current unusually low levels. Our projection for the federal debt shows a moderate rise in the fourth quarter, which leaves growth for the year as a whole at 4 percent. The widening of the federal deficit that we project should cause the growth of federal debt to pick up to about a 6 percent pace in 2007 and 2008. In the state and local sector, bond issuance to finance capital expenditures has been quite strong over the second half of this year. State and local borrowing is expected to slow in 2007 and 2008, reflecting, in part, a further falloff in advance refunding. M2 is projected to expand 5 percent this year, a bit less than the growth of nominal GDP, because of a modest drag from the rise in opportunity costs. With opportunity costs expected to be little changed over the projection period, M2 growth is projected to rise a little more than 5 percent in 2007 and 2008. Alternative Simulations In this section, we evaluate several alternatives to the staff forecast using simulations of the FRB/US model. The first two scenarios consider the implications of more-favorable conditions for aggregate supply, either because the labor force expands more rapidly than we project or because the NAIRU is lower than we estimate. In contrast, the third scenario illustrates the risk that the baseline outlook for the labor market could lead to faster-than-expected wage and price inflation. The next set of scenarios focuses on three risks to aggregate demand: that the underlying strength of consumer and business spending will be enough to keep the economy growing at its potential, that the current housing slump will intensify by more than we anticipate, and that financial conditions in bond and equity markets will deteriorate markedly. We evaluate each of these risks under the assumption that monetary policy responds to changes in the outlook according to an estimated version of the Taylor rule. In the final scenario, we assume that monetary policy follows the path implied by quotes from the federal funds futures market.
Domestic Developments Class II FOMC—Restricted (FR) I-17
Faster labor force growth. The staff’s estimate of trend labor force participation is more pessimistic than that of most outside forecasters. In this scenario, we hold the trend labor force participation rate constant at its current-quarter level through 2008 rather than having it decline ½ percentage point as in the baseline projection. The stability in trend participation is assumed to be consistent with the views of financial market participants, and thus the stock market in this scenario is essentially unchanged from baseline. Nonetheless, the more-favorable supply-side assumptions imply faster growth of disposable income and corporate earnings than in the baseline. In fact, the higher expected paths for income and output result in an upward revision to the projection for aggregate demand that slightly exceeds that for aggregate supply.9 As a result, real GDP expands 2½ percent in 2007 and almost 3 percent in 2008, and the unemployment rate rises a little less than in the staff projection; with a touch less slack, prices decelerate a bit more slowly. Monetary policy responds by keeping the federal funds rate at 5¼ percent through the end of 2008. Lower NAIRU. With the unemployment rate having fallen more than we had expected, the recent downward revision to the productivity and costs measure of hourly labor compensation, coupled with continued low readings from the employment cost index, may indicate more labor market slack than we have assumed in the baseline. In this scenario, the NAIRU is assumed to be 4¼ percent, ¾ percentage point below the staff’s estimate, thereby widening the labor market measure of slack. The additional slack causes inflation to fall to 2 percent in 2007 and 1¾ percent in 2008, and monetary policy responds by gradually lowering the federal funds rate to 4¼ percent by 2008—a path that is, perhaps coincidentally, closer to the one currently anticipated by investors. Lower interest rates stimulate private spending, causing the unemployment rate to end up at only 4¾ percent in 2008. Greater wage acceleration. The baseline forecast has only a small pickup in hourly compensation growth, and firms absorb these increased labor costs in their profit margins, allowing price inflation to slow. However, labor and product markets may be tighter than we judge. In this scenario, hourly compensation gradually accelerates to 6 percent by 2008, a rate that is about 1 percentage point faster than in the baseline. In addition, firms prove more able to pass cost increases on to their customers, so that the
9 With unchanged interest rates, faster growth in employment and output leads to a corresponding step-
up in the growth rate of the business capital stock as well as in the growth rates of the stock of housing and consumer durables. To achieve this additional growth, the level of investment spending must rise even faster than that of the capital stock for the first few years.
I-18 Class II FOMC—Restricted (FR) Part 1: Summary and Outlook, December 6, 2006
Alternative Scenarios (Percent change, annual rate, from end of preceding period except as noted)
1. Percent, average for the final quarter of the period.
Domestic Developments Class II FOMC—Restricted (FR) I-19
price markup remains flat rather than drifting down as in the baseline. As a result, core PCE inflation climbs to 3¼ percent in the second half of 2007 and in 2008. Because of the gradualist nature of the estimated policy rule, the acceleration in prices causes the federal funds rate to climb to only 6 percent over the next two years. This tightening proves mildly restrictive and causes real GDP growth to stay close to 2 percent in both 2007 and 2008. Stronger growth. Although many recent spending and production indicators suggest that the economy has slowed, the labor market has continued to tighten. On balance, the baseline forecast assumes that the spending and production indicators are providing the better signal of actual conditions, but in this scenario we instead take our lead from the labor market and assume a stronger underlying pace of activity than in the baseline. In calibrating this scenario, we adjusted spending so as to keep real GDP rising in line with its potential and, as a result, to hold the unemployment rate close to the current level of 4½ percent. The changes to spending needed to achieve this outcome are modest; in particular, we assume that consumption growth is fast enough to push the personal saving rate ½ percentage point below the baseline and that business fixed investment rises 2½ percentage points per year faster over the next two years. In response to stronger real activity, the federal funds rate rises to 6 percent. Inflation remains close to baseline despite greater resource utilization, both because the tighter monetary policy induces a modest appreciation of the dollar that holds down the rise in import prices and because more capital spending boosts labor productivity. Extended housing decline. We may have underestimated the magnitude of the correction currently under way in housing activity, and in this scenario residential investment continues to decline through early 2008. In addition, house prices fall 20 percent over the next two years, reducing household wealth $4½ trillion relative to baseline and eliminating most of the current overvaluation in the housing market that is suggested by some models. The reductions in employment and income implied by the continued falloff in construction activity, coupled with the loss in wealth, directly damp consumer spending and indirectly depress business investment. GDP growth is about ½ percentage point lower in 2007 and almost ¼ percentage point lower in 2008 despite a reduction in the federal funds rate to 4¼ percent by 2008 (a decline that, like the one in the lower-NAIRU scenario, would put rates closer to market expectations). As a result, the unemployment rate rises to 5½ percent by late 2008. In part because slack is only a bit greater on average over the next two years, inflation is little changed.
I-20 Class II FOMC—Restricted (FR) Part 1: Summary and Outlook, December 6, 2006
Tighter financial conditions. Despite an outlook for interest rates and profits that may surprise market participants, our baseline projection assumes that the term premiums embedded in long-term interest rates rise only slowly over the forecast period and that the stock market posts moderate gains. In this scenario, we assume that term premiums rise another 50 basis points for Treasury securities—back to levels seen in 2004—and that equity prices fall to a level that averages a little less than 15 percent below baseline during the next two years. In addition, this scenario incorporates an endogenous rise in risk spreads for private securities. These less-favorable financial conditions depress spending by households and businesses and cause real GDP to expand only 1¾ percent in 2007 and about 2 percent in 2008. As a result, the federal funds rate falls to almost 4 percent in the second half of 2008. As in the previous scenario, the outlook for inflation is little changed. Market-based federal funds rate. Quotes from futures markets imply a path for the federal funds rate that falls steadily over the next two years to less than 4¼ percent by late 2008, a much easier policy stance than in the baseline projection. If the market’s expectations for monetary policy are realized, real GDP growth would rise to just over 3 percent in 2008, and inflation would be 2.4 percent in 2007 and 2.3 percent in 2008.
Domestic Developments Class II FOMC—Restricted (FR) I-21
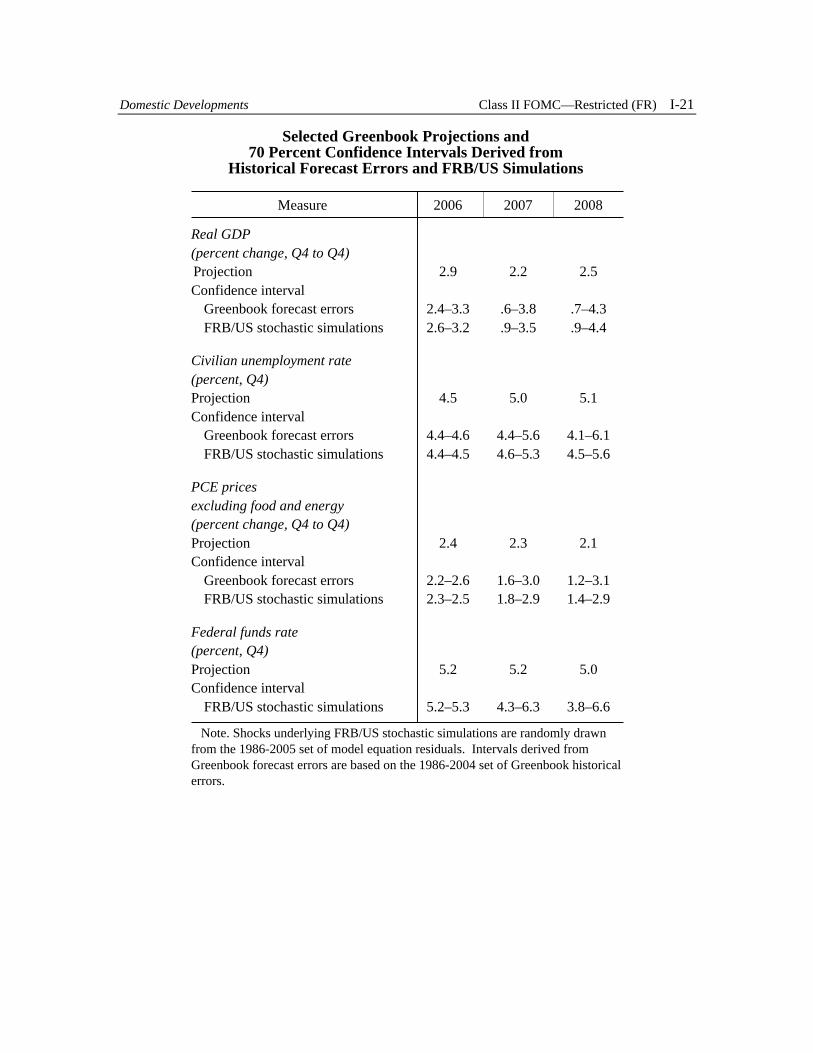
Selected Greenbook Projections and70 Percent Confidence Intervals Derived from
Historical Forecast Errors and FRB/US Simulations
Measure 2006 2007 2008
Real GDP(percent change, Q4 to Q4)Projection 2.9 2.2 2.5Confidence interval
Note. Shocks underlying FRB/US stochastic simulations are randomly drawnfrom the 1986-2005 set of model equation residuals. Intervals derived fromGreenbook forecast errors are based on the 1986-2004 set of Greenbook historicalerrors.
Class II FOMC - Restricted (FR)
Forecast Confidence Intervals and Alternative Scenariosunder the Assumption that Monetary Policy Follows an Estimated Taylor Rule
Confidence Intervals based on FRB/US Stochastic Simulations
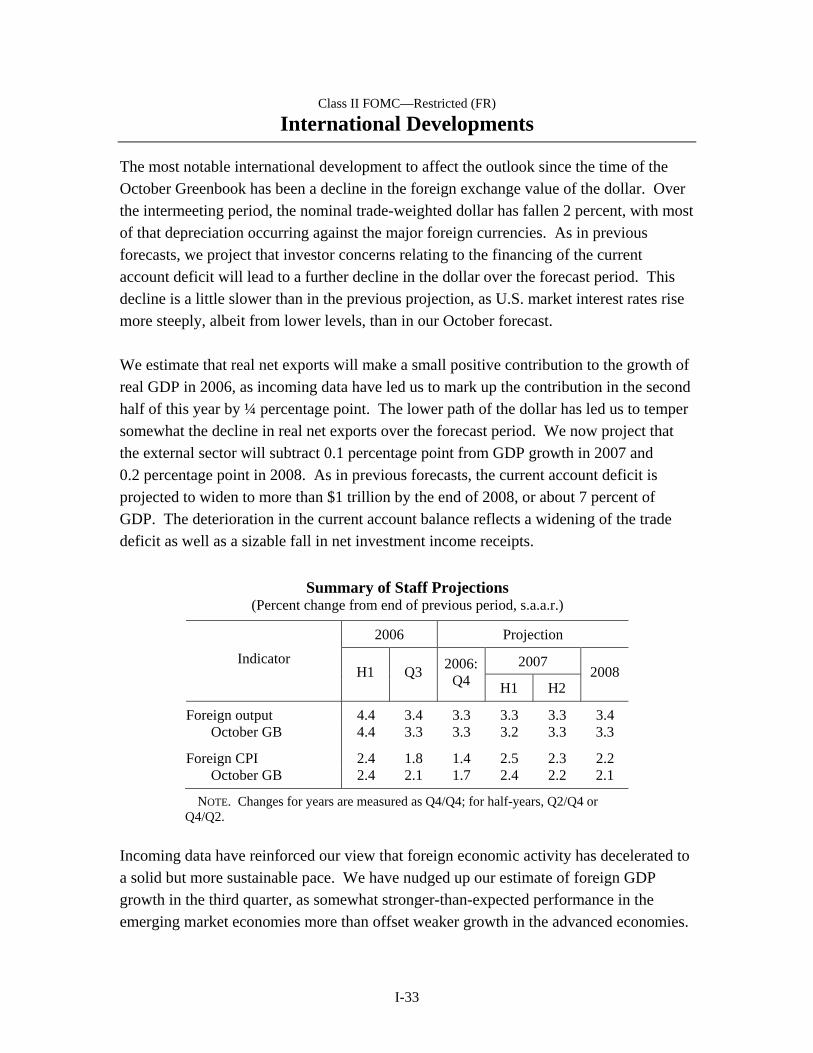
The most notable international development to affect the outlook since the time of the October Greenbook has been a decline in the foreign exchange value of the dollar. Over the intermeeting period, the nominal trade-weighted dollar has fallen 2 percent, with most of that depreciation occurring against the major foreign currencies. As in previous forecasts, we project that investor concerns relating to the financing of the current account deficit will lead to a further decline in the dollar over the forecast period. This decline is a little slower than in the previous projection, as U.S. market interest rates rise more steeply, albeit from lower levels, than in our October forecast. We estimate that real net exports will make a small positive contribution to the growth of real GDP in 2006, as incoming data have led us to mark up the contribution in the second half of this year by ¼ percentage point. The lower path of the dollar has led us to temper somewhat the decline in real net exports over the forecast period. We now project that the external sector will subtract 0.1 percentage point from GDP growth in 2007 and 0.2 percentage point in 2008. As in previous forecasts, the current account deficit is projected to widen to more than $1 trillion by the end of 2008, or about 7 percent of GDP. The deterioration in the current account balance reflects a widening of the trade deficit as well as a sizable fall in net investment income receipts.
Summary of Staff Projections (Percent change from end of previous period, s.a.a.r.)
NOTE. Changes for years are measured as Q4/Q4; for half-years, Q2/Q4 or Q4/Q2.
Incoming data have reinforced our view that foreign economic activity has decelerated to a solid but more sustainable pace. We have nudged up our estimate of foreign GDP growth in the third quarter, as somewhat stronger-than-expected performance in the emerging market economies more than offset weaker growth in the advanced economies.
I-34 Class II FOMC—Restricted (FR) Part I: Summary and Outlook, December 6, 2006
We expect aggregate foreign output to expand at an average rate of about 3¼ percent over the forecast period, little changed from the previous Greenbook. Recent readings on foreign consumer price inflation have been somewhat lower than we anticipated, with declines in energy prices accounting for much of the surprise. The recent weakness appears to be temporary, and we have not made significant changes to our inflation outlook beyond the near term. We expect aggregate foreign inflation to remain close to 2¼ percent in 2007 and 2008, as monetary and fiscal restraint keeps foreign activity in line with potential. Oil Prices The outlook for oil prices is little changed from the previous forecast. The spot price of West Texas intermediate (WTI) crude oil closed at $62.44 per barrel on December 5, up about $2.50 per barrel since the time of the October Greenbook. This increase in the spot price is roughly in line with the October projection. Our current projection, based on NYMEX futures prices, calls for the spot price of WTI to rise to about $70 per barrel in early 2008 and to remain at that level through the end of the forecast period. Compared with the October forecast, the current projection averages only about $1 per barrel higher in 2007 and 2008. The projected path of the price of imported oil has been revised a similarly small amount. Oil prices retain support at historically elevated levels largely because of ongoing supply disruptions and risks. Nigerian production continues to be diminished by rebel activity, and violence in Iraq puts production there at risk. Negotiations with Iran over its nuclear program have made little progress, and oil supplies from the region could be disrupted should sanctions be imposed by the United Nations. In addition, other OPEC members have reduced oil production recently, although the reduction appears smaller than the 1.2 million barrels per day the cartel announced in October. Oil prices also remain supported by the expectation that continued global growth will keep oil demand solid, particularly in developing countries. International Financial Markets The depreciation of the dollar over the intermeeting period has led us to revise down the starting point for our projection of the broad real dollar by 2 percent. Going forward, we continue to believe that the financing burden associated with the U.S. current account deficit will exert downward pressure on the dollar. However, over the intermeeting period, market expectations for future U.S. interest rates moved further below the staff’s
International Developments Class II FOMC—Restricted (FR) I-35
assumptions, and some support for the dollar should emerge as U.S. interest rates turn out to be higher than market participants currently anticipate. Accordingly, we have slightly reduced the projected rate of dollar depreciation from that in the October Greenbook, and we now project that the broad real dollar will decline at an average annual rate of a little more than ½ percent over the forecast period. Over the intermeeting period, the broad nominal dollar index fell 2 percent on balance, as the dollar depreciated 2¾ percent against the major foreign currencies and 1¼ percent against the currencies of our other important trading partners. On a bilateral basis, the dollar registered declines of about 5 percent against the euro and sterling and 3¼ percent against the yen, as dollar interest rates fell more than interest rates in these currencies during the intermeeting period. The dollar also declined against the emerging Asian currencies, with an unusually large fall of 1 percent versus the Chinese renminbi. In contrast, the dollar appreciated about 1¾ percent on net versus the Canadian dollar and about ¾ percent against the Mexican peso. Benchmark long-term interest rates in the advanced foreign economies declined on balance over the intermeeting period, but to a lesser extent than in the United States. In Canada, nominal yields fell about 30 basis points, and inflation-indexed yields fell 20 basis points, as several economic indicators came in below survey expectations. In the euro area and the United Kingdom, nominal and inflation-indexed yields declined about 20 basis points on net. And in Japan, nominal and indexed long-term yields declined 13 and 10 basis points respectively. In Europe and Japan, short-term interest rates changed little on net, as investors have not significantly altered their expectations for monetary policy in the near term. The central banks of Australia, Sweden, and the United Kingdom raised their policy rates 25 basis points early in the intermeeting period. Officials of the European Central Bank continued to signal “strong vigilance” against inflationary pressures, and market participants widely expect that the ECB will raise rates again on December 7. Equity prices in most advanced foreign economies declined or were little changed on balance since the October FOMC meeting. In the euro area and the United Kingdom, stock prices rose early in the intermeeting period but subsequently gave back their gains amid concerns that currency appreciation will weigh on corporate earnings. Equity prices rose robustly in many emerging market economies, and the overall EMBI+ spread rose slightly but remained near historical lows.
I-36 Class II FOMC—Restricted (FR) Part I: Summary and Outlook, December 6, 2006
The Desk did not intervene during the period for the accounts of the System or the Treasury. Advanced Foreign Economies Real GDP in the advanced foreign economies rose at an annual rate of 2.1 percent in the third quarter. This figure was somewhat below our expectations, as weaker growth in Canada and the euro area outweighed stronger growth in Japan. Recent readings on inflation in the advanced foreign economies have also been lower than anticipated, mainly because of large declines in energy prices. We believe that temporary factors explain these surprises; as such, they have not caused us to significantly alter our outlook. Real GDP growth should average about 2¼ percent, and consumer price inflation should stay around 1½ percent, over the forecast period. In the euro area, real GDP growth was 2.1 percent in the third quarter, a figure that was likely understated by seasonal adjustment problems. In the current quarter, we expect GDP growth to rise to an above-trend rate of 2¾ percent, as the scheduled January hike in the German value-added tax (VAT) has likely pulled spending forward. Over the rest of the forecast period, we project euro-area growth to settle to a rate of 1¾ percent, reflecting the effects of tighter monetary and fiscal policies. This path is essentially unchanged from the last Greenbook; although the recent appreciation of the euro should weigh on net exports, recent indicators point to stronger domestic demand. The increase in the German VAT is projected to push up twelve-month inflation in the euro area from 1.8 percent in November to 2 percent in 2007. Inflation should then edge down in 2008. We assume that the European Central Bank will raise its official interest rate 25 basis points tomorrow (December 7) and another 25 basis points by the end of the first quarter to bring the rate to 3¾ percent, with no further changes over the remainder of the forecast period. Given the surge in industrial production and real household spending in October, we expect Japanese GDP growth to rise to an annual rate of 2½ percent in the current quarter. Over the rest of the forecast period, growth is projected to fall gradually to 1½ percent, just above the economy’s potential growth rate. Four-quarter consumer price inflation is projected to edge down to ¼ percent in the near term, primarily reflecting recent declines in food prices, before returning to ½ percent later in the forecast period. We continue to assume that the Bank of Japan will increase its target rate for overnight call loans from ¼ percent at present to 1½ percent by the end of 2008.
m1raw01
Typewritten Text
.
International Developments Class II FOMC—Restricted (FR) I-37
In Canada, real GDP growth slowed over the past two quarters, but we expect it to pick up to 2¼ percent in the current quarter as employment and earnings performance remains solid. This figure is a touch weaker than in the previous forecast, reflecting the revision to our estimate of U.S. growth. With private domestic demand expected to remain firm, we project real GDP growth to strengthen gradually to 2¾ percent by 2008, in line with the contour of the U.S. forecast. Twelve-month headline inflation was about 1 percent in October, held down by the drop in oil prices; but core inflation rose to 2.3 percent, largely on an increase in housing costs. With no further declines in oil prices, we expect headline inflation to rise to about 2 percent by the second half of 2007. With inflation expected to be within the target range, we assume that the Bank of Canada will keep its policy interest rate unchanged at 4¼ percent over the forecast period. In the United Kingdom, we project that real GDP growth will fall slightly from an annual rate of 2¾ percent in the current quarter to around 2½ percent by 2008 as investment growth moderates. The twelve-month rate of CPI inflation ticked up to 2.5 percent in October, with lower petroleum prices offset mainly by a hike in university tuition fees and higher food prices. We expect inflation to remain elevated through mid-2007 but then to fall below the Monetary Policy Committee’s 2 percent target in 2008. We assume that the MPC will raise policy rates a further 25 basis points early in 2007 but will begin to ease early in 2008. Emerging Market Economies The outlook for economic activity in the emerging market economies is a little stronger than in the previous forecast. Real GDP appears to have grown at an annual rate of nearly 5½ percent in the third quarter, about 1 percentage point stronger than projected in the October Greenbook. We expect GDP growth to moderate to an average of 4¾ percent over the remainder of the forecast period. In emerging Asia, real GDP grew at an annual rate of 7 percent in the third quarter, about 1¼ percentage points higher than previously estimated. Third-quarter growth in Hong Kong (15 percent), Indonesia (9 percent), and Taiwan (8 percent) substantially exceeded our expectations, but such outsized performance is not expected to persist. In contrast, growth in China appears to have slowed sharply in the third quarter, suggesting that the administrative measures directed at cooling the economy have finally had an effect. After exceeding 12 percent in the first half of the year, Chinese GDP growth slowed to 7 percent in the third quarter, and recent data suggest that fourth-quarter growth will be
I-38 Class II FOMC—Restricted (FR) Part I: Summary and Outlook, December 6, 2006
lower than previously projected as well.1 Given the recent deceleration, particularly in investment spending, Chinese authorities are less likely to take further measures to restrain investment. As a result, we have made a modest upward revision to our outlook for Chinese GDP growth and expect it to rise to an average rate of almost 8¾ percent over the forecast period. For emerging Asia as a whole, we expect growth to moderate to about 5½ percent in the fourth quarter before moving up to an average annual pace of nearly 6 percent thereafter. In Latin America, real GDP rose at an estimated annual rate of 4 percent in the third quarter, about ¾ percentage point above the October Greenbook projection. The upward revision is due in large part to stronger-than-expected activity in Mexico, where growth came in at 4.1 percent on continued strength in the construction and services sectors. Mexican GDP growth is projected to ease to 3 percent in the fourth quarter, as U.S. manufacturing production slows, and then to pick up to 3½ percent thereafter. This projection is a little stronger than that in the October Greenbook and reflects a re-assessment of the strength of domestic demand. The revision for Mexico pushes up overall Latin American growth to an average rate of nearly 3¾ percent over the forecast period. Four-quarter consumer price inflation in the emerging market economies is projected to edge up from 2½ percent in the current quarter to about 3 percent in 2007 and 2008, as earlier declines in oil prices give way to increases going forward. We have revised down the current-quarter estimate about ¼ percentage point in reaction to incoming data for emerging Asia, which have surprised us on the low side. The projection over the rest of the forecast period is little changed. Prices of Internationally Traded Goods We estimate that core import price inflation fell from 4¼ percent at an annual rate in the third quarter to only 2 percent in the current quarter, 1¼ percentage points less than in the October Greenbook projection. The markdown reflects a surprising decline in core import prices in October, which were dragged down by lower prices for nonfuel industrial supplies. However, the recent fall in the dollar and the continued strength in commodity prices are expected to push up core import price inflation to 3¼ percent in the first quarter of 2007. Thereafter, inflation starts moving down, reaching 1 percent in 2008. This contour reflects our expectation that nonfuel commodity prices will remain
1 China does not publish quarterly levels of real GDP, so quarterly GDP growth figures are estimated
by the staff.
International Developments Class II FOMC—Restricted (FR) I-39
about flat, consistent with futures markets, and that the effects of earlier commodity price increases will diminish over the next several quarters. Compared with the October Greenbook, our projection of core import price inflation is 1 percentage point higher in the first half of 2007, reflecting the lower dollar, and ½ percentage point higher in the second half, owing to a slightly higher projected path for nonfuel commodity prices.
Staff Projections of Selected Trade Prices (Percent change from end of previous period except as noted; s.a.a.r.)
Oil (dollars per barrel) 63.75 66.58 56.08 61.32 63.98 65.03 October GB 63.75 65.69 55.17 60.33 62.69 63.66
NOTE. Prices for core exports exclude computers and semiconductors. Prices for core imports exclude computers, semiconductors, oil, and natural gas. Both price series are on a NIPA chain-weighted basis. The price of imported oil for multiquarter periods is the price for the final quarter of the period. Imported oil includes both crude oil and refined products.
We estimate that core export prices fell ¼ percent at an annual rate in the current quarter after increasing 5¾ percent in the third quarter. Lower prices for petroleum products in September and October account for much of the decline. Export price inflation should bounce back in the first half of 2007 along with prices of petroleum products and agricultural goods. In subsequent quarters, we project that core export price inflation will decline as prices for intermediate materials and primary commodities decelerate. Compared with the previous Greenbook, core export price inflation is almost 3 percentage points lower in the fourth quarter because of a surprisingly large drop in October prices, concentrated in industrial supplies. However, for the first half of 2007, we have revised up core export price inflation almost 1 percentage point to reflect higher projected prices for agricultural goods.
I-40 Class II FOMC—Restricted (FR) Part I: Summary and Outlook, December 6, 2006
Trade in Goods and Services Incoming trade data and the lower path for the dollar have led us to revise up our projection for real net exports over the forecast period. In the third quarter, real net exports subtracted ¼ percentage point from the growth of real GDP, less than the ½ percentage point subtraction projected in the October Greenbook. In the current quarter, we expect real net exports to add ½ percentage point to real GDP growth as import growth slows sharply. Thereafter, the contribution turns negative again, with net exports subtracting about 0.1 percentage point from GDP growth in 2007 and 0.2 percentage point in 2008; although export growth is projected to exceed import growth, the higher level of imports results in a fall in net exports. Our projection for the contribution to GDP growth is about 0.1 percentage point more positive over the forecast period, largely as a result of the lower path for the dollar. Real imports of goods and services increased 5¼ percent at an annual rate in the third quarter, as strong growth in imports of core goods more than offset a decline in imports of services. The third-quarter figure for total real import growth is about 2¾ percentage points lower than in the October Greenbook, as recent trade data came in below expectations. In the current quarter, we project that import growth will slow to ¾ percent, reflecting in large part a sharp drop in oil imports; less oil is expected to be imported in the near term as unusually high oil inventories are drawn down toward more normal levels. Also, following surprisingly strong growth in the third quarter, we expect core imports to decelerate to a rate consistent with the modest projected pace of U.S. GDP growth.
Staff Projections for Trade in Goods and Services (Percent change from end of previous period, s.a.a.r.)
2006 Projection
2007Measure H1 Q3 2006:
Q4 H1 H2 2008
Real exports 10.0 6.3 5.4 5.5 5.4 5.6 October GB 10.0 7.4 4.9 4.6 4.4 4.9
Real imports 5.2 5.3 .7 3.9 4.5 5.1 October GB 5.2 8.1 1.7 3.8 4.6 5.4
NOTE. Changes for years are measured as Q4/Q4; for half-years, Q2/Q4 or Q4/Q2.
International Developments Class II FOMC—Restricted (FR) I-41
We project that import growth will rise to 4¼ percent in 2007 and then further to 5 percent in 2008, as oil imports stabilize and as core import growth strengthens in response to both the projected pick up in U.S. GDP growth and decline in core import price inflation. Similarly, imported services accelerate over the course of the forecast period in line with firming U.S. GDP growth and only a modest further depreciation of the dollar. Imports of computers and semiconductors are expected to continue growing apace. Compared with the October Greenbook, our projections for total imports in 2007 and 2008 are little changed; projected U.S. GDP growth is little revised, and given the limited degree of pass-through of exchange rate changes to core import prices, the modest downward revision to the dollar reduces the growth of core imports only slightly. Real exports of goods and services rose at an annual rate of 6¼ percent in the third quarter, as the rapid growth of exports of core goods more than offset a decline in exports of computers, semiconductors, and services. The estimate for total export growth is a little lower than we anticipated in the October Greenbook, largely reflecting weaker-than-expected exports in September. In the current quarter, we project that real export growth will edge down to 5½ percent. After surprisingly rapid growth in the third quarter, core export growth is expected to fall back to a rate consistent with foreign GDP and relative prices. Total export growth will be bolstered, however, by the resumed growth of exports of computers, semiconductors, and services. We expect total export growth to remain in the vicinity of 5½ percent in 2007 and 2008. The past and projected depreciation of the dollar should provide steady support to core export growth over the forecast period. In 2008, core exports accelerate as slowing export price inflation boosts growth. Services exports are buoyed in the near term by the recent fall in the dollar and then decelerate over the forecast period as the effect of the depreciation fades. Computers and semiconductors are projected to maintain steady growth. Compared with the previous Greenbook, we have revised up our projection for total export growth 1 percentage point in 2007 and ¾ percentage point in 2008, primarily because of the effect of the lower projected path of the dollar on core exports and services. Alternative Simulation Our baseline forecast calls for a modest depreciation of the broad real dollar, but the dollar’s recent weakness may presage a considerably larger decline. Accordingly, in our alternative scenario, we use the FRB/Global model to examine the effects of a risk
I-42 Class II FOMC—Restricted (FR) Part I: Summary and Outlook, December 6, 2006
premium shock in 2007:Q1 that would generate a 10 percent depreciation of the dollar in the absence of adjustment of domestic or foreign interest rates. The decline in the dollar boosts U.S. real GDP growth 0.5 percentage point above baseline in 2007 and about 0.3 percentage point in 2008. Output rises because U.S. exports become more competitive abroad and because U.S. consumers substitute away from imports toward domestically produced goods. Core PCE price inflation increases about 0.2 percentage point above baseline in 2007, mainly because of higher import prices, and 0.1 percentage point in 2008 in response to higher resource utilization. With U.S. monetary policy responding according to a Taylor rule, the federal funds rate increases more than 100 basis points above its baseline level by the end of 2008. The nominal trade balance exhibits a J-curve effect, initially falling before rising about 0.4 percent of GDP above baseline in 2008.
Alternative Simulation: 10 Percent Dollar Depreciation
(Percent change from previous period, annual rate, except as noted)
2007 2008 Indicator and simulation
H1 H2 H1 H2
U.S. real GDP Baseline 2.0 2.4 2.5 2.5 Alternative 2.3 3.1 3.0 2.5
U.S. core PCE inflation Baseline 2.4 2.3 2.2 2.1 Alternative 2.7 2.4 2.3 2.2
U.S. federal funds rate (percent) Baseline 5.3 5.3 5.3 5.0 Alternative 5.7 6.2 6.4 6.2
U.S. trade balance (percent of GDP) Baseline -5.7 -5.6 -5.7 -5.6 Alternative -5.9 -5.5 -5.3 -5.2 NOTE. Half year changes are measured as Q2/Q4 or Q4/Q2. The federal funds rate is the average rate for the final quarter of the period. The monetary authorities in the United States and the major foreign economies adjust their policy rates according to Taylor rules.