Prefatory Note The attached document represents the most complete and accurate version available based on original files from the FOMC Secretariat at the Board of Governors of the Federal Reserve System. Please note that some material may have been redacted from this document if that material was received on a confidential basis. Redacted material is indicated by occasional gaps in the text or by gray boxes around non-text content. All redacted passages are exempt from disclosure under applicable provisions of the Freedom of Information Act. Content last modified 03/07/2014.
Transcript
Prefatory Note The attached document represents the most complete and accurate version available based on original files from the FOMC Secretariat at the Board of Governors of the Federal Reserve System. Please note that some material may have been redacted from this document if that material was received on a confidential basis. Redacted material is indicated by occasional gaps in the text or by gray boxes around non-text content. All redacted passages are exempt from disclosure under applicable provisions of the Freedom of Information Act.
Content last modified 03/07/2014.
CLASS I FOMC - RESTRICTED CONTROLLED (FR)
MONETARY POLICY ALTERNATIVES
PREPARED FOR THE FEDERAL OPEN MARKET COMMITTEE BY THE STAFF OF THE BOARD OF GOVERNORS OF THE FEDERAL RESERVE SYSTEM
JANUARY 24, 2008
CLASS I FOMC – RESTRICTED CONTROLLED (FR) JANUARY 24, 2008
MONETARY POLICY ALTERNATIVES
Recent Developments
Summary
(1) Heightened concerns about credit losses and the global economic outlook
together with the anticipation and subsequent realization of substantial near-term
policy easing have dominated financial market developments since the December
FOMC meeting. Although pressures in short-term funding markets abated
significantly after year-end, broader financial market conditions deteriorated sharply
amid increased concerns about the economic outlook and additional write-downs of
mortgage-related assets by large financial firms. Even after the 75 basis point rate cut
on January 22, market participants see substantial odds of at least 50 basis points of
additional easing on January 30. Moreover, the expected path of policy now bottoms
out at around 2¼ percent in early 2009, about 90 basis points lower than at the time
of the December meeting. Shorter-term nominal Treasury yields fell in line with
policy expectations; longer-dated Treasury yields also fell steeply. Corporate bond
spreads rose to their highest levels in about five years, with speculative-grade spreads
jumping almost 130 basis points over the period since the December FOMC meeting.
Broad equity price indexes dropped about 11 percent, on net, with financial stocks
especially hard hit. Respondents to the January Senior Loan Officer Opinion Survey
reported tightening standards and terms over the past three months for a wide range
of business and household loan categories; they also noted a broad softening of loan
demand.
Monetary Policy Expectations and Treasury Yields
(2) The FOMC’s decision at its December meeting to lower the target federal
funds rate by 25 basis points to 4¼ percent was largely anticipated by market
participants.1 However, investors were surprised that policymakers did not
simultaneously announce other measures to address strains in term funding markets.
Near-term Eurodollar futures rates rose about 20 basis points, but Treasury coupon
yields fell 10 to 20 basis points as investors’ concerns about the macroeconomic
effects of funding market strains intensified. These moves were largely reversed the
next day, following the announcement of the establishment of the Term Auction
Facility and reciprocal currency arrangements with two foreign central banks.
Economic data—particularly the ISM and employment reports for December—came
in softer than expected and prompted sharp reductions in money market futures rates.
Although the release of the minutes of the December meeting elicited only a limited
response in financial markets, interest rates moved down further in response to the
Chairman’s January 10 speech and to speeches by other Federal Reserve officials that
were read as suggesting that signs of broader economic weakness and additional
financial strains would likely require an easier stance of policy. Although investors
had speculated about the possibility of an intermeeting move, the 75 basis point
reduction in the target on January 22 came as a considerable surprise, and rates on
money market futures contracts declined notably on the announcement. On net,
market participants now expect the funds rate to fall to around 2¼ percent by early
2009 (Chart 1). Judging from quotes on federal funds target binary options, investors
place 34 percent odds on a quarter-point cut in the target at the upcoming FOMC
meeting and 65 percent probability on a policy easing of 50 basis points or more. As
1 The effective federal funds rate averaged 4.12 percent over the intermeeting period. The rate was again more volatile than usual. The intraday standard deviation over the period averaged 27 basis points, significantly higher than was typical before August, and the interday standard deviation was likewise elevated.
Class I FOMC - Restricted-Controlled (FR) 2 of 38
Chart 1Interest Rate Developments
2008 20091.75
2.25
2.75
3.25
3.75
4.25
Percent
January 24, 2008December 10, 2007
Expected Federal Funds Rates*
*Estimates from federal funds and Eurodollar futures, with an allowance for term premiums and other adjustments.
Probability Density for Target Funds Rate afterJanuary 30, 2008 FOMC Meeting
2.50 2.75 3.00 3.25 3.50 3.75 4.00 4.25 4.500
10
20
30
40
50
60
70
80
90
100Percent
Target Funds RateNote. Derived on January 24, 2008 from options on federalfunds futures expiring on February 29, 2008.
Recent: January 24, 2008Day Before Last FOMC: December 10, 2007
Implied Distribution of Federal Funds Rate Six Months Ahead*
*Derived from options on Eurodollar futures contracts, with term premium and other adjustments to estimate expectations for the federal funds rate.
2004 2005 2006 20070
1
2
3
4
5
6
7Percent
Ten-YearTwo-Year
Nominal Treasury Yields*
Daily
*Par yields from a smoothed nominal off-the-run Treasury yield curve.
Dec.FOMC
-100
-80
-60
-40
-20
0
20Basis points
1 2 3 Years ahead
5 7 10
Change in Implied One-Year Forward Treasury Ratessince Last FOMC Meeting*
*Forward rates are the one-year rates maturing at the end of the year shown on the horizontal axis that are implied by the smoothed Treasury yield curve.
1.5
2.0
2.5
3.0
3.5
4.0
2004 2005 2006 2007 30
40
50
60
70
80
90
100
110
120
130Percent $/barrel
Next Five Years (left scale)Five-to-Ten Year Forward (left scale)Spot WTI (right scale)
Inflation Compensation and Oil Prices*
Daily
*Estimates based on smoothed nominal and inflation-indexed Treasury yield curves and adjusted for the indexation-lag (carry) effect.
Dec.FOMC
Class I FOMC - Restricted-Controlled (FR) 3 of 38
of earlier this week, respondents to the Desk’s recent survey of primary dealers
assigned around 60 percent probability to a 50 basis point rate cut, and most
respondents anticipated no substantial changes from the January 22 statement. On
balance, market uncertainty about the course of monetary policy over the next year
rose somewhat, and the negative skewness in option-implied distributions of the
federal funds rate six months ahead seemed to have disappeared.
(3) Consistent with the reduction in the federal funds rate target and
expectations of additional substantial policy easing, yields on two-year nominal
Treasury securities fell about 94 basis points, on net, and ten-year nominal Treasury
yields declined about 46 basis points. Yields on ten-year TIPS fell nearly as much as
their nominal counterparts. According to the staff’s term structure models, the
substantial decline in TIPS yields since the December FOMC meeting owed roughly
equally to lower expected real short rates, consistent with the downward revision to
the outlook for the economy, and to a reduction in real term premiums. TIPS-based
inflation compensation at a five-year horizon moved roughly in line with oil prices
and is now 12 basis points lower, on net, than at the time of the December meeting.
Amid volatile trading conditions, five-year-forward inflation compensation five years
ahead rose 23 basis points over the period since the December FOMC meeting, on
balance, including a 10 basis point increase on the day of the rate cut on January 22.
However, according to the desk’s survey of primary dealers, expected CPI inflation
between five and ten years ahead increased only slightly from the December survey
results, and the Michigan survey of households indicates that expected inflation over
the next five to ten years edged down 10 basis points to 3 percent in January. Term
structure models as well as back-of-the-envelope calculations suggest the rise in TIPS-
based inflation compensation owes to modestly higher inflation risk premiums rather
than higher inflation expectations.
Class I FOMC - Restricted-Controlled (FR) 4 of 38
Money Markets
(4) Conditions in short-term funding markets have improved notably since the
December FOMC meeting. Spreads of term federal fund rates and libor over
comparable-maturity OIS rates narrowed somewhat following the announcement and
subsequent implementation of the Term Auction Facility (See box “The Term
Auction Facility and the Federal Funds Market”), and they fell considerably further
after year-end. Financial institutions’ evident ability to raise capital may also have had
beneficial effects on bank funding markets. Conditions in European interbank money
markets also improved noticeably over the intermeeting period, as spreads on both
overnight and term euro and sterling borrowing narrowed substantially. In mid-
December, the European Central Bank, Swiss National Bank, Bank of England, and
Bank of Canada all announced special operations aimed at calming term money
markets as part of a concerted effort with the Federal Reserve. The European Central
Bank and the Swiss National Bank auctioned $20 billion and $4 billion, respectively,
of term funds they obtained in currency swaps with the Federal Reserve. The
European Central Bank also auctioned an unusually large amount of term funds in
euros, while the Bank of England and Bank of Canada auctioned smaller amounts of
funds in sterling and Canadian dollars, respectively. Market participants reported that
the coordinated central bank measures contributed to the improvement in money
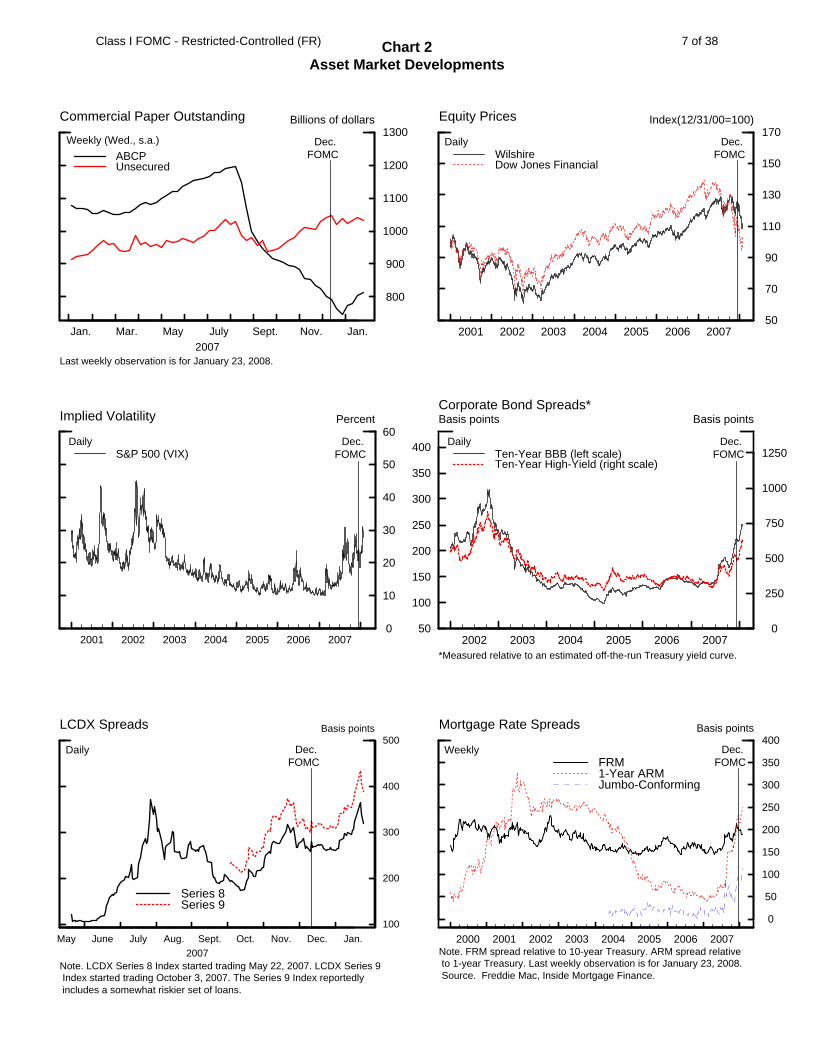
market conditions. In the United States, spreads on asset-backed commercial paper
over AA financial paper have dropped considerably from their very high levels in mid-
to late December. Spreads on lower-rated nonfinancial unsecured paper over AA
nonfinancial paper have also fallen from their year-end highs but remain above the
levels in late October when year-end pressures became apparent. Asset-backed
commercial paper outstanding increased during the first half of January, the first rise
since last summer (Chart 2); the volume of unsecured paper was little changed over
Class I FOMC - Restricted-Controlled (FR) 5 of 38
First Auction Second Auction Third Auction December 17 December 20 January 14
Auction amount $20.0 bn $20.0 bn $30.0 bn Aggregate amount of bids $61.6 bn $57.7 bn $55.5 bn Number of bidders 93 73 56 Number of awarded banks 31 24 42 Bid/cover ratio 3.08 2.88 1.85 Minimum bid rate 4.17% 4.15% 3.88% Stop-out rate 4.65% 4.67% 3.95% Memo: One-month libor on auction date 4.97% 4.90% 4.08%
The Term Auction Facility and the Federal Funds Market
In response to strains in term funding markets, the Federal Reserve established in December a Term Auction Facility (TAF)—a temporary program in which the Federal Reserve auctions funds for fixed terms of approximately one month to depository institutions that are judged to be in generally sound financial condition. The TAF was established in coordination with the arrangement of swap lines to fund similar dollar liquidity facilities at other central banks. Judging from the first three auctions held in December and January, the TAF appears to have largely overcome the main drawback of the primary credit program: the perceived stigma associated with borrowing from the discount window. All of the auctions were oversubscribed, with a substantial number of bidders, ample bid-to-cover ratios, and stop-out rates that were below prevailing term market rates. Funds were awarded to a sizable and diverse group of depository institutions. To maintain the overnight federal funds rate close to the target, the Desk offset the extra provision of reserve balances through the TAF and the swap lines with other central banks by redeeming $56 billion in Treasury bills and by reducing the level of long-term repurchase agreements outstanding by $9 billion.
While it is not possible to isolate the impact of the TAF on financial markets from the effects of other recent market developments and the uneventful turn of the year, market participants attributed some of the narrowing in the spread between libor rates and overnight index swap rates of comparable maturities since mid-December to the TAF auctions and the accompanying auctions of term dollar funding from the European Central Bank and the Swiss National Bank. The TAF may also have contributed to a reduction in volatility in the federal funds market, but, according to market commentary, the passing of the year end without serious disruption was likely at least as important to the stabilization in that market. From the December FOMC meeting through the end of 2007, the intraday standard deviation of the funds rate was 40 basis points, on average; it has fallen to 13 basis points so far this year. An important cause of the volatility in the funds rate late last year—a significant spread between rates paid by foreign banks over those paid by domestic banks and the associated tendency for the funds rate to be firm to the target in the morning and then soften after the close of business in Europe—has moderated significantly, perhaps in part because the TAF and other central bank auctions reduced foreign banks’ concern about their access to liquidity.
*Measured relative to an estimated off-the-run Treasury yield curve.
Dec.FOMC
May June July Aug. Sept. Oct. Nov. Dec. Jan.2007
100
200
300
400
500Basis points
Series 8Series 9
Daily
LCDX Spreads
Note. LCDX Series 8 Index started trading May 22, 2007. LCDX Series 9 Index started trading October 3, 2007. The Series 9 Index reportedly includes a somewhat riskier set of loans.
Dec.FOMC
2000 2001 2002 2003 2004 2005 2006 2007
0
50
100
150
200
250
300
350
400Basis points
FRM1-Year ARMJumbo-Conforming
Mortgage Rate Spreads
Weekly
Note. FRM spread relative to 10-year Treasury. ARM spread relative to 1-year Treasury. Last weekly observation is for January 23, 2008. Source. Freddie Mac, Inside Mortgage Finance.
Dec.FOMC
Class I FOMC - Restricted-Controlled (FR) 7 of 38
the entire period since the December FOMC meeting. The outstanding amount of
European asset-backed commercial paper continued to decline.
Capital Markets
(5) Broad-based U.S. equity price indexes were highly volatile and fell 11
percent over the period since the December FOMC meeting in response to concerns
about global economic outlook and substantial additional write-downs at large
financial institutions. Financial stocks notably underperformed the broad indexes,
although declines were widespread across sectors. The spread between the twelve-
month forward trend earnings-price ratio for S&P 500 firms and a real long-run
Treasury yield—a rough gauge of the equity risk premium—widened further. Option-
implied volatility on the S&P 500 index has moved higher on net since the December
FOMC meeting, at times rising back to near its August peaks. Yields on investment-
grade corporate bonds fell less than those on comparable-maturity Treasury securities
over the period since the last FOMC meeting, while yields on speculative-grade bonds
rose markedly. As a result, spreads of both investment- and speculative-grade bond
yields over comparable-maturity Treasury yields increased to their highest levels in
about five years. The sharp rise in speculative-grade spreads primarily reflects higher
spreads in near-term forward rates, suggesting increased concerns on the part of
investors about corporate credit quality over the next few years. Gross bond issuance
by nonfinancial firms was robust in December but has slowed this month. The
pipeline of leveraged loans awaiting syndication remains substantial, and secondary
market bid prices for liquid leveraged loans declined further from levels already below
those observed in early August. An index of credit default swaps on leveraged
syndicated loans (the LCDX) has risen about 90 basis points, on net, since the
December FOMC meeting. The ratio of municipal bond yields to those on Treasuries
remains elevated, reflecting concerns about the strength of financial guarantors. CDS
Class I FOMC - Restricted-Controlled (FR) 8 of 38
spreads on major financial guarantors have widened sharply since the December
FOMC meeting, spurred by mounting worries about their exposure to subprime
mortgage securities and fears about the possible effects of actual and potential
downgrades by major rating agencies. These spreads narrowed a good bit on January
23 in response to a news article suggesting that New York insurance regulators are
working on a plan to support financial guarantors, but remained very high.
(6) Over the period since the December meeting, interest rates on thirty-year
fixed-rate conforming mortgages and one-year adjustable-rate conforming loans fell
63 and 51 basis points, to 5.48 and 4.99 percent, respectively. Posted offer rates on
thirty-year jumbo mortgages have also decreased since the December FOMC meeting,
but the availability of such credit continued to be tight. Issuance of residential
mortgage-backed securities (RMBS) backed by nonconforming loans was extremely
weak in the fourth quarter. ABX spreads for all tranches continued to widen. In
contrast, issuance of agency MBS backed by conforming mortgages remained robust
and spreads on such securities retreated further from their recent highs as year-end
pressures eased.
Market Functioning Outside of Money Markets
(7) Trading conditions in a number of financial markets were strained at times.
Liquidity in the market for Treasury coupon securities was somewhat impaired in
December, amid concerns about year-end, and again in late January, reflecting flight-
to-quality flows. Spreads between on- and off-the-run ten-year Treasury notes
remained at multi-year highs throughout the period. Bid-asked spreads on both on-
the-run and off-the-run Treasury notes had retreated to near-normal levels after year-
end, but they rose again on January 22 and remain elevated, on net. Treasury bill
yields initially rose after the turn of the year, as market participants reported
significantly improved trading conditions; however, more recently, renewed safe-
Class I FOMC - Restricted-Controlled (FR) 9 of 38
haven flows pushed three-month Treasury bill yields 68 basis points lower, on net.
Similarly, overnight general collateral repo rate continued to trade well below the
overnight federal funds rate for most of the period since the December FOMC
meeting. Lending from the SOMA securities portfolio reached record levels in
December, led by strong demand for Treasury collateral ahead of year-end, and were
again elevated in late January. Several measures of liquidity in corporate markets
showed signs of deterioration before the turn of the year—trading volumes declined
significantly, a proxy for bid-asked spreads on corporate bonds widened, and trades
appeared to have a larger-than-normal impact on prices—but these trends largely
reversed in January. Bid-asked spreads for leveraged syndicated loans have widened a
good bit since December and are now a few basis points above the peaks reached in
August. Judging from the abnormally wide range of quotes submitted by various
dealers for the same reference entities, liquidity and price discovery remain impaired
in CDS markets. The FX swap market also shows signs of improvement, although
trading conditions remained somewhat strained.
Foreign Developments
(8) Foreign financial markets were unsettled over the period since the
December FOMC meeting, reflecting growing concerns about further financial
distress and global spillovers from slower U.S. growth. Late in the period, broad
equity price indexes in major foreign equity markets dropped sharply. Stock prices
rebounded somewhat following the FOMC’s announcement on January 22 of the 75
basis point cut in its federal funds target, but equity markets have remained jittery.
Stock prices in many emerging market economies in Asia, Latin America, and Eastern
Europe—which previously had not been much affected by the turmoil in other
markets—experienced severe declines over this period. Since the December FOMC
meeting, foreign stock prices have fallen on net by amounts that range from 10 to
Class I FOMC - Restricted-Controlled (FR) 10 of 38
nearly 20 percent, with financial stocks leading the way down (Chart 3). Yields on
long-term government securities in major foreign industrial countries declined 15 to
25 basis points, reflecting lower policy expectations, and CDS and EMBI+ spreads on
emerging market sovereign debt widened noticeably, as investors attempted to reduce
risk. The trade-weighted foreign exchange value of the dollar against major currencies
has moved down ¾ percent on balance since the December FOMC meeting.2 The
dollar depreciated more than 4½ percent against the yen and nearly as much against
the Swiss franc, driven in part by the unwinding of carry-trade positions by
increasingly risk-shy investors. The dollar declined slightly on balance against an
index of currencies of our other important trading partners. On January 22, the Bank
of Canada cut its policy rate 25 basis points, citing lower Canadian inflation and a
weaker outlook for the U.S. economy.
Debt and Money
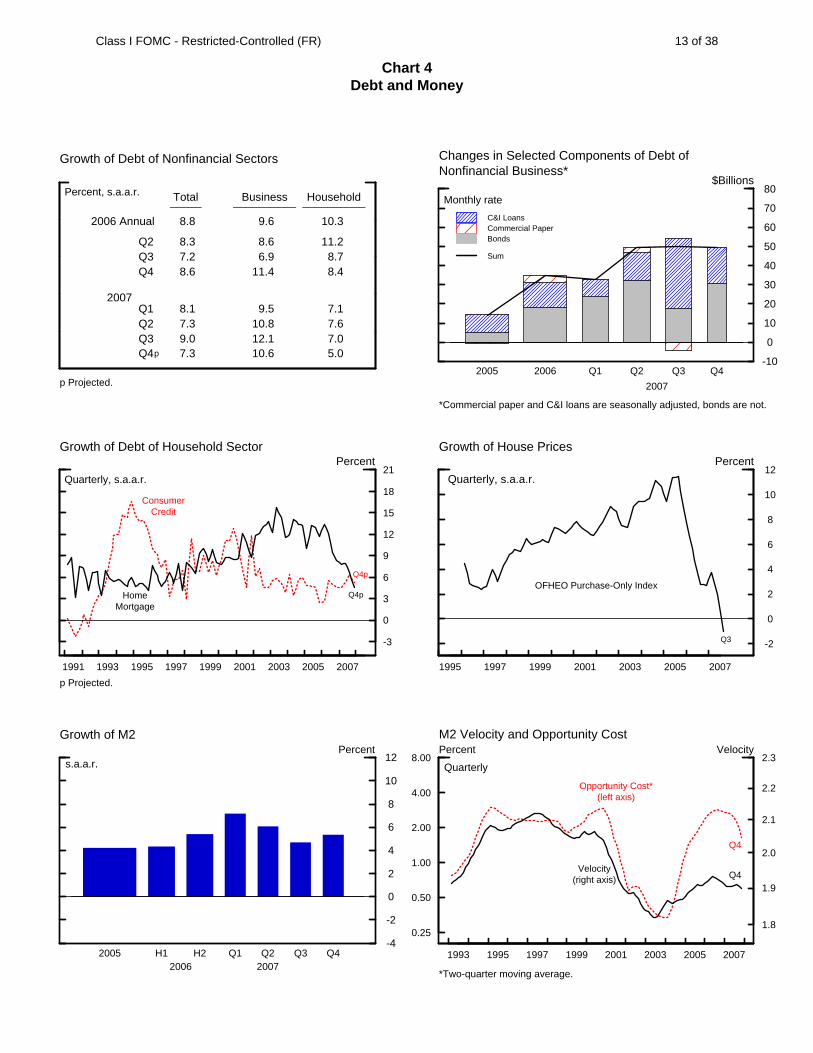
(9) The debt of domestic nonfinancial sectors is estimated to have expanded at
an annual rate of 7¼ percent in the fourth quarter of last year, almost 2 percentage
points less than in the previous quarter (Chart 4). Growth of nonfinancial business
debt decelerated in the fourth quarter from its rapid third-quarter pace, as growth in
C&I loans slowed and despite robust bond issuance. The limited data on financing
activity since year-end suggest that business borrowing has slowed further this month.
In the household sector, home mortgage debt is projected to have decelerated further
in the fourth quarter, reflecting the weakness in home prices, declining home sales,
and tighter credit conditions for some borrowers. Consumer credit continued to
expand at a moderate pace last quarter. Banks indicated on the most recent Senior
Loan Officer Opinion Survey that they had tightened standards and terms on many
2 There were no foreign official purchases or sales of dollars by reporting central banks in industrial countries during the intermeeting period.
Class I FOMC - Restricted-Controlled (FR) 11 of 38
3
3
4
4
5
5
6
Chart 3International Financial Indicators
Note: Vertical lines indicate December 11, 2007. Last daily observations are for January 24, 2008.
2004 2005 2006 2007 90
100
110
120
130
140
150
160
170
180
190
UK (FTSE-350)Euro Area (DJ Euro)Japan (Topix)
Stock Price IndexesIndustrial Countries
Daily
Index(12/31/03=100)
December FOMC
2004 2005 2006 2007 70
100
130
160
190
220
250
280
310
340
370
400
Brazil (Bovespa)Korea (KOSPI)Mexico (Bolsa)
Stock Price IndexesEmerging Market Economies
Daily
Index(12/31/03=100)
December FOMC
.0
.5
.0
.5
.0
.5
.0
2004 2005 2006 20070.0
0.5
1.0
1.5
2.0
2.5
3.0
UK (left scale)Germany (left scale)Japan (right scale)
Ten-Year Government Bond Yields (Nominal)
Daily
Percent
December FOMC
2004 2005 2006 2007 82
84
86
88
90
92
94
96
98
100
102
104
106
108
110
112
BroadMajor CurrenciesOther Important Trading Partners
Nominal Trade-Weighted Dollar Indexes
Daily
Index(12/31/03=100)
December FOMC
Class I FOMC - Restricted-Controlled (FR) 12 of 38
Chart 4Debt and Money
Growth of Debt of Nonfinancial Sectors
Percent, s.a.a.r.
2006 Annual
2007
Q2Q3Q4
Q1Q2Q3Q4p
Total_____
8.8
8.37.28.6
8.17.39.07.3
Business__________
9.6
8.66.9
11.4
9.510.812.110.6
Household__________
10.3
11.28.78.4
7.17.67.05.0
p Projected.
-10
0
10
20
30
40
50
60
70
80
C&I LoansCommercial PaperBonds
Sum
Changes in Selected Components of Debt ofNonfinancial Business*
$Billions
2005 2006 Q1 Q2 Q3 Q4
2007
Monthly rate
*Commercial paper and C&I loans are seasonally adjusted, bonds are not.
1991 1993 1995 1997 1999 2001 2003 2005 2007
-3
0
3
6
9
12
15
18
21
Growth of Debt of Household SectorPercent
Quarterly, s.a.a.r.
p Projected.
Q4p
Q4p
ConsumerCredit
HomeMortgage
1995 1997 1999 2001 2003 2005 2007
-2
0
2
4
6
8
10
12
Growth of House PricesPercent
Quarterly, s.a.a.r.
Q3
OFHEO Purchase-Only Index
-4
-2
0
2
4
6
8
10
12
Growth of M2
s.a.a.r.Percent
2005 H1 H2 Q1 Q2 Q3 Q42006 2007
0.25
0.50
1.00
2.00
4.00
8.00
1993 1995 1997 1999 2001 2003 2005 2007
1.8
1.9
2.0
2.1
2.2
2.3
M2 Velocity and Opportunity CostVelocityPercent
Quarterly
Opportunity Cost*(left axis)
Velocity(right axis)
*Two-quarter moving average.
Q4
Q4
Class I FOMC - Restricted-Controlled (FR) 13 of 38
types of household and business loans and that they expected a further deterioration
in loan quality in 2008.
(10) M2 grew 6 percent at an annual rate in December, boosted primarily by
flows to the relative safety and liquidity of retail money funds.3 Growth in small time
deposits edged down but remained elevated, as several thrift institutions offered
attractive deposit rates to secure funding. A deceleration in liquid deposits amid
subdued economic activity in the fourth quarter as well as a sizable contraction in
currency partially offset the expansion of other components of M2.
3 These data incorporate the results of the annual review of seasonal factors.
Class I FOMC - Restricted-Controlled (FR) 14 of 38
Economic Outlook
(11) The staff has marked down substantially its projection for aggregate
demand relative to aggregate supply since the December Greenbook, in response to
a sharp drop in equity prices, tighter conditions in some credit markets, and
surprisingly weak indicators of real activity. As a consequence, the staff forecast takes
on board the 75 basis point reduction on January 22 and assumes another 50 basis
point cut at this meeting; from that point on, the funds rate is assumed to remain
steady at 3 percent through the end of 2009. Longer-term Treasury yields are
projected to edge up as investors’ expectations about the path of monetary policy—
which currently embed further easing in coming months—gradually converge to the
staff’s assumption. Stock prices are assumed to climb at an annual rate of 13 percent
over the next two years, as the equity premium declines toward more normal levels
in response to the gradual waning of macroeconomic risks. The real foreign exchange
value of the dollar is assumed to depreciate about 2½ percent annually in 2008 and
2009. The price of crude oil is little revised from the December Greenbook, and still
is expected to decline gradually. The staff forecast assumes that the adoption of
a fiscal stimulus package—comprising individual income tax rebates and a bonus
depreciation allowance for investment in 2008—will boost growth this year but
subtract from it next year, leaving the level of GDP at the end of 2009 only a bit
higher than in the absence of the assumed fiscal package. Nonetheless, with a leveling
off of residential investment and a gradual easing of credit conditions, the pace of real
GDP growth is projected to pick up from about 1½ percent this year to around
2¼ percent in 2009. The unemployment rate is projected to rise gradually, reaching
5¼ percent in 2009, about ½ percentage point above the staff’s estimate of the
NAIRU. Both the level and the growth rate of potential output, in history and going
forward, have been revised upward since December, causing the output gap to show
more slack than in December. While recent monthly readings on inflation have been
Class I FOMC - Restricted-Controlled (FR) 15 of 38
elevated, the public’s expectations of future inflation appear to have remained
reasonably well contained. With oil prices assumed to edge down and slack in labor
and product markets rising, total PCE inflation is projected to decline from
2¼ percent in 2008 to about 1¾ percent in 2009, and core PCE inflation edges down
from just above 2 percent this year to just below 2 percent next year.
(12) The staff’s forecast has been extended beyond 2009 using the FRB/US
model with adjustments to ensure consistency with the staff’s assessment of
longer-run trends. The extended forecast embeds several key assumptions: Monetary
policy aims to stabilize core PCE inflation, in the long run, at a level of 1¾ percent
(the midpoint of the range of FOMC participants’ October projections for the rate of
inflation in 2010); trend multifactor productivity growth slows gradually towards
an annual rate of 1 percent; the real price of energy remains approximately flat;
the real value of the dollar depreciates steadily at about 1¼ percent per year; and fiscal
policy is essentially neutral. The stance of monetary policy remains accommodative,
with the federal funds rate staying at 3 percent through 2010, before moving back up
into the neighborhood of 4 percent. As a result, the unemployment rate gradually
declines to 4¾ percent—the staff’s assessment of the NAIRU—by 2012, while PCE
inflation converges to 1¾ percent. The real federal funds rate increases from about
1 percent in 2008 to about 2¼ percent by the end of 2012.
Monetary Policy Strategies
(13) As indicated in Chart 5, the Greenbook-consistent measure of short-run
r*—the value that would close the output gap over the next twelve quarters—now
stands at 0.8 percent, 1½ percentage points lower than in the December Bluebook
and about 60 basis points below the current value of the real federal funds rate.
The downward revision reflects the drop in equity prices, the tightening of credit
markets, and the receipt of weaker-than-expected economic data since early
Class I FOMC - Restricted-Controlled (FR) 16 of 38
Note: Appendix A provides background information regarding the construction of these measures and confidence intervals.
Short-Run Estimates with Confidence Intervals
Actual real federal funds rateRange of model-based estimates70 Percent confidence interval90 Percent confidence intervalGreenbook-consistent measure
Short-Run and Medium-Run Measures
Current Estimate Previous Bluebook
Short-Run Measures
Single-equation model (2.3 (2.5
Small structural model (0.7 (1.7
Large model (FRB/US) (0.9 (1.6
Confidence intervals for three model-based estimates
70 percent confidence interval -0.3 - 2.9
90 percent confidence interval -1.2 - 4.0
Greenbook-consistent measure (0.8 (2.2
Medium-Run Measures
Single-equation model (2.3 (2.3
Small structural model (1.9 (1.8
Confidence intervals for two model-based estimates
70 percent confidence interval (1.2 - 3.0
90 percent confidence interval (0.6 - 3.8
TIPS-based factor model (2.0 2.0
Memo
Actual real federal funds rate (1.4 (2.6
Class I FOMC - Restricted-Controlled (FR) 17 of 38
December, as well as the staff’s reassessment of the supply-side dimensions of
the forecast. Such factors, most importantly the decline in equity prices since
the December Greenbook, also induced sharp declines in the estimates of short-run
r* obtained from the small structural model and the FRB/US model. These two
estimates are now virtually identical to the Greenbook-consistent measure. In
contrast, the estimate obtained from the single equation model has been marked
down much less—from 2½ percent to about 2¼ percent—because this measure
depends on current and lagged values of the output gap but not on financial
conditions or other leading indicators of aggregate demand.
(14) Chart 6 depicts FRB/US optimal control simulations in which policymakers
place equal weights on keeping core PCE inflation close to a specified goal, on
keeping unemployment close to the long-run NAIRU, and on avoiding changes in
the nominal federal funds rate.4 For an inflation goal of 1½ percent (the left-hand set
of charts), the optimal control simulation prescribes a nominal federal funds rate that
declines slowly to near 3 percent over the next three years or so and then rises
modestly to about 3½ percent by 2012. With an inflation goal of 2 percent (the right-
hand set of charts), the optimal funds rate falls more sharply to below 2½ percent by
the end of next year before rising to about 4 percent by 2012. Under either inflation
goal, these prescriptions are substantially lower than those shown in the December
Bluebook, largely reflecting the weaker outlook for aggregate demand relative to
aggregate supply in the current forecast. The unemployment rates over the next
several years are noticeably higher than in the previous Bluebook. The trajectories for
core inflation for this year are above those shown in December but roughly
unchanged thereafter. 4 In these simulations, policymakers are assumed to have a distaste for changing the current-quarter federal funds rate from its previous-quarter level; this inertia is the primary reason why the optimal policy path under either inflation goal prescribes a rate that remains above 4 percent in the current quarter—close to its 2007Q4 average of 4.5 percent—and declines only gradually over subsequent quarters.
Class I FOMC - Restricted-Controlled (FR) 18 of 38
Chart 6
Optimal Policy Under Alternative Inflation Goals
2008 2009 2010 2011 20121.0
1.5
2.0
2.5
3.0
3.5
4.0
4.5
5.0
1.0
1.5
2.0
2.5
3.0
3.5
4.0
4.5
5.0Percent
1½ Percent Inflation GoalFederal funds rate
Current BluebookDecember Bluebook
2008 2009 2010 2011 20124.0
4.5
5.0
5.5
6.0
4.0
4.5
5.0
5.5
6.0Percent
Civilian unemployment rate
2008 2009 2010 2011 20121.50
1.75
2.00
2.25
502.
1.50
1.75
2.00
2.25
2.50Percent
Core PCE inflationFour-quarter average
2008 2009 2010 2011 20121.0
1.5
2.0
2.5
3.0
3.5
4.0
4.5
5.0
1.0
1.5
2.0
2.5
3.0
3.5
4.0
4.5
5.0Percent
2 Percent Inflation Goal
Current BluebookDecember Bluebook
2008 2009 2010 2011 20124.0
4.5
5.0
5.5
6.0
4.0
4.5
5.0
5.5
6.0Percent
2008 2009 2010 2011 20121.50
1.75
2.00
2.25
2.50
1.50
1.75
2.00
2.25
2.50Percent
Four-quarter average
Class I FOMC - Restricted-Controlled (FR) 19 of 38
(15) As shown in Chart 7, the outcome-based monetary policy rule (the left
panel) prescribes a funds rate path that declines to 3¼ percent in 2010; on average,
this trajectory is more than a percentage point lower than in the December Bluebook.
Financial market participants anticipate an even steeper downward slope to the path
of policy in coming quarters, with the funds rate declining to 2 percent by the end
of this year; indeed, forward contracts indicate that the funds rate is now expected
to remain below 4 percent through the end of 2012 (the right panel). The confidence
intervals obtained from stochastic simulations of the FRB/US model and from
options on interest rate caps each indicate a significant probability that the funds rate
falls below 2 percent within the next few quarters and is below 2 percent through
the end of 2012. The near-term prescriptions from the Taylor (1993) rule are higher
than in December because of recent elevated readings on core inflation, while those
from the Taylor (1999) rule are more sensitive to aggregate demand and hence
somewhat lower than in the previous Bluebook.
Class I FOMC - Restricted-Controlled (FR) 20 of 38
Chart 7
The Policy Outlook in an Uncertain Environment
2008 2009 2010 2011 20120
1
2
3
4
5
6
7
8
9
10
11
0
1
2
3
4
5
6
7
8
9
10
11Percent
Note: Appendix B provides background information regarding the specification of each rule and the methodology used inconstructing confidence intervals and near-term prescriptions.
FRB/US Model Simulations ofEstimated Outcome-Based Rule
Class I FOMC - Restricted-Controlled (FR) 21 of 38
Short-Run Policy Alternatives
(16) This Bluebook presents four policy alternatives for the Committee’s
consideration, summarized in Table 1. The text shown in red indicates the changes
from the January 22 statement, which appears along with the December 11
statement on the page following the table. Alternative A cuts the federal funds
rate target by 75 basis points to 2¾ percent, Alternative B cuts the target 50 basis
points to 3 percent, Alternative C cuts the target 25 basis points to 3¼ percent,
and Alternative D leaves the target unchanged at 3½ percent. For each of the four
alternatives, the rationale paragraph refers to considerable stress in financial markets,
tightening of credit conditions, and the deepening of the housing contraction;
the three easing alternatives also mention the recent softening in labor markets.
Each alternative states that policymakers expect inflation to moderate this year
while emphasizing the need for careful monitoring of inflation developments.
All four alternatives note that the current stance of policy should help promote
moderate growth over time; Alternatives A and B also indicate that these policy
actions should help mitigate the risks to economic activity. Alternative A states
that downside risks “may well remain” and that incoming information will determine
“whether further action is needed to address those risks.” Alternative B states
that “downside risks to growth remain” whereas Alternatives C and D reiterate the
January 22 assessment that “appreciable” downside risks remain; all three of these
alternatives indicate—as in the January 22 statement—that policymakers “will act
in a timely manner as needed to address those risks.” As usual, the Committee could
formulate its statement using language from more than one alternative.
(17) If incoming information in recent weeks has led policymakers to mark
down their assessment of the modal outlook for aggregate demand relative to
aggregate supply by an amount similar to that of the staff, then the Committee may
prefer to reduce the target funds rate by 50 basis points at this meeting, as in
Class I FOMC - Restricted-Controlled (FR) 22 of 38
Table 1: Alternative Language for the January 30, 2008 FOMC Announcement
Alternative A Alternative B Alternative C Alternative D
Policy Decision
1. The Federal Open Market Committee decided today to lower its target for the federal funds rate 75 basis points to 2-3/4 percent.
The Federal Open Market Committee decided today to lower its target for the federal funds rate 50 basis points to 3 percent.
The Federal Open Market Committee decided today to lower its target for the federal funds rate 25 basis points to 3-1/4 percent.
The Federal Open Market Committee decided today to keep its target for the federal funds rate at 3-1/2 percent.
2. Financial markets remain under considerable stress, and credit has tightened further for some businesses and households. Moreover, recent information indicates a deepening of the housing contraction as well as some softening in labor markets.
Financial markets remain under considerable stress, and credit has tightened further for some businesses and households. Moreover, recent information indicates a deepening of the housing contraction as well as some softening in labor markets.
Financial markets remain under considerable stress, and credit has tightened further for some businesses and households. Moreover, recent information indicates a deepening of the housing contraction as well as some softening in labor markets.
Financial markets remain under considerable stress, and the tightening of credit and the deepening of the housing contraction could weigh further on economic growth. However, recent policy actions should promote moderate growth over time.
Rationale
3. The Committee expects inflation to moderate in coming quarters, reflecting well-anchored inflation expectations, a projected leveling out of energy prices, and easing pressures on resource utilization. However, further increases in energy and commodity prices, as well as other factors, could put upward pressure on inflation. Therefore, it will be necessary to continue to monitor inflation developments carefully.
The Committee expects inflation to moderate in coming quarters, but it will be necessary to continue to monitor inflation developments carefully.
The Committee expects inflation to moderate in coming quarters. However, upward pressure on inflation could result from several factors, including further increases in energy, commodity, and other import prices. Therefore, it will be necessary to continue to monitor inflation developments carefully.
The Committee expects inflation to moderate in coming quarters. However, upward pressure on inflation could result from several factors, including further increases in energy, commodity, and other import prices. Therefore, it will be necessary to continue to monitor inflation developments carefully.
Assessment of Risk
4. Today’s policy action, combined with those taken earlier, should help to promote moderate growth over time and to mitigate the risks to economic activity. However, downside risks to growth may well remain. The Committee will continue to assess the effects of financial and other developments on economic prospects to determine whether further action is needed to address those risks.
Today’s policy action, combined with those taken earlier, should help to promote moderate growth over time and to mitigate the risks to economic activity. However, downside risks to growth remain. The Committee will continue to assess the effects of financial and other developments on economic prospects and will act in a timely manner as needed to address those risks.
Today’s policy action, combined with those taken earlier, should help promote moderate growth over time. However, appreciable downside risks to growth remain. The Committee will continue to assess the effects of financial and other developments on economic prospects and will act in a timely manner as needed to address those risks.
Appreciable downside risks to growth remain. The Committee will continue to assess the effects of financial and other developments on economic prospects and will act in a timely manner as needed to address those risks.
Class I FOMC - Restricted-Controlled (FR) 23 of 38
January 22, 2008 Statement
1. The Federal Open Market Committee has decided to lower its target for the federal funds rate 75 basis points to 3-1/2 percent.
2. The Committee took this action in view of a weakening of the economic outlook and increasing downside risks to growth. While strains in short-term funding markets have eased somewhat, broader financial market conditions have continued to deteriorate and credit has tightened further for some businesses and households. Moreover, incoming information indicates a deepening of the housing contraction as well as some softening in labor markets.
3. The Committee expects inflation to moderate in coming quarters, but it will be necessary to continue to monitor inflation developments carefully.
4. Appreciable downside risks to growth remain. The Committee will continue to assess the effects of financial and other developments on economic prospects and will act in a timely manner as needed to address those risks.
December 11, 2007 Statement
1. The Federal Open Market Committee decided today to lower its target for the federal funds rate 25 basis points to 4-1/4 percent.
2. Incoming information suggests that economic growth is slowing, reflecting the intensification of the housing correction and some softening in business and consumer spending. Moreover, strains in financial markets have increased in recent weeks. Today’s action, combined with the policy actions taken earlier, should help promote moderate growth over time.
3. Readings on core inflation have improved modestly this year, but elevated energy and commodity prices, among other factors, may put upward pressure on inflation. In this context, the Committee judges that some inflation risks remain, and it will continue to monitor inflation developments carefully.
4. Recent developments, including the deterioration in financial market conditions, have increased the uncertainty surrounding the outlook for economic growth and inflation. The Committee will continue to assess the effects of financial and other developments on economic prospects and will act as needed to foster price stability and sustainable economic growth.
Class I FOMC - Restricted-Controlled (FR) 24 of 38
Alternative B. The staff forecast’s assumes that the funds rate is cut to 3 percent
at this meeting and then maintained at that rate through 2009; with that stance of
policy, the unemployment rate remains about ½ percentage point above the staff’s
estimate of the NAIRU while core inflation edges just below 2 percent at the end of
next year. Members might consider this combination of outcomes to be about the
best feasible under current circumstances, reflecting the extent to which recent data
have pointed towards a noticeable worsening of the short-run tradeoff between
economic activity and inflation. Even if Committee members are somewhat more
optimistic than the staff regarding the modal outlook for economic activity, they may
view this policy action as appropriate for mitigating the downside risks to growth
that were emphasized in the January 22 FOMC statement. Indeed, since investors’
uncertainty about the economic outlook is apparently contributing to elevated credit
spreads and dampened consumer and business spending, a substantial easing move
at this meeting could bolster confidence that policymakers will act as needed to foster
sustained growth and reduce the likelihood of adverse macroeconomic developments
such as the Greenbook’s “Recession” scenario. However, policymakers may prefer
at this stage not to take out further insurance by easing more than 50 basis points,
given the possibility that such a move could induce an upward shift in the distribution
of inflation outcomes over coming quarters, as illustrated by the “Gradual Reversal”
scenario in the box on “Risk Management Strategies.” Nonetheless, by explicitly
noting that downside risks remain, the Committee would suggest the possibility that
substantial further easing could be needed in response to incoming information.
(18) The statement under Alternative B largely reiterates the rationale portion
of the January 22 statement, including references to “considerable stress” in financial
markets, tightening of credit conditions, deepening of the housing contraction, and
some softening of labor markets, as well as restating the Committee’s assessment of
the prospects for inflation. The final paragraph of the statement indicates that
Class I FOMC - Restricted-Controlled (FR) 25 of 38
2008 2009 2010 2011 2012-3
-2
-1
0
1
2
3
4
5
-3
-2
-1
0
1
2
3
4
5Percent
Federal funds rate
Recession Scenario
Taylor RuleFull PreemptionRisk Management
2008 2009 2010 2011 20124.00
4.25
4.50
4.75
5.00
5.25
5.50
5.75
6.00
6.25
6.50
4.00
4.25
4.50
4.75
5.00
5.25
5.50
5.75
6.00
6.25
6.50Percent
Civilian unemployment rate
2008 2009 2010 2011 20121.25
1.50
1.75
2.00
2.25
2.50
2.75
3.00
1.25
1.50
1.75
2.00
2.25
2.50
2.75
3.00Percent
Core PCE inflation
2008 2009 2010 2011 20120
1
2
3
4
5
6
7
0
1
2
3
4
5
6
7Percent
Federal funds rate
Benefits ofRisk Management
Risk ManagementOutcome-Based Rule
2008 2009 2010 2011 20124.50
4.75
5.00
5.25
5.50
5.75
6.00
6.25
4.50
4.75
5.00
5.25
5.50
5.75
6.00
6.25Percent
Civilian unemployment rate
2008 2009 2010 2011 20121.25
1.50
1.75
2.00
2.25
2.50
2.75
1.25
1.50
1.75
2.00
2.25
2.50
2.75Percent
Core PCE inflationFour-quarter moving average
Risk Management Strategies
Simple policy rules can serve as useful benchmarks for monetary policy. However, such rules are generally specified in terms of the modal forecast and hence abstract from risk management considerations. In this box, we gauge the benefits and costs of alternative policy strategies using the version of the FRB/US model in which expectations of the private sector are formed based on past economic data. As a point of reference, suppose that the Greenbook outlook is the best feasible under current circumstances, at least in the absence of uncertainty.
Now consider the “Recession” scenario presented in the Greenbook alternative simulations. When monetary policy is determined by the Bluebook’s Outcome-Based Rule (dotted lines), the federal funds rate declines gradually in response to incoming data, reaching a trough of about ¾ percent in late 2009 before returning to the Greenbook baseline a few years later. With this policy, the unemployment rate rises a bit above 6 percent next year and takes about five years to return to the NAIRU, while core PCE inflation falls well below the assumed long-run inflation goal of 1¾ percent.
If policymakers could instantly be sure that such a recession was already in train, they might well cut the funds rate target immediately to a rate below 1 percent in order to reduce the severity of the downturn. In reality, of course, economic turning points are notoriously difficult to predict or even to identify contemporaneously. Thus, policymakers might prefer to take out some insurance by easing the stance of policy even before the onset of recession was fully evident.
Such an approach is illustrated by the Risk Management path (solid lines), in which the funds rate target is reduced to 1½ percent for two quarters and thereafter follows the prescriptions of the outcome-based rule. This policy has visible effects in stabilizing economic activity and inflation: The unemployment rate at the peak of the recession is about ¼ percentage point lower than in the absence of insurance, and the inflation rate stays noticeably closer to the assumed long-run inflation goal of 1¾ percent.
Class I FOMC - Restricted-Controlled (FR) 26 of 38
Risk Management Strategies (continued)
2008 2009 2010 2011 20120
1
2
3
4
5
6
7
0
1
2
3
4
5
6
7Percent
Federal funds rate
Costs ofRisk Management
Gradual ReversalPrompt Reversal
Greenbook Baseline
2008 2009 2010 2011 20124.50
4.75
5.00
5.25
5.50
5.75
6.00
6.25
4.50
4.75
5.00
5.25
5.50
5.75
6.00
6.25Percent
Civilian unemployment rate
2008 2009 2010 2011 20121.25
1.50
1.75
2.00
2.25
2.50
2.75
1.25
1.50
1.75
2.00
2.25
2.50
2.75Percent
Core PCE inflationFour-quarter moving average
It is also important to gauge the costs that would be incurred in following such a risk management strategy if in fact no recession occurs. For this purpose, suppose that economic conditions unfold as in the Greenbook baseline (dotted lines) but that policymakers have taken out some insurance against the risk of recession by lowering the target funds rate to 1½ percent for two quarters.
In the Prompt Reversal case (solid lines), the strength of economic activity is assumed to be recognized quickly and the policy insurance is then removed; indeed, policy is tightened somewhat further to offset the effects of the initial policy stimulus, and thereafter follows the prescriptions of the outcome-based rule. In this case, the funds rate target rises almost a percentage point above the Greenbook baseline path by the end of this year. With this policy path, core inflation remains very close to the Greenbook baseline while the unemployment rate only deviates temporarily.
In contrast, in the case of Gradual Reversal (dashed lines), the strength of economic activity is assumed to become evident only over a longer period, and hence the policy insurance is removed over the course of a year rather than in a single quarter; that is, after the first two quarters, the funds rate is adjusted according to the empirical outcome-based rule, which responds only gradually to incoming data. This path of policy generates persistent deviations of unemployment and inflation from the Greenbook baseline; even at the end of 2012, core inflation remains nearly a quarter point above the assumed long-run inflation goal of 1¾ percent.
Class I FOMC - Restricted-Controlled (FR) 27 of 38
this policy action, combined with those taken earlier, “should help to promote
moderate growth over time and mitigate the risks to economic activity” but notes
that “downside risks to growth remain” and emphasizes—as in the January 22
statement—that the Committee “will act in a timely manner as needed to address
those risks.”
(19) Alternative B would likely be seen by market participants as broadly
consistent with their current expectations for the funds rate, because a 50 basis point
easing of the target funds rate at this meeting appears to be their modal expectation
and because the risk assessment would probably be read as indicating a substantial
probability of further easing. Since investors assign most of the remaining probability
to a smaller easing, the adoption of this alternative might cause a modest decrease in
interest rates, a rally in equity prices, and perhaps some depreciation of the foreign
exchange value of the dollar.
(20) If policymakers would prefer to move more aggressively to promote growth
and mitigate downside risks, then they might choose to reduce the funds rate target
by 75 basis points at this meeting, as in Alternative A. Even after the funds rate cut
on January 22, the real federal funds rate exceeds the Greenbook-consistent estimate
of short-run r* by about 60 basis points; thus, this degree of easing would be desirable
if policymakers share the staff’s outlook but would prefer to bring the unemployment
rate back to the NAIRU more quickly than in that outlook, an approach that might
leave inflation close to 2 percent at the end of the decade. Following the January 22
move with another aggressive easing at this meeting might also be attractive from a
risk management point of view—that is, Committee members may see benefits in
moving more than they would perceive as needed merely to offset the weakening in
the modal outlook. With the housing contraction steepening and financial stresses
continuing to intensify, policymakers may be particularly concerned about reducing
the likelihood of a nonlinear feedback cycle in which deteriorating macroeconomic
Class I FOMC - Restricted-Controlled (FR) 28 of 38
conditions generate further strains in financial markets and augment pressures on
banks’ balance sheets, further constricting the supply of credit and hence leading to a
fairly deep and long-lasting recession. This policy approach might be particularly
appealing if members anticipated that the Committee would be equally flexible and
decisive in reversing the course of policy once downside risks to growth start to
wane—as in the “Prompt Reversal” scenario in the box on “Risk Management
Strategies”—or upside risks to inflation start to loom larger. Members might also
be attracted to this alternative if they believe that a larger easing move at this meeting
would diminish the probability that another rate cut would be needed over the
subsequent intermeeting period.
(21) The first portion of the rationale for Alternative A is identical to that of
Alternative B, but this alternative elaborates further about the prospects for inflation,
pointing out that the projected moderation of inflation reflects “well-anchored
inflation expectations, a projected leveling out of energy prices, and easing pressures
on resource utilization,” and noting that “further increases in energy and commodity
prices, as well as other factors, could put upward pressure on inflation.” Of course,
the Committee could choose simply to repeat the inflation rationale given in the
January 22 statement. As in Alternative B, the risk assessment states that the stance
of policy should help promote moderate growth and mitigate the downside risks to
economic activity. In light of the stronger policy action, however, this alternative
is somewhat less definitive regarding the magnitude of downside risks to growth,
indicating that such risks “may well remain” and that the Committee will assess
incoming information to determine “whether further action is needed to address
those risks.”
(22) Although market participants appear to see only about one-tenth odds
that the funds rate target will be reduced by 75 basis points at this meeting, the risk
assessment in this alternative would likely be read as indicating a somewhat lower
Class I FOMC - Restricted-Controlled (FR) 29 of 38
probability of further easing over the next few months. Thus, this policy action might
be viewed largely as a timing surprise, especially since futures contracts indicate that
investors expect the funds rate to decline to about 2¾ percent by the March FOMC
meeting. Consequently, the impact on Treasury coupon yields could be rather limited.
Of course, this policy move might bolster market confidence and help alleviate
perceptions of tail risks to the macroeconomy, causing equity prices to rise and credit
spreads on corporate debt to narrow. However, this alternative could also heighten
concerns about the longer-term inflation outlook, in which case forward inflation
compensation might rise noticeably further and the foreign exchange value of the
dollar could depreciate.
(23) If members are concerned that the stance of policy remains somewhat
restrictive but would prefer a more incremental approach in responding to incoming
information, then the Committee could choose to reduce the funds rate target by
25 basis points at this meeting, as in Alternative C. This alternative might be
viewed as most consistent with the typical pattern of gradual funds rate adjustment
in response to changes in resource utilization and core inflation. Such gradualism
reflects the usual pace of incoming information regarding the appropriate policy
stance and reduces the odds of sudden reversals in the path of policy. Members
may also be concerned that more substantial policy accommodation could spark
an increase in longer-term inflation expectations, as in the Greenbook’s “Unanchored
Inflation Expectations” scenario. Moreover, given the challenges in monitoring
underlying inflation expectations, such a development might not become apparent
very quickly and could then be quite costly to reverse.
(24) The first portion of the rationale for Alternative C is identical to that of
Alternatives A and B, but this alternative notes that upward pressure on inflation
could result from “further increases in energy, commodity, and other import prices.”
Moreover, in contrast to those two alternatives, the risk assessment in Alternative C
Class I FOMC - Restricted-Controlled (FR) 30 of 38
makes no reference to mitigating the risks to economic activity. The remainder of
the risk assessment paragraph for this alternative is the same as in the January 22
FOMC statement, reiterating that “appreciable downside risks to growth remain”
and that the Committee “will act in a timely manner as needed to address those risks.”
(25) Market participants would be somewhat surprised by a 25 basis point
reduction in the target federal funds rate at this meeting, because the Desk’s survey
and market data suggest that market participants are placing only about one-third
odds on a 25 basis point easing, with virtually all of the remaining probability
assigned to larger moves of 50 or 75 basis points. To be sure, the reference in the
risk assessment to acting in a “timely manner” may be read as pointing to a possible
intermeeting easing of policy. But, given the smaller-than-anticipated policy action
at this meeting, financial markets might well conclude that further easing moves
would be incremental. Thus, Alternative C would probably induce a rise in short-
term interest rates; however, intermediate-term yields might rise less or perhaps even
decline if investors concluded that a sluggish near-term pace of policy adjustment
implied that even more easing would be needed down the road. Equity prices would
likely fall while credit spreads on corporate debt would widen. At the same time,
five-to-ten-year forward TIPS-based inflation compensation might retrace some of
its recent increase, and the foreign exchange value of the dollar could appreciate a bit.
Moreover, given the highly skittish attitudes of investors and relatively illiquid trading
conditions in some markets, policy surprises might well generate unusually large
reactions in financial markets.
(26) In view of policy actions to date, policymakers might prefer to wait
for additional economic and financial information before taking any further policy
action, as in Alternative D. Some policymakers may judge that the current softness
in the economy is likely to be transitory and that ongoing financial developments are
likely to have less effect on aggregate demand than anticipated by the staff and other
Class I FOMC - Restricted-Controlled (FR) 31 of 38
forecasters. In addition, monetary policy has already been eased considerably, and
significant fiscal stimulus seems likely to be enacted, perhaps reducing the need for
further monetary accommodation. Moreover, policymakers might be concerned
about the extent to which recent elevated levels of inflation and forward inflation
compensation might be pointing to a higher trajectory of prices going forward.
This approach might also be appealing to policymakers who prefer a more distinct
downward tilt of the trajectory for inflation over the next few years than in the staff
forecast, as in the optimal-control simulation with an inflation goal of 1½ percent.
(27) The statement under Alternative D reiterates several elements of the
rationale portion of the January 22 statement—including references to considerable
stress in financial markets, tightened credit conditions, and deepening of the
housing contraction—but does not cite recent developments in labor markets.
Because this alternative leaves the stance of policy unchanged, the statement simply
indicates that “recent policy actions should promote moderate growth over time.”
This alternative reaffirms the Committee’s expectation that inflation will moderate
in coming quarters, but adds the same explanation as in Alternative C regarding
the factors that could put upward pressure on inflation. Moreover, with no change
in policy and few economic data releases on the calendar between January 22
and January 30, the assessment of risks in Alternative D is identical to that of
the January 22 statement.
(28) Alternative D could surprise and confuse market participants, who
are virtually certain that the funds rate target will be cut at least 25 basis points
at this meeting. The absence of any policy action would be particularly difficult to
understand in light of the January 22 FOMC statement, which noted “appreciable
downside risks to growth” and emphasized that the Committee “will act in a timely
manner as needed to address those risks.” While shorter-term interest rates
would rise noticeably, investors would probably become more concerned about the
Class I FOMC - Restricted-Controlled (FR) 32 of 38
economic outlook, leading to a further drop in longer-term Treasury yields, a marked
widening of credit spreads on corporate debt, and sharp declines in equity prices.
Money and Debt Forecasts
(29) Under the Greenbook projection, M2 is expected to grow at about a
5¼ percent rate in the current quarter, about a quarter point faster than the growth
rate forecasted in December. This pace would significantly exceed the 3¼ percent
forecast for nominal GDP growth this quarter. The decline in velocity reflects
the boost to money demand from the sharp decline in the opportunity cost resulting
from monetary policy easing as well as the unusually strong flows into money market
mutual funds that have likely been prompted by the financial turmoil. For 2008
as a whole, M2 is forecast to expand at a 6 percent annual rate, considerably above
the 3¾ percent expansion projected for nominal GDP. With opportunity cost
leveling off later this year and financial markets presumably becoming less volatile,
M2 is projected to expand at a 4¼ percent rate in 2009, in line with growth in
nominal GDP.
(30) After advancing at an estimated 8¼ percent pace in 2007, domestic
nonfinancial sector debt is projected to slow to a 5 percent rate this year and to
moderate further to an average rate of 4¾ percent in 2009. The deceleration reflects
a broad-based slowdown in borrowing by households, nonfinancial businesses, and
state and local governments. Household debt is projected to increase only modestly
over the forecast period, restrained by the dampening effects on mortgage borrowing
of falling house prices and weak home sales. In addition, sluggish gains in household
spending on durable goods and tighter standards and terms on consumer loans are
expected to weigh on growth in consumer credit. Business borrowing is expected to
slow sharply as M&A and share repurchase activity abates significantly. The
expansion of debt in the state and local government sector is also projected to
Class I FOMC - Restricted-Controlled (FR) 33 of 38
75 bp Easing50 bp Easing/
Greenbook Forecast*25 bp Easing No Change
Monthly Growth Rates
Jul-07 4.0 4.0 4.0 4.0
Aug-07 8.2 8.2 8.2 8.2
Sep-07 4.9 4.9 4.9 4.9
Oct-07 4.4 4.4 4.4 4.4
Nov-07 5.4 5.4 5.4 5.4
Dec-07 5.9 5.9 5.9 5.9
Jan-08 4.3 4.3 4.3 4.3
Feb-08 5.9 5.5 5.1 4.7
Mar-08 6.8 6.0 5.2 4.4
Apr-08 7.6 6.8 6.0 5.2
May-08 6.4 5.7 5.0 4.3
Jun-08 7.0 6.5 6.0 5.5
Quarterly Growth Rates
2007 Q1 7.1 7.1 7.1 7.1
2007 Q2 6.1 6.1 6.1 6.1
2007 Q3 4.7 4.7 4.7 4.7
2007 Q4 5.3 5.3 5.3 5.3
2008 Q1 5.4 5.3 5.1 4.9
2008 Q2 6.9 6.2 5.5 4.8
Annual Growth Rates
2007 5.9 5.9 5.9 5.9
2008 6.5 6.1 5.7 5.3
2009 4.2 4.2 4.2 4.2
Growth From To
Dec-07 Mar-08 5.7 5.3 4.9 4.5
Dec-07 Jun-08 6.4 5.9 5.3 4.8
2007 Q4 Mar-08 5.7 5.4 5.1 4.8
2007 Q4 Jun-08 6.3 5.9 5.4 4.9
* This forecast is consistent with nominal GDP and interest rates in the Greenbook forecast.
Table 2
Alternative Growth Rates for M2
(percent, annual rate)
Class I FOMC - Restricted-Controlled (FR) 34 of 38
decelerate considerably, reflecting an anticipated drop in issuance for both long-term
capital projects and advance refundings. The difficulties of major bond insurers are
expected to restrain municipal bond issuance somewhat in 2008. By contrast, the
growth of federal debt is expected to pick up in 2008, boosted in part by borrowing to
fund the proposed economic stimulus package, and then to hold about steady in 2009.
Class I FOMC - Restricted-Controlled (FR) 35 of 38
Directive
(31) Draft language for the directive is provided below.
Directive Wording The Federal Open Market Committee seeks monetary and financial
conditions that will foster price stability and promote sustainable growth
in output. To further its long-run objectives, the Committee in the
immediate future seeks conditions in reserve markets consistent with
MAINTAINING/INCREASING/reducing the federal funds rate
AT/to an average of around ________ 3 ½percent.
Class I FOMC - Restricted-Controlled (FR) 36 of 38
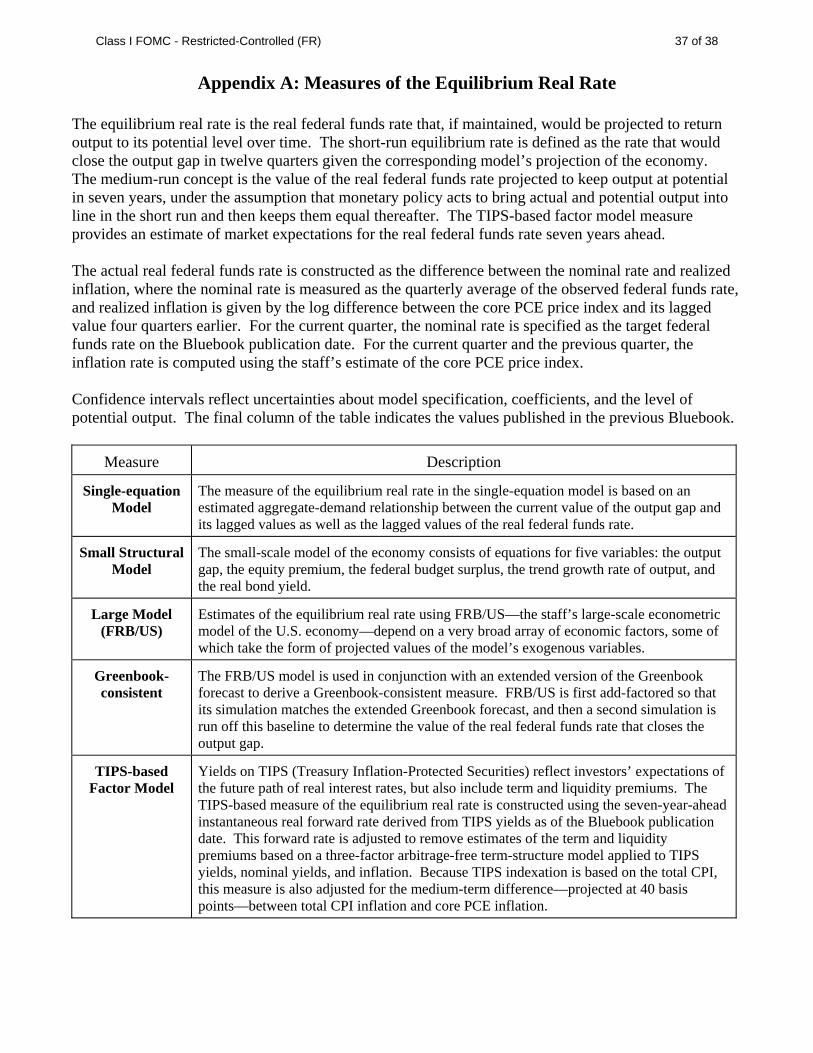
Appendix A: Measures of the Equilibrium Real Rate
The equilibrium real rate is the real federal funds rate that, if maintained, would be projected to return output to its potential level over time. The short-run equilibrium rate is defined as the rate that would close the output gap in twelve quarters given the corresponding model’s projection of the economy. The medium-run concept is the value of the real federal funds rate projected to keep output at potential in seven years, under the assumption that monetary policy acts to bring actual and potential output into line in the short run and then keeps them equal thereafter. The TIPS-based factor model measure provides an estimate of market expectations for the real federal funds rate seven years ahead. The actual real federal funds rate is constructed as the difference between the nominal rate and realized inflation, where the nominal rate is measured as the quarterly average of the observed federal funds rate, and realized inflation is given by the log difference between the core PCE price index and its lagged value four quarters earlier. For the current quarter, the nominal rate is specified as the target federal funds rate on the Bluebook publication date. For the current quarter and the previous quarter, the inflation rate is computed using the staff’s estimate of the core PCE price index. Confidence intervals reflect uncertainties about model specification, coefficients, and the level of potential output. The final column of the table indicates the values published in the previous Bluebook.
Measure Description
Single-equation Model
The measure of the equilibrium real rate in the single-equation model is based on an estimated aggregate-demand relationship between the current value of the output gap and its lagged values as well as the lagged values of the real federal funds rate.
Small Structural Model
The small-scale model of the economy consists of equations for five variables: the output gap, the equity premium, the federal budget surplus, the trend growth rate of output, and the real bond yield.
Large Model (FRB/US)
Estimates of the equilibrium real rate using FRB/US—the staff’s large-scale econometric model of the U.S. economy—depend on a very broad array of economic factors, some of which take the form of projected values of the model’s exogenous variables.
Greenbook-consistent
The FRB/US model is used in conjunction with an extended version of the Greenbook forecast to derive a Greenbook-consistent measure. FRB/US is first add-factored so that its simulation matches the extended Greenbook forecast, and then a second simulation is run off this baseline to determine the value of the real federal funds rate that closes the output gap.
TIPS-based Factor Model
Yields on TIPS (Treasury Inflation-Protected Securities) reflect investors’ expectations of the future path of real interest rates, but also include term and liquidity premiums. The TIPS-based measure of the equilibrium real rate is constructed using the seven-year-ahead instantaneous real forward rate derived from TIPS yields as of the Bluebook publication date. This forward rate is adjusted to remove estimates of the term and liquidity premiums based on a three-factor arbitrage-free term-structure model applied to TIPS yields, nominal yields, and inflation. Because TIPS indexation is based on the total CPI, this measure is also adjusted for the medium-term difference—projected at 40 basis points—between total CPI inflation and core PCE inflation.
Class I FOMC - Restricted-Controlled (FR) 37 of 38
Appendix B: Analysis of Policy Paths and Confidence Intervals
Rule Specifications: For the following rules, it denotes the federal funds rate for quarter t, while the explanatory variables include the staff’s projection of trailing four-quarter core PCE inflation (πt), inflation two and three quarters ahead (πt+2|t and πt+3|t), the output gap in the current period and one quarter ahead ( yt − *yt and y *
t t+1| − t 1|ty + ), and the three-quarter-ahead forecast of annual average GDP growth relative to potential (Δ −4 y *
t t+3| Δ t 34 y + |t ), and π * denotes an assumed value of policymakers’
long-run inflation objective. The outcome-based and forecast-based rules were estimated using real-time data over the sample 1988:1-2006:4; each specification was chosen using the Bayesian information criterion. Each rule incorporates a 75 basis point shift in the intercept, specified as a sequence of 25 basis point increments during the first three quarters of 1998. The first two simple rules were proposed by Taylor (1993, 1999), while the third is a variant of the Taylor (1999) rule—introduced in the August Bluebook—with a higher value of r*. The prescriptions of the first-difference rule do not depend on assumptions regarding r* or the level of the output gap; see Orphanides (2003).
Outcome-based rule it = 1.20it-1–0.39it-2+0.19[1.17 + 1.73 πt + 3.66( y y *t t− ) – 2.72( y y *
t t−1 1− − )]
Forecast-based rule it = 1.18it-1–0.38it-2+0.20[0.98 +1.72 πt+2|t+2.29( y y *t t+1| − t t+1| )–1.37( y y *
t t−1 − − )]1
Taylor (1993) rule it = 2 + πt + 0.5(πt –π * ) + 0.5( y y *t t− )
Taylor (1999) rule it = 2 + πt + 0.5(πt –π * ) + ( y y *t t− )
Taylor (1999) rule with higher r*
it = 2.75 + πt + 0.5(πt – π * ) + ( y y *t t− )
First-difference rule it = it-1 + 0.5(πt+3|t –π * ) + 0.5(Δ −4 4y *t t+3| Δ t+3|t ) y
FRB/US Model Simulations: Prescriptions from the two empirical rules are computed using dynamic simulations of the FRB/US model, implemented as though the rule were followed starting at this FOMC meeting. The dotted line labeled “Previous Bluebook” is based on the current specification of the policy rule, applied to the previous Greenbook projection. Confidence intervals are based on stochastic simulations of the FRB/US model with shocks drawn from the estimated residuals over 1986-2005. Information from Financial Markets: The expected funds rate path is based on forward rate agreements, and the confidence intervals for this path are constructed using prices of interest rate caps. Near-Term Prescriptions of Simple Policy Rules: These prescriptions are calculated using Greenbook projections for inflation and the output gap. Because the first-difference rule involves the lagged funds rate, the value labeled “Previous Bluebook” for the current quarter is computed using the actual value of the lagged funds rate, and the one-quarter-ahead prescriptions are based on this rule’s prescription for the current quarter.
References: Taylor, John B. (1993). “Discretion versus policy rules in practice,” Carnegie-Rochester Conference Series on Public Policy, vol. 39 (December), pp. 195-214. ————— (1999). “A Historical Analysis of Monetary Policy Rules,” in John B. Taylor, ed., Monetary Policy Rules. The University of Chicago Press, pp. 319-341. Orphanides, Athanasios (2003). “Historical Monetary Policy Analysis and the Taylor Rule,” Journal of Monetary Economics, vol. 50 (July), pp. 983-1022.
Class I FOMC - Restricted-Controlled (FR) 38 of 38