Prefatory Note The attached document represents the most complete and accurate version available based on original files from the FOMC Secretariat at the Board of Governors of the Federal Reserve System. Please note that some material may have been redacted from this document if that material was received on a confidential basis. Redacted material is indicated by occasional gaps in the text or by gray boxes around non-text content. All redacted passages are exempt from disclosure under applicable provisions of the Freedom of Information Act. Content last modified 03/07/2014.
Transcript
Prefatory Note The attached document represents the most complete and accurate version available based on original files from the FOMC Secretariat at the Board of Governors of the Federal Reserve System. Please note that some material may have been redacted from this document if that material was received on a confidential basis. Redacted material is indicated by occasional gaps in the text or by gray boxes around non-text content. All redacted passages are exempt from disclosure under applicable provisions of the Freedom of Information Act.
Content last modified 03/07/2014.
Class II FOMC - Restricted (FR)
CURRENT ECONOMICAND FINANCIAL CONDITIONS
Part 1
Summary and Outlook
Prepared for the Federal Open Market Committeeby the staff of the Board of Governors of the Federal Reserve System
June 18, 2008
Class II FOMC - Restricted (FR)
June 18, 2008
Summary and Outlook
Prepared for the Federal Open Market Committeeby the staff of the Board of Governors of the Federal Reserve System
Class II FOMC—Restricted (FR)
I-1
Domestic Developments
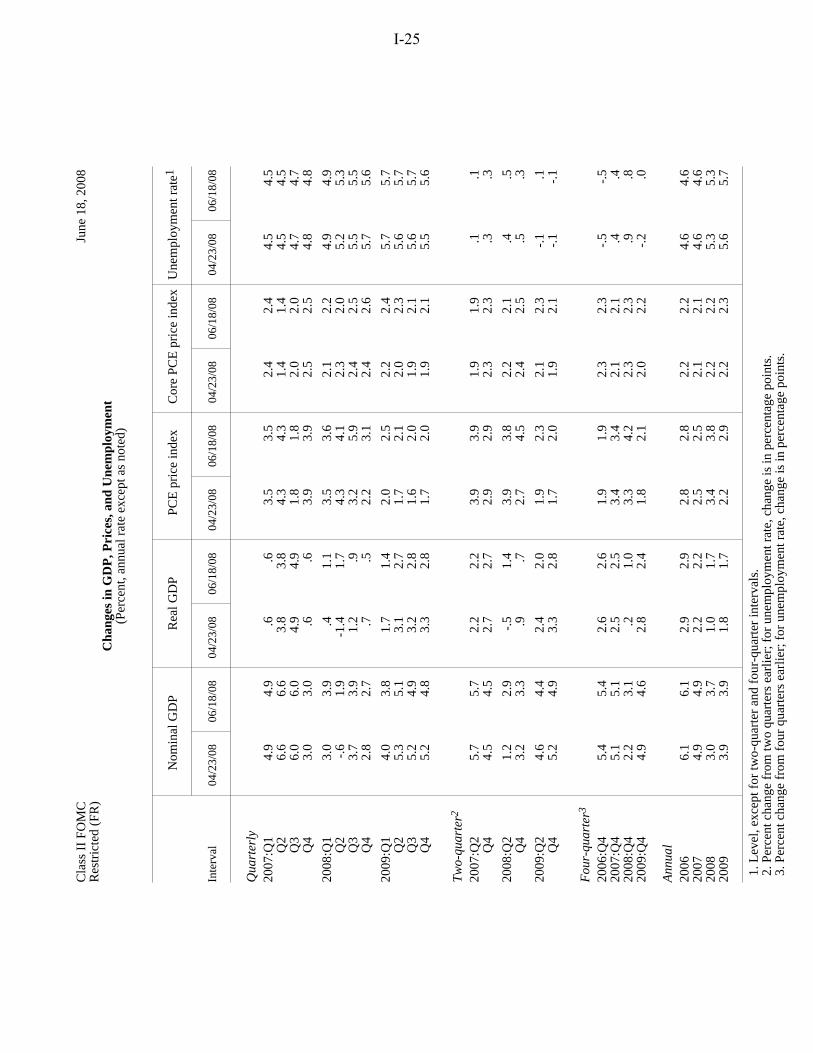
The data that have become available since the time of the April Greenbook suggest that economic activity during the first half of this year was not nearly as weak as we expected. Rather than undergoing the mild downturn that we forecasted, the economy now appears to have expanded modestly in the first half of the year. The upside surprises were most visible in the monthly readings on consumer spending, but indicators of business outlays and government spending also were above our expectations. Moreover, the surprising strength in the spending data has been accompanied by better-than-expected readings on the labor market; payroll employment has continued to decline but at a much slower pace than we anticipated. In light of the incoming information, we now estimate that real GDP rose at an annual rate of about 1 percent in the first quarter, and we expect it to rise at a 1¾ percent pace this quarter—roughly ¾ percentage point and 3 percentage points faster, respectively, than in our previous projection.
We have carried some of the surprising strength in aggregate demand forward in our projection. However, we also believe that some of it is likely to prove transitory; most notably, consumer spending has run stronger than we can explain on the basis of its principal determinants, and we expect some of that strength to be given back during the second half of this year. Moreover, credit conditions remain tight and many of the other key factors conditioning our forecast have continued to deteriorate: Consumer sentiment has soured further, house prices have fallen faster than we anticipated, and oil prices have kept climbing. All told, we are now projecting real GDP to grow at an annual rate of ¾ percent in the second half, a bit less than in our previous projection.
The inflation outlook has deteriorated since the April Greenbook. Although the recent news on core PCE inflation has been somewhat better than anticipated, we expect the impetus from higher prices of energy and other commodities to put somewhat greater upward pressure on core prices. In addition, long-run inflation expectations appear to have ticked up. Accordingly, we now project core PCE prices to rise 2.3 percent in 2008 and 2.2 percent in 2009. Relative to the last Greenbook, the forecast is unchanged for 2008 and 0.2 percentage point higher for 2009. The rapid increases in prices for energy and food have boosted our estimate of headline inflation to 4.2 percent this year, but, as these prices stabilize, headline inflation is projected to step down to 2.1 percent next year.
Given the less favorable outlook for inflation and our view that underlying aggregate demand is stronger than in our previous projection, we have conditioned this forecast on a tighter path for monetary policy than the one in the previous Greenbook. By the end of
I-2 Class II FOMC—Restricted (FR) Part 1: Summary and Outlook, June 18, 2008
next year, the federal funds rate is 100 basis points above the April projection. This degree of tightening is sufficient to leave the GDP gap at the end of 2009 at about the same level as in the April Greenbook. Likewise, the unemployment rate at the end of the projection is 5½ percent, also roughly unchanged from the April Greenbook.
Still, the level of real GDP is projected to be higher, on average, than in the April forecast. We have interpreted part of the surprise in activity in the first half of this year as indicating a milder slowdown than we had expected. In addition, we have raised our estimate of potential output growth by about 0.2 percentage point per year over the projection period. In all, we now project real GDP to increase 1 percent in 2008 and roughly 2½ percent in 2009, about ¾ percentage point higher and ½ percentage point lower, respectively, than in the April Greenbook.
Key Background Factors As noted above, we have conditioned this forecast on a considerably tighter path for monetary policy than the one in the previous Greenbook. We now assume that the Committee will hold the federal funds rate steady at 2 percent for the remainder of this year and then take it up by a total of 75 basis points during the first half of 2009. The federal funds rate is assumed to remain at 2¾ percent during the second half of next year. Futures quotes suggest that market participants currently anticipate an even larger rise in the federal funds rate, with the expected rate reaching about 3¾ percent by the fourth quarter of 2009.
With respect to longer-term rates, the 10-year Treasury yield has increased substantially since we closed the April Greenbook. We have raised the starting level of the 10-year yield about 40 basis points in response and expect the yield to remain at about this higher level through year-end before drifting down a bit in 2009. Although the Treasury yield would ordinarily tend to rise as the 10-year window moves beyond the low short rates prevailing in the near term, the staff’s assumed path for the federal funds rate implies a notable downside surprise for market participants that exerts an offsetting effect on long-term yields. In addition, some of the recent rise in Treasury rates appears to reflect an increase in the term premium that we expect will be unwound in part.
Since the last Greenbook, the 30-year fixed mortgage rate has moved up roughly in line with long-term Treasury yields, while the Baa corporate bond rate has increased about half as much. Accordingly, we have raised the starting levels for the fixed mortgage rate and the corporate bond rate by 40 basis points and 20 basis points, respectively.
Federal Funds RatePercent
Quarterly average
Current GreenbookApril GreenbookMarket forecast
2004 2005 2006 2007 2008 2009
9
8
7
6
5
4
3
2
1
0
Long-Term Interest RatesPercent
Quarterly average
10-yearTreasury rate
Baa corporate rate
2004 2005 2006 2007 2008 2009
8
7
6
5
4
3
Equity Prices2004:Q1 = 100, ratio scale
Quarter-end
Wilshire 5000
2004 2005 2006 2007 2008 2009
170
160
150
140
130
120
110
100
90
House Prices2004:Q1 = 100, ratio scale
Note. The projection period begins in 2008:Q2.
Quarterly
OFHEO purchase-only index
2004 2005 2006 2007 2008 2009
140
130
120
110
100
90
Crude Oil PricesDollars per barrel
Quarterly average
West Texasintermediate
2004 2005 2006 2007 2008 2009
150
130
110
90
70
50
30
Broad Real Dollar2004:Q1 = 100
Quarterly average
2004 2005 2006 2007 2008 2009
110
105
100
95
90
85
80
Class II FOMC - Restricted (FR)
Key Background Factors Underlying the Baseline Staff Projection
Note. In each panel, shading represents the projection period, which begins in 2008:Q3 except as noted.
I-3
I-4 Class II FOMC—Restricted (FR) Part 1: Summary and Outlook, June 18, 2008
We expect that both rates will decline somewhat through the end of 2009 as spreads over Treasury securities narrow with the improvement in economic activity. In addition, we continue to anticipate that credit conditions facing households and businesses will become less restrictive, on net, over the forecast period.
Equity prices currently stand about 1 percent below the level implicit in our last forecast, leaving the equity premium at the high end of the range seen over the past two decades. As in our previous forecast, we assume that the equity premium stays near its current level through the end of this year and then narrows in 2009 as economic activity accelerates. Consistent with this outcome, we assume that equity prices rise at an annual rate of 7 percent over the rest of this year and 12 percent next year. As for house prices, the rate of decline in the first quarter was a bit faster than we had assumed in the last Greenbook, and we have edged down our house price forecast going forward. The OFHEO purchase-only price index is now projected to decline roughly 7 percent this year and another 5 percent next year. Combined with downward revisions to historical data, this projection leaves the level of house prices at the end of 2009 about 2 percent below that in the April Greenbook.
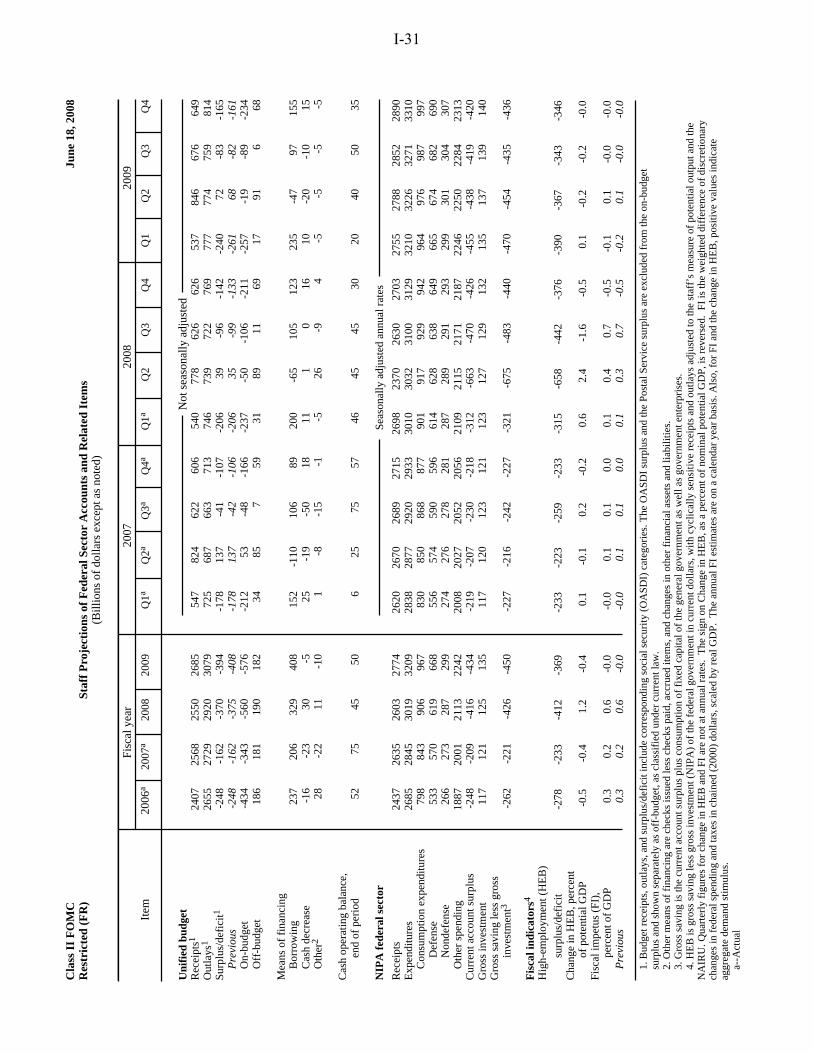
Our fiscal policy assumptions are unchanged from those in the last Greenbook. The fiscal stimulus package and the robust growth in defense spending are projected to boost real GDP growth about ½ percentage point this year. Fiscal impetus falls back to about zero next year as continued robust growth in defense spending is offset by the removal of most of the fiscal stimulus. Meanwhile, we expect state and local governments to rein in their spending growth in the face of tighter budget conditions. Our outlook for the unified budget is little changed from the April forecast. In particular, we are projecting deficits of $370 billion in fiscal year 2008 and $394 billion in fiscal year 2009, just above 2½ percent of GDP in both years.
The real foreign exchange value of the dollar has moved up about 1½ percent since the time of the last Greenbook. We have carried this higher level forward, but we continue to expect the real trade-weighted dollar to decline modestly over the projection period. Our projection for foreign real GDP has growth slowing in the current quarter to 2¼ percent and then picking up to a 3¾ percent pace by the end of the forecast period. The path for growth is somewhat higher this year and a bit weaker next year, largely in reaction to the revision to the projection for U.S. activity.
Domestic Developments Class II FOMC—Restricted (FR) I-5
Oil prices have surged again, likely reflecting a combination of intensifying geopolitical concerns, falling inventories, and a further deterioration in estimates of long-term supply. The spot price of West Texas intermediate (WTI) crude oil now stands at $134 per barrel, about $15 per barrel higher than at the time of the last Greenbook. Far-dated futures prices have increased even more—about $30 per barrel—and the futures curve is now roughly flat. We expect spot prices to hold at about $135 per barrel through the remainder of this year and next.
Recent Developments and the Near-Term Outlook Real GDP is estimated to have risen at an annual rate of about 1 percent in the first quarter, about ¾ percentage point faster than we projected in the April Greenbook. Incoming data point to an even larger upward surprise in the current quarter: We are projecting real GDP to increase at a 1¾ percent pace this quarter, as compared with our forecast of a 1½ percent decline in the April Greenbook. Although there is little evidence yet of any sharp cyclical downturn in aggregate output, economic activity appears to be weak.
We anticipate that manufacturing industrial production will decline at an annual rate of 3½ percent in the second quarter after having fallen at a 1¼ percent pace in the first quarter. The declines in motor vehicle assemblies have been particularly steep, with the average pace of production in April and May at an annual rate of only 8½ million units, about 1½ million units below the first-quarter pace. Of course, part of this decline can be traced to parts shortages related to a strike at a GM supplier, and indeed, current schedules call for production to step up to 10 million units in June and to 10½ million units in the third quarter. However, given the soft current sales environment, we are skeptical of these plans and have assumed a sizable underbuild in our projection. Elsewhere in manufacturing, we are projecting only small declines in production in coming months, as weak domestic demand is partly offset by strong foreign demand.
The labor market has also continued to deteriorate, but at a pace that appears to be more gradual than we anticipated in the April Greenbook. Private payroll employment fell an average of 50,000 per month in April and May, about 100,000 per month less than we projected in our previous forecast. In response, we have trimmed our forecast of job losses in coming months to about the same pace. The unemployment rate jumped ½ percentage point to 5½ percent in May. We think that about 0.2 percentage point of this rise in the jobless rate probably reflects temporary seasonal and compositional factors, which we expect to be reversed in June. Beyond June, we anticipate a general
I-6 Class II FOMC—Restricted (FR) Part 1: Summary and Outlook, June 18, 2008
Summary of the Near-Term Outlook (Percent change at annual rate except as noted)
2008:Q1 2008:Q2 Measure Apr
GB June GB
Apr GB
June GB
Real GDP .4 1.1 -1.4 1.7 Private domestic final purchases -1.0 -.4 -2.2 .5 Personal consumption expenditures 1.0 1.2 .2 2.2 Residential investment -30.9 -24.7 -32.0 -23.7 Business fixed investment -1.1 -.2 -6.7 -1.2 Government outlays for consumption and investment 0.7 2.1 2.8 3.1
1In any case, the implications for our forecast of a larger response to the rebate checks are ambiguous. If the larger-than-expected second-quarter jump in consumption was due to a higher propensity to consume out of the rebates, we would raise our estimate of third-quarter consumption. On the other hand, if the surprise was due to a faster response to the rebates than we had assumed, we would lower it. Regardless, the longer-run effect on consumption would be essentially zero.
upward drift in the unemployment rate as employers adjust to the weak pace of economic activity.
Consumer spending appears to have been much stronger than we projected in the last Greenbook. After posting a meager 1¼ percent increase in the first quarter, real PCE looks to be on track to increase 2¼ percent in the current quarter, well above the ¼ percent rate projected in the April Greenbook. This performance is especially surprising given the further increase in energy prices and the deterioration in consumer sentiment that have taken place since the turn of the year. At this point, we are not interpreting the evidence as suggesting that the effects of the tax rebates are larger than we had assumed; much of the upward revisions to spending occurred in March and April—before the rebates were sent out—and we have little reason to believe that consumers raised their spending in anticipation of the rebates.1 Instead, we think that underlying household demand is probably stronger than we assumed in the last forecast, and in reaction, we have removed some of the recession-like behavior that we built into our April projection for the second half of the year.
Domestic Developments Class II FOMC—Restricted (FR) I-7
That said, we expect the further weakening in consumer sentiment and the substantial hit to households’ real purchasing power from the recent upsurge in energy prices to exert appreciable restraint on spending going forward. In this regard, sales of light vehicles, which is one indicator of consumer spending that we can observe in a timely manner, fell almost a million units in April and May to about 14.3 million units at an annual rate; moreover, initial reports on sales in the early part of June suggest a further sizable deterioration in demand. To be sure, the enormous increases in gasoline prices make interpreting changes in motor vehicle sales as a broader gauge of consumer demand more difficult than usual. Nonetheless, we think that these data point to at least some softening in consumption over the next few months.
In the housing sector, real construction activity over the first half of this year appears to have fallen at a slightly slower pace than we had expected in the April Greenbook, with the projected contribution of residential investment to real GDP growth about ⅓ percentage point less negative in both the first and second quarters. That said, the trajectory for residential construction is still decidedly downward. Single-family housing starts appear on track to average 660,000 units at an annual rate in the second quarter, down from an annual rate of 730,000 units in the first quarter and only about 60 percent of their peak level in early 2006. And, while the pace of starts this quarter is a little higher than in our previous projection, new home sales have fallen more than we were expecting, leaving the months’ supply of new homes at an even higher level. In contrast, the recent news on existing home sales has been slightly more favorable than expected, and we have penciled in a modest upturn in the sales of these homes in coming months.
In the business sector, real investment in equipment and software (E&S) appears to be softening, although the recent data on orders and shipments suggest that the deceleration will be less pronounced this quarter than we projected in April. After posting a 1 percent decline in the first quarter, total E&S spending is projected to fall about 5½ percent this quarter, 3 percentage points less than in the April Greenbook. We continue to expect E&S spending to drop a bit further in coming months, as near-term indicators of business investment demand remain downbeat and credit conditions continue to be tight.
Data received since the April Greenbook indicate that nonresidential construction so far this year also has held up better than we expected. Our projection for real spending growth in this sector stands at annual rates of about 1¾ percent in the first quarter and 7¾ percent in the second quarter—a sharp-step down from the double-digit pace of 2007 but still significantly higher than in the April projection. However, the architectural
I-8 Class II FOMC—Restricted (FR) Part 1: Summary and Outlook, June 18, 2008
billings index has plummeted in recent months, and vacancy rates, particularly for retail and office buildings, have ticked up, suggesting that spending will slow in coming months.
We estimate that real nonfarm inventories fell at an annual rate of $12 billion in the first quarter, after a $22 billion drop in the fourth quarter. Our projection has stocks falling an additional $56 billion this quarter, as we continue to expect firms to meet much of the stimulus-induced demand by drawing down inventories rather than by increasing production. Over the first two quarters of this year, real nonfarm inventory investment is now estimated to subtract about ½ percentage point from real GDP growth, about ¼ percentage point less than in the April Greenbook.
In the federal sector, real outlays rose at an annual rate of about 4½ percent in the first quarter, and information about defense spending from the April and May Monthly Treasury Statements suggests that growth will step up to a 6¼ percent pace in the current quarter—a bit higher than we expected last Greenbook. In the state and local sector, expenditures rose at an annual rate of about ¾ percent in the first quarter and are projected to increase at a 1½ percent pace in the second quarter. This subdued rate suggests that state and local governments are beginning to feel the pinch of the recent deceleration in tax revenues.
Net exports continue to be a positive factor for the economy. Real export growth is projected to average 6½ percent at an annual rate in the first half of this year, supported by the effects of past dollar depreciation and solid foreign activity. Meanwhile, real imports are projected to decline at an annual rate of 3½ percent, weighed down by weaker economic activity in the United States and the lagged effects of the dollar. As a result, we project that real net exports will contribute 1½ percentage points to real GDP growth over the first half of the year, just a touch more than in the April Greenbook.
The incoming data on consumer prices have been mixed. After having risen at an annual rate of 3½ percent in the first quarter, overall PCE prices are projected to rise at a 4 percent pace this quarter, as energy and food prices have accelerated. Moreover, the recent run-ups in prices for energy and agricultural commodities point to a further step-up in headline inflation in the third quarter. In contrast, increases in core prices have been quite modest in recent months, and we expect core PCE inflation to edge down from 2.2 percent in the first quarter to 2 percent in the second quarter. However, we view the second-quarter slowing as being importantly driven by transitory factors—in particular,
Domestic Developments Class II FOMC—Restricted (FR) I-9
softness in the nonmarket component of prices and in the volatile category of lodging away from home—which we think provide little signal of underlying inflation. As these temporary factors unwind and as higher commodity prices pass through to prices of other goods and services, we expect core PCE prices to rise at a somewhat faster pace in coming months.
The Medium-Term Outlook We expect economic activity to decelerate over the second half of this year, as the effects of lower household wealth, slower real income growth associated with higher oil prices, and tight credit conditions hold down consumer spending and as the positive contributions to growth from net exports and government spending diminish. In 2009, we expect economic activity to return to a pace close to our upward-revised estimate of the growth of potential output, reflecting a gradual improvement in credit conditions and some lessening of the drag on growth from the run-up in oil prices. Compared with last Greenbook, our projection for real GDP growth over the next year and a half is noticeably lower, as higher oil prices and tighter monetary policy, as well as an assumed milder rebound from a milder slowdown, more than offset the effects of higher potential GDP growth. We now project real GDP growth of about ¾ percent at an annual rate in the second half of this year and 2½ percent in 2009, about ¼ percentage point slower in the second half of 2008 and ½ percentage point slower in 2009 than in the April Greenbook.
Household spending. The basic contour of our forecast for real consumer spending is not fundamentally different from that in the April Greenbook. Lower household wealth, higher oil prices, financial turmoil, and heightened concerns about the economic outlook lead consumers to reduce real spending, on average, in the second half of this year. Spending picks up gradually next year as credit markets and the overall economy begin to recover. Relative to last Greenbook, the recovery in 2009 is a bit weaker—with growth averaging 1½ percent, about ½ percentage point slower than in the April Greenbook. This downward revision is due to the effects of higher oil prices, higher interest rates, and a smaller bounceback from the more modest slowdown in spending we are seeing this year. These effects outweigh the boost to spending growth from the upward revision to potential output growth (and hence permanent income).
We have lowered our projection of housing demand over the next year and a half, given the higher path of mortgage rates and the somewhat larger drop in house prices in this forecast. And, with the months’ supply of new homes significantly higher now than in
I-10 Class II FOMC—Restricted (FR) Part 1: Summary and Outlook, June 18, 2008
Projections of Real GDP (Percent change at annual rate from end of
Government purchases 2.6 1.8 1.5 Previous 1.8 2.2 1.5
Exports 6.4 7.2 7.5 Previous 6.3 7.3 8.2
Imports -3.7 1.0 2.8 Previous -3.0 -.3 3.9
Contribution to growth (percentage points)
Inventory change -.6 1.1 .5 Previous -.8 1.2 .7
Net exports 1.5 .7 .5 Previous 1.3 1.0 .4
our previous forecast, we expect that the cutbacks in residential construction will need to be even deeper than we previously assumed. Our updated projection has single-family housing starts bottoming out at an annual rate of 510,000 units in the fourth quarter of this year—about 10 percent below our last Greenbook forecast—and then gradually moving up to a 610,000 unit pace by the end of next year. Meanwhile, multifamily housing starts are projected to average about 300,000 units over the next year and a half. Overall, residential investment is projected to subtract about 1 percentage point from real GDP growth in the second half of this year and 0.2 percentage point next year.
Domestic Developments Class II FOMC—Restricted (FR) I-11
Business investment. As noted previously, recent data suggest that the deceleration in investment in equipment and software has been less pronounced than we had anticipated. Accordingly, we now expect real E&S spending to decline 1¼ percent at an annual rate over the second half of this year, compared with our April Greenbook forecast for a 4 percent decline; in 2009, real E&S spending is expected to rise about 2½ percent, ¾ percentage point below our previous projection. This forecast shows a less cyclical pattern for E&S spending, with a more moderate slowdown in 2008 and a more moderate rebound in 2009.
Our outlook for investment in nonresidential structures is a touch stronger than in the April Greenbook, reflecting, in part, a stronger outlook for investment in drilling and mining structures in response to the surge in prices for crude oil and natural gas. Indeed, we now expect these outlays to rise at an average annual rate of close to 20 percent over the next six quarters. We project investment in structures other than drilling and mining to decline at an annual rate of 7 percent over the second half of this year and about 6 percent next year.
The pace of nonfarm inventory liquidation is projected to accelerate in the third quarter as firms continue to meet much of the rebate-induced final demand out of their existing stocks. Once the transitory boost to demand from the stimulus wanes, we expect firms to gradually rebuild their stocks. All told, inventory investment is projected to contribute about ¼ percentage point to real GDP growth this year and about ½ percentage point next year.
Government spending. We expect spending in the federal as well as the state and local sectors to decelerate over the projection period. In the federal sector, the growth of real defense purchases steps down in the second half of this year, as some of the strength in the first half of the year is unwound. Spending is projected to decelerate a bit further next year as a result of an anticipated slowdown in the growth of spending for military activities in Iraq and Afghanistan. In the state and local sector, we expect increasing budget shortfalls to result in a slower pace of spending, as states and localities remain wary of raising taxes. Our projection calls for real state and local purchases to increase at an annual rate of a bit more than ¾ percent in the second half of this year and ½ percent in 2009.
Net exports. Real exports are projected to post robust increases over the projection period, reflecting the continued strength of growth abroad and the effects of past dollar
I-12 Class II FOMC—Restricted (FR) Part 1: Summary and Outlook, June 18, 2008
depreciation. Real imports, which appear to have fallen in the first half of this year, are projected to rebound a bit in the second half and rise further next year as U.S. economic activity picks up. All told, net exports are expected to contribute about ¾ percentage point at an annual rate to the growth of real GDP in the second half of 2008 and ½ percentage point in 2009. (The International Developments section provides more detail on the outlook for the external sector.)
Aggregate Supply, the Labor Market, and Inflation We have raised our estimate for the growth of potential output by about 0.2 percentage point per year from 2007 to 2009 in response to incoming data suggesting that the trends in labor force participation and labor productivity are a little higher than we had been assuming. In particular, we now assume that potential GDP increased 2½ percent in 2007 and that it will maintain this rate of growth through 2009. Given these adjustments and our near-term forecast for actual GDP, the output gap is estimated to be about minus ½ percent of GDP in the current quarter, about ¾ percentage point narrower than in the April Greenbook. However, because of the weaker trajectory of our output forecast in coming quarters, we project that the gap will widen to about minus 1½ percent by the end of 2009, roughly the same as in the April Greenbook.
Productivity and the labor market. Productivity growth in the first half of the year appears to be significantly stronger than we expected in the April Greenbook. Although we have interpreted some of this strength as reflective of a faster rate of growth of structural productivity, the upward surprise will still likely leave the level of actual productivity in the second quarter somewhat above its structural level. With economic activity anticipated to decelerate in coming quarters, we expect productivity growth to slow to an annual rate of 1 percent in the second half of this year. Productivity growth is then projected to step back up to its trend rate of 2 percent as the economy begins to rebound in 2009. Private payroll employment is projected to decline at a pace of roughly 50,000 per month through the end of the year. The pace of hiring then gradually picks up as the economy strengthens, with private payrolls projected to rise at an average pace of about 90,000 per month next year. The unemployment rate is projected to rise to 5.7 percent by the beginning of 2009 and to remain close to that level over the rest of the year.
Domestic Developments Class II FOMC—Restricted (FR) I-13
Decomposition of Structural Labor Productivity Nonfarm Business Sector
NOTE. Components may not sum to totals because of rounding. For multiyear periods, the percent change is the annual average from Q4 of the year preceding the first year shown to Q4 of the last year shown. 1. Percentage points.
1. Percent, average for the fourth quarter. 2. Actual less potential GDP in the fourth quarter of the year indicated as a percent of potential GDP. A negative number thus indicates that the economy is operating below potential.
I-14 Class II FOMC—Restricted (FR) Part 1: Summary and Outlook, June 18, 2008
Inflation Projections (Percent change, Q4 to Q4, except as noted)
1. December to December. Prices and labor costs. We have marked up our forecast for core inflation in the second half of this year and in 2009. The upward revisions to prices for energy and other commodities imply a larger contribution of these factors to core inflation. In addition, while the recent indicators of long-run inflation expectations have been mixed, we view them as, on balance, pointing to a slight updrift, which we have allowed to show through to our projection for core inflation. The indirect effects of energy prices and higher inflation expectations continue to put upward pressure on core inflation next year, but these influences are counterbalanced by a projected deceleration in import prices and by the widening gap in resource utilization. In all, core PCE inflation is projected to step up from an annual rate of 2 percent in the first half of this year to a 2½ percent pace in the second half before dropping back to 2¼ percent next year.
Domestic Developments Class II FOMC—Restricted (FR) I-15
The rapid price increases for energy and food have boosted our estimate of headline inflation to 4¼ percent this year, almost 1 percentage point higher than in the April projection. We continue to expect these prices to stabilize next year; consequently, our projection of headline inflation steps down to 2.1 percent in 2009.
Hourly compensation in the nonfarm business sector is projected to increase 4.1 percent in both 2008 and 2009, as the influence of rising headline inflation on wage demands is roughly offset by the deterioration in labor market conditions. Similarly, the employment cost index is projected to rise 3.4 percent both this year and next. Given the higher projected path of price inflation, our forecast for compensation growth next year is a little higher than in our previous projection.
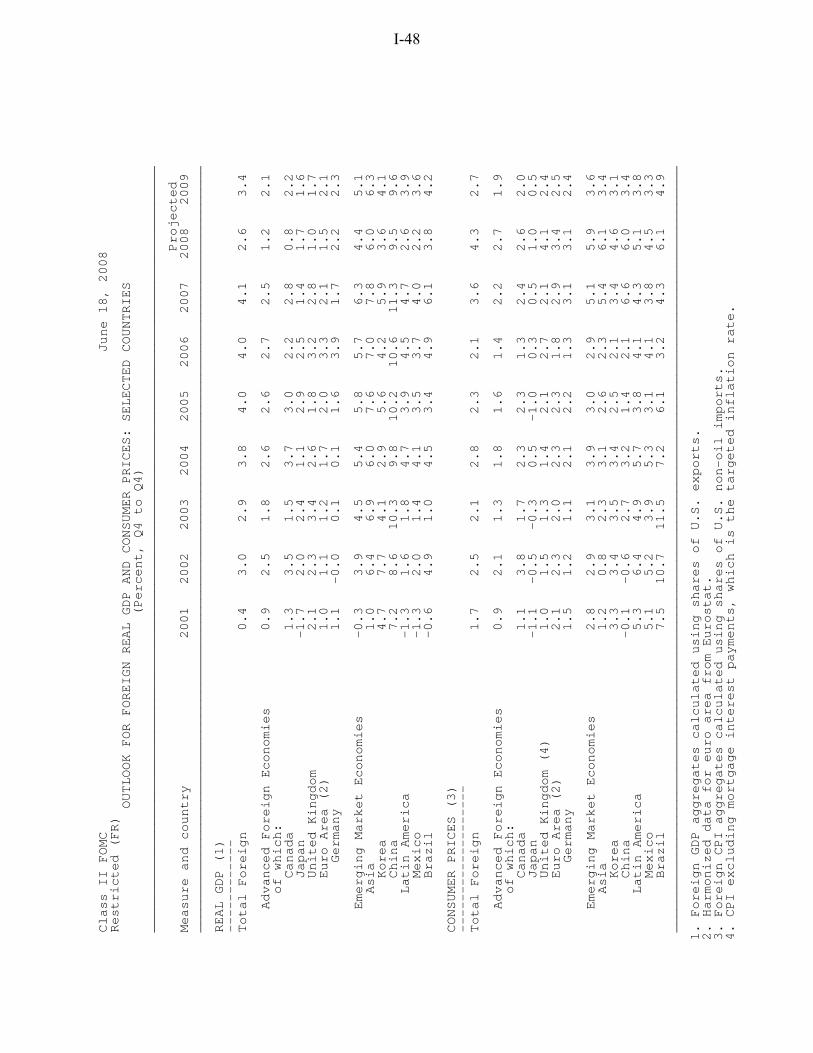
The Long-Term Outlook We have extended the staff forecast to 2012 using the FRB/US model, adjusted to incorporate staff assessments of long-run potential output growth, fiscal policy, and foreign economic conditions. The contour of the long-run outlook depends on several key assumptions:
• Monetary policy aims at stabilizing PCE inflation at 1¾ percent, consistent with the discussion of longer-term inflation forecasts provided by FOMC participants in April.
• Risk premiums on corporate bonds and equity continue to fall back to historically more normal levels as current financial market strains abate. The ebbing of strains on financial institutions is accompanied by an ongoing easing in lending terms and standards.
• Fiscal policy is an essentially neutral factor, with little change in the cyclically adjusted budget positions of the federal and state and local governments as a percent of GDP.
• Beyond 2009, foreign real GDP expands 3¼ percent per year while the dollar depreciates 1¼ percent per year in real terms; nominal oil prices are roughly flat, as is consistent with far-dated futures prices. Under these assumptions, the current account deficit diminishes to about 3½ percent of GDP by 2012, and movements in prices for energy and imports have only minor implications for domestic inflation.
• The NAIRU remains flat at 4¾ percent, and potential GDP expands about 2½ percent per year from 2010 to 2012.
I-16 Class II FOMC—Restricted (FR) Part 1: Summary and Outlook, June 18, 2008
The Long-Term Outlook(Percent change, Q4 to Q4, except as noted)
1. Percent, average for the final quarter of the period.
With core inflation entering 2010 close to 2 percent, the federal funds rate continues to inch up, reaching 4¼ percent by the end of 2012. This monetary policy stance generates enough persistent (albeit declining) economic slack to bring inflation down to 1¾ percent in 2011 and 2012, with the unemployment rate poised to settle in at the NAIRU in 2013. Real GDP advances 3 percent per year, on average, from 2010 to 2012, nearly ½ percentage point above its projected potential growth rate over that period.
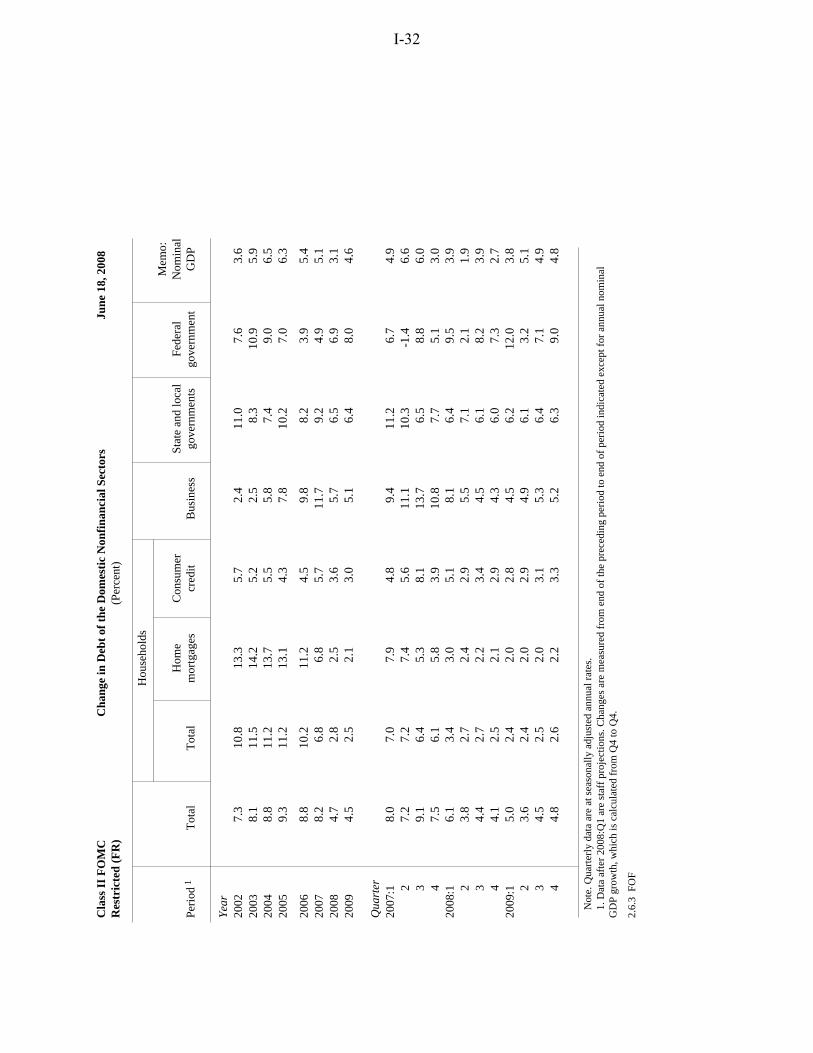
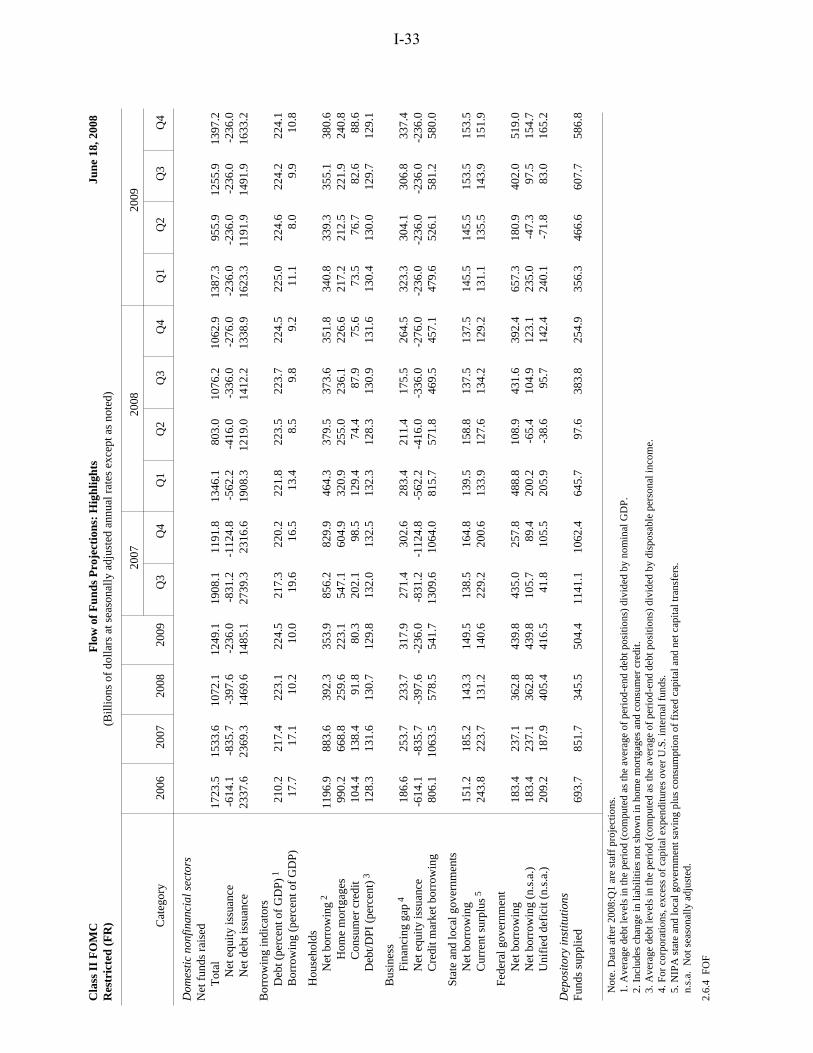
Financial Flows and Conditions Domestic nonfinancial debt growth is expected to slow sharply from its 8¼ percent pace last year to an annual rate of 3¾ percent in the second quarter, then maintain an average annual pace of about 4½ percent in the second half of this year and next. This projection of subdued growth in nonfinancial debt in part reflects our view that significant financial headwinds will linger for some time.
After having increased 6¾ percent in 2007, household debt rose at an annual rate of only 3½ percent in the first quarter of this year and is expected to decelerate further to an average annual increase of about 2½ percent through the end of 2009. The substantial drop in debt growth stems mainly from a slowdown in home mortgage borrowing as home prices continue to fall and terms and standards on mortgage loans remain tight. Tighter lending conditions for other types of household debt and sluggish increases in consumer spending are expected to temper the growth of consumer credit.
Debt of the nonfinancial business sector is expected to expand at an average annual rate of about 5 percent through 2009, down considerably from the double-digit rise recorded last year. Net equity retirements are expected to slow during the forecast period, reducing the demand for debt financing. In addition, business borrowing is anticipated to be restrained by relatively tight bank-lending standards, particularly over the next few
Domestic Developments Class II FOMC—Restricted (FR) I-17
quarters, and by relatively high corporate bond spreads, which are expected to narrow gradually over the forecast period.
Federal government debt is expected to rise about 7 percent this year, up from 5 percent last year, boosted in part by borrowing to fund the fiscal stimulus package. In 2009, we project that federal debt growth will remain elevated as the budget deficit widens further. State and local government debt growth is expected to slow from 9¼ percent in 2007 to about 6½ percent in both 2008 and 2009, mainly due to an anticipated moderation in the advance refunding of debt ahead of future call dates.
Following a first-quarter surge, M2 growth is expected to return to a slower pace for the rest of this year as the opportunity cost of holding money rises and the boost in demand for safe and liquid assets caused by the financial turmoil wanes. For 2008 as a whole, M2 is expected to grow about 5¾ percent, considerably above the pace of nominal GDP growth. In 2009, projected increases in the opportunity cost hold M2 growth to 4 percent, slightly less than nominal GDP.
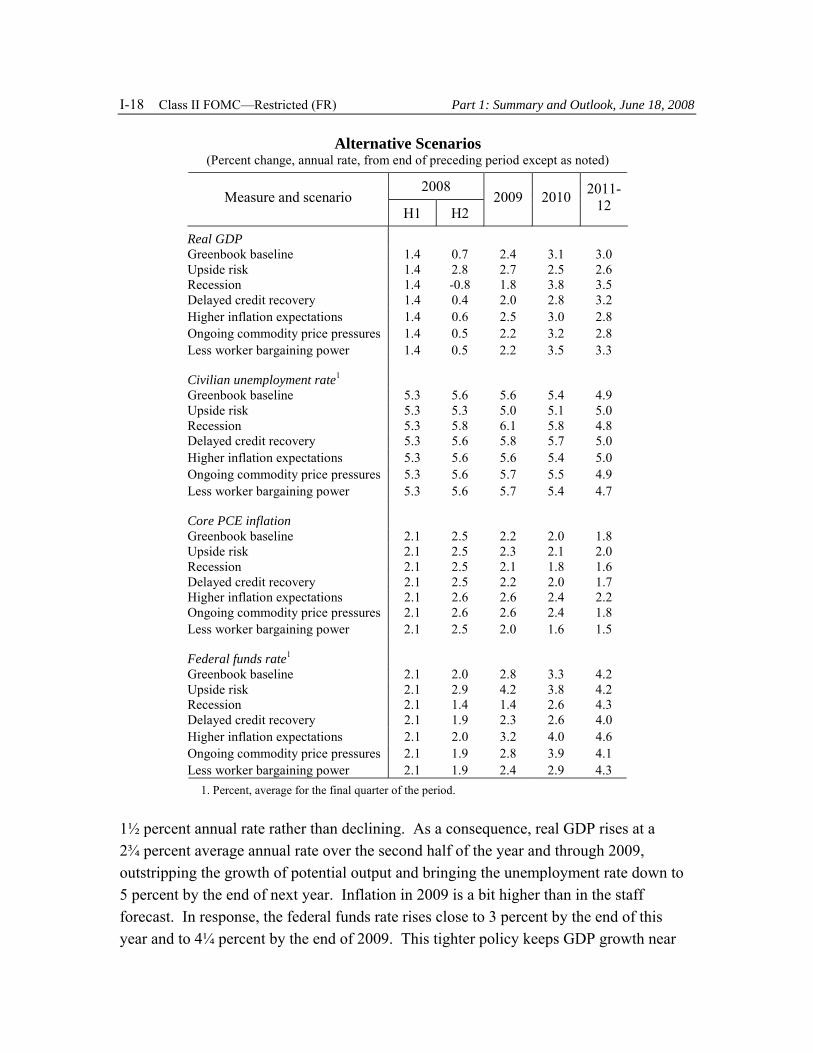
Alternative Simulations In this section, we consider alternatives to the staff forecast using simulations of the FRB/US model. In the first scenario, we assume that aggregate demand is stronger than in the baseline. The next two scenarios consider downside risks to real activity. The second scenario assumes that a contraction in aggregate output is still in the cards for later this year; the third scenario assumes that financial market disruptions extend through 2010. We then turn to inflation risks. Specifically, the fourth scenario examines the implications of a marked and persistent deterioration in long-run inflation expectations. The fifth scenario considers the effects of further rapid increases in the prices of oil, food, and other commodities. The last scenario investigates the possibility that firms may have more scope than we have assumed to adjust to higher costs for energy and other materials by limiting nominal wage gains. In all of the scenarios, we assume that monetary policy responds to the change in the outlook as suggested by an estimated Taylor rule.
Upside risk. The surprising strength of recent indicators suggests that we might have erred in making special adjustments to the baseline for recession-like effects and financial turmoil. In this scenario, we remove these special adjustments, thereby allowing consumption and investment to expand at a pace more in line with their fundamentals. Real consumer spending in the second half of this year rises 2¾ percent at an annual rate, 3½ percentage points above the baseline pace, and business fixed investment rises at a
I-18 Class II FOMC—Restricted (FR) Part 1: Summary and Outlook, June 18, 2008
Alternative Scenarios (Percent change, annual rate, from end of preceding period except as noted)
Federal funds rate1 Greenbook baseline 2.1 2.0 2.8 3.3 4.2 Upside risk 2.1 2.9 4.2 3.8 4.2 Recession 2.1 1.4 1.4 2.6 4.3 Delayed credit recovery 2.1 1.9 2.3 2.6 4.0 Higher inflation expectations 2.1 2.0 3.2 4.0 4.6 Ongoing commodity price pressures 2.1 1.9 2.8 3.9 4.1 Less worker bargaining power 2.1 1.9 2.4 2.9 4.3 1. Percent, average for the final quarter of the period.
1½ percent annual rate rather than declining. As a consequence, real GDP rises at a 2¾ percent average annual rate over the second half of the year and through 2009, outstripping the growth of potential output and bringing the unemployment rate down to 5 percent by the end of next year. Inflation in 2009 is a bit higher than in the staff forecast. In response, the federal funds rate rises close to 3 percent by the end of this year and to 4¼ percent by the end of 2009. This tighter policy keeps GDP growth near
Domestic Developments Class II FOMC—Restricted (FR) I-19
its potential beyond 2009 and the unemployment rate remains near 5 percent. Nonetheless, inflation is still around 2 percent in 2012, about ¼ percentage point higher than in the baseline long-term outlook.
Recession. We have raised the near-term projection considerably in light of the incoming spending and labor market data, eliminating any outright contraction in real GDP. But given the preliminary nature of these data, as well as the recent surge in oil prices, further decline in consumer sentiment, and ongoing problems in the housing and financial markets, a recession may still be in the offing. In this scenario, we assume that the economy goes into recession in the second half of this year; we have assumed the unemployment rate will rise above the NAIRU to the same extent it did in the previous two recessions. Thus, the unemployment rate reaches about 6¼ percent by the middle of next year. Real GDP declines in the second half of this year, and by the end of 2009, real GDP is 1¼ percent below baseline. In response to this weakness, the federal funds rate drops below 1½ percent by the end of this year and stays there through 2009. Inflation is little changed from baseline through 2009, in part because the initial effects of increased slack are modest and of short duration. These effects are more pronounced in the longer run.
Delayed credit recovery. Our baseline forecast assumes that the current financial market stresses will lessen substantially by next year. But given that many more mortgage defaults and other loan losses have yet to be realized and that conditions in the housing market are expected to continue to deteriorate into next year, credit conditions may remain restrictive for longer than we assume in the baseline. In this scenario, a more-prolonged credit crunch develops and materially damps business and household spending through 2010. Real GDP only edges up in the second half of this year and rises about 2 percent in 2009. As a result, the unemployment rate remains at 5¾ percent through 2010, rather than falling below 5½ percent as in the extended baseline. In response to the weaker pace of economic activity, the federal funds rate drops below 2 percent by the end of this year and then rises gradually to only 2½ percent by the end of 2010. Beyond 2009, inflation is slightly lower than in the baseline projection, reflecting the larger margin of slack.
Higher inflation expectations. Despite higher headline inflation, longer-run inflation expectations appear to have risen only modestly. The behavior of expectations to date may reflect a belief that the rapid pace of overall inflation has stemmed from transitory factors and that monetary policy is committed to bringing inflation back to a low level.
I-20 Class II FOMC—Restricted (FR) Part 1: Summary and Outlook, June 18, 2008
In this scenario, we consider the possibility that the persistence of high headline inflation causes expectations to become unmoored. We assume that long-run inflation expectations move up about ¾ percentage point by the end of this year. Both wages and prices are affected by the higher inflation expectations, and as a result, core inflation is almost ½ percentage point higher than baseline in 2009. Under the estimated Taylor rule, monetary policy responds by gradually raising the federal funds rate to 3¼ percent by the end of next year and 4 percent by the end of 2010. This tighter policy leads to slightly lower real GDP growth starting in 2010. However, the movements in the federal funds rate and resource utilization are not sufficient to push inflation back to baseline even by 2012.
Ongoing commodity price pressures. In the baseline projection, we expect inflationary pressures to ease substantially as oil prices level out and other commodity prices stop rising at unusually rapid rates. But supply shocks, as well as continued robust growth in developing countries, may cause prices for commodities to continue rising briskly. In this scenario, we assume that relative food price inflation is roughly 2½ percentage points higher in both 2008 and 2009 compared with baseline. We also assume that oil prices continue their dizzying rise so that, by the middle of next year, the price of oil reaches $185 per barrel. Other commodity prices are assumed to contribute to higher inflation as well. These inflationary pressures raise core inflation to about 2½ percent in 2009; headline inflation exceeds 5½ percent in the second half of this year, about ¾ percentage point higher than in the baseline. At the same time, real GDP expands somewhat more slowly than in the staff forecast, as the rise in the price of energy erodes real household income. Under the estimated Taylor rule, monetary policy responds to these changes by tightening gradually, and the federal funds rate reaches nearly 4 percent by the end of 2010. Because the impetus from commodity prices is assumed to fade after 2009, core inflation moderates over the longer term.
Less worker bargaining power. Increases in hourly labor compensation in recent years have been below the pace predicted by most of our models. One interpretation of this overprediction is that workers’ bargaining power has decreased. If so, firms may have more scope than we assume to protect profit margins from the effects of higher costs of crude oil and other imported commodities by holding the line on labor compensation. In this scenario, this diminished worker bargaining power leads to smaller wage gains; we assume hourly labor compensation advances at a pace 1 percentage point below our baseline projection for the remainder of this year and in 2009. With lower labor costs, price inflation is also lower than in the baseline but not by as much as for wages; as a
Domestic Developments Class II FOMC—Restricted (FR) I-21
result, real wages decline relative to baseline. The resulting shift in the composition of income away from labor and toward capital puts a small amount of downward pressure on aggregate demand and hence on real GDP in the near term. With both inflation and real activity somewhat lower than in the baseline, the federal funds rate edges below 2 percent by the end of this year and rises less next year. Beyond 2009, inflation moderates further as lower labor costs are passed on, and core inflation is around 1½ percent.
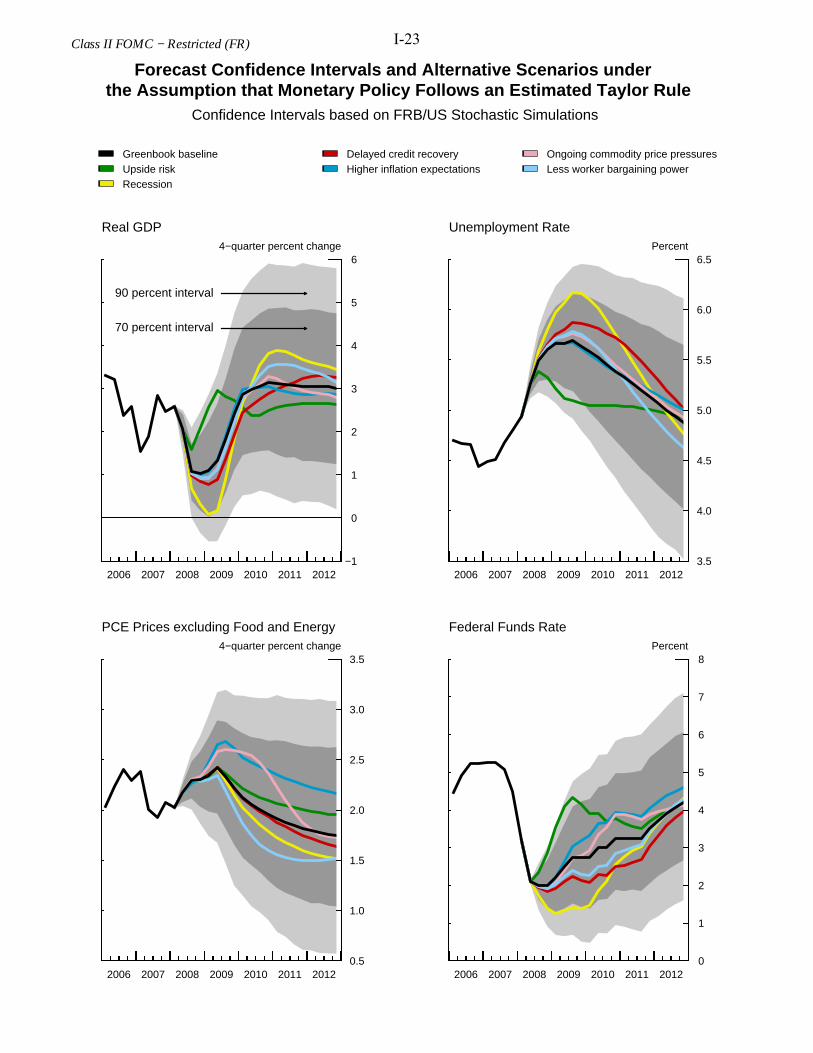
Assessment of Forecast Uncertainty The uncertainty that attends the staff forecast is always considerable, and the alternative scenarios discussed in the previous section represent just a few of the possible outcomes for real activity, inflation, and interest rates. Although our ability to discriminate between periods of higher or lower degrees of uncertainty is extremely limited, we continue to think that the risks associated with our current projection of real activity are probably greater than those faced on average over the past 20 years. This assessment stems in part from the unusual nature of the current stresses on the financial system; it also reflects the difficulty of predicting the timing and depth of cyclical downturns, as the revisions to the forecast this round illustrate. In addition, we see the distribution of future outcomes for output and employment growth as somewhat skewed to the downside, largely reflecting elevated “tail risks” associated with the ongoing housing market correction and the capital positions of some financial institutions. However, we judge this asymmetry to be smaller than in the last Greenbook.
In contrast to the situation for real activity, we believe that the uncertainty attached to our inflation projection has risen—although not to the point that we would judge it to be appreciably greater than historical norms. In addition, we see a little more upside risk than downside risk than in the last Greenbook. This revised assessment partly reflects further increases in prices for oil and other commodities, which have diminished our confidence that they will level out in coming quarters and diminish overall inflationary pressures. Moreover, we now see a greater risk that continued elevated readings on headline inflation could generate a pronounced deterioration in long-run inflation expectations, particularly in light of signs that they have already moved up.
I-22 Class II FOMC—Restricted (FR) Part 1: Summary and Outlook, June 18, 2008
Selected Greenbook Projections and 70 Percent Confidence Intervals Derivedfrom Historical Greenbook Forecast Errors and FRB/US Simulations
Measure 2008 2009 2010 2011 2012
Real GDP(percent change, Q4 to Q4)Projection 1.0 2.4 3.1 3.0 3.0Confidence interval
Notes: Intervals derived from Greenbook forecast errors are based on projections made from 1987-2007. Shocks underlying FRB/US stochastic simulations are randomly drawn from the 1987-2007 set of model equation residuals. . . . Not applicable. The Greenbook forecast horizon has typically extended about two years.
Real GDP4−quarter percent change
2006 2007 2008 2009 2010 2011 2012−1
0
1
2
3
4
5
6
Greenbook baseline
Upside risk
Recession
Delayed credit recovery
Higher inflation expectations
Ongoing commodity price pressures
Less worker bargaining power
70 percent interval
90 percent interval
Unemployment RatePercent
2006 2007 2008 2009 2010 2011 20123.5
4.0
4.5
5.0
5.5
6.0
6.5
PCE Prices excluding Food and Energy4−quarter percent change
2006 2007 2008 2009 2010 2011 20120.5
1.0
1.5
2.0
2.5
3.0
3.5
Federal Funds RatePercent
2006 2007 2008 2009 2010 2011 20120
1
2
3
4
5
6
7
8
Class II FOMC − Restricted (FR)
Forecast Confidence Intervals and Alternative Scenarios under the Assumption that Monetary Policy Follows an Estimated Taylor Rule
Confidence Intervals based on FRB/US Stochastic Simulations
U.S. net exports .4 1.2 .8 2.1 .7 .5 April GB .4 1.2 .3 2.3 1.0 .4
NOTE. Changes for years are measured as Q4/Q4; for half-years, Q2/Q4 or Q4/Q2.
International Developments
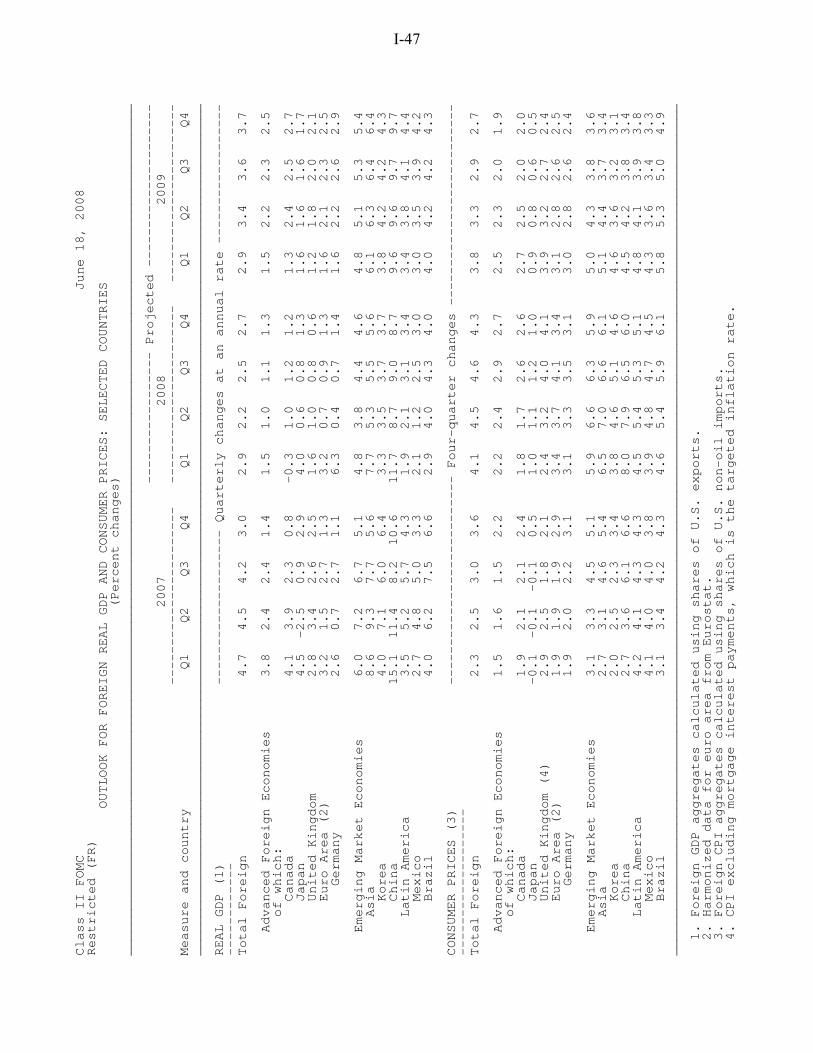
Surging food and energy prices have continued to exert upward pressures on headline inflation abroad, and core inflation has also moved up in some countries. As a result, we now expect considerably higher inflation in foreign economies for the remainder of this year than we had forecast in the April Greenbook. Our outlook for foreign growth this year is also higher, largely in reaction to the upward revision to the U.S. outlook. Nevertheless, we continue to expect the pace of economic activity abroad to remain relatively subdued through the end of this year and then recover to about 3½ percent next year.
Sovereign bond yields have risen in many foreign economies amid growing concerns about inflation and increasing expectations of monetary policy tightening. Money market conditions in advanced foreign economies have remained strained but have not deteriorated further since the time of the April Greenbook. The trade-weighted nominal dollar has increased 1 percent but has moved within a narrow range in the face of the relative calm in money markets and similar shifts in policy expectations for most countries.
I-36 Class II FOMC—Restricted (FR) Part 1: Summary and Outlook, June 18, 2008
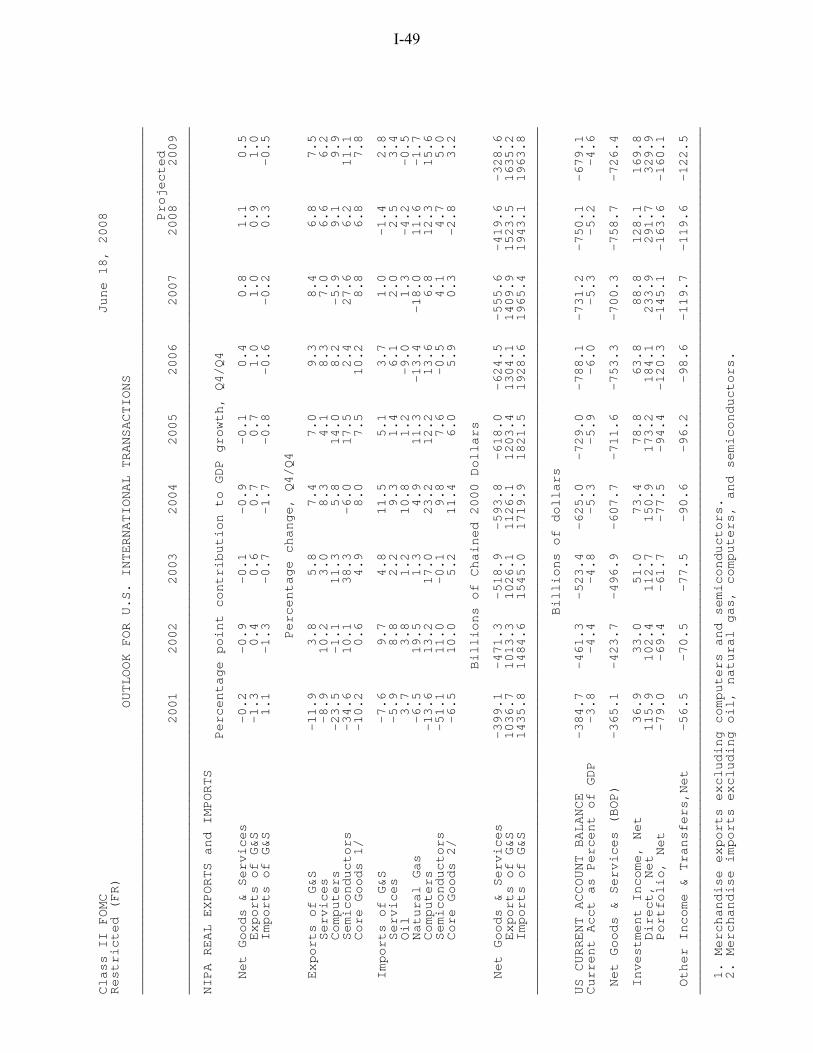
We increased our estimate of the contribution of real net exports to U.S. GDP growth ½ percentage point in the first quarter, to ¾ percentage point, as recent readings on imports have come in much weaker than we had anticipated. For the current quarter, we expect the contribution of net exports to increase to over 2 percentage points, boosted by strong exports and a large decline in real oil imports. The contribution of net exports is then expected to fall back to ½ percentage point in 2009, as the recovery of U.S. GDP growth strengthens imports. Compared with the April Greenbook, we marked down our projection for the contribution in the second half of 2008, largely in response to the stronger outlook for U.S. GDP. Our projection for 2009 is little changed from the April Greenbook.
Oil and Other Commodity Prices The spot price of West Texas Intermediate (WTI) crude oil has surged since the time of the April Greenbook, rising 14 percent to close at $134 per barrel on June 17. The price of the December 2016 futures contract has soared even more to $137 per barrel. In line with the path of futures prices, we project that the price of WTI crude oil will remain near $135 per barrel through next year. Relative to the April Greenbook, this projection is about $25 per barrel higher, on average, over the forecast period. Our ongoing analysis of oil market developments continues to suggest that current and prospective supply and demand conditions are the main drivers of oil prices, although we cannot rule out the possibility that other factors (such as speculative activities) may be at work.
Notwithstanding recent market chatter that Saudi Arabia may soon expand production, concerns about tighter supply conditions have increased since our previous forecast. First, labor strikes and militant attacks in Nigeria, a key supplier of light, sweet crude, have pushed the country’s oil production 10 percent below end-2007 levels. Second, tensions in the Middle East intensified following a statement coming out of Israel that was viewed as increasing the likelihood of an attack on Iran. Third, stock draws have pushed inventories for crude and petroleum products to low levels relative to historical norms. Finally, new estimates have raised questions about production capacity: The U.S. Energy Information Administration and the International Energy Agency (IEA) have recently marked down their estimates for non-OPEC supply growth; the IEA reduced its estimate of effective OPEC spare capacity to under 2 million barrels per day; and recent news reports indicate that the IEA is in the process of cutting its long-run projections of world oil supply.
International Developments Class II FOMC—Restricted (FR) I-37
On the demand side, higher prices are curbing oil consumption in advanced economies. However, global oil demand continues to expand, supported in many emerging market economies by solid economic growth and government fuel subsidies. The growing fiscal costs of these subsidies are prompting authorities in a number of these economies to allow their controlled prices to move higher. (Details on some of these adjustments are provided in the box on the next page.)
Since the time of the last Greenbook, the performance of nonfuel commodity prices has been mixed. Metals prices are down sharply, as prices of nickel and zinc have fallen to their lowest levels since early 2006. Prices of other metals, such as copper, tin, and aluminum, are also down from their March peaks but remain high compared with their levels in late 2007. By contrast, food prices are up sharply compared with our projections in the April Greenbook. Flooding in the U.S. Midwest has contributed to sharp increases in corn and soybean prices. Based on prices in spot and futures markets, we project that a trade-weighted average of nonfuel commodity prices will increase at an annual rate of 14 percent in the second quarter and thereafter remain roughly stable. Relative to the April Greenbook, the overall forecast is little changed, but this masks the effect of an increase of 12 percentage points in the growth rate of food prices that just offsets the effect of a decline of 16 percentage points in the growth rate of metals prices in the second quarter.
International Financial Markets Even though the major foreign central banks in the advanced foreign economies kept rates on hold, policymakers there have signaled greater concern about inflation pressures, which has raised expectations of future monetary tightening. As a result, yields on sovereign benchmark bonds in these economies have risen 20 to 50 basis points. In emerging market economies, a number of central banks have tightened policy since the April Greenbook to combat rising food and energy prices; yields on local-currency bonds in these economies have risen commensurately.
With indications of modest quarter-end pressures, conditions in domestic European interbank markets remain strained, but, on balance, are little changed from the time of the April Greenbook. The decision to increase the size of Federal Reserve swap lines with the European Central Bank (ECB) and Swiss National Bank has allowed these central banks to provide greater amounts of dollar funding to European banks, and demand at the auctions for those funds has been high.
I-38 Class II FOMC—Restricted (FR) Part 1: Summary and Outlook, June 18, 2008
Date of most recent price
increase
Increase in retail gasoline price (percent)
New price at pump* (US
dollars/gallon) China Nov. 07 9 2.74 India June 08 11 4.52
Indonesia May 08 29 2.45 Malaysia June 08 41 3.13 Taiwan May 08** 13 4.21
* Officially published data on gasoline prices after the latest price jumps are not generally available; the prices reported here are based on press reports and investment bank commentaries. ** Will go into effect on July 1.
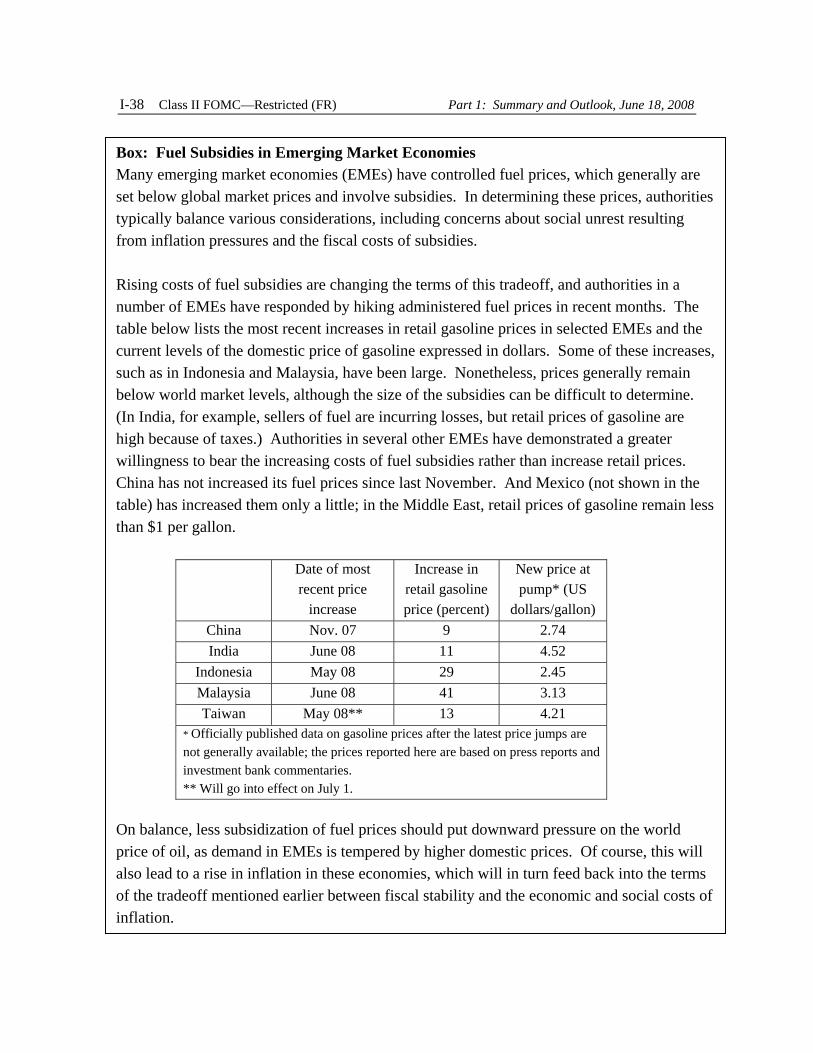
Box: Fuel Subsidies in Emerging Market Economies Many emerging market economies (EMEs) have controlled fuel prices, which generally are set below global market prices and involve subsidies. In determining these prices, authorities typically balance various considerations, including concerns about social unrest resulting from inflation pressures and the fiscal costs of subsidies.
Rising costs of fuel subsidies are changing the terms of this tradeoff, and authorities in a number of EMEs have responded by hiking administered fuel prices in recent months. The table below lists the most recent increases in retail gasoline prices in selected EMEs and the current levels of the domestic price of gasoline expressed in dollars. Some of these increases, such as in Indonesia and Malaysia, have been large. Nonetheless, prices generally remain below world market levels, although the size of the subsidies can be difficult to determine. (In India, for example, sellers of fuel are incurring losses, but retail prices of gasoline are high because of taxes.) Authorities in several other EMEs have demonstrated a greater willingness to bear the increasing costs of fuel subsidies rather than increase retail prices. China has not increased its fuel prices since last November. And Mexico (not shown in the table) has increased them only a little; in the Middle East, retail prices of gasoline remain less than $1 per gallon.
On balance, less subsidization of fuel prices should put downward pressure on the world price of oil, as demand in EMEs is tempered by higher domestic prices. Of course, this will also lead to a rise in inflation in these economies, which will in turn feed back into the terms of the tradeoff mentioned earlier between fiscal stability and the economic and social costs of inflation.
International Developments Class II FOMC—Restricted (FR) I-39
Investors have generally reacted negatively to news that a number of major European banks would take further write-downs for the first quarter. The resulting declines in financial share prices helped lead overall European equity indexes down about 5½ percent since the time of the April Greenbook. Although Japan’s equity indexes rose 6½ percent, other Asian equity indexes are generally down, led by the Shanghai composite, which fell 10 percent.
The trade-weighted nominal value of the dollar has moved in a fairly tight range. The major currencies index is up 2 percent on net since the last Greenbook and has tended to move with changes in the relative economic performance of the United States versus foreign economies and the perceived implications for monetary policies. The trade-weighted index of the dollar against the currencies of the other important trading partners of the United States has changed little on balance. Of note, the dollar has depreciated 1½ percent against the renminbi since mid-May, after having remained essentially unchanged against that currency through April and early May, but has appreciated against most other emerging Asian currencies.
The starting point for our projection of the broad real dollar is up about 1½ percent from that in the April Greenbook. Going forward, we project the broad real value of the dollar to depreciate at an annual rate of around 3 percent, about the same pace as in the April Greenbook.
Advanced Foreign Economies Real GDP in the advanced foreign economies grew at an annual rate of 1½ percent in the first quarter, buoyed by surprisingly strong growth in the euro area—concentrated in Germany—and in Japan. By contrast, Canada experienced a mild contraction, as exports fell and investment stalled. We project GDP growth in the advanced foreign economies to step down to 1 percent in the second quarter, largely reflecting a sharp slowing of activity in the euro area and in Japan, where recent indicators have been weak on balance. Beyond the second quarter, growth is projected to rise to 2½ percent by the end of 2009.
We expect headline inflation in the advanced foreign economies to remain elevated through the rest of the year, peaking at just below 3 percent in the third quarter (on a four-quarter basis), before gradually declining to a little less than 2 percent by the end of 2009 as energy prices are projected to level out. The sharpest pop-up in headline inflation among these economies has been in the United Kingdom, where we expect inflation to exceed 4 percent this year, requiring Governor King to write additional letters
I-40 Class II FOMC—Restricted (FR) Part 1: Summary and Outlook, June 18, 2008
to the Chancellor of the Exchequer. Inflation in the euro area should peak at 4 percent in the third quarter, and Canadian inflation is projected to rise to 2¾ percent by early next year.
Incoming inflation data and hawkish comments by foreign central bank officials have caused us to revise up our monetary policy assumptions. We now assume that both the ECB and the Bank of England will raise their policy interest rates later this year. We also assume that the Bank of Canada (BOC) will keep its policy rate unchanged through the end of 2009, rather than ease some in the near term. This assumption is in line with BOC’s June 10 statement that the stance of monetary policy was appropriate, given the increased upside risk to inflation coming from the oil market.
Our outlook for GDP growth in the advanced foreign economies for the remainder of 2008 is nearly ½ percentage point higher than projected in the April Greenbook, entirely reflecting stronger growth in Canada resulting from the upward revision to U.S. growth. In 2009, the growth outlook is a bit weaker across the advanced foreign economies. The largest downward revision is for the United Kingdom, where deteriorating conditions in housing markets are likely to weigh on activity. The continued escalation of oil prices has led us to revise up our forecast for inflation almost ¾ percentage point in 2008 and ¼ percentage point in 2009 relative to the April Greenbook.
Emerging Market Economies Real GDP growth in emerging market economies moderated further to an annual rate of 4¾ percent in the first quarter. Growth slowed more than expected in Latin America, but this was offset by stronger-than-anticipated activity in emerging Asia. In the current quarter, we estimate that growth will decline to 3¾ percent, little changed from the forecast presented in the April Greenbook. For the remainder of the year, our outlook continues to call for subpar growth as we project that anemic activity in the advanced economies will weigh on developing-country exports, although we expect this effect to be mitigated by solid domestic demand. In line with the recovery of activity in the advanced economies, we see growth rising to about 5½ percent by the end of 2009.
In emerging Asia, real GDP grew at a 7¾ percent rate in the first quarter, about 2 percentage points faster than in the fourth quarter. We look for growth to slow to roughly 5½ percent for the remainder of this year. This outlook is a little higher than in the previous Greenbook, as the positive effects of a stronger path for U.S. activity and mild impetus from earthquake-related reconstruction activities in China more than offset
International Developments Class II FOMC—Restricted (FR) I-41
the drag on growth from higher oil prices. In 2009, growth is projected to step up to a near-trend rate of about 6½ percent, similar to our previous forecast.
In the first quarter, output decelerated in Mexico and Brazil and declined in Venezuela. As a result, we now estimate that real GDP growth for Latin America fell from 4¼ percent in the fourth quarter to 2 percent. We expect growth to remain at about this pace in the current quarter. Growth should then rise to about 4½ percent by the end of 2009, in line with the projected path of U.S. activity. Relative to the April Greenbook, the Latin American growth outlook for the current quarter has been revised downward to reflect weakness of the latest Mexican indicators and U.S. manufacturing production, but it is up slightly for the remainder of the year as a result of the positive revision to U.S. activity.
Largely reflecting rising food and energy prices, consumer prices have accelerated in the emerging market economies, prompting a significant upward revision to our inflation outlook. We now estimate that inflation will rise to 6½ percent in the current quarter, 2¼ percentage points higher than projected in the April Greenbook. The increase in administered fuel prices in several countries, together with some earthquake-related effects in the case of China and Hong Kong, led us to mark up the forecast of inflation in emerging market economies for the third quarter as well, to 6¼ percent. Thereafter, inflation should taper off to 3½ percent in 2009, slightly higher than projected in the April Greenbook.
Prices of Internationally Traded Goods In April and May, core import prices continued to increase sharply, largely because of higher prices for material-intensive goods, especially metals. Prices for imported capital goods also rose sharply in April. For the second quarter as a whole, we project that core import prices will increase at an annual rate of 10½ percent, more than 2 percentage points faster than the first quarter pace. We revised up the current-quarter estimate 4½ percentage points from the April Greenbook, in light of the higher-than-expected readings for the monthly trade prices. Our read of the data continues to suggest that these surprisingly high rates of import price inflation are mostly attributable to a greater-than-usual effect from commodity prices on material-intensive import prices. That said, an increase in the responsiveness of import prices to exchange rate changes remains an important risk to the forecast.
I-42 Class II FOMC—Restricted (FR) Part 1: Summary and Outlook, June 18, 2008
Staff Projections of Selected Trade Prices (Percent change from end of previous period excepted as noted, s.a.a.r.)
NOTE. Prices for core exports exclude computers and semiconductors. Prices for core imports exclude computers, semiconductors, oil, and natural gas. Both price series are on a NIPA chain-weighted basis. The price of imported oil for multiquarter periods is the price for the final quarter of the period. Imported oil includes both crude oil and refined products.
In the third quarter, we project that core import prices will increase only 2½ percent, a pace consistent with the projected paths of commodity prices and the dollar. Compared with the April Greenbook, we marked down our projection for core import price inflation ½ percentage point as the current projected path for the dollar is stronger than in the previous Greenbook. We project that core import price inflation will fall further to 2 percent in the last quarter of 2008 and stabilize at 1½ percent in 2009, as commodity prices are projected to level off and as the dollar depreciates at a modest pace. Relative to the April Greenbook, the forecast for 2009 is little changed.
After increasing 12½ percent in the first quarter, we project that core export prices will rise 8½ percent in the second quarter. The deceleration largely reflects developments in the prices of agricultural exports (particularly wheat and soybeans), which fell sharply in April following 11 months of large increases. In May, prices of soybeans recovered sufficiently to offset the continued decline in wheat prices. We expect core export price inflation to slow further in the third quarter to 5½ percent, reflecting lower rates of inflation for metals and nonfuel intermediate inputs. Over the remainder of the forecast period, the projected flattening out of commodity prices should push core export price inflation down further.
International Developments Class II FOMC—Restricted (FR) I-43
Staff Projections for Trade in Goods and Services (Percent change from end of previous period, s.a.a.r.)
2007 2008 Projection
2008 Indicator H1 H2 Q1
Q2 H2 2009
Real exports 4.3 12.6 5.6 7.2 7.2 7.5 April GB 4.3 12.6 6.2 6.3 7.3 8.2
Real imports .5 1.4 -.5 -6.7 1.0 2.8 April GB .5 1.4 2.4 -8.2 -.3 3.9
NOTE. Changes for years are measured as Q4/Q4; for half-years, Q2/Q4 or Q4/Q2.
Trade in Goods and Services Real exports of goods and services grew 5½ percent at an annual rate in the first quarter, boosted by a robust increase in exports of services. We project that real exports will increase 7¼ percent in the current quarter and then continue to expand at about that pace through the end of the forecast period, supported by generally solid foreign GDP growth and past and prospective dollar depreciation. Relative to the April Greenbook, we increased our projection for real export growth nearly 1 percentage point in the second quarter, as the April trade data showed exports, particularly of capital goods, to have been stronger than we had expected. In 2009, we revised down our forecast ¾ percentage point on account of the higher level of the dollar.
Real imports of goods and services are estimated to have fallen ½ percent in the first quarter, with imports of automotive products showing particular weakness. This estimate is almost 3 percentage points lower than in the previous Greenbook, as weaker-than-expected imports of goods in March more than offset stronger-than-expected imports of services. In the current quarter, real imports are projected to fall 6¾ percent, reflecting a steep decline in real oil imports, largely due to residual seasonality. Non-oil imports are projected to be roughly flat in the second quarter, in line with weak U.S. growth and high non-oil import price inflation. We have revised up our forecast for overall real import growth 1½ percentage points in the second quarter, largely on account of stronger-than-expected imports of non-oil goods in April.
Real imports are expected to rise modestly in the second half of 2008 and then gain momentum, accelerating to nearly a 3 percent pace in 2009, as U.S. growth strengthens and non-oil import price inflation steps down. Our forecast for the second half of 2008 is
I-44 Class II FOMC—Restricted (FR) Part 1: Summary and Outlook, June 18, 2008
1 Given recent volatility in oil markets, a large decline in oil prices may be as relevant as the increase we consider here. In SIGMA, a decline in the price of oil would roughly have effects equal in magnitude but opposite in direction from those reported here.
about 1¼ percentage points higher than in the April Greenbook, as we expect real oil imports to bounce back from their downwardly revised level in the second quarter. For 2009, we revised down our forecast of real import growth 1 percentage point, in line with the lower projected rate of U.S. GDP growth.
Alternative Simulations In our baseline forecast, U.S. core PCE inflation edges down to 2 percent by the end of 2009. We consider two simulations using our SIGMA model to assess the effects of external shocks that would push inflation higher.
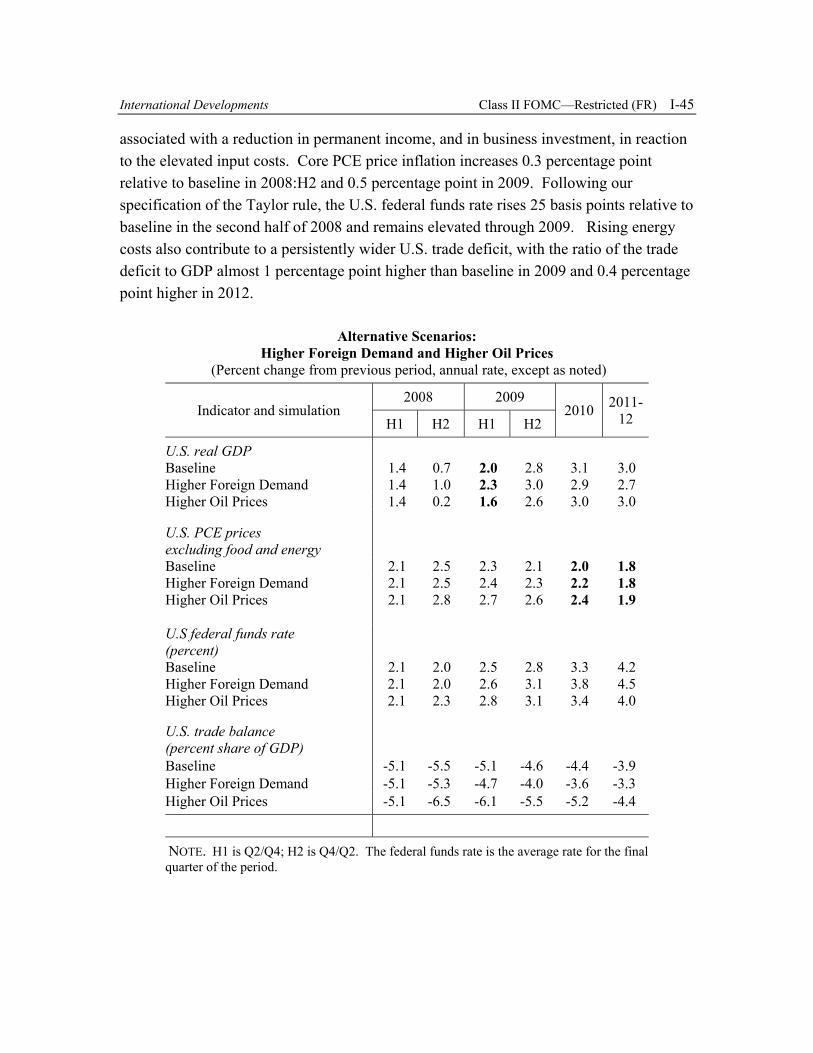
Our first simulation examines the effects of greater-than-expected strength in foreign demand. This shock begins in the third quarter of 2008 and is calibrated so that GDP in major trading partners gradually rises to 2 percent above baseline by 2010:Q2, after which the shock slowly dies away. U.S. real net exports increase because of higher foreign spending and a depreciation of the dollar. As a result, U.S. GDP growth rises about 0.3 percentage point relative to baseline in 2008:H2 and 0.2 percentage point in 2009. The increase in output is damped to some extent by the U.S. monetary policy response, with the federal funds rate rising about 50 basis points above baseline by the second half of 2010. Higher import prices and greater resource utilization put upward pressure on core PCE inflation, which rises 0.2 percentage point above baseline in 2009 and 2010. The combination of stronger foreign activity and a depreciated dollar contribute to an improvement of the ratio of the trade balance to GDP that peaks at 0.8 percentage point of GDP relative to baseline in 2010. In the longer term, U.S. GDP falls below baseline, in part because of the monetary policy response—higher U.S. real interest rates crowd out investment spending and contribute to a sustained reduction in the capital stock.
Our second simulation examines an adverse supply shock that causes the real price of oil to rise 50 percent relative to our baseline path starting in the third quarter of 2008.1 Both households and firms are assumed to understand that the shock is permanent. In reaction to the higher oil prices, U.S. real GDP growth falls about 0.5 percentage point below baseline in the second half of 2008 and 0.3 percentage point in 2009 before recovering at the end of 2010. The decline in U.S. activity reflects drops both in consumer spending,
International Developments Class II FOMC—Restricted (FR) I-45
Alternative Scenarios:
Higher Foreign Demand and Higher Oil Prices (Percent change from previous period, annual rate, except as noted)
Indicator and simulation 2008 2009
2010 2011-12 H1 H2 H1 H2
U.S. real GDP Baseline 1.4 0.7 2.0 2.8 3.1 3.0 Higher Foreign Demand 1.4 1.0 2.3 3.0 2.9 2.7 Higher Oil Prices 1.4 0.2 1.6 2.6 3.0 3.0
NOTE. H1 is Q2/Q4; H2 is Q4/Q2. The federal funds rate is the average rate for the final quarter of the period.
associated with a reduction in permanent income, and in business investment, in reaction to the elevated input costs. Core PCE price inflation increases 0.3 percentage point relative to baseline in 2008:H2 and 0.5 percentage point in 2009. Following our specification of the Taylor rule, the U.S. federal funds rate rises 25 basis points relative to baseline in the second half of 2008 and remains elevated through 2009. Rising energy costs also contribute to a persistently wider U.S. trade deficit, with the ratio of the trade deficit to GDP almost 1 percentage point higher than baseline in 2009 and 0.4 percentage point higher in 2012.