Prefatory Note The attached document represents the most complete and accurate version available based on original files from the FOMC Secretariat at the Board of Governors of the Federal Reserve System. Please note that some material may have been redacted from this document if that material was received on a confidential basis. Redacted material is indicated by occasional gaps in the text or by gray boxes around non-text content. All redacted passages are exempt from disclosure under applicable provisions of the Freedom of Information Act. Content last modified 03/07/2014.
Transcript
Prefatory Note The attached document represents the most complete and accurate version available based on original files from the FOMC Secretariat at the Board of Governors of the Federal Reserve System. Please note that some material may have been redacted from this document if that material was received on a confidential basis. Redacted material is indicated by occasional gaps in the text or by gray boxes around non-text content. All redacted passages are exempt from disclosure under applicable provisions of the Freedom of Information Act.
Content last modified 03/07/2014.
Class III FOMC - Internal (FR)
CURRENT ECONOMICAND FINANCIAL CONDITIONS
Part 2
Recent Developments
Prepared for the Federal Open Market Committeeby the staff of the Board of Governors of the Federal Reserve System
June 18, 2008
Class III FOMC - Internal (FR)
June 18, 2008
Recent Developments
Prepared for the Federal Open Market Committeeby the staff of the Board of Governors of the Federal Reserve System
Domestic NonfinancialDevelopments
Domestic Nonfinancial Developments
II-1
The economy appears to have remained soft in recent months but does not yet show the sharp break in activity that has been characteristic of most recessions in the past. Consumer sentiment has fallen to historically low levels this spring, and sales of motor vehicles have dropped noticeably, although other consumer spending has held up well. Investment in business equipment appears to have slipped a bit further in the second quarter, and homebuilding remained on a steep descent. Manufacturing activity deteriorated in April and May, and forward-looking indicators suggest that conditions in this sector will remain soft. In the labor market, payroll employment continued to post modest declines in April and May, and the unemployment rate jumped to 5.5 percent. While core consumer price inflation has remained relatively stable in recent months, headline inflation has remained elevated because of continued large increases in food and energy prices.
Labor Market Developments Labor demand remains on a gradual downward descent. Private payroll employment fell an average of 53,000 per month in April and May following average declines of 97,000 per month in the first quarter.1 Declines have been widespread during the first five months of the year, with the notable exceptions of nonbusiness services such as education, health, and food services. Meanwhile, the workweek held steady at 33.7 hours in May, the same as its first-quarter average. And aggregate hours of production and nonsupervisory workers on private nonfarm payrolls fell at an average monthly rate of 0.2 percent over the past two months.
In the household survey, the unemployment rate jumped to 5.5 percent in May from 5 percent in April. Last month’s increase was accompanied by a rise in the labor force participation rate, especially among those aged 16 to 24, and we think that some of the surge in the unemployment rate may be related to difficulties in adjusting for seasonal flows of young people into the labor force.2 Nevertheless, unemployment rates rose in
1 Payroll employment in recent months has been held down by a strike at American Axle &
Manufacturing, which ended on May 22. The strike affected production at nine General Motors (GM) truck assembly plants and nearly two dozen parts plants at various times over the past three months. In addition, contract disputes over local issues—which had shut down two GM assembly plants for several weeks—were also resolved near the end of May. Neither the workers on strike nor those indirectly affected by the strikes returned to work in time to be counted in the May employment figures. We expect their return to add between 20,000 and 30,000 to the change in employment in June.
2 Indeed, unemployed re-entrants and new entrants accounted for the bulk of the increase in unemployment in May. Since young people are primarily labor force entrants, May’s rise in entrants corroborates the notion that seasonal flows were part of the story behind the jump in unemployment in May.
II-2
2000 2002 2004 2006 2008-400
-300
-200
-100
0
100
200
300
400
-400
-300
-200
-100
0
100
200
300
400Thousands
2000 2002 2004 2006 2008
May
3-month moving average
Changes in Private Payroll Employment
2000 2002 2004 2006 200833.0
33.5
34.0
34.5
35.0 Hours
94
96
98
100
102
104
106
108
1102002 = 100
2000 2002 2004 2006 2008
Workweek(left scale)
Aggregate hours (right scale)
May
Aggregate Hours and Workweek of Production or Nonsupervisory Workers
Changes in Employment(Thousands of employees; seasonally adjusted)
1. Nonbusiness services comprises education and health, leisure and hospitality, and "other." 2. Establishment survey. Annual data are percent changes from Q4 to Q4. Quarterly data are percent changes from precedingquarter at an annual rate. Monthly data are percent changes from preceding month. 3. Establishment survey.
II-3
2000 2001 2002 2003 2004 2005 2006 2007 200865.6
65.8
66.0
66.2
66.4
66.6
66.8
67.0
67.2
67.4
67.6 Percent
3.0
3.5
4.0
4.5
5.0
5.5
6.0
6.5Percent
2000 2002 2004 2006 2008
Unemployment rate(right scale)
Participationrate (left scale)
May
Labor Force Participation Rateand Unemployment Rate
2000 2001 2002 2003 2004 2005 2006 2007 20080.6
0.8
1.0
1.2
1.4
0.6
0.8
1.0
1.2
1.4Percent
2000 2002 2004 2006 2008
3-month moving average (thick line)
Job Losers UnemployedLess Than 5 Weeks
(as a percent of household employment)
May
2000 2001 2002 2003 2004 2005 2006 2007 20081.0
1.5
2.0
2.5
3.0
3.5
4.0
1.0
1.5
2.0
2.5
3.0
3.5
4.0Percent
2000 2002 2004 2006 2008
May
Unemployed Due to Job Loss(as a percent of the labor force)
2000 2001 2002 2003 2004 2005 2006 2007 20082.0
2.4
2.8
3.2
3.6
4.0
2.0
2.4
2.8
3.2
3.6
4.0Percent of household employment
2000 2002 2004 2006 2008
May
Persons Working Part Timefor Economic Reasons
Selected Unemployment and Labor Force Participation Rates(Percent; seasonally adjusted)
2007 2008
Rate and group 2007 Q3 Q4 Q1 Mar. Apr. May
Civilian unemployment rateTotal 4.6 4.7 4.8 4.9 5.1 5.0 5.5 Teenagers 15.7 15.8 16.4 16.8 15.8 15.4 18.7 20-24 years old 8.2 8.6 8.6 9.0 9.3 8.9 10.4 Men, 25 years and older 3.6 3.6 3.7 3.8 4.0 4.0 4.2 Women, 25 years and older 3.6 3.7 3.8 3.9 4.1 3.9 4.1
Labor force participation rateTotal 66.0 66.0 66.0 66.0 66.0 66.0 66.2 Teenagers 41.3 40.7 41.0 40.3 39.8 41.1 42.6 20-24 years old 74.4 74.4 74.0 73.9 73.9 74.2 75.0 Men, 25 years and older 75.6 75.6 75.5 75.5 75.4 75.2 75.2 Women, 25 years and older 59.7 59.8 59.7 59.9 60.1 60.0 60.0
II-4
Labor Market Indicators
2000 2002 2004 2006 20081.0
1.5
2.0
2.5
3.0
3.5
4.0 Millions
250
300
350
400
450
500
550Thousands
2000 2002 2004 2006 2008
Initial claims(right scale)
June 7
Insured unemployment (left scale)
May 31
Note. 4-week moving averages.
Unemployment Insurance
2000 2002 2004 2006 20080
50
100
150
200
250
300 Thousands
0.8
1.0
1.2
1.4
1.6
1.8Percent of private employment
2000 2002 2004 2006 2008
Apr.
Layoffs and discharges(monthly, right scale)
May
Announced job cuts(left scale)
Note. Both series are seasonally adjusted by FRB staff. Source. For layoffs and discharges, Job Openings andLabor Turnover Survey; for job cuts, Challenger, Gray,and Christmas, Inc.
Layoffs and Job Cuts
2000 2002 2004 2006 20080
5
10
15
20
25
30
0
5
10
15
20
25
30Percent
2000 2002 2004 2006 2008
Manpower, Inc.
National Federation ofIndependent Business*(3-month moving average)
Q3
May
Note. Percent planning an increase in employmentminus percent planning a reduction. *Seasonally adjusted by FRB staff.
Net Hiring Plans
2000 2002 2004 2006 20081.5
2.0
2.5
3.0
3.5
4.0
4.5
1.5
2.0
2.5
3.0
3.5
4.0
4.5Percent of private employment
2000 2002 2004 2006 2008
Apr.
Job openings
Hires (monthly)
Source. Job Openings and Labor Turnover Survey.
Job Openings and Hires
2000 2002 2004 2006 200830
45
60
75
90
105
120
30
45
60
75
90
105
120Index
2000 2002 2004 2006 2008
June(p)
Reuters/Michigan
May
Conference Board
Note. The proportion of households expecting labormarket conditions to improve, minus the proportion expectingconditions to worsen, plus 100. p Preliminary.
Expected Labor Market Conditions
2000 2002 2004 2006 200810
15
20
25
30
35
40
45 Percent
10
30
50
70
90
110
130
150Index
2000 2002 2004 2006 2008
Job Availability and Hard-to-Fill Positions
*Proportion of households believing jobs are plentiful, minus the proportion believing jobs are hard to get, plus 100. **Percent of small businesses surveyed with at least one"hard-to-fill" job opening. Seasonally adjusted by FRB staff. Source. For job availability, Conference Board; for hard-to-fill, National Federation of Independent Business.
1. Staff estimates. 2. Assumes that the growth rate of hours of non-employees equals the growth rate of hours of employees. 3. All corporations doing business in the United States except banks, stock and commodity brokers,and finance and insurance companies. The sector accounts for about two-thirds of business employment.Nonfinancial corporate output is calculated as an income-side measure.
older age groups as well, albeit by not as much as for young people, and the number of unemployed job losers increased further in May. On average over the past two months, the unemployment rate has moved up about ¼ percentage point from its first-quarter average of 4.9 percent to a level that is ¾ percentage point above its recent low at the end of 2006.
Some—but not all—indicators of labor market conditions have also continued to worsen. In the household survey, job losers unemployed less than five weeks have risen further as a percentage of employment since March, and the fraction of workers who are working part time for economic reasons has continued to move up. In addition, perceptions of job availability in the Conference Board survey and of the difficulty of filling vacancies in the National Federation of Independent Business (NFIB) survey have eroded further since March, as have households’ expectations for labor market conditions in the Reuters/University of Michigan and Conference Board surveys. Moreover, the most recent readings on net hiring plans from both the Manpower and NFIB surveys moved down, and the level of insured unemployment has continued to move up. However, in the Job Openings and Labor Turnover survey, the job openings rate and the hiring rate both turned up in April (the latest available data), while the rate of layoffs and discharges fell back toward last summer’s levels.
The staff estimates that productivity in the nonfarm business sector rose at an annual rate of 2¾ percent in the first quarter, which brought the increase over the previous four quarters to 3¼ percent. The increase in productivity over the past year is quite robust, especially given the concurrent weakening in economic growth. However, the strong gains in productivity follow a year of particularly sluggish productivity growth.
II-6
Selected Components of Industrial Production (Percent change from preceding comparable period)
Industrial Production Industrial production (IP) moved down 0.2 percent in May after a 0.7 percent drop in April. This recent weakness has not been confined to motor vehicles and construction supplies; the three-month IP diffusion index remained below 50 in May after falling sharply in April. Manufacturing output also fell in April and was unchanged in May, putting the index on track to post its third consecutive quarterly decline. The factory operating rate dipped to 77.5 percent in May, a level 2.2 percentage points below its long-run average.
Motor vehicle production moved up in May even though assemblies were held down by weak demand and strikes at several plants. We estimate that these strikes reduced production at General Motors by almost 1 million units (annual rate) from March to May. At the same time, soft demand for full-size pickups and sport-utility vehicles led other domestic producers to scale back their assembly rates.
The modest pace of vehicle production over the past few months has kept inventories in check even as sales have plunged. Days’ supply at the end of May stood at 69, a level only somewhat higher than the desired ratio. With the end of several strikes in May, the automakers plan to increase the pace of assemblies in June to an annual rate of 10.1 million units. If realized, this rebound in assemblies and parts production would contribute nearly ¼ percentage point to the change in IP in June. Initial plans for assemblies in the third quarter call for production to step up further.
High-tech production decelerated further in April and May after growth slowed sharply in the first quarter. Computer output increased ½ percent, on average, in April and May, well below its pace of 2007. The output of communications equipment slowed in May after having risen at a solid pace in April. Semiconductor production also decelerated in April and May, as continued weakness in the demand for cell phones and consumer PCs resulted in slower production for some chip types.
Looking ahead, available indicators point to only modest gains in high-technology output in the next few months. The International Data Corporation recently revised down its 2008 forecast for PC demand and expects unit sales only to edge up this quarter. In addition, recent statements from Dell and Hewlett-Packard have expressed concern about weak U.S. demand. And guidance by telecommunications service providers suggests that their capital expenditures will decline in the remainder of the year. For semiconductors, Intel’s revenue guidance for the second quarter is consistent with a solid increase in microprocessor output, but in other chip categories, efforts to pare elevated inventories
II-8
Production of Domestic Light Vehicles(Millions of units at an annual rate except as noted)
Memo: U.S. production, total motor vehicles4 10.5 9.9 9.0 10.5 8.4 8.6 10.1 10.5
Note. FRB seasonals. Components may not sum to totals because of rounding. 1. Production rates for the second and third quarters reflect the latest industry schedules. 2. Quarterly values are calculated with end-of-period stocks and average reported sales. 3. End-of-period stocks. 4. Includes medium and heavy trucks. n.a. Not available.
Using sales in current monthUsing 3-month moving average of sales
Days’ Supply of Light Vehicles
II-9
Indicators of High-Tech Manufacturing Activity
2002 2003 2004 2005 2006 2007 2008 80
100
150
200
250
300
350400
May
2002 = 100, ratio scale
Computers
Communications equipment
Semiconductors
Industrial Production in the High-Tech Sector
2002 2003 2004 2005 2006 2007 20080.40
0.45
0.50
0.55
0.60
0.65
0.70
0.75
0.80
11.011.512.012.513.013.514.0
15.0
16.0
17.0
18.0
19.0
Q2
Millions of units, ratio scale
PCs (right scale)
Servers (left scale)
Millions of units, ratio scale
Note. FRB seasonals. PCs include desktops, notebooks, ultraportables, and x86 PC servers. The Q2 value for PCs is a forecastby IDC.
Q1
U.S. Personal Computer and Server Absorption
2000 2001 2002 2003 2004 2005 2006 2007 200830
35
40
45
50
55
60
657075
Annual average2008 guidance
Note. FRB seasonals. Includes AT&T, Verizon, Sprint Nextel,and companies related by merger, acquisition, or spinoff. Source. SEC filings. Guidance from Dell’Oro.
Q1
Billions of dollars, ratio scale
Capital Expenditures by Selected Telecommunications Service Providers
2002 2003 2004 2005 2006 2007 2008-4
-2
0
2
4
6
8
10
12
14
May
Note. 3-month moving average. MPU is a microprocessor unit.
Percent
MPUsNon-MPUs
Rate of Change in SemiconductorIndustrial Production
1996 1998 2000 2002 2004 2006 2008 60
70
80
90
100
110
120
130
Q1
Note. The staff’s chip inventory index is a sales-weighted chain-type index constructed from financial data for 10 major chip manufacturers. Source. Financial reports.
1995 = 100
FRB Chip Inventory Index
2002 2003 2004 2005 2006 2007 2008 80
100
120
140
160
180
Apr.
Note. U.S. and Canadian shipments of bare and loaded circuitboards. Source. Institute for Printed Circuits.
Billions of dollars
ShipmentsOrders
Circuit Board Orders and Shipments
II-10
Indicators of Industrial Activity
2002 2003 2004 2005 2006 2007 200835
40
45
50
55
60
65
70
Note. The diffusion index equals the percentage of series thatincreased over 3 months plus one-half the percentage that wereunchanged.
May
Index
Manufacturing IP Diffusion Index
2002 2003 2004 2005 2006 2007 20080.1
0.2
0.3
0.4
0.5
0.6
7.5
8.5
9.5
10.5
11.5
12.5
13.5Millions of unitsMillions of units
+ June
Medium and heavy trucks(left scale)
Note. June values are based on latest industry schedules.
+
Autos and light trucks (right scale)
Motor Vehicle Assemblies
2002 2003 2004 2005 2006 2007 200815
16
17
18
19
20
21
22
22
23
24
25
26
27
28
29
30
Imports/domestic absorption (right scale)
Exports/shipments (left scale)
Note. Trade shares are 3-month moving averages. Source. Department of Commerce.
Percent
Apr.
Percent
Trade Shares
2002 2003 2004 2005 2006 2007 2008 96
98
100
102
104
106
108
110
112
114
Construction supplies
Durable materialsMay
Note. Data exclude motor vehicle parts, high-tech, and aircraftparts industries.
2002 = 100, ratio scale
IP: Construction Supplies and Durable Materials
2002 2003 2004 2005 2006 2007 2008
-2
-1
0
1
2
3
4
30
35
40
45
50
55
60
65
70
75
80Percent
ISM (right scale)
RADGO (left scale)
Note. The measure for real adjusted durable goods orders(RADGO) is a 3-month moving average. The diffusion index equalsthe percentage of respondents reporting greater levels of neworders plus one-half the percentage of respondents reportingthat new orders were unchanged.
May
Diffusion index
Apr.
New Orders: ISM Survey and Change in RealAdjusted Durable Goods Orders
2002 2003 2004 2005 2006 2007 200830
35
40
45
50
55
60
65
70
75
80
Note. Regional average includes new orders indexes from theChicago, Dallas, Kansas City, New York (Empire State), Philadelphia,and Richmond surveys.
Regional average
Empire State
JuneMay
Diffusion index
New Orders Diffusion Indexes: Empire Stateand Average of Regional Surveys
II-11
may restrain production. Meanwhile, the book-to-bill ratio for circuit boards climbed back above 1 after several months of declining orders.
Output excluding the energy, high-tech, and motor vehicles sectors moved down in April and May. The index for business equipment contracted nearly 2 percent in April and slipped further in May as the production of industrial and other equipment declined. Output of consumer goods decreased in April and May, with particularly weak production of durable consumer goods.
Output of construction supplies, which fell in April and edged down in May, has declined nearly 10 percent since its peak in January 2006. Output of products associated with nonresidential construction, which had previously offset some of the production losses related to residential investment, has turned down in recent months. Production of durable materials that are destined for further processing in the industrial sector also stepped down in April and May after having been unchanged, on balance, since mid-2007.
Forward-looking indicators of production have been mixed; on balance, they suggest continued softness in the manufacturing sector. The three-month moving average of real adjusted durable goods orders has increased, on net, since the start of the year. Although the May reading of the Institute for Supply Management (ISM) diffusion index for new orders edged up, this index continued to suggest declining orders. Meanwhile, the Empire State new orders diffusion index moved down to a modestly negative level in June, while other regional new orders indexes remained at more neutral levels through May. And the inventory-shipments ratio from the staff’s flow-of-goods system has trended upward in recent months, which may imply production cutbacks in the future.
Motor Vehicles Demand for light vehicles has deteriorated significantly in recent months. Sales tumbled to an average annual rate of 14.3 million units in April and May, nearly 1 million units below the pace in the first quarter.
. In addition, the sharp increase in gasoline prices over the past few months appears to have accelerated the shift in consumer demand away from trucks and toward cars: The share of pickups, vans, and sport-utility vehicles in total sales plunged in April and May, while the share of small cars shot up. As a result, the domestic market share of the Detroit Three automakers, which rely heavily on sales in the full-size pickup and sport-utility categories, has continued to move down.
II-12
Sales of Light Vehicles(Millions of units at an annual rate; FRB seasonals)
Note. Components may not sum to totals because of rounding. 1. Excludes some vehicles produced in Canada that are classified as imports by the industry. 2. Domestic market share excludes sales of foreign brands affiliated with the Detroit Three.
2006 2007 2008
Percent
0.10
0.14
0.18
0.22
0.26
0.30
0.34
0.38
0.42
Small cars
Large andmidsize cars
Pickup/van/SUV
Cross utility
Market Share of Light Vehicles by Segment
Note. Data through May. FRB seasonals.
-8
4
16
28
40
52
64
76
88 Percent
40
60
80
100
120
140
160
180Index
2002 2003 2004 2005 2006 2007 2008
JuneBad time to buy:Gas prices and shortages
(left scale)
Appraisal of car-buying conditions (right scale)
Car-Buying Attitudes
Source. Reuters/University of Michigan Survey.
m1ars02
Typewritten Text
Content redacted.
m1pmg01
Typewritten Text
Content redacted.
II-13
Indicators suggest that motor vehicle sales will fall further in June. The availability of cash rebates and cut-rate financing has decreased so far in June, and consumers’ views of car-buying conditions have continued to deteriorate.
.
Consumer Spending Real personal consumption expenditures (PCE) rose at an annual rate of 1 percent in the first quarter, but spending appears to have picked up moderately since then. In light of the latest retail sales data, we estimate that real expenditures on goods other than motor vehicles increased a robust ½ percent, on average, in April and May—although, as just noted, retail purchases of motor vehicles have been quite weak. Outside of the volatile energy category, real outlays on services were also reported to have expanded through April. However, real-time estimates for services are often extrapolations of past trends that may not reflect the actual pace of spending.3
While spending in May appears to have received a boost from the tax rebates, the fundamentals for consumer spending have deteriorated. In particular, real income has increased at an average annual rate of just 1 percent since last summer, as labor market conditions have deteriorated and rising food and energy prices have put a sizable dent in consumers’ purchasing power.4 In addition, the ratio of household wealth to income dropped sharply in the fourth and first quarters, developments that reflect declining values of both equities and houses. As measured by the Reuters/Michigan and Conference Board surveys, consumer sentiment dropped again in May, continuing the vertiginous decline that began last summer. Sentiment fell further in the preliminary Reuters/Michigan survey for June. Both measures of consumer sentiment stand near the low points reached during the 1990-91 recession. On a more positive note, consumer credit supply conditions do not appear to have worsened. Interest rates on consumer loans continue to decline in response to the drop in short-term interest rates, and growth in consumer credit has not yet slowed despite reports of tight terms and standards.
3 Because the Bureau of Economic Analysis (BEA) lacks timely data on many categories of services
consumption, spending on services has been subject to noticeable downward revisions around the start of downturns in economic activity.
4 The weakness in real income is evident despite a notable upward revision of $26 billion to the BEA’s estimate of nominal wages and salaries in the fourth quarter—reflecting information from unemployment insurance tax records—and a boost to wages and salaries in January through March from an estimated temporary increase of $15 billion in bonus payments.
II-14
Retail and Food Services Sales(Percent change from preceding period; seasonally adjusted current dollars)
1. Total sales less outlays at building material and supply stores and automobile and other motorvehicle dealers. 2. Total goods spending excluding autos and trucks. The values for March, April, and Q1 are staffestimates. The value for May is a staff forecast.
2004 2005 2006 2007 2008-2.0
-1.5
-1.0
-0.5
0.0
0.5
1.0
1.5
2.0
-2.0
-1.5
-1.0
-0.5
0.0
0.5
1.0
1.5
2.0Percent
Note. The values for March and April are staff estimates.The value for May is a staff forecast.
Mobile homes Shipments .096 .096 .093 .092 .091 .092 n.a.
Condos and co-ops Existing home sales .713 .701 .608 .560 .580 .550 n.a.
1. Adjusted permits equal permit issuance plus total starts outside of permit-issuing areas. 2. Number outstanding at end of period. Excludes permits that have expired or have been canceled,
abandoned, or revoked. Not at an annual rate. 3. At current sales rate; expressed as the ratio of seasonally adjusted inventories to seasonally adjusted
sales. Quarterly and annual figures are averages of monthly figures. n.a. Not available.
Private Housing Starts and Permits(Seasonally adjusted annual rate)
Single-family starts (right scale)
Single-family adjusted permits (right scale)
May
Note. Adjusted permits equal permit issuance plus total starts outside of permit-issuing areas.
Multifamily starts (left scale)May
II-17
Housing Activity in the housing sector remains very weak. In May, single-family starts dropped to an annual rate of 674,000 units. This pace of construction is 36 percent below its level in July 2007, before the escalation of the turmoil in mortgage markets, and 63 percent below its peak in early 2006. Adjusted permits—an informative indicator of housing starts in the following month—slid to an annual rate of 631,000 units in May. Multifamily starts were at an annual rate of 301,000 units in May, only somewhat below their average since 1995.
Although production cuts have helped pare inventories of new single-family homes by 20 percent since their peak, new home sales have continued to deteriorate sharply, which has pushed up the months’ supply of new homes for sale to levels not seen since the early 1980s. The Census Bureau’s measure of new sales agreements dropped another 7½ percent in March and April.
.5
Meanwhile, sales of existing single-family homes have also been little changed, on net, so far this year after having fallen 14 percent in the latter half of 2007. The index of pending home sales—an indicator of existing home sales one or two months hence—jumped in April to its highest reading in six months.
Much of the deterioration of the housing sector since mid-2007 is associated with the drag on demand from tight conditions in mortgage credit markets. These problems are particularly apparent for nonconforming mortgages that cannot be purchased by government-sponsored enterprises (GSEs)—such as nonprime and nonconforming jumbo mortgages—for which spreads relative to conforming loans have remained elevated and new originations have fallen dramatically. Moreover, although recent legislation created a new class of conforming loans with higher loan limits in high-priced cities, the market for these new jumbo conforming loans has been slow to develop, and offer rates for these loans are still 25 to 50 basis points above those for standard conforming loans.6 In contrast, conditions in the conforming market are much better, as rates for standard
5
.
6 Even before the mortgage-market turmoil, offer rates for prime jumbo loans were about 25 basis points above those in the conforming market, likely because of a higher risk of prepayment and the lower liquidity of private-label mortgage-backed securities.
II-18
Indicators of Single-Family Housing
Existing Single-Family Home Sales Millions of units
6_5
(annual rate) Index (2001=100) 140
6.0
5.5
5.0
4.5
40
30
20
-10
-20
Source. National Association of Realtors.
New Home Sales Months' Supply
Months' supply (right scale)
Note. . Months'
130
120
110
100
90
80
10
9
8
7
6
5
4
3
2
supply is calculated using the 3-month moving average of sales. Source.
for months' supply, Census Bureau.
Prices of Existing Homes
Percent change, annual rate 40
Quarterly OFHEO purchase-only index Monthly OFHEO purchase-only index 30 Case-S hiller 1 D-eity p ·ce index
3~n'ib~-t~~~r~~!'c~~W3~~nd monthly OFHEO indexes are
Source. For purchase-only indexes, OFHEO; for Case-Shiller, Chicago Mercantile Exchange.
20
10
0
-10
-20
New Single-Family Home Sales Millions of units
1_5
(annual rate)
1.3
1.1
0.9
0.7
0.5
Note:
Source. for sales agreements, Census Bureau.
Mortgage Rates
Percent 9
8
7
6
5
4
Note. The June readings are for data through June 11, 2008.
Price of New Homes
20 Percent change from preceding period, annual rate
20 Constant quality index
15 15
10 10
5 5
0
-5 -5
-10 -10
Source. Census Bureau.
m1pmg01
Typewritten Text
Content partially redacted.
m1ars02
Typewritten Text
Content partially redacted.
II-19
7 However, these rates are now available to fewer buyers, as the GSEs have adopted more-stringent
lending standards and are charging higher “delivery fees” for loans to borrowers with lower credit scores and less collateral.
30-year fixed-rate mortgages—at about 6¼ percent—remain low by historical standards.7 Beyond their effect on housing demand, financial market conditions may also be crimping the supply of new housing. Recent anecdotes from builders suggest that tightening lending standards for acquisition, development, and construction loans are putting downward pressure on planned building activity, even in markets that have not experienced an appreciable reduction in demand.
House prices continue to fall. The monthly version of the purchase-only repeat-sales price index calculated by the Office of Federal Housing Enterprise Oversight (OFHEO) decreased at an annual rate of 4¼ percent over the three months ending in March. The 10-city version of the Case-Shiller repeat-sales price index—which, unlike the OFHEO index, includes houses financed by nonconforming loans and is more heavily concentrated in urban areas that had seen a more substantial run-up of house prices—tumbled at an annual rate of 26 percent over the same period. Meanwhile, the constant-quality price index for new homes fell at an annual rate of 10 percent in the first quarter. Although these lower prices may eventually help bolster sales, the large proportion of respondents in the Reuters/Michigan survey who expect further declines in house prices over the coming year may signal ongoing hesitation to enter the market on the part of many prospective buyers.
Equipment and Software Real spending on equipment and software (E&S) appears to be moving down further in the second quarter after a slight decrease in the first quarter. Business outlays for motor vehicles have declined substantially, and real E&S excluding transportation appears to have been roughly flat since the beginning of the year. The fundamental determinants of E&S spending are largely consistent with the slowdown we have seen to date, as business output growth has decelerated and the user cost of capital has not declined at the rapid pace seen in earlier years.
On balance, monthly surveys of business conditions—both national and regional—remain downbeat. In addition to its monthly survey, the ISM released its semiannual economic forecast in May: For the first time since 2003, the number of manufacturing firms expecting a decrease in their capital expenditures in the current year now slightly exceeds the number expecting an increase. Most corporate bond yields have increased
II-20
2000 2002 2004 2006 200870
90
110
130
150
170
190210
240
7
9
11
13
15
17
1921
242000 = 100 Billions of chained (2000) dollars
2000 2002 2004 2006 2008
Apr.
May
Note. Ratio scales. Shipments are deflated by the staffprice index for computers and peripheral equipment, which is derived from the BEA’s quality-adjusted price indexes.
Real M3shipments
(right scale)
Industrial production(left scale)
Computers and Peripherals
2000 2001 2002 2003 2004 2005 2006 2007 20082
5
8
11
14
1720
2
5
8
11
14
1720
Billions of chained (2000) dollars, ratio scale
2000 2002 2004 2006 2008
Apr.
Note. Shipments and orders are deflated by a price index that is derived from the BEA’s quality-adjusted price indexesand uses the PPI for communications equipment for monthly interpolation.
ShipmentsOrders
Communications Equipment
2000 2002 2004 2006 2008200
340
480
620
760
9001040
1240
200
340
480
620
760
9001040
1240Thousands of units, ratio scale
2000 2002 2004 2006 2008
May
Note. Annual rate, FRB seasonals. Source. For sales, Ward’s Communications; for orders, ACT Research.
Sales of class 4-8 trucks
Net new ordersof class 5-8 trucks
Medium and Heavy Trucks
2000 2001 2002 2003 2004 2005 2006 2007 200832
37
42
47
52
59
32
37
42
47
52
59Billions of chained (2000) dollars, ratio scale
2000 2002 2004 2006 2008
Apr.
Note. Shipments and orders are deflated by the staff price indexes for the individual equipment types included in this category. Indexes are derived from the BEA’squality-adjusted price indexes.
Orders
Shipments
Non-High-Tech, Nontransportation Equipment
Orders and Shipments of Nondefense Capital Goods(Percent change; seasonally adjusted current dollars)
Note. Daily averages based on Merrill Lynch bond data.
Corporate Bond Yields
1990 1995 2000 2005300
500
700
900
1100
1300
1500
1700 Billions of chained (2000) dollars
0.7
0.8
0.9
1.0
1.1
1.2
1.3
1.4
1.5
Ratio
1991 1995 1999 2003 2007
Q1
Q1
Real cash flow (left scale)
Ratio of cash flowto fixed investment
(right scale)
Note. Cash flow and fixed investment for the corporate business sector.Source. Bureau of Economic Analysis; FRB flow of funds accounts.
Corporate Cash Flow
2000 2002 2004 2006 200830
40
50
60
70
20
30
40
50
60
70
80Diffusion index
2000 2001 2002 2003 2004 2005 2006 2007 2008
May
Source. Manufacturing ISM Report on Business;Philadelphia Fed Business Outlook Survey.
ISMPhiladelphia Fed
Surveys of Business Conditions
II-22
Nonresidential Construction and Indicators(All spending series are seasonally adjusted at an annual rate; nominal CPIP deflated by
BEA prices through Q4 and by staff projection thereafter)
2000 2002 2004 2006 2008170
190
210
230
250
270
290
170
190
210
230
250
270
290Billions of chained (2000) dollars
2000 2002 2004 2006 2008
Apr.
Total Structures
2000 2002 2004 2006 200820
30
40
50
60
70
80
90
20
30
40
50
60
70
80
90Billions of chained (2000) dollars
2000 2002 2004 2006 2008
OfficeApr.
Commercial
Apr.
Other
Apr.
Note. Other consists of structures for religious organizations,education, lodging, amusement and recreation, transportation,and health care.
Office, Commercial, and Other
2000 2002 2004 2006 200810
20
30
40
50
60
70
10
20
30
40
50
60
70Billions of chained (2000) dollars
2000 2002 2004 2006 2008
Manufacturing
Apr.
Manufacturing
Power & communication
and Power & Communication
2000 2002 2004 2006 2008-1.0
-0.5
0.0
0.5
1.0
1.5
2.0
2.5
3.0 Percent
35
40
45
50
55
60Diffusion index
May
2000 2002 2004 2006 2008
Architectural Billings andNonresidential Construction Employment
May
Billings (right scale)
Change inemployment (left scale)
Note. Both series are 3-month moving averages. Employmentconsists of industrial, commercial, and specialty trade construction. Source. For billings, American Institute of Architects;for employment, Bureau of Labor Statistics.
2000 2002 2004 2006 20080
3
6
9
12
15
18
0
3
6
9
12
15
18Percent
2000 2002 2004 2006 2008
Office
Q1
Retail
Industrial
Note. Industrial space includes both manufacturingstructures and warehouses. Source. Torto Wheaton Research.
Vacancy Rates
2000 2002 2004 2006 20080
5
10
15
20
25
30 Millions of feet
400
600
800
1000
1200
1400
1600
1800
2000
2200
2400Number
Drilling rigs(right scale)
2000 2002 2004 2006 2008
Footage drilled (left scale)
June
Apr.
Note. The June readings for drilling rigs are based ondata through June 13, 2008. Both series are seasonallyadjusted by FRB staff. Source. DOE/Baker Hughes.
Drilling and Mining Indicators
II-23
since the April Greenbook, and although spreads over Treasury yields have come down further over this period, they remain at elevated levels.
Business outlays on transportation equipment have continued to fall at a rapid pace in recent months. Business-sector spending for motor vehicles softened further in April and May after having declined in the first quarter. Automakers continued to scale back deliveries of fleet vehicles to daily rental companies, and demand from other businesses also receded. Sales of medium and heavy trucks in April and May continued, on average, at the subdued pace recorded in the first quarter. With lackluster volumes for freight shipping, the pace of new orders in recent months has been sluggish, suggesting that sales of medium and heavy trucks are unlikely to improve much in the near term. Meanwhile, April data on shipments and net exports suggest that domestic aircraft outlays remained relatively stable in the second quarter.
Real outlays on high-tech equipment and software have increased at a subpar pace so far this year. The latest data from the Quarterly Services Survey show a moderate rise in spending on software in the first quarter. More recently, industrial production of computers suggests only a tepid increase in real computer outlays this quarter. Domestic spending on communications equipment was about flat in the first quarter, and shipments moved down in April.
After having posted modest declines in the prior two quarters, business spending on equipment outside of high-tech and transportation seems to have remained weak so far in the current quarter. Although orders and shipments for this category of equipment increased noticeably in April, net exports of these capital goods also stepped up, an indication that a sizable fraction of demand is from abroad.
Nonresidential Construction Real spending on nonresidential structures excluding drilling and mining rose at an annual rate of 3¾ percent in the first quarter, down substantially from the double-digit gains posted throughout 2006 and 2007. This deceleration is largely consistent with the evolving fundamentals in this sector. Data from commercial property markets show that sales of existing properties have plunged from last year’s record levels, and prices appear to be leveling out. Moreover, the market for commercial mortgage-backed securities is moribund, spreads for corporate bonds remain wide, and recent Senior Loan Officer Opinion Surveys show that most banks are tightening lending standards for commercial real estate loans. Signs that the supply of space may be starting to outpace demand have also begun to emerge: Vacancy rates for office and industrial space ticked up in the first
II-24
2000 2002 2004 2006 20081.1
1.2
1.3
1.4
1.5
1.6
1.7
1.8
1.9
1.1
1.2
1.3
1.4
1.5
1.6
1.7
1.8
1.9 Months
2000 2002 2004 2006 2008
Apr.
May
Census book-value data
Staff flow-of-goods system
Note. Flow-of-goods system covers total industry ex.motor vehicles and parts, and inventories are relativeto consumption. Census data cover manufacturing and trade ex. motor vehicles and parts, and inventories arerelative to sales.
Inventory Ratios ex. Motor Vehicles
2000 2002 2004 2006 200835
40
45
50
55
60
35
40
45
50
55
60 Index
2000 2002 2004 2006 2008
May
Note. A number above 50 indicates inventories are "too high."
ISM Customer Inventories:Manufacturing
Nonfarm Inventory Investment (Billions of dollars; seasonally adjusted annual rate)
2007 2008
Measure and sector Q3 Q4 Q1 Feb. Mar. Apr.
Real inventory investment(chained 2000 dollars)Total nonfarm business 26.0 -21.7 -13.6 n.a. n.a. n.a. Motor vehicles 13.3 -25.7 -17.0 n.a. n.a. n.a. Nonfarm ex. motor vehicles 12.7 4.0 3.4 n.a. n.a. n.a.
Manufacturing and trade ex. wholesale and retail motor vehicles and parts e 18.1 7.6 8.5 3.2 -41.6 n.a. Manufacturing 3.1 8.5 15.6 .5 5.7 n.a. Wholesale trade ex. motor vehicles & parts e 13.9 -8.8 -.2 7.8 -24.2 n.a. Retail trade ex. motor vehicles & parts e 1.1 7.9 -7.0 -5.1 -23.1 n.a.
Book-value inventory investment(current dollars) Manufacturing and trade ex. wholesale and retail motor vehicles and parts 41.4 70.4 95.8 70.9 56.9 82.9 Manufacturing 16.2 34.7 60.5 38.1 61.4 -1.5 Wholesale trade ex. motor vehicles & parts 22.0 23.0 39.0 41.8 12.8 56.1 Retail trade ex. motor vehicles & parts 3.2 12.7 -3.7 -9.1 -17.3 28.3
n.a. Not available.e Staff estimate of real inventory investment based on revised book-value data.Source. For real inventory investment, BEA; for book-value data, Census Bureau.
II-25
8 Part of the substantial run-up in the flow-of-goods estimate of months’ supply reflects weak domestic
absorption, which appears in the denominator of these ratios. If inventories are instead compared with a measure of shipments that includes the large contribution of net exports, the recent run-up remains, although it is somewhat less striking.
quarter following several years of steady declines, while rates for retail space continued to move upward. The three-month average of the architectural billings diffusion index—which is fairly well correlated with construction at a horizon of two quarters or so—has moved down sharply of late, which suggests outright declines in nonresidential construction spending in the second half of this year.
The BEA estimates that real spending on drilling and mining structures dipped at an annual rate of 6½ percent in the first quarter on the heels of robust growth during 2007. Although escalating energy prices have been stimulating activity in this sector for some time, spending has been uneven from quarter to quarter. Incoming data on footage drilled and the number of drilling rigs in operation point to a resumption of gains in investment in the second quarter.
Business Inventories Real nonfarm inventories excluding motor vehicles rose only slightly in the fourth and first quarters, as firms cut production to keep inventories aligned with the sluggish pace of sales. The indicators we track are sending mixed signals concerning whether firms are holding excess inventories. According to Census Bureau data, the ratio of book-value inventories to sales (excluding motor vehicles and parts) ticked down in April and has changed relatively little, on net, since mid-2007. Industry detail also provides little indication of widespread imbalances. In addition, businesses surveyed by the ISM in May reported that their customers were reasonably comfortable with their current stock of inventories.
In contrast to the Census estimates, the staff’s flow-of-goods inventory system suggests that the months’ supply of inventories excluding motor vehicles and parts has moved up, on balance, since November. The recent rise in this measure has been fairly broad-based. Increases have been particularly evident in construction supplies and in materials.8
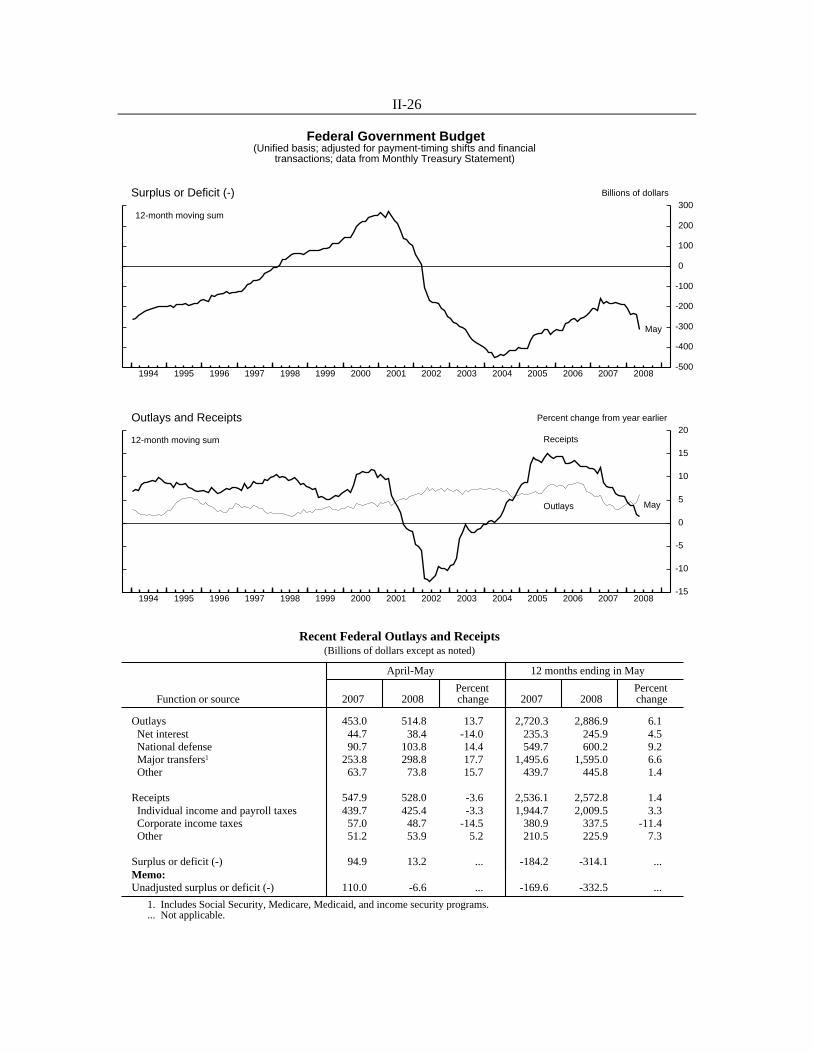
Federal Government Sector The deficit in the unified federal budget continued to widen in April and May, as $51 billion in stimulus rebates were sent out, tax receipts weakened with the slow pace of
II-26
Federal Government Budget(Unified basis; adjusted for payment-timing shifts and financial
transactions; data from Monthly Treasury Statement)
1. Includes Social Security, Medicare, Medicaid, and income security programs. ... Not applicable.
II-27
9 The Economic Stimulus Act of 2008 authorized about $115 billion in stimulus rebates, with
$94 billion expected to be sent out by the end of July, another $5 billion dispersed in the remainder of calendar year 2008, and around $16 billion distributed during the tax-filing season in 2009.
10 The amount of a rebate that exceeds a household’s income tax liability counts as a transfer payment in the budget rather than as a tax refund.
economic activity, and outlays rose briskly.9 Adjusted for payment-timing shifts and financial transactions, the unified budget recorded a surplus in the tax-heavy months of April and May that was $82 billion less than the adjusted surplus in the same period last year. Over the 12 months ending in May, the adjusted deficit was $314 billion, or approximately 2¼ percent of nominal GDP.
With a substantial portion of the stimulus rebates distributed in April and May, total net tax receipts during those two months were 3½ percent lower than their year-earlier level. Excluding the stimulus rebates, individual income and payroll taxes were only 4 percent above their year-earlier level, likely reflecting the deceleration in personal income. The slowing in federal tax payments has been even more pronounced on the corporate side. In April (which includes corporations’ first quarterly estimated payments on 2008 liabilities) and May, corporate tax receipts were 14½ percent below their year-earlier level, likely reflecting the decline in corporate profits since the middle of last year. According to daily Treasury data through June 16, corporate receipts in June, which are mostly firms’ second quarterly estimated payments on 2008 liabilities, appear to be about 8 percent below the level of corporate payments last June.
Federal outlays in April and May, adjusted for payment-timing shifts and financial transactions, were 13¾ percent above their level in the comparable year-earlier period. Defense spending rose briskly in April and May relative to the year-earlier period, which points to a solid increase in real defense purchases in the second quarter as measured in the national income and product accounts. Transfer payments moved up smartly relative to a year ago, boosted in part by a portion of the stimulus rebates sent to households with little or no tax liability.10 And other outlays also were significantly above their year-earlier level, mostly because of an increase in the estimated subsidy cost of federal programs for housing loans and student loans.
State and Local Government Sector Incoming data suggest that real purchases by state and local governments continued to rise at a sluggish pace in the second quarter after barely edging up in the first quarter. Nominal construction spending, which fell sharply in the first quarter, was only ½ percent above its first-quarter average in April. Meanwhile, state and local employment
II-28
State and Local Indicators
1998 2000 2002 2004 2006 2008-4
-2
0
2
4
6
8
10
12
-4
-2
0
2
4
6
8
10
12
Percent change, annual rate
Q1
Spending4-quarter moving average
Real Spending on Consumption & Investment
1998 2000 2002 2004 2006 2008-10
0
10
20
30
40
50
-10
0
10
20
30
40
50
Thousands of jobs, monthly average
May
Net Change in Employment
1998 2000 2002 2004 2006 2008140
150
160
170
180
190
200
140
150
160
170
180
190
200
Annual rate Billions of chained (2000) dollars
Apr.
Note. Nominal CPIP deflated by BEA prices throughQ1 and by a staff projection thereafter.
Real Construction
-1.0
-0.5
0.0
0.5
1.0
-1.0
-0.5
0.0
0.5
1.0
Percent of nominal GDP
1988 1993 1998 2003 2008
Q1
Net Saving
-15
-10
-5
0
5
10
15
20
-15
-10
-5
0
5
10
15
20
Percent change from year earlier
1999 2001 2003 2005 2007
4-quarter moving average
Totalrevenues
Individual and corporate income taxes
Q4
Source. Census Bureau.
State Revenues
0
2
4
6
8
10
12
14
0
2
4
6
8
10
12
14
Percent change from year earlier
1999 2001 2003 2005 2007
4-quarter moving average
Property taxes
Total revenues
Q4
Source. Census Bureau.
Local Revenues
II-29
11 The preliminary data are based on reports from 41 states, including the 12 largest. 12 Gasoline inventories rose to quite high levels earlier this year, putting downward pressure on
margins, and refiners responded by cutting back on production. Since then, gasoline inventories have run down considerably, which brought stocks to the lower end of their seasonal range, and refinery capacity utilization has begun to recover as the outlook for margins has improved.
increased by an average of 14,000 per month in April and May, slightly below the monthly pace of 18,000 new hires recorded in the first quarter.
Recent reports suggest that state governments’ fiscal conditions have continued to erode with the slowing pace of economic activity. According to preliminary data collected by the Rockefeller Institute of Government, state governments’ tax revenues rose at a tepid pace in the first quarter.11 Sales tax receipts were lower than their year-earlier level in the majority of states, at least partly because of reported weakness in sales of housing-related items. According to the National Conference of State Legislators, growth in receipts has slowed more rapidly than expected by state officials when fiscal year 2008 budgets—which cover the period through June 30 for most states—were finalized last year. In addition, about half of the states are now projecting that revenues will be insufficient to cover the amount of spending currently planned in fiscal 2009 budgets; these states may have to scale back planned spending, raise taxes, or dip into reserve funds to meet their balanced-budget requirements.
Prices Headline consumer price inflation has remained elevated in recent months, mostly because of large increases in food and energy prices. On the basis of the May data for the consumer price index (CPI) and producer price index (PPI), we estimate that overall PCE prices increased 0.5 percent in May, a rise that would push the three-month change to an annual rate of just over 4 percent. Furthermore, energy prices have only begun to reflect the recent surge in crude oil costs. By contrast, core consumer price inflation has remained relatively stable in recent months.
We estimate that consumer energy prices moved up 4½ percent in May after no change in April, as a jump in gasoline prices in May more than reversed April’s decline in gas prices. Retail gasoline prices had been slow to adjust to the surge in prices for crude oil this spring, squeezing margins. However, in recent weeks margins have begun to recover to more typical levels, and current survey data point to larger increases in gasoline prices in June.12 The path of futures prices suggests crude oil costs will remain near their currently high levels, and if margins continue to move back toward more typical levels, further sizable increases at the pump are likely this summer. Retail prices for natural gas
II-30
Price Measures(Percent change)
12-month change 3-month change 1-month change
Annual rate Monthly rate
May May Feb. May Apr. MayMeasures 2007 2008 2008 2008 2008 2008
1. Higher-frequency figures are not applicable for data that are not seasonally adjusted. 2. PCE prices in May 2008 are staff estimates. ... Not applicable.
II-31
Consumer Prices(12-month change except as noted)
2000 2002 2004 2006 20080
1
2
3
4
0
1
2
3
4 Percent
2000 2002 2004 2006 2008
May*
Total PCE
Core PCE
* Staff estimate.
PCE Prices
2000 2002 2004 2006 20080
1
2
3
4
0
1
2
3
4 Percent
2000 2002 2004 2006 2008
May*
chainedCPI
PCE
CPI
* PCE for May is a staff estimate.
CPI and PCE ex. Food and Energy
2000 2002 2004 2006 20080
1
2
3
0
1
2
3 Percent
2000 2002 2004 2006 2008
May*
Market-based components
* Staff estimate.
PCE excluding Food and Energy
2000 2002 2004 2006 2008-1
0
1
2
3
4
5
-1
0
1
2
3
4
5 Percent
2000 2002 2004 2006 2008
May*
3-month change, annual rate
* Staff estimate.
PCE excluding Food and Energy
2000 2002 2004 2006 2008-3
-2
-1
0
1
2
3
4
-3
-2
-1
0
1
2
3
4 Percent
2000 2002 2004 2006 2008
May*
May*
Services ex. energy
Goods ex. food and energy
* Staff estimate.
PCE Goods and Services
2000 2002 2004 2006 2008-1
0
1
2
3
4
5
-1
0
1
2
3
4
5 Percent
2000 2002 2004 2006 2008
May
3-month change, annual rate
CPI excluding Food and Energy
II-32
Energy and Food Price Indicators(Data from Energy Information Administration except as noted)
2005 2006 2007 200860
80
100
120
140
160
180
60
80
100
120
140
160
180Cents per gallon
Retail price less average spot crude price*
* Regular grade seasonally adjusted by FRB staff,less average spot crude price: 60% WTI, 40% Mayaheavy crude. Includes gasoline taxes.
June 16
Total Gasoline Margin
2005 2006 2007 200850
100
150
200
250
300
350
400
450
50
100
150
200
250
300
350
400
450Cents per gallon
* Regular grade seasonally adjusted by FRB staff.** 60% WTI, 40% Maya heavy crude.
Retail price*Rack price
Average spot crude price**
June 16
Gasoline Price Decomposition
2005 2006 2007 2008185
195
205
215
225
235
245
255
185
195
205
215
225
235
245
255Millions of barrels
Note. Shaded region is average historical range ascalculated by DOE. Monthly data through March 2008,weekly data thereafter, as indicated by line weights. * Adjustment for approximate amount of fuel ethanol to beblended with RBOB component of inventories; estimated byFRB staff.
Source. Bureau of Economic Analysis. *Staff estimate.
PCE Food Prices
II-33
and electricity rates have posted hefty gains in recent months in response to the surge in crude energy costs, and spot prices for natural gas set at Henry Hub have climbed further in recent weeks. All told, retail energy prices have risen more than 12 percent over the 12 months ending in May, much more than their increase over the preceding year.
PCE food prices are estimated to have risen 0.3 percent in May after having increased 0.9 percent in April, putting the estimated annualized three-month change through May at nearly 6 percent. Most spot prices for farm crops have increased further since the April Greenbook. Although wheat prices have edged down 1 percent in response to early reports of plentiful yields for U.S. winter wheat, corn and soybean prices have climbed further in response to wet weather and flooding in some Midwest growing areas. Livestock prices have also moved up in recent weeks, partly reflecting stronger demand from abroad. Even so, futures prices for farm products remain consistent with a significant deceleration in crude food costs later this year.
Excluding food and energy, PCE prices are estimated to have increased 0.2 percent in May after a rise of 0.1 percent in April. Over the 12 months ending in May, core PCE prices are estimated to have risen 2.1 percent, up slightly from a year earlier. While prices of goods and some services have accelerated over the past year—likely boosted by rising import prices and energy costs—the indexes for housing and medical services have decelerated.
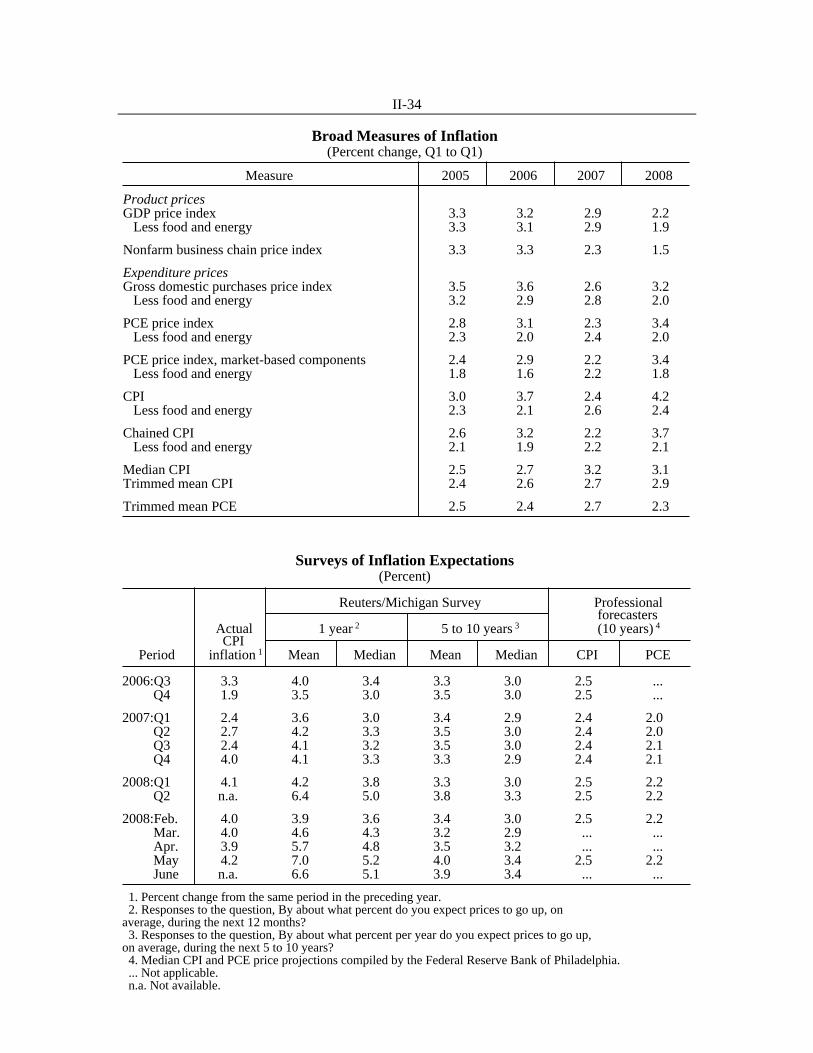
Some measures of near-term inflation expectations have risen sharply in the past couple of months, while measures of longer-term expectations have ranged from unchanged to up slightly. In the Reuters/Michigan survey, the median expectation for inflation over the next 12 months continued its upward climb in May as participants reported concerns over food and energy price increases; median expectations were 5.1 percent in the June preliminary report, about the same as in May. Median expectations for inflation over the next 5 to 10 years moved higher, to 3.4 percent, in May and remained at that level in June; this figure is the highest reading since 1995. According to the Survey of Professional Forecasters, four-quarter-ahead CPI inflation expectations increased 0.3 percentage point in the second quarter, while inflation expectations over the next 10 years were unchanged. Five-year inflation compensation derived from Treasury inflation-protected securities (TIPS) moved up further over the intermeeting period to 2.4 percent, about 25 basis points higher than at the beginning of the year. Inflation compensation 5 to 10 years ahead was roughly flat over the intermeeting period and has only edged up, on balance, from its value at the turn of the year.
II-34
Broad Measures of Inflation(Percent change, Q1 to Q1)
Measure 2005 2006 2007 2008
Product pricesGDP price index 3.3 3.2 2.9 2.2 Less food and energy 3.3 3.1 2.9 1.9
Nonfarm business chain price index 3.3 3.3 2.3 1.5
Expenditure pricesGross domestic purchases price index 3.5 3.6 2.6 3.2 Less food and energy 3.2 2.9 2.8 2.0
PCE price index 2.8 3.1 2.3 3.4 Less food and energy 2.3 2.0 2.4 2.0
PCE price index, market-based components 2.4 2.9 2.2 3.4 Less food and energy 1.8 1.6 2.2 1.8
CPI 3.0 3.7 2.4 4.2 Less food and energy 2.3 2.1 2.6 2.4
Chained CPI 2.6 3.2 2.2 3.7 Less food and energy 2.1 1.9 2.2 2.1
Median CPI 2.5 2.7 3.2 3.1 Trimmed mean CPI 2.4 2.6 2.7 2.9
1. Percent change from the same period in the preceding year. 2. Responses to the question, By about what percent do you expect prices to go up, onaverage, during the next 12 months? 3. Responses to the question, By about what percent per year do you expect prices to go up,on average, during the next 5 to 10 years? 4. Median CPI and PCE price projections compiled by the Federal Reserve Bank of Philadelphia. ... Not applicable. n.a. Not available.
II-35
Measures of Expected Inflation
1975 1980 1985 1990 1995 2000 20050
2
4
6
8
10
12
0
2
4
6
8
10
12Percent
1972 1976 1980 1984 1988 1992 1996 2000 2004 2008
Survey Measures (Reuters/Michigan)
Q2
Median, next 12 months
Median, next 5 to 10 years
Quarterly
2005 2006 2007 20080
1
2
3
4
5
6
0
1
2
3
4
5
6Percent
Monthly
June
1975 1980 1985 1990 1995 2000 20050
2
4
6
8
10
12
0
2
4
6
8
10
12Percent
1972 1976 1980 1984 1988 1992 1996 2000 2004 2008
Inputs to Models of Inflation
*For 2007 forward, the median projection for PCE inflation over the next 10 years from the Survey of Professional Forecasters (SPF);for 1991 to 2006, the equivalent SPF projection for the CPI; for 1981 to 1991, a related survey for the CPI conducted by Richard Hoey;and for the period preceding 1981, a model-based estimate constructed by Board staff. The survey data before 2007 are adjusted down0.5 percentage point to put the CPI projections approximately on a PCE basis.
**Derived from one of the reduced-form Phillips curves used by Board staff.
Note. Based on a comparison of an estimated TIPS yield curve with an estimated nominal off-the-run Treasury yield curve, with anadjustment for the indexation-lag effect.
Note. The Journal of Commerce (JOC) industrial price index is based almost entirely on industrial commodities, with a small weight given to energy commodities. Copyright for Journal of Commerce data is held by CIBCR, 1994.
Note. The Commodity Research Bureau (CRB) spot industrials index consists entirely of industrial commodities, excludingenergy. The CRB futures index gives about a 60 percent weight to food commodities and splits the remaining weight roughlyequally among energy commodities, industrial commodities, and precious metals.
1. From the last week of the preceding year to the last week of the year indicated. 2. April 22, 2008, is the Tuesday preceding publication of the April Greenbook.
II-37
13 The BEA’s upward revision to wages and salaries in the fourth quarter boosted the Bureau of Labor
Statistics’ estimated increase in compensation per hour in the nonfarm business sector to an annual rate of 6.6 percent, compared with the 4.7 percent estimate reported previously.
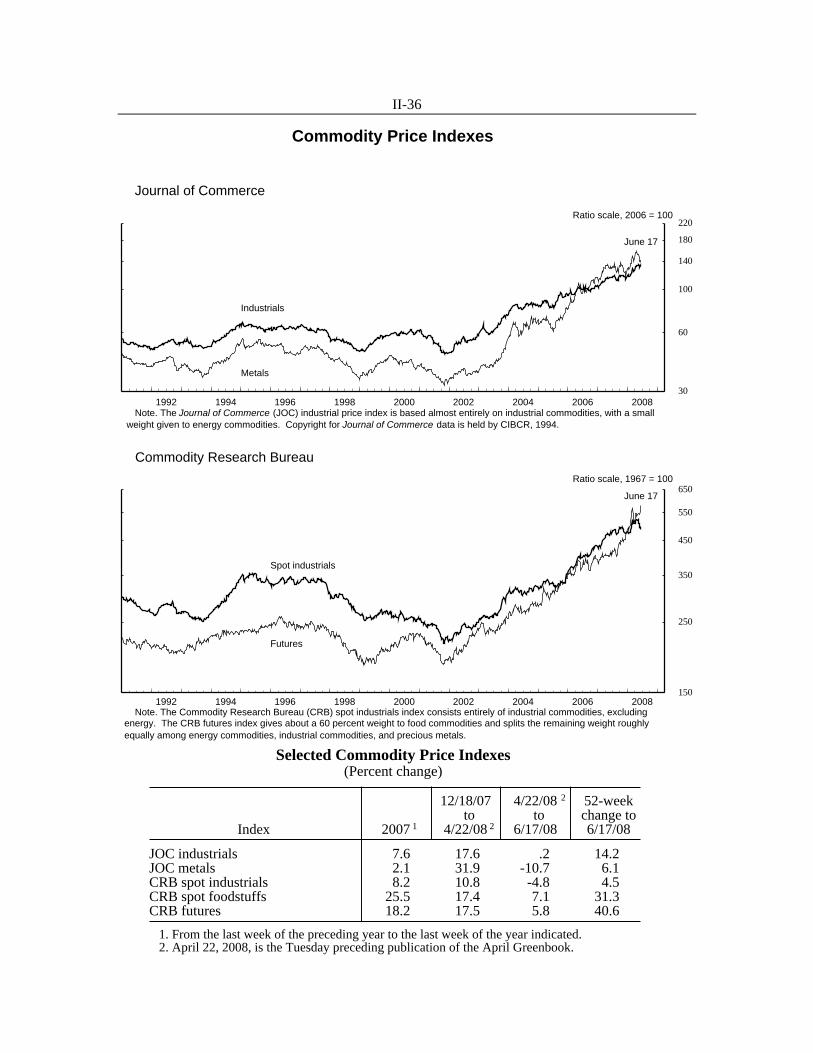
Excluding food and energy, prices at earlier stages of processing rose rapidly through May but have eased a bit in recent weeks. The PPI for core intermediate materials advanced 2.0 percent in May following a string of large monthly increases, bringing the three-month change to an annual rate of 18½ percent. Price increases were widespread across materials but were particularly marked for metal products and energy-intensive categories, such as chemicals and plastics. The PPIs for rail transportation, trucking, and delivery services also posted sizable increases in May.
In recent weeks, spot prices for a number of metals have partly retraced their large increases of earlier in the year. The Journal of Commerce (JOC) metals index has declined about 11 percent since its peak in April and now stands only 6 percent above its year-earlier level. As a result, the Commodity Research Bureau’s spot index of industrial materials has declined 4¾ percent since the April Greenbook, whereas the JOC index of industrial materials, which includes energy products, is unchanged on balance.
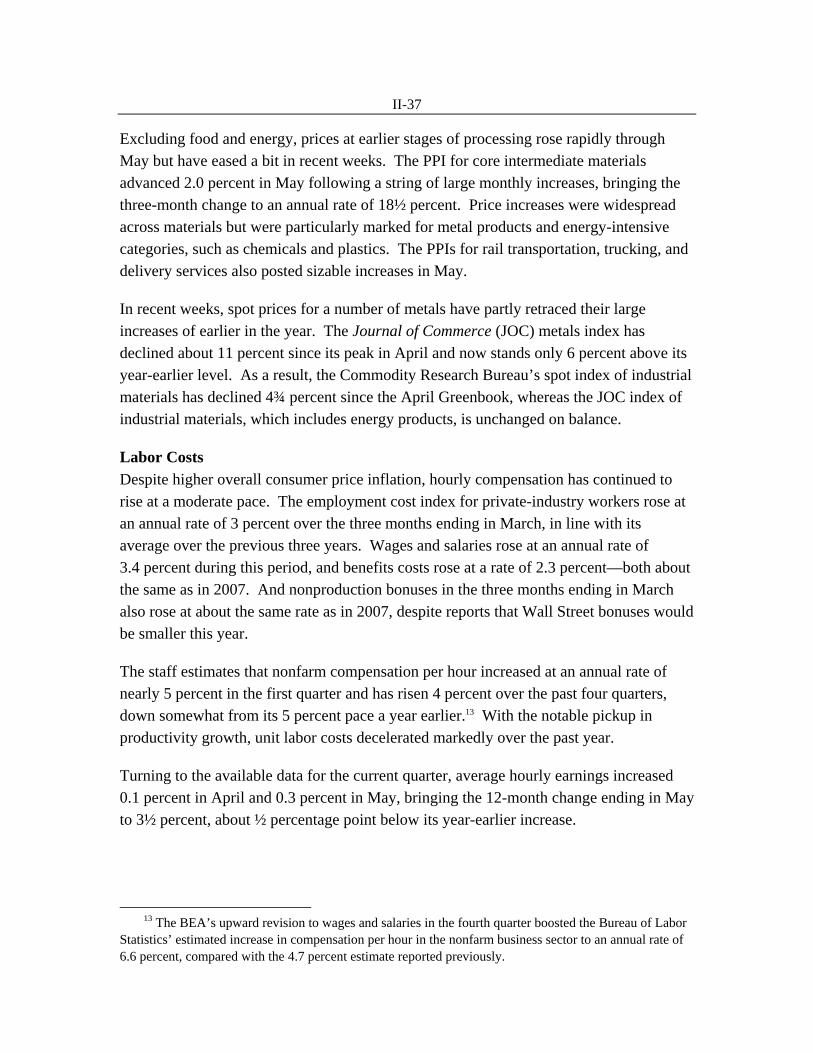
Labor Costs Despite higher overall consumer price inflation, hourly compensation has continued to rise at a moderate pace. The employment cost index for private-industry workers rose at an annual rate of 3 percent over the three months ending in March, in line with its average over the previous three years. Wages and salaries rose at an annual rate of 3.4 percent during this period, and benefits costs rose at a rate of 2.3 percent—both about the same as in 2007. And nonproduction bonuses in the three months ending in March also rose at about the same rate as in 2007, despite reports that Wall Street bonuses would be smaller this year.
The staff estimates that nonfarm compensation per hour increased at an annual rate of nearly 5 percent in the first quarter and has risen 4 percent over the past four quarters, down somewhat from its 5 percent pace a year earlier.13 With the notable pickup in productivity growth, unit labor costs decelerated markedly over the past year.
Turning to the available data for the current quarter, average hourly earnings increased 0.1 percent in April and 0.3 percent in May, bringing the 12-month change ending in May to 3½ percent, about ½ percentage point below its year-earlier increase.
II-38
1996 1998 2000 2002 2004 2006 20080
1
2
3
4
5
6
7
8
0
1
2
3
4
5
6
7
8Percent
Productivity and costs*
ECI
Q1
* Value for 2008:Q1 is a staff estimate.
Compensation per Hour (Percent change from year-earlier period)
1996 1998 2000 2002 2004 2006 2008-3
-2
-1
0
1
2
3
4
5
6
-3
-2
-1
0
1
2
3
4
5
6Percent
Q1
* Value for 2008:Q1 is a staff estimate.
Unit Labor Costs (Percent change from year-earlier period)
1996 1998 2000 2002 2004 2006 20081.52
1.54
1.56
1.58
1.60
1.62
1.64
1.66
1.52
1.54
1.56
1.58
1.60
1.62
1.64
1.66Ratio
Average,1968-present
Q1
Note. The markup is the ratio of output price to unitlabor costs. Value for 2008:Q1 is a staff estimate.
Markup, Nonfarm Business
1996 1998 2000 2002 2004 2006 20081.0
1.5
2.0
2.5
3.0
3.5
4.0
4.5
1.0
1.5
2.0
2.5
3.0
3.5
4.0
4.5Percent
May
Average Hourly Earnings (Percent change from year-earlier period)
Hourly Compensation and Unit Labor Costs(Percent change from preceding period at compound annual rate; based on seasonally adjusted data)
2006:Q1 2007:Q1 2007 2008to to
Category 2007:Q1 2008:Q1e Q2 Q3 Q4 Q1 e
Compensation per hourNonfarm business 4.9 4.0 1.3 3.3 6.6 4.9
Unit labor costsNonfarm business 4.3 .6 -1.3 -2.5 4.7 2.0
e Staff estimate.
Last Page of Domestic Nonfinancial Developments
Domestic FinancialDevelopments
III-T-1Selected Financial Market Quotations(One-day quotes in percent except as noted)
Change to June 17 from2007 2008 selected dates (percentage points)
Instrument 2007 2008 2008 Aug. 6 Jan. 31 Apr. 29 June 17 Aug. 6 Jan. 31 Apr. 29
1. Secondary market. 2. Financial commercial paper. 3. Bid rates for Eurodollar deposits collected around 9:30 a.m. eastern time. 4. Derived from a smoothed Treasury yield curve estimated using off-the-run securities. 5. Derived from a smoothed Treasury yield curve estimated using all outstanding securities and adjusted for the carry effect. 6. Most recent Thursday quote. 7. Constant-maturity yields estimated from Fannie Mae domestic noncallable coupon securities. 8. Derived from smoothed corporate yield curves estimated using Merrill Lynch bond data. 9. Home mortgage rates for June 17, 2008, are for the week ending June 12, 2008. _______________________________________________________________________
NOTES: August 6, 2007, is the day before the August 2007 FOMC meeting. January 31, 2008, is the day after the January 2008 FOMC meeting. April 29, 2008, is the day before the most recent FOMC monetary policy announcement.
*Width of a 90 percent confidence interval computed from theterm structures for the expected federal funds rate and impliedvolatility.
June 17
1 3 5 7 10 201.0
1.5
2.0
2.5
3.0
3.5
4.0
4.5
5.0Percent
June 17, 2008
April 29, 2008
Treasury Yield Curve
Years ahead Note. Smoothed yield curve estimated from off-the-run Treasurycoupon securities. Yields shown are those on notional par Treasurysecurities with semiannual coupons.
Jan. Apr. July Oct. Jan. Apr.2007 2008
1.8
2.0
2.2
2.4
2.6
2.8
3.0
3.2
3.4
Percent
5 to 10 years ahead
Next 5 years*
Inflation Compensation
Daily
Note. Estimates based on smoothed nominal and inflation-indexedTreasury yields. *Adjusted for lagged indexation of TIPS.
Apr. FOMC
June 17
Domestic Financial Developments
III-1
Overview Over the intermeeting period, investors marked up considerably the expected path of policy in response to generally stronger-than-expected economic data and growing concerns about the outlook for inflation, and market quotes now place substantial odds on policy tightening in the next few months. Nominal Treasury yields rose sharply, apparently as a result of wider term premiums as well as the upward shift in policy expectations. Real yields rose by less than their nominal counterparts, and inflation compensation jumped at relatively short horizons, likely reflecting the expected effects of surging oil prices. Five-year-forward inflation compensation was little changed.
Strains in short-term funding markets appeared to ease a bit over the intermeeting period, reflecting in part substantial credit extended under the Federal Reserve’s ongoing liquidity facilities. In the corporate bond market, credit spreads narrowed slightly, and gross bond issuance surged in May. Equity prices edged down, on net, over the intermeeting period, as the surge in oil prices and a more pessimistic outlook for earnings in the financial sector weighed on the market. Financial firms issued a large amount of equity shares, continuing their recapitalization efforts. Banks again registered weak profits in the first quarter because of elevated loan-loss provisions, and asset quality in nearly all major loan categories deteriorated further. Household debt growth slowed again in the first quarter, and the performance of both home mortgages and other household loans continued to worsen.
Policy Expectations and Treasury Yields The expected path for the federal funds rate rose notably over the intermeeting period. The decision at the April FOMC meeting to lower the federal funds rate by 25 basis points prompted a modest decline in federal funds futures rates, but these declines were subsequently more than reversed, as incoming data were generally firmer than expected, and speeches by Federal Reserve officials were interpreted as emphasizing concerns about the outlook for inflation, especially in light of sharply rising energy prices.
Market participants currently place high odds on the Committee leaving the target federal funds rate unchanged at 2 percent at the June meeting but also assign some probability to a policy tightening at the upcoming meeting. Futures markets have priced in nearly 50 basis points of rate increases by the October meeting, and they imply cumulative policy tightening of about 200 basis points over the coming two years, 85 basis points more than was expected at the time of the last FOMC meeting. In contrast, the Desk’s survey of primary dealers indicates that most expect the federal funds rate to remain
III-2
Short-Term Funding and Interbank Markets
July Sept. Nov. Jan. Mar. May2007 2008
20
40
60
80
100
120Basis points
Apr. FOMC
June 18
Spread between 30-Day Libor and OIS Rates
Daily
Note. Libor quotes are taken at 6:00 a.m., and OIS quotesare observed at the close of business of the previous trading day.
July Sept. Nov. Jan. Mar. May2007 2008
0
50
100
150
200
250Basis points
June 17
Apr. FOMCDaily
Spreads on 30-Day Commercial Paper
ABCP
A2/P2
Note. The ABCP spread is the AA ABCP rate minus the AAnonfinancial rate. The A2/P2 spread is the A2/P2 nonfinancialrate minus the AA nonfinancial rate.
July Sept. Nov. Jan. Mar. May2007 2008
0
5
10
15
20Billions
June 11
Apr. FOMC
Primary Credit Borrowing
Weekly Average (Wed.)
July Sept. Nov. Jan. Mar. May2007 2008
1.5
2.0
2.5
3.0
3.5
4.0
4.5
5.0
5.5
6.0Percent
June 17
Apr. FOMC
Federal Funds Rates
DailyTarget
Effective
July Sept. Nov. Jan. Mar. May2007 2008
0
1
2
3
4
5
6Percent
Daily
Treasury Repo Rates for General Collateral
Apr. FOMC
June 17
Overnight
1-month
Aug. Oct. Dec. Feb. Apr. June2007 2008
0
5
10
15
20
25
30
35
40
45
50Billions
Apr. FOMC
June 11
Weekly Average (Wed.)
Primary Dealer Credit Facility
III-3
unchanged through the first quarter of 2009 and to reach 2.75 percent by the end of that year, implying about 100 basis points less tightening than is priced in by market participants. The distribution of the federal funds rate six months ahead became a bit more skewed toward higher rates, and option-implied measures of uncertainty about policy rates six months to two years ahead increased noticeably.
The yield on nominal 2-year Treasury securities rose 62 basis points, on net, owing to the shift in policy expectations and an apparent increase in term premiums. Most of the increase in nominal yields occurred in intervals around data releases and speeches by FOMC members. Meanwhile, yields on 5-year and 10-year nominal Treasury securities moved up about 55 and 40 basis points, respectively.
Real yields rose much less, implying a rise in inflation compensation. The increase in inflation compensation was concentrated at very short horizons and likely was mainly due to the expected effects of the substantial increase in oil prices since the April meeting. Survey evidence also suggests that higher expectations of, and uncertainty about, inflation likely contributed to the rise in inflation compensation at short to medium horizons. All told, inflation compensation over the next five years increased about 40 basis points, while five-year-forward inflation compensation was little changed on net.
Money Market Functioning Over the intermeeting period, strains in some short-term funding markets appeared to ease a bit. Notably, spreads of one- and three-month Libor over comparable-maturity overnight index swap (OIS) rates narrowed about 35 and 20 basis points, respectively, on net. For longer maturities, however, liquidity remained thin, and corresponding term Libor spreads over OIS were little changed on balance. Spreads on 30-day A2/P2 nonfinancial commercial paper and asset-backed commercial paper (ABCP) also declined. The Federal Reserve’s liquidity programs may have helped to ease short-term strains. Primary credit outstanding—both overnight and term—continued to increase, presumably due in part to the narrow spread of the primary credit rate over the federal funds rate and the ability of depository institutions to borrow for longer terms. Offerings at the Term Auction Facility in May and June were fully subscribed; however, with a significantly increased amount offered, the stop-out rates were lower than those in earlier months and often well below one-month Libor. Some quarter-end pressures were evident in short-term interest rates late in the intermeeting period, but anecdotally, market participants are not especially concerned about their ability to obtain funding over the end of the quarter.
III-4
Corporate Yields, Risk Spreads, and Stock Prices
85
90
95
100
105
110
115
120
125
130
135
140
145Apr. 29, 2008 = 100
Mar. June Sept. Dec. Mar. June2007 2008
Selected Stock Price Indexes
Daily
S&P 500
DJ Financial
Apr. FOMC
June 17 2
4
6
8
10
12Percent
1988 1992 1996 2000 2004 2008
Ratio of Trend Earnings to Price for S&P 500 andLong-Run Treasury Yield
Monthly
(Trend earnings) / P*
Long-run real Treasury yield
+
+
June 17
* Trend earnings are estimated using analysts’ forecasts ofyear-ahead earnings from I/B/E/S. + Denotes the latest observation using daily interest rates andstock prices and latest earnings data from I/B/E/S.
10
20
30
40
50Percent
2002 2003 2004 2005 2006 2007 2008
Implied Volatility on S&P 500 (VIX)
Weekly Friday*Apr.
FOMC
June 17
* Latest observation is for most recent business day.
4.5
6.5
8.5
10.5
12.5Percent
2002 2003 2004 2005 2006 2007 2008
Corporate Bond Yields
Daily
10-year high-yield
10-year BBB
Apr. FOMC
June 17
Note. Yields from smoothed yield curves based on Merrill Lynchbond data.
0
200
400
600
800
75
150
225
300
375
450Basis points Basis points
2002 2003 2004 2005 2006 2007 2008
Corporate Bond Spreads
DailyApr.
FOMC
June 17
Note. Measured relative to comparable-maturity Treasuries.
10-year high-yield(left scale)
10-year BBB(right scale)
0
25
50
75
100
125
150
175
200
225Basis points
2002 2003 2004 2005 2006 2007 2008
Investment-Grade CDS Indexes
Daily
Financial
Nonfinancial
Apr. FOMC
June 17
III-5
Conditions in the Treasury general collateral (GC) repo and bill markets generally remained healthy. Functioning in these markets was likely supported, in part, by further sales of Treasury securities from the System Open Market Account portfolio and the substantial amount of Treasury securities lent through the Term Security Lending Facility (TSLF). Of the seven TSLF auctions held during the intermeeting period, only the most recent one, on June 12, received bids that exceeded the amount on offer. The modest demand at these auctions likely reflects some improvements in dealers’ access to financing. The renewed interest at the most recent auction reportedly reflected liquidity demands in advance of the upcoming quarter-end. For lower-quality collateral, market functioning remained impaired, with median haircuts on non-Treasury and non-agency collateral only a touch below the very elevated levels seen earlier in the spring. On balance, however, dealers appeared able to secure funding from market sources, and lending through the Primary Dealer Credit Facility (PDCF) decreased, although a few institutions have continued to access the PDCF regularly.
Stock Prices and Corporate Interest Rates Broad stock price indexes fell 1 percent to 3 percent, on net, over the intermeeting period, as the effect of generally positive economic data releases was outweighed by higher oil prices and increased concerns about the earnings outlook for the financial sector. As a result, stocks of securities broker-dealers and banks markedly underperformed the broader market. The spread between the 12-month-forward trend earnings-to-price ratio for S&P 500 firms and a real long-term Treasury yield--a rough gauge of the equity risk premium--ticked up to the high end of its range over the past two decades. Option-implied volatility on the S&P 500 index seesawed over the intermeeting period but is little changed on net.
Yields on BBB-rated and speculative-grade corporate bonds rose less than those on comparable-maturity Treasury securities, leaving their spreads somewhat lower over the intermeeting period. Both indexes of corporate bond spreads stayed substantially below their peaks in March but remained elevated by historical standards. Despite the sharp decline in equity prices for the financial sector, credit default swap (CDS) indexes for this sector rose only moderately, on balance, an indication that market concerns about default risk did not worsen appreciably. Estimated bid-asked spreads (not shown) suggest that the secondary market for corporate bonds continued to function well. In the secondary market for leveraged syndicated loans, conditions improved somewhat, and the average bid-asked spread narrowed about 25 basis points.
III-6
Corporate Earnings and Credit Quality
-30
-20
-10
0
10
20
30
40Percent
All firmsNonfinancials
S&P 500 Earnings Per Share
Change from 4 quarters earlier
Source. I/B/E/S for S&P 500 earnings per share.
p
p
Q1
Q1
p Preliminary.1998 2000 2002 2004 2006 2008
-4
-3
-2
-1
0
1
2
3Percent
All firmsNonfinancials
2002 2003 2004 2005 2006 2007 2008
Revisions to Expected S&P 500 Earnings
Monthly
Mid- May
Note. Index is a weighted average of the percent change in theconsensus forecasts of current-year and following-year EPS for afixed sample.
0.03
0.06
0.09
0.12
0.20
0.25
0.30
0.35Ratio Ratio
1989 1992 1995 1998 2001 2004 2007
Financial Ratios for Nonfinancial Corporations
Annual*
Debt overtotal assets(right scale)
Liquid assets overtotal assets(left scale)
Q4
Q4
* Data are quarterly starting in 2000:Q1. Source. Calculated with Compustat data.
0
1
2
3
4
5
6
7Percent of outstandings
1990 1993 1996 1999 2002 2005 2008
Selected Default and Delinquency Rates
C&I loan delinquency rate (Call Report)
Bond default rate*
* 6-month moving average, from Moody’s Investors Service.
Apr.
Q1
1992 1994 1996 1998 2000 2002 2004 2006 200850
40
30
20
10
0
10
20
30
Upgrades
Downgrades
Bond Ratings Changes of Nonfinancial CompaniesPercent of outstandings
Annual rate
Q1
Source. Calculated with data from Moody’s Investors Service.
0.0
0.5
1.0
1.5
2.0Percent of liabilities
1993 1996 1999 2002 2005 2008
Expected Year-Ahead Defaults
Monthly
May
Note. Firm-level estimates of default weighted by firm liabilities asa percent of total liabilities, excluding defaulted firms. Source. Moody’s KMV.
III-7
Corporate Earnings and Credit Quality With nearly all company reports for the first quarter in hand, earnings per share for S&P 500 firms are estimated to have fallen 18 percent from the year-earlier level, less than the 25 percent drop in the fourth quarter. Write-downs and provisioning by financial firms accounted for most the weakness in both quarters. In contrast, earnings per share for nonfinancial firms in the first quarter are estimated to have risen 10 percent from the year-earlier level, boosted by large gains for the oil and gas industry. Looking ahead, analyst estimates for year-ahead earnings for financial firms--and for the S&P 500 as a whole--were revised down in May, while the corresponding revisions for nonfinancial firms jumped into positive territory because of a sharp rise in energy sector forecasts.
The available data, though stale in some cases, indicate that overall nonfinancial corporate credit quality has generally remained solid. The aggregate ratio of liquid assets to total assets for nonfinancial firms stayed high in the fourth quarter, and the aggregate leverage ratio moved up only slightly from a low level. And although the delinquency rate on commercial and industrial (C&I) loans ticked up in the first quarter, it remained low by historical standards. The realized six-month default rate on corporate bonds remained near zero in April, and there were few ratings changes for nonfinancial corporations in the first quarter. In May, the KMV forecast of the aggregate year-ahead default rate continued to hover near the middle of its 15-year historical range.
Business Finance Both investment-grade and speculative-grade bond issuance by nonfinancial companies surged in May, buoyed in part by the relative stability of yield spreads, which may have made it easier for issuers and investors to agree on deal terms. Meanwhile, total outstanding nonfinancial commercial paper contracted again in May, and C&I loan growth slowed markedly. This pattern of debt financing flows suggests that some firms are lengthening the maturity of liabilities to improve liquidity. Aggregating across bonds, commercial paper, and C&I loans, net debt financing by nonfinancial firms was strong in May, though issuance of institutional leveraged loans reportedly continued to be very weak. Issuance of both convertible bonds and equity shares by financial corporations in April and May was very high by historical standards, reflecting recapitalization by large financial institutions.
Net equity retirements by nonfinancial firms are estimated to have ebbed a bit in the first quarter from last year’s record levels. The volume of retirements from completed cash-financed mergers dropped notably, while those resulting from share repurchases are also
III-8
Business FinanceGross Issuance of Securities by U.S. Corporations
(Billions of dollars; monthly rates, not seasonally adjusted)
Note. Components may not sum to totals because of rounding. 1. Excludes private placements and equity-for-equity swaps that occur in restructurings. 2. Data include regular and 144a private placements. Bond totals reflect gross proceeds rather than par value oforiginal discount bonds. Bonds are categorized according to Moody’s bond ratings or to Standard & Poor’s ifunrated by Moody’s. 3. End-of-period basis, seasonally adjusted. 4. Based on adjusted commercial bank credit data through April 9.
2004 2005 2006 2007 2008
-20
-10
0
10
20
30
40
50
60
70
Commercial paper*C&I loans*Bonds
Total
Selected Components of Net Debt Financing
Billions of dollars
Monthly rate, nonfinancial firms
* Seasonally adjusted, period-end basis.
H1
H2
Q1 Apr.May
2004 2005 2006 2007 2008
-120
-110
-100
-90
-80
-70
-60
-50
-40
-30
-20
-10
0
10
20
30
40
50
Public issuancePrivate issuanceRepurchasesCash mergers
Total
Components of Net Equity Issuance
Billions of dollars
Monthly rate, nonfinancial firms
H1H2
Q1 e
e Staff estimate.
III-9
1998 2000 2002 2004 2006 2008 0
2
4
6
8
10
12
14
16
18Percent change from year earlier
Q1
Commercial Mortgage Debt
Quarterly
Source. Flow of funds.Oct. Jan. Apr. July Oct. Jan. Apr.
0
500
1000
1500
2000
2500CMBX.NA Basis points
2006:H2*2006:H1*2005:H2*
June 17
Daily
July 2006 2007 2008
BBB Commercial Mortgage CDS Index Spreads
Note. Measured relative to Libor. *Corresponds to pools of mortgages originated in that period. Source. JP Morgan.
2002 2004 2006 2008 0
20
40
60
80
100
120
140Billions of dollars
3-month moving averageMonthly
Mayp
Sales of Commercial Real Estate
p Preliminary. Source. Real Capital Analytics.
1990 1993 1996 1999 2002 2005 2008
100
150
200
250
Index, 1996:Q4=100
Transactedproperty
All property
Q1
Prices
Quarterly
Note: All-property index based on entire NCREIF portfolio. Transacted-property index based on sales involving NCREIF portfolio. Source. NCREIF, MIT Center for Real Estate.
Source. Call Report. Data series begin in 2007:Q1.
Commercial Real Estate
III-10
2001 2002 2003 2004 2005 2006 2007 2008 4
6
8
10
12
14
16Percent change from year earlier
Q1
Quarterly
Mortgage Debt
Source. Flow of funds.
4
6
8
10
12
14
16
18
20
2002 2004 2006 20080.0
0.5
1.0
1.5
2.0
2.5
3.0Percent of loans Percent of loans
Subprime (left scale)
Prime (right scale)
Apr.
Apr.
Delinquencies on Mortgages
Monthly
Note. Percent of loans 90 or more days past due or inforeclosure. Prime includes near-prime mortgages. Source. First American LoanPerformance.
125
150
175
200
225
250
275
300
Oct. Jan. Apr. July Oct. Jan. Apr.4.5
5.0
5.5
6.0
6.5
7.0Basis points Percent
30-year fixed-rate spread(left scale)
30-year fixed-rate(right scale)
Apr.FOMC
June 11
July 2006 2007 2008
Prime Conforming Mortgage Rate and Spread
Weekly
Note. FRM spread relative to 10-year Treasury. Source. Freddie Mac.
0
50
100
150
200
250
300Billions of dollars
2001 2002 2003 2004 2005 2006 2007 2008
AgencyNon-agency
Monthly rate
Agency and Non-Agency MBS Issuance
H1
H2Q1A.
Source. For agency issuance, Fannie Mae, Freddie Mac,and Ginnie Mae. For non-agency issuance, Inside MortgageFinance MBS database.
Oct. Jan. Apr. July Oct. Jan. Apr. 0
50
100
150
200
250Basis points
Fannie MaeGinnie Mae
Apr.FOMC
June 11
July 2006 2007 2008
Daily
30-Year Option-Adjusted Current Coupon Spreads
Note. Option-adjusted spread from Bloomberg’s prepayment model. Source. Bloomberg.
Oct. Jan. Apr. July Oct. Jan. Apr. 0
20
40
60
80
100
120Basis points
July 2006 2007 2008
GSE Credit Default Swap Index
Daily
Note. Sector index is the median of individual quotes for Fannie Mae, Freddie Mac, and the Federal Home Loan Bank System. Source. Markit.
Apr.FOMC
June 13
Residential Mortgages
III-11
estimated to have cooled somewhat. In the second quarter, retirements from completed cash-financed mergers and announcements of new repurchase programs slowed further. On the other side of the ledger, gross public issuance of equity picked up in May, though almost entirely because of seasoned offerings; there were scant initial public offerings.
Commercial Real Estate Growth of commercial mortgage debt moderated in the first quarter, and the market for commercial mortgage-backed securities (CMBS) has remained virtually shut down. Yields on investment-grade CMBS (not shown) have been persistently high, likely discouraging new issuance. Spreads on CDS indexes for CMBS, while below their highs earlier in the year, remained quite elevated. Moreover, the sales volume for existing commercial properties slowed further in April and May.
Delinquency rates on commercial mortgages held by commercial banks climbed further in the first quarter. Much of the increase was due to delinquencies on residential construction loans, but delinquencies on nonresidential construction loans also rose. On the other hand, delinquencies on existing properties held by commercial banks and insurance companies have remained low, and CMBS delinquency rates have drifted only modestly higher, largely because of loans on multifamily properties.
Household Finance The deterioration in the performance of residential loans has continued, as delinquencies on nonprime and prime loans rose further in April. Meanwhile, in the first quarter, the growth of residential mortgage debt continued to slow, and house prices kept falling, as the purchase-only index calculated by the Office of Federal Housing Enterprise Oversight posted a record decline of 6.7 percent at a seasonally adjusted annual rate.
Conditions in the conforming-mortgage market have not improved since the April FOMC meeting. Spreads between primary-market interest rates on conforming mortgages and 10-year Treasury securities rates were little changed on net. And although agency issuance of mortgage-backed securities (MBS) was again strong, issuance of private-label residential mortgage-backed securities was anemic. The market for new conforming jumbo loans has been slow to take off, with only about $300 million in loans originated to date. Moreover, the secondary market for agency MBS was volatile, and option-adjusted spreads widened on net. CDS indexes on the government-sponsored enterprises, Fannie Mae and Freddie Mac, moved up slightly over the intermeeting period, although they remain well below recent highs.
III-12
1996 1998 2000 2002 2004 2006 2008-10
-5
0
5
10
15Percent change, annual rate
Quarterly, s.a.
House Prices
Source. Office of Federal Housing Enterprise Oversight.
Q1
OFHEO purchase-only index
1998 2000 2002 2004 2006 20081
2
3
4
5
6Percent
Auto loans at captive finance companies
Credit card loans in securitized pools
Nonrevolvingconsumer loans atcommercial banks
Apr.
Apr.
Q1
Delinquencies on Consumer Loans
Source. For nonrevolving, Call Report; for credit cards, Moody’s; for auto loans, Federal Reserve.
1998 2000 2002 2004 2006 2008 0
2
4
6
8
10
12
14
16
18
20Percent change
Apr.
3-month moving average, annual rate
Consumer Credit
0
10
20
30
40Billions of dollars
2002 2003 2004 2005 2006 2007 2008
AutoCredit cardStudent loans
Monthly rate
Gross Issuance of Consumer ABS by Type
H1
H2 Q1
Q2*
Note. Auto includes car loans, leases, and financing for buyers of motorcycles, trucks, and other vehicles. *Through June 13. Source. Inside Mortgage Finance MBS database, Merrill Lynch.
Consumer Credit and Household Wealth
Net Flows into Mutual Funds(Billions of dollars, monthly rate)
Fund type 2006 2007 2008 Assets H1 H2 Q1 Apr. Maye Apr.
e Staff estimate based on confidential weekly data.
Source. Investment Company Institute.
III-13
Delinquency rates on most types of consumer loans moved up further, particularly those on credit cards, and now stand close to their respective averages over the past decade. Interest rates on consumer loans (not shown) declined somewhat, as they continued their typically gradual adjustment to this year’s drop in short-term rates. Growth of consumer credit in April remained about in line with its average over recent years, despite the notably tighter terms and standards that banks have reported. Issuance of most types of consumer asset-backed securities (ABS) was strong in May, led by a surge in auto loan ABS issuance, and has continued apace in the first two weeks of June. Spreads on consumer ABS have also started to narrow. Reportedly, policy actions by the Congress and the Department of Education aimed at increasing the availability of funds for student lenders have helped to assuage concerns about student loan availability for the 2008-09 school year.
Long-term mutual funds registered strong inflows in April and May. Domestic equity funds received inflows after several quarters of sizable outflows, and international equity funds experienced renewed inflows as well. Municipal bond funds also saw strong demand. The large outflow in money market mutual funds in April and the subsequent rebound in May largely reflected seasonal tax-related patterns.
Treasury Finance The Treasury’s midquarter refunding announcement was broadly in line with market expectations. After a seven-year hiatus, the Treasury announced that it was reintroducing auctions of 52-week bills to help finance a sharply wider deficit. The first auction of this security was well received, with a stop-out rate slightly below expectations and a high bid-to-cover ratio. The Treasury auctioned several other nominal securities over the intermeeting period, with maturities spanning 2 to 30 years; these auctions were generally well received, with bid-to-cover ratios within historical ranges. Indirect bidding and allotments to foreign participants at these auctions continued their modest downward trend of recent months. However, foreign official holdings of U.S. Treasury securities at the Federal Reserve have risen briskly over the same period.
Functioning in the Treasury coupon market improved somewhat over the intermeeting period, and on most days, bid-asked spreads for on-the-run securities stayed near the low end of their range since last August. Despite improved functioning overall, estimated yield curves continue to show large fitting errors, the on-the-run premium for the 10-year note remains close to its peak in early May, and the on-the-run premium for the 2-year
III-14
Treasury Finance
2000 2002 2004 2006 2008 0
10
20
30
40
50Percent of total issue
June 16
Indirect bids
Actual foreign allotment
Foreign Participation in Treasury Auctions
6-month moving average
Note. Indirect bids and actual allotment are a percentage ofthe total amount accepted, including the amount tendered tothe Federal Reserve. Moving averages include 2-, 5-, and 10-year original auctions and reopenings.
2003 2004 2005 2006 2007 2008 0
200
400
600
800
1000
1200
1400
1600Billions of dollars
June 11
Apr. FOMC
Foreign Custody Holdings
Weekly average
Note. Securities held in custody at the Federal Reserve Bankof New York on behalf of foreign official institutions.
Treasury
Agency
2003 2004 2005 2006 2007 2008
0
5
10
15
20
25Billions of dollars
Securities Lending
Weekly (Wed.) average
Note. Volume of securities lent to market participants from theSystem Open Market Account portfolio through the overnightfacility.
June 11
0.80
0.85
0.90
0.95
1.00
1.05
1.10
Cents per $100 face value
Feb. June Oct. Feb. June Oct. Feb. June2006 2007 2008
2-year on-the-run Treasury notes
Bid-Ask Spread
Source. BrokerTec Interdealer Market Data.
5-day moving average
June 17
Apr.FOMC
0
2
4
6
8
10
12
14
16Basis points
2001 2002 2003 2004 2005 2006 2007 2008
Average Absolute Nominal Yield CurveFitting Error
Daily
Note. Calculated from securities with 2 to 10 years until maturity,excluding on-the-run and first off-the-run securities.
June 17
-10
0
10
20
30
40Basis points
2001 2002 2003 2004 2005 2006 2007 2008
2-year
10-year
Treasury On-the-Run Premiums
Monthly average
Note. Computed as the spread of the yield read from an estimatedoff-the-run yield curve over the on-the-run Treasury yield. Juneobservation is the month-to-date average.
June
III-15
State and Local Government FinanceGross Offerings of Municipal Securities
(Billions of dollars; monthly rate, not seasonally adjusted)
1. For years, Q4 to Q4; for quarters and months, calculated from corresponding average levels.2. Nonbank traveler’s checks are not listed.3. Sum of demand deposits, other checkable deposits, and savings deposits.
III-17
1 The April drop in securities is largely accounted for by the decision of a U.S. branch of a foreign
bank to shift some securities holdings to a foreign office. Adjusting to remove the effects of this shift, securities holdings would have been about flat in April.
note climbed noticeably for the first time since the recent financial turmoil began, suggesting that investors still have strong demand for relatively liquid securities.
State and Local Government Finance Gross issuance of long-term municipal bonds continued to be robust in May, reflecting further restructuring by municipalities out of the now-essentially-defunct auction-rate security market as well as a general improvement in market conditions. A substantial share of new capital issuance was for infrastructure projects. Short-term issuance was moderate, consistent with typical seasonal patterns.
The underlying credit quality of municipal bonds remained strong, and the number of ratings upgrades outpaced the number of downgrades in May. Although the downgrade of two large municipal bond insurers in early June triggered a slew of automatic downgrades to municipal bonds this month, these actions were not surprising and had little effect on the market. Yields on long-term municipal bonds declined a bit over the intermeeting period, and the ratio of such yields to those of comparable-maturity Treasury securities declined sharply, returning to levels that prevailed prior to the financial turmoil.
Money and Bank Credit M2 expanded at a sluggish 1¾ percent annual rate in the April and May period, with growth pulled down both by an unwinding of safe-haven flows associated with the financial turmoil in prior months and because of large final individual income tax payments. These effects were partially offset by deposits of economic stimulus payments and a continued decline in the opportunity cost of holding money. Liquid deposits rose at a 6 percent annual rate in April and May, while retail money market mutual funds slowed in April and contracted sharply in May. Small time deposits fell for the third consecutive month, and the currency component of M2, which has been somewhat volatile, was about flat, on net, over the two months.
Commercial bank credit decreased modestly over the April-May period, largely because of a runoff in banks’ holdings of securities and a drop in the volatile “other loan” series.1 That said, C&I lending slowed appreciably, expanding at only about half its first-quarter pace. Data from the Survey of Terms of Business Lending conducted in early May
III-18
Commercial Bank Credit(Percent change, annual rate, except as noted; seasonally adjusted)
Type of credit 2007 H2 Q4 Q1 Apr. May Level1
2007 2007 2008 2008 2008 May 2008
Total 10.6 11.1 9.5 6.8 -5.4 2.2 9,004
Loans2
Total 11.3 11.3 10.5 9.9 .2 2.7 6,816 To businesses Commercial and industrial 19.2 25.2 27.5 15.8 12.3 3.3 1,491 Commercial real estate 10.1 9.8 9.0 9.3 11.0 6.5 1,644
Note. Yearly annual rates are Q4 to Q4; quarterly and monthly annual rates use corresponding average levels. Datahave been adjusted to remove the effects of mark-to-market accounting rules (FIN 39 and FAS 115), the initial consolidation ofcertain variable interest entities (FIN 46), the initial adoption of fair value accounting (FAS 159), and the effects of sizablethrift-to-bank and bank-to-thrift structure activity in October 2006, March 2007, and October 2007. Data also account forbreaks caused by reclassifications. 1. Billions of dollars. Pro rata averages of weekly (Wednesday) levels. 2. Excludes interbank loans. 3. Includes an estimate of outstanding loans securitized by commercial banks. 4. Includes security loans and loans to farmers, state and local governments, and all others not elsewhere classified.Also includes lease financing receivables. 5. Includes private mortgage-backed securities; securities of corporations, state and local governments, and foreigngovernments; and any trading account assets that are not Treasury or agency securities.
1998 2000 2002 2004 2006 2008
140
160
180
200
220
240Basis points
Weightedaverage
Weightedaverage
adjusted*
C&I Loan Rate Spreads
Quarterly
Note. Spreads over market interest rate on an instrument of comparable maturity on loans less than $25 million (2006$). *Adjusted for changes in nonprice loan characteristics. Source. Survey of Terms of Business Lending.
Q2
Q2
1992 1996 2000 2004 20080.0
0.5
1.0
1.5
2.0Percent
100 largest banksAll other banks
Q1
Q1
Return on Assets at Commercial Banks
Quarterly, s.a.a.r.
Source. Call Report.
III-19
indicate that, after adjusting for nonprice loan characteristics, the average spread on C&I loans smaller than $25 million was slightly below that reported in the February survey and was near the low end of their recent range. In contrast, spreads on commercial banks’ portions of syndicated loans remained at elevated levels in May. Commercial real estate loans held by banks rose moderately in April and May. On the household side, residential mortgage loans fell, on net, over the past two months, whereas revolving home equity lines of credit continued to expand briskly, as borrowers reportedly drew down loans under existing low-cost credit lines. Through May, originations of consumer loans have remained fairly strong.
According to first-quarter Call Report data, commercial bank profitability—as measured by the return on assets—was adversely affected again by asset write-downs and elevated rates of loan-loss provisioning. Without the boost from the proceeds of the initial public offering of Visa Inc., which occurred in mid-March, results at many large commercial banks would have been worse. Asset quality in nearly all major loan categories deteriorated further in the first quarter of 2008, with delinquency rates on residential mortgages as well as construction and land development loans registering very large increases. All told, the delinquency rate on all loans and leases reached a level not seen since the early 1990s.
Last Page of Domestic Financial Developments
International Developments
International Developments
IV-1
U.S. International Transactions
Trade in Goods and Services
The U.S. international trade deficit widened to $60.9 billion in April after narrowing to
$56.5 billion in March. The widening of the deficit in April occurred as a jump in
exports was outweighed by an even greater rise in imports.
In April,the value of exports of goods and services jumped 3.3 percent, following a
1.9 percent decline in March. The increase in April occurred across a number of
catagories, with exports of industrial supplies and capital goods exhibiting particular
strength. Exports of consumer goods and automotive products also increased strongly.
The decline in exports in March was also broadly based, although exports of aircraft and
automotive products recorded particularly sharp drops. Exports of services increased in
both months.
IV-2
IV-3
IV-4
The value of imports of goods and services rose 4.5 percent in April, after falling
3.3 percent in March. Most catagories of goods recorded declines in March and increases
in April. The value of petroleum imports fell sharply in March before rebounding
strongly in April, largely reflecting higher oil prices. Imports of non-oil industrial
supplies, capital goods, and automotive products also jumped up in April. In contrast,
imports of consumer goods rose only modestly in April following a sharp decline in
March. Imports of services rose at a moderate pace in both months.
Prices of Internationally Traded Goods
Non-oil imports. In April, prices of core imports rose 1.5 percent, the largest one-month
increase in the 13-year history of the index. This increase mostly reflected higher prices
for material-intensive goods, which rose 2.8 percent in April. Import prices for finished
goods also contributed to April’s increase, rising 0.8 percent, due mainly to higher prices
for capital goods (excluding computers and semiconductors). In May, core import prices
increased at a more moderate but still strong pace of 0.6 percent, as prices for both
finished goods and material-intensive goods increased at slower rates.
The average level of core import prices in April and May was almost 12 percent at an
annual rate (a.r.) above the first-quarter average. Prices for material-intensive goods
were up 27 percent, whereas prices for finished goods increased 5¼ percent. The
second-quarter rise in prices for finished goods is the largest increase in this category
since the fourth quarter of 1990 and is well above the 2007 pace of 2 percent.
Oil. The BLS price index of imported oil rose 5.9 percent in April before climbing an
additional 7.8 percent in May. The spot price of West Texas Intermediate (WTI) crude
oil averaged $112.33 per barrel in April, up 7 percent from its March average, and then
spiked an additional 12 percent to an average of $125.39 per barrel in May. The spot
price of WTI has continued to climb higher thus far this month and closed at $134.01 per
barrel on June 17. The price of futures for delivery at the end of 2016, which was at
$137.05 per barrel on June 17, rose even more rapidly during the inter meeting period.
IV-5
IV-6
IV-7
The sharp upward movement in prices over this period appears to reflect increasing
concerns regarding supply, amid continuing strong demand from emerging markets,
particularly China. U.S. inventories for crude oil have fallen notably in recent weeks. In
addition, both the U.S. Energy Information Administration and the International Energy
Agency revised down their respective estimates of non-OPEC supply growth, adding to
the growing sense of pessimism regarding longer term supply prospects.
Exports. Core export prices rose 0.5 percent in both April and May. In April, prices for
finished goods and for material-intensive goods increased at roughly the same rate. In
contrast, in May prices for finished goods rose only 0.2 percent, whereas prices for
material-intensive goods rose 0.9 percent. In April, falling wheat and soybean prices
pulled down prices of agricultural exports 2.2 percent. Although wheat prices continued
to fall in May, higher prices for soybeans, vegetables, and meat resulted in a 0.3 percent
increase in agricultural export prices for the month.
The average level of core export prices in April and May was 8¼ percent (at an annual
rate) above the first-quarter average. Much of the rise can be attributed to the 22 percent
increase in prices of nonagricultural industrial supplies. Agricultural prices, having
increased at a 58 percent pace in the first quarter, were up only 10 percent in the April-
May period. Prices of exported finished goods were up nearly 3 percent, a rate
comparable to that in 2007.
U.S. Current Account
The U.S. current account deficit was $706 billion (a.r.) in the first quarter of 2008,
$37 billion wider than in the fourth quarter of 2007 (revised). The widening resulted
primarily from a narrowing of the surplus in net investment income, as declines in
income receipts on U.S. portfolio and direct investment abroad more than offset a decline
in payments on foreign portfolio investment in the United States.
IV-8
U.S. Current Account (Billions of dollars, seasonally adjusted annual rate)
Period
Goods and
services,
net
Investment
income,
net
Other
income and
transfers, net
Current
account
balance
Annual
2006 -753.3 63.8 -98.6 -788.1
2007 -700.3 88.8 -119.7 -731.2
Quarterly
2007:Q2 -715.3 45.8 -106.9 -776.4
Q3 -672.5 98.9 -118.3 -691.8
Q4 -695.1 152.6 -126.4 -669.0
2008:Q1 -699.7 126.3 -132.1 -705.5
Change from
previous qrtr.
2007:Q2 2.9 -12.0 20.5 11.3
Q3 42.8 53.1 -11.4 84.6
Q4 -22.7 53.7 -8.2 22.8
2008:Q1 -4.5 -26.3 -5.7 -36.5
Source: U.S. Department of Commerce, Bureau of Economic Analysis.
U.S. International Financial Transactions
Financial flows for the first quarter of 2008 show relatively modest net purchases of U.S.
securities by private foreign investors (line 4 of the Summary of U.S. International
Financial Transactions table; see also the chart on Private Securities Flows). As has been
the case since the financial turmoil began last summer, “flight to safety” considerations
contributed to very strong net purchases of Treasury securities for the quarter (line 4a);
foreign private demand for corporate stocks was weak (line 4d) and private investors on
net sold agency and corporate bonds (lines 4b and 4c). The net sales of corporate bonds
in the first quarter were larger than in the third quarter of last year and are only the
second such recorded quarterly outflow in these securities in more than 20 years. In part,
these net sales likely reflect weak net issuance of U.S. debt securities early this year.
U.S. investors made moderate acquisitions of foreign securities (line 5). Flows of U.S.
direct investment abroad (line 6) eased a bit in the first quarter, primarily from a
slowdown in reinvested earnings abroad. Foreign direct investment into the United
States (line 7) also slowed, primarily reflecting a shift from an increase to a decrease in
net intercompany debt.
IV-9
Taken together, total private financial flows swung from a net inflow of $92 billion in the
fourth quarter to a net outflow of $52 billion in the first quarter. However, foreign
official inflows (line 1) picked up further from their elevated rate in the fourth quarter,
reflecting strong purchases of both Treasury and agency securities by Asian central banks
as well as further acquisitions of corporate debt and stocks by some sovereign wealth
funds. In large part reflecting the swing in net private flows, the statistical discrepancy in
the first quarter also swung to a sizable positive $53 billion, indicating some combination
of over-reporting of the current account deficit or under-reporting of net financial
inflows.
The most recent data on securities transactions show that foreign private purchases of
U.S. securities picked up a bit in April from the pace recorded in the first quarter, but this
strength was again concentrated in Treasury securities. Foreign private investors on net
sold agency bonds and corporate stocks, but made small net purchases of corporate
bonds.
Foreign official flows into the United States remained quite strong in April,
.
Inflows from OPEC countries were weak in April following a pickup late last year and in
January reflecting the high-profile capital injections into several U.S. financial firms by
Middle East OPEC sovereign wealth funds. In general, data for the OPEC countries have
been volatile and most likely understate actual inflows from these countries. Partial and
confidential data on custody accounts at FRBNY indicate a slower pace of official
inflows in May and early June.
U.S. official assets (line 2) showed a $15 billion outflow in April, reflecting primarily an
increase in the amounts drawn from the reciprocal swap arrangements with the European
Central Bank and Swiss National Bank. These swap arrangements were also the primary
contribution to the $24 billion outflow for this line in the fourth quarter. The increase in
the swap arrangements in May will contribute to a further $26 billion outflow for that
month.
There was a small net inflow in April from U.S. residents’ net acquisitions of foreign
securities in April, as U.S. investors on net sold foreign bonds (line 5a) and made small
net purchases of foreign stocks (line 5b).
IV-10
The volatile banking sector (line 3) posted a further net
outflow in April, following the very large net outflow
recorded in March. Since the turmoil began in August
2007, net lending abroad by banks has increased with
unusual consistency (see inset chart). These outflows,
primarily from foreign-owned banks lending to European
affiliates, likely reflect tensions in interbank funding
markets and cumulate to a sizeable $280 billion between
August 2007 and April 2008.
The balance of payments data released in June showed
upward revisions to foreign net purchases of U.S. securities of about $100 billion for
2006 and nearly $200 billion for 2007, based primarily on newly-released results of the
survey of foreign holdings of U.S. securities as of June 2007. The survey indicated
considerably larger holdings of U.S. corporate bonds than previously available data had
suggested, in part reflecting an apparent under-reporting of foreign acquisitions of U.S.
asset-backed securities. Inflows from foreign direct investment in the United States were
also revised up nearly $100 billion for 2006 and 2007 together.
These increases in financial inflows were partly offset by significant revisions to financial
outflows. There were sizable revisions—amounting to about $180 billion for the period
2004-2007—to U.S. acquisitions of foreign securities, based primarily on results of the
newly-released survey of U.S. holdings of foreign securities as of December 2006, which
found larger holdings of foreign securities than previously estimated. There were also
significant revisions to “other flows” reported in line 10 for 2006, reflecting previously
unrecorded increases in claims of U.S. issuers of asset-backed commercial paper and
medium term notes on their foreign parents.
On net, the revisions to financial flows were nearly offsetting for 2006 but resulted in
much larger inflows for 2007. Combined with the revisions that reduced the size of the
current account deficit in both years, the statistical discrepancy was revised to
-$47 billion in 2006 and -$41 billion in 2007, suggesting some combination of under-
reporting of the current account deficit or over-reporting of net financial inflows. The
revision to the discrepancy for 2007 was striking, as the previous release had shown a
positive discrepancy of $84 billion.
IV-11
IV-12
IV-13
IV-14
Foreign Financial Markets
Credit markets were relatively stable over the period, but bond yields rose noticeably as
inflationary pressures came into the foreground of central bank concerns.
Yields on sovereign benchmark bonds rose 20 to 50 basis points and sovereign yield
curves flattened in all of the major economies. Although the major foreign central banks
kept policy rates on hold, expectations of future monetary tightening increased as
policymakers signaled greater concern about inflation. Sterling yields rose after the
release of April CPI data showed that inflation had increased to 3 percent, and Governor
King was required to write a letter of explanation to the Chancellor of the Exchequer as
inflation rose further to 3.3 percent in the May CPI release. Euro yields rose as headline
inflation climbed to 3.6 percent and several ECB members indicated that the ECB was
likely to raise rates soon. Canadian yields jumped on June 10, when the Bank of Canada
defied market expectations of a rate cut and chose instead to hold rates fixed. The central
banks of Brazil, Chile, China, Egypt, Hungary, India, Indonesia, Israel, the Philippines,
Russia, and Turkey all tightened policy over the intervening period in order to combat
rising food and energy prices, and yields on local-currency bonds have risen
commensurately.
Conditions in domestic European interbank markets remained strained, but changed little
since the April Greenbook. Spreads between 1-month Libor and overnight index swap
rates jumped 9 basis points in euro and 4 basis points in sterling as the maturity date of
those contracts crossed into July, indicating some pressure associated with the quarter
end. Securitization has picked up modestly, and a few deals to sell asset-backed
securities (ABS) have received attention, although banks may have also used some
recently issued ABS as collateral with the ECB. In spite of the fact that demand for term
funding in euro and sterling appeared fairly stable, implied rates from foreign exchange
and currency basis swaps indicate that demand for dollar funding from European
financial institutions may have appreciably increased. The decision to increase the size
of the Federal Reserve’s swap lines with the European Central Bank and Swiss National
Bank has allowed those institutions to lend greater amounts of dollar funding to their
banks, and demand at the auctions for those funds has been high, with larger bid-to-cover
ratios than at the Federal Reserve’s Term Auction Facility.
A number of major European banks announced further write downs for the first quarter,
and financial stocks helped lead overall European equity indexes down about 5½ percent
since the last Greenbook. Several banks announced rights issues in order to shore up
IV-15
their capital positions, and in some cases they were forced to offer lower prices in order
to place the new equity. Some Japanese banks also reported write-downs, but Japan’s
FSA estimated that the six largest banks have so far suffered losses totaling
$9.1 billion, much less than the losses of their U.S. and European counterparts. Japanese
bank stocks rose over the period and the overall Nikkei index climbed 6½ percent. Other
Asian equity indexes were generally down, led by the Shanghai composite, which fell
10 percent, and the performance of the major Latin American indexes was mixed.
The trade-weighted nominal value of the dollar has moved in a fairly tight range. The
major currencies index rose 2 percent on net and the broad index increased about
1 percent. The dollar tended to move with perceptions of monetary policy and the
relative economic strength of the United States versus foreign economies. Chairman
Bernanke’s discussion of the dollar on June 3 and market participants’ growing
perception that the FOMC might raise rates more quickly than they had expected
prompted the dollar to appreciate late in the period. Of note, the dollar has depreciated
1½ percent against the renminbi since mid-May after having remained essentially
unchanged against that currency for most of April. The dollar generally appreciated
against most other emerging Asian currencies.
IV-16
IV-17
IV-18
IV-19
IV-20
IV-21
Developments in Advanced Foreign Economies
Real GDP in the advanced foreign economies expanded moderately in the first quarter,
but the pace of economic activity varied markedly across economies. In the euro area
and Japan, strong investment contributed to a sharp acceleration in output. In Canada,
GDP contracted 0.3 percent on the back of large negative contribution from exports and
inventories. In the United Kingdom, output moderated to 1.6 percent due to a slowdown
in real estate and business activities. Recent data point to softness across the advanced
foreign economies in the second quarter. Consumer and business confidence indicators
have weakened in all major economies, and the PMIs show increased pessimism
regarding the pace of business activity going forward. Measures of the unemployment
rate have started to drift up from decade lows in most economies.
Inflationary pressures remain elevated on balance because of recent food and energy
price increases. In Europe, the prospect of inflation climbing to nearly 4 percent over the
summer has led market participants to speculate that the European Central Bank and the
Bank of England may increase interest rates this year. The Bank of Canada held rates
unchanged at its June meeting despite expectations of a cut, citing the possibility that CPI
inflation would rise above 3 percent later in the year if current levels of energy prices
persisted. In Japan, headline inflation slid to 0.8 percent in April but interest rate
expectations rose marginally over the intermeeting period.
In Canada, real GDP contracted 0.3 percent (a.r.) in the first quarter. Cutbacks were
widespread in manufacturing, most notably in the automobile sector where production
was hampered by a strike at a major supplier of automotive parts in the United States.
Coming on the heels of rapid growth in the second half of 2007, inventory accumulation
and business investment, especially in machinery and equipment, both eased markedly.
Nevertheless, consumer spending advanced 3.2 percent, although this was the slowest
quarterly rise in consumption in over two years. Imports fell twice as much as exports;
however, excluding autos, exports advanced 3 percent.
Indicators suggest that GDP will avoid shrinking for a second consecutive quarter,
although activity is likely to remain weak. Housing starts in April and May, while
healthy, were below their very strong first-quarter average. The manufacturing sector
rebounded in April, with widespread gains in the volume of sales. However, the volume
IV-22
IV-23
of new orders was down, with decreased orders for durables outweighing a rise in orders
for nondurables. Total employment continued to expand in both April and May, but
more slowly than it did in the first quarter. The unemployment rate held steady at
6.1 percent in May, still near its 33-year low of 5.8 percent reached in February.
The twelve-month rate of consumer price inflation was 1.7 percent in April, up from
March’s 1.4 percent, as disinflationary pressures stemming from the Canadian dollar’s
appreciation seem to have subsided a bit. At 1 percent in April, food price inflation
remains low, although the rise in food prices between March and April was significantly
faster than in the previous several months. The Bank of Canada’s preferred measure of
core inflation, which excludes the eight most volatile components of the consumer price
index as well as the effects of indirect taxes, was 1.5 percent in April.
IV-24
IV-25
In the euro area, real GDP grew 3.2 percent in the first quarter, with better-than-
expected performance in domestic demand and net exports. GDP growth was supported
primarily by a 6.3 percent increase in German GDP, where construction activity was
enhanced by unusually warm weather. Investment remained solid for the euro-area as a
whole, but consumption continued to show signs of weakness, registering a second
consecutive quarter of anemic growth.
Recent data point to a moderation in economic activity in the current quarter, on balance.
Business and consumer confidence indicators continued to deteriorate, and the volume of
retail sales declined in March and April. The PMI for manufacturing and the flash PMI
for services remained only slightly above 50. Nevertheless, IP rebounded in April and
the unemployment rate held at 7.1 percent in April for the third consecutive month.
IV-26
IV-27
The ECB’s survey of euro-area bank lending indicated a further tightening of credit
standards in the first quarter. The percent balance of euro-area banks reporting a net
tightening of credit standards for loans to enterprises was 49 percent in the first quarter,
up from 41 percent in the fourth quarter of 2007. Banks also reported a further increase
in the net tightening of credit standards for loans to households.
Euro-area twelve-month HICP inflation jumped to 3.7 percent in May, a record high
since the start of euro-area statistics in 1997. Inflation excluding energy and unprocessed
food prices continued to meander around 2½ percent. During the June meeting, the ECB
Council left policy rates unchanged, but officials have signaled the possibility of a rate
increase as early as July.
In Japan, real GDP increased 4 percent (a.r.) in the first quarter. Consumption and net
exports both made unusually large contributions to growth (1.8 and 2.0 percentage points,
respectively). Private investment rose a robust 3.2 percent after falling a cumulative
4 percent over the previous three quarters.
IV-28
IV-29
Recent indicators of production have been weak, however. Industrial production
contracted 3.4 percent in March and a further 0.2 percent in April, leaving the April level
well below the first-quarter average. April shipments data also fell short of their first-
quarter average. Consistent with the weakening production numbers, export growth has
slowed considerably since the beginning of the year; the 12-month growth rate of exports
declined from 6 percent in January to 0.3 percent in April.
Although the labor market remains relatively strong overall, there are some signs of
weakening. The unemployment rate rose to 4 percent in April, and the job openings-to-
applicants ratio (the number of officially posted job openings relative to the number of
officially registered job seekers) fell to 0.93, its lowest level since March 2005. Total
cash earnings (which include bonuses) grew a meager 0.9 percent over the twelve months
ending in April.
The nationwide core consumer price index (excluding fresh food only) rose 0.9 percent in
April from a year earlier, compared with 1.2 percent in March. Consumer prices
excluding food and energy fell 0.1 percent. The timelier core CPI for Tokyo rose
0.9 percent in May from a year earlier.
In the United Kingdom, real GDP moderated to 1.6 percent (a.r.) in the first quarter,
despite a sizeable increase in consumption. Fixed investment contracted sharply after
two quarters of solid growth, and inventories made a large negative contribution. Net
exports made a positive contribution as imports fell and exports moved sideways. The
service sector expanded 2 percent, its slowest pace since 2001, as real estate and business
activities stalled.
IV-30
Business and confidence indicators softened markedly through May. The May PMIs for
services and manufacturing indicated equal proportions of respondents expecting
business activity in their sector to either expand or contract. The Labor Force Survey
measure of the unemployment rate ticked up to 5.3 percent in March, and the number of
people claiming unemployment benefits rose marginally in May, although the claimant
count rate was unchanged.
The housing market continues to be a major source of uncertainty for households. Net
nominal mortgage lending in April stood 30 percent below its 2007 average, while the
value of mortgages approved for house purchases nearly halved over the same period,
indicating that financial institutions are considerably limiting the origination of new
loans. The volume of remortgaging activities, on the other hand, continues to grow at a
sustained pace.
The twelve-month rate of CPI inflation climbed to 3.3 percent in May, prompting the
Governor of the Bank of England to write a public letter to the Chancellor. Energy and
food prices, the largest contributors to the current run-up in headline inflation, rose
15.6 and 7.8 percent, respectively, in the year to May. The price of manufactured inputs
soared nearly 30 percent over that period, its largest increase since 1976. By contrast,
average earnings including bonuses grew 3.2 percent in the twelve months to April, their
slowest pace in five years.
IV-31
IV-32
Economic Situation in Other Countries
Recent indicators for emerging market economies generally point toward continued solid
growth, albeit at a slower pace than last year. Strong exports among the emerging market
economies appear to have partially offset weakness in exports to the advanced
economies. Domestic demand remains robust in many of the countries. Headline
inflation rose further in most of the developing world, largely owing to higher food and
energy prices; several countries are facing upward pressure on core inflation as well. The
rising cost of energy subsidies has led several Asian countries to raise state-controlled
fuel prices. Since the April Greenbook, authorities in several countries, including Brazil,
China, India, and Turkey have tightened monetary conditions.
In China, data revisions led the staff to increase its estimate of real GDP growth in the
first quarter to a surprisingly strong 11.7 percent (s.a.a.r.). Data on retail sales, up
22 percent in April and May from a year earlier, suggest that domestic demand has
continued to strengthen. In addition, the trade surplus declined a bit in April and May, on
average, from the first quarter, as imports jumped higher. Since the fourth quarter of last
year, growth of exports to the United States, Europe, and the rest of Asia has slowed.
Exports to Latin America have picked up; however, Latin America accounts for less than
5 percent of Chinese exports.
Twelve-month consumer price inflation was 8.5 percent in April, but fell to 7.7 percent in
May, as food price inflation moderated from 22 percent to 20 percent. To combat
inflation, Chinese authorities have lowered import tariffs on selected foods, medicine,
and cotton. The People’s Bank of China (PBOC) raised the required reserve ratio (RRR)
for banks ½ percentage point in May and another 1 percentage point in June. The latest
increase brings the RRR to 17½ percent for large banks. Bank lending has been subdued
over the past three months, with the twelve-month growth in loans less than 15 percent,
the slowest pace of growth since early 2006. The rate of renminbi appreciation slowed in
April and the first half of May, but picked up again in the second half of the month. The
PBOC continues to accumulate international reserves at a rapid pace; reserves increased
$75 billion in April to reach $1.75 trillion.
On May 12, a massive earthquake struck the Sichuan province in China. It is estimated
that 90,000 people were killed and more than 350,000 people were injured. The impact
of this tragedy on the Chinese economy is not reflected in the data received to date, but
over the next few months there is likely to be some additional upward pressure on prices
as distribution remains hampered and the supply of some agricultural products are
IV-33
diminished. In addition, over the next few quarters, reconstruction is likely to provide a
small boost to GDP.
India’s GDP growth in the fourth quarter of last year was revised up from 2.7 percent
(s.a.a.r) to 7.6 percent, in part due to bountiful rains in the monsoon season that resulted
in higher agricultural production than initially estimated. Growth strengthened further in
the first quarter of this year to 9.1 percent, the agriculture and services sectors were
particularly strong but industrial production slowed. The trade deficit widened in the first
quarter and in April, as imports grew faster than exports. Inflation, measured by both
consumer and wholesale prices, remained relatively constant in March and April, but
some prices, particularly of metals and oil seeds, accelerated. In addition, in early June,
the government increased retail gasoline prices 11 percent and diesel prices 9.5 percent.
Amid inflationary pressures, the central bank raised the repo rate 25 basis points to
8 percent on June 11, more than a month before the bank's next scheduled policy meeting
and its first hike in14 months. The central bank also raised the reserve requirement
25 basis points to 8.25 percent and relaxed restrictions on capital inflows by raising
foreign investment limits; greater capital inflows may help reduce downward pressures
on the rupee.
IV-34
IV-35
IV-36
In the NIEs1, first-quarter GDP growth picked up in Hong Kong and Singapore but
slowed in Korea and Taiwan. Real GDP in Hong Kong was buoyed by strong Chinese
growth. In Singapore, growth surged to 14½ percent (s.a.a.r.) following a marked
contraction in the fourth quarter, as activity in the biomedical sector rebounded sharply.
In Korea and Taiwan, the slowdowns were broad-based. More recently, industrial
production growth for April was unchanged in Korea and plunged in Singapore,
reflecting a contraction in the biomedical sector. Trade surpluses in Korea, Singapore,
and Taiwan have widened thus far in the current quarter from the first-quarter average;
Hong Kong’s trade deficit has narrowed.
Twelve-month consumer price inflation remained elevated in the NIEs, largely reflecting
higher food and energy prices, although there have been some upward moves in core
inflation as well. Specifically, Hong Kong and Singapore experienced large increases in
inflation in April, and Korea saw a large increase in May. To respond to the adverse
effects of inflation on the poor, the Korean government announced a $10 billion relief
package for its lowest-income citizens over the next year. In contrast, inflation in Taiwan
edged lower in April and May. Taiwanese authorities announced a large increase in fuel
prices in late May.
1 Newly-industrialized economies: Hong Kong, South Korea, Singapore, and Taiwan
IV-37
IV-38
IV-39
Data from the ASEAN-4 show signs of a mild weakening in economic growth. With the
exception of Indonesia, real GDP growth slowed in the first quarter. Final domestic
demand was strong in both Malaysia and Indonesia, but there was a substantial
drawdown in inventories. Domestic demand remained solid in the Philippines, boosted
by strong remittances. In Thailand, domestic demand was weak in the first quarter, but
industrial production rebounded in April.
Thailand, the world’s largest exporter of rice, has benefited from recent record high
prices for the commodity. Nevertheless, the trade balance for Thailand has deteriorated
as exports have failed to keep pace with imports. The Philippines has been hit hard by
the runup in the world prices of both rice and crude oil, which have sharply increased its
import bill.
Across the region, increasing food and energy prices continue to push consumer price
inflation higher. Both the Indonesian and Malaysian governments recently raised the
domestic price of fuel, which is state-controlled. Malaysia has announced plans to
eliminate fuel subsidies altogether in August of this year, while Indonesia has opted to
begin a system of rationing in September. Thailand instituted a small subsidy on diesel
fuel for buses, and the Philippines eliminated its 1 percent import tariff on crude oil. The
central banks of Indonesia and the Philippines have raised rates to combat inflation.
IV-40
IV-41
IV-42
Mexican real GDP growth decreased to 2.1 percent (s.a.a.r.) in the first quarter, reflecting
in part the slowdown in the United States. Mining, construction, and the manufacture of
textiles and computer equipment decelerated, and the volatile agricultural sector posted a
decline of 7 percent. Data for the current quarter point to continued lackluster
performance. Industrial production declined 1.8 percent in April, with a particularly
large decline in the mining sector, which includes oil and gas extraction. Indexes of
consumer confidence declined in April and May, while the manufacturing opinion survey
has moved sideways since January. The trade deficit continued to widen in April,
reflecting a broad-based jump in imports and a decline in exports. Headline inflation in
May reached 5 percent on a twelve-month basis, pushing inflation further away from the
4 percent upper bound of the central bank’s target range.
In Brazil, first-quarter real GDP growth slowed to 2.9 percent from 6.6 percent in the
fourth quarter. On the production side, the weakness was mainly in the agricultural
sector. On the expenditure side, private consumption growth dropped to 1.3 percent, and
investment moved down from double-digit rates last year to 5.4 percent. The trade
surplus narrowed in the first quarter but rebounded significantly in May as exports
soared, following the end of a customs strike. In April, both auto production and
domestic sales were very strong, and capacity utilization rates remained high. However,
industrial output was up only slightly. Headline inflation continued to move up, reaching
IV-43
5.5 percent in May. Both food prices and prices of core goods have been putting upward
pressure on headline inflation. The regulated price category, which includes energy, has
risen only modestly in recent months.
In early June, as expected, the central bank raised its target policy rate 50 basis points to
12¼ percent, following a similar move in April. The government also announced that it
would raise its target for the primary fiscal surplus to 4¼ percent of GDP from
3¾ percent of GDP. The move was primarily aimed at allaying concerns about rapid
growth of government spending. Brazil’s sovereign credit rating was raised to
investment grade by S&P in April and by Fitch in May.
In Argentina, growth of nominal exports and imports jumped in April, with exports
supported by high prices for agricultural commodities. In March, the government
decided to increase export taxes on several agricultural products, including soybeans,
grains, and oilseeds, in an attempt to reduce food price inflation, triggering a strike by
farmers. The confrontation between the government and farmers spilled over into other
sectors in recent weeks, when truckers began blocking roads, leading to some food
shortages. The tensions contributed to a decline in bank deposits and downward
pressures on the peso, prompting the central bank to engage in unsterilized intervention to
support the currency, which put upward pressures on interest rates. On June 9, the
thirty-day bank deposit rate was 12.7 percent, up from about 8 percent in early May.
Headline consumer price inflation reached nearly 9 percent in April on a twelve-month
IV-44
basis, amid large increases in prices of services, such as housing, transportation and
health. Despite the introduction of a new CPI index, skepticism about the reliability of
the official inflation data continues.
In Venezuela, real GDP plunged by an estimated 9 percent (s.a.a.r.) in the first quarter on
sharp contractions in manufacturing and construction. Consumer price inflation
continued to climb in May, reaching 30 percent on a twelve-month basis. Food prices
were up 45 percent as a result of the relaxation of price controls. The black-market
exchange rate is currently 3,400 bolivar per dollar, versus an official rate of 2,100.
Finance Minister Rafael Isea resigned in mid-June to run in the forthcoming elections in
November, but policies are expected to remain expansionary under his successor, Ali
Rodriguez, the current ambassador to Cuba and former president of state-oil company
PDVSA.
IV-45
IV-46
IV-47
In Turkey, real GDP increased 5 percent in the fourth quarter, boosted by strong private
sector investment. Industrial production has shown signs of moderation in recent months.
Twelve-month consumer price inflation reached 10.7 percent in May, significantly higher
than the 6 percent upper limit of the central bank’s year-end target. The Monetary Policy
Committee raised its policy rates 50 basis points at its May meeting, in light of
inflationary pressures resulting from lagged pass-through from exchange rates and rising
prices for energy and processed foods. In early June, the central bank raised its medium-
term inflation targets to 7.5 percent in 2009, 6.5 percent in 2010, and 5.5 percent in 2011.
Twelve-month-ahead inflation expectations increased to 8.6 percent in the mid-June