Prefatory Note The attached document represents the most complete and accurate version available based on original files from the FOMC Secretariat at the Board of Governors of the Federal Reserve System. Please note that some material may have been redacted from this document if that material was received on a confidential basis. Redacted material is indicated by occasional gaps in the text or by gray boxes around non-text content. All redacted passages are exempt from disclosure under applicable provisions of the Freedom of Information Act. Content last modified 04/01/2015.
Transcript
Prefatory Note
The attached document represents the most complete and accurate version available based on original files from the FOMC Secretariat at the Board of Governors of the Federal Reserve System.
Please note that some material may have been redacted from this document if that material was received on a confidential basis. Redacted material is indicated by occasional gaps in the text or by gray boxes around non-text content. All redacted passages are exempt from disclosure under applicable provisions of the Freedom of Information Act.
Content last modified 04/01/2015.
Class III FOMC - Internal (FR)
CURRENT ECONOMICAND FINANCIAL CONDITIONS
Part 2
Recent Developments
Prepared for the Federal Open Market Committeeby the staff of the Board of Governors of the Federal Reserve System
August 6, 2009
Class III FOMC - Internal (FR)
August 6, 2009
Recent Developments
Prepared for the Federal Open Market Committeeby the staff of the Board of Governors of the Federal Reserve System
Domestic NonfinancialDevelopments
Domestic Nonfinancial Developments
II-1
1 An appendix describes the BEA’s comprehensive revision of the national income and product accounts (NIPA), which we received last Friday. Because the BEA released its detailed breakdowns for components of GDP and for prices just before Greenbook publication, some of the text and figures include more limited detail than usual.
Note: A list of abbreviations is available at the end of Part 2.
The incoming data suggest that overall economic activity is stabilizing. Employment and manufacturing output continued to move lower through June, but the pace of decline has slowed noticeably in recent months. Moreover, a sizable pickup in motor vehicle production appears to be under way. Housing activity is likely in the process of emerging from its prolonged slump, and consumer spending has moved down only a little further, on net, after having fallen sharply in the second half of last year. The decline in equipment and software investment seems to be moderating, although the incoming data do not point to an imminent recovery. Regarding inflation, core consumer price inflation has remained relatively stable in recent months, though a jump in gasoline prices pushed up overall consumer inflation in June.1
Labor Market Developments
Job losses continued in June, although at a less rapid pace than earlier in the year. Private nonfarm payroll employment fell 440,000 per month, on average, in the second quarter, down from an average of nearly 700,000 in the first quarter. Most industries reported a slower pace of job loss in recent months, and employment in nonbusiness services—which includes education and health, along with other categories—rose in June for a second month.
In addition to cutting jobs, firms have reduced their labor input by shortening hours worked. Average weekly hours of production and nonsupervisory workers on private nonfarm payrolls, which had fallen steeply, on net, since last September, edged down further in June. Aggregate hours of these workers fell at an annual rate of nearly 8 percent in the second quarter, only a little less than in the first quarter.
In the household survey, the unemployment rate moved up 0.1 percentage point in June to 9.5 percent. The fraction of workers who were working part time for economic reasons held steady in June, but at a high level. The labor force participation rate dropped back a bit in June, but has fallen relatively little, on net, since the onset of the recession, despite the deterioration in labor demand. Among the factors that may have contributed to the resiliency in labor force participation, the emergency unemployment compensation (EUC) program that began in July 2008 has likely encouraged unemployed
II-2
Source: U.S. Department of Labor, Bureau of Labor Statistics.
2000 2002 2004 2006 2008-800
-600
-400
-200
0
200
400
-800
-600
-400
-200
0
200
400Thousands
1999 2001 2003 2005 2007 2009
June
3-month moving average
Changes in Private Payroll Employment
2000 2002 2004 2006 200832.5
33.0
33.5
34.0
34.5
35.0 Hours
94
96
98
100
102
104
106
108
1102002 = 100
1999 2001 2003 2005 2007 2009
Workweek(left scale)
Aggregate hours (right scale)
June
Aggregate Hours and Workweek of Production and Nonsupervisory Workers
Changes in Employment(Thousands of employees; seasonally adjusted)
1. Nonbusiness services comprises education and health, leisure and hospitality, and "other." 2. Establishment survey. Annual data are percent changes from Q4 to Q4. Quarterly data are percent changes from precedingquarter at an annual rate. Monthly data are percent changes from preceding month. 3. Establishment survey.
II-3
2000 2002 2004 2006 20083
4
5
6
7
8
9
10
11
3
4
5
6
7
8
9
10
11Percent
2001 2003 2005 2007 2009
NBER peakJune
Unemployment Rate
Note: Shaded bar indicates a period of businessrecession as defined by the National Bureau of Economic Research (NBER). The NBER peak is the last business cycle peak as defined by the NBER.
2000 2002 2004 2006 200865.0
65.5
66.0
66.5
67.0
67.5
65.0
65.5
66.0
66.5
67.0
67.5Percent
2001 2003 2005 2007 2009
NBER peak
June
Labor Force Participation Rate
Note: See the note to the figure "Unemployment Rate."
2000 2002 2004 2006 20080.6
0.8
1.0
1.2
1.4
1.6
1.8
0.6
0.8
1.0
1.2
1.4
1.6
1.8Percent of household employment
2001 2003 2005 2007 2009
June
3-month moving average (thick line)
Job Losers UnemployedLess Than 5 Weeks
2000 2002 2004 2006 20082.0
2.5
3.0
3.5
4.0
4.5
5.0
5.5
6.0
6.5
7.0
2.0
2.5
3.0
3.5
4.0
4.5
5.0
5.5
6.0
6.5
7.0Percent of household employment
2001 2003 2005 2007 2009
June
Source: U.S. Department of Labor, Bureau of Labor Statistics.
Persons Working Part Timefor Economic Reasons
Selected Unemployment and Labor Force Participation Rates(Percent; seasonally adjusted)
2008 2009
Rate and group 2008 Q4 Q1 Q2 Apr. May June
Civilian unemployment rateTotal 5.8 6.9 8.1 9.2 8.9 9.4 9.5 Teenagers 18.7 20.7 21.3 22.7 21.5 22.7 24.0 20-24 years old 10.2 11.3 13.0 15.0 14.7 15.0 15.2 Men, 25 years and older 4.8 6.0 7.4 8.8 8.3 9.0 9.2 Women, 25 years and older 4.4 5.2 6.2 6.9 6.6 7.0 7.0
Labor force participation rateTotal 66.0 65.9 65.6 65.8 65.8 65.9 65.7 Teenagers 40.2 38.7 38.3 38.4 38.1 38.5 38.6 20-24 years old 74.4 74.1 73.7 74.1 75.0 73.7 73.4 Men, 25 years and older 75.4 75.2 74.6 74.9 74.6 75.1 75.0 Women, 25 years and older 60.0 60.1 60.0 60.3 60.3 60.3 60.3
II-4
Labor Market Indicators
2000 2002 2004 2006 20081
2
3
4
5
6
7
8
9
10
1
2
3
4
5
6
7
8
9
10Millions
1999 2001 2003 2005 2007 2009
Regular state programs
Incl. extended andemergency benefits
July 18
July 25
Note: 4-week moving averages. Source: U.S. Dept. of Labor, Employment and TrainingAdministration.
Insured Unemployment
2000 2002 2004 2006 20081.0
1.5
2.0
2.5Percent of private employment
250
300
350
400
450
500
550
600
650
700Thousands
Initial claims(right scale)
Aug.1
1999 2001 2003 2005 2007 2009
Layoffs and discharges(left scale)
May
Note: Data for initial claims are 4-week moving averages. Source: For layoffs and discharges, Job Openings andLabor Turnover Survey; for initial claims, U.S. Dept.of Labor, Employment and Training Administration.
Layoffs and Initial Claims
2000 2002 2004 2006 200820
30
40
50
60
70
80
90
100
110Index, 1980=100
0.5
1.0
1.5
2.0
2.5
3.0
3.5
4.0
4.5
Percent of private employmentplus job openings
1999 2001 2003 2005 2007 2009
May
Job openings(right scale)
Composite Help WantedIndex* (left scale)
*Index of staff composite help wanted advertising as a percentof private payroll employment. Source: For job openings, Job Openings and Labor TurnoverSurvey; for Help Wanted Index, Conference Board and staffcalculations.
July
Job Openings
2000 2002 2004 2006 20085
10
15
20
25
30
35
40
45Percent
10
30
50
70
90
110
130
150Index
1999 2001 2003 2005 2007 2009
July
Job Availability and Hard-to-Fill Positions
*Proportion of households believing jobs are plentiful, minus the proportion believing jobs are hard to get, plus 100. **Percent of small businesses surveyed with at least one"hard-to-fill" job opening. Seasonally adjusted by FRB staff. Source: For job availability, Conference Board; for hard-to-fill, National Federation of Independent Business.
Note: Percent planning an increase in employmentminus the percent planning a reduction. Source: National Federation of Independent Business (NFIB); Manpower, Inc.
Net Hiring Plans
2000 2002 2004 2006 200830
45
60
75
90
105
120
30
45
60
75
90
105
120Index
1999 2001 2003 2005 2007 2009
July
Reuters/Michigan
Conference Board
Note: The proportion of households expecting labormarket conditions to improve, minus the proportion expectingconditions to worsen, plus 100. Source: Conference Board; Reuters/University of MichiganSurveys of Consumers.
Expected Labor Market Conditions
II-5
Output per Hour(Percent change from preceding period at an annual rate;
seasonally adjusted)
2007:Q2 2008:Q2 2008 2009to to
Sector 2008:Q2 2009:Q2 Q3 Q4 Q1 Q2
Nonfarm business All persons 2.6 1.6 -.1 .8 .3 5.3
All employees1 2.1 1.4 -.6 -1.0 1.0 6.1
Note: All figures are staff estimates. 1. Assumes that the growth rate of hours of non-employees equals the growth rate of hours of employees. Source: For output, U.S. Dept. of Commerce, Bureau of Economic Analysis; for hours, U.S. Dept. of Labor,Bureau of Labor Statistics.
2 The staff estimates that emergency benefits may currently be contributing about ½ percentage point
to the levels of the unemployment rate and labor force participation rate.
individuals to stay in the labor force.2 In addition, losses in household balance sheets may have led some workers to delay retirement and some secondary workers to enter the labor force.
Other indicators also suggest a slower pace of deterioration in labor demand. With the effects of changes in the timing of summer shutdowns in the auto industry and other difficulties with seasonal adjustment largely behind us, both initial claims for unemployment insurance and insured unemployment appear to have moved down since June. Layoff rates—as gauged by the layoff and discharge rate from the Job Openings and Labor Turnover Survey and the percentage of short-term job losers from the household survey—stayed high in recent months, while measures of job vacancies appear to have stabilized at low levels. In addition, alternative measures of labor market slack—job availability as reported in the Conference Board survey and hard-to-fill positions as indicated in the NFIB survey—have not deteriorated further.
Regarding forward-looking indicators of labor market conditions, hiring plans in the NFIB survey have moved up a bit so far this year, and those in the Manpower survey have edged sideways; both series had fallen steeply during the past two years. In addition, households’ expectations of future labor market conditions have shown a marked improvement.
II-6
Selected Components of Industrial Production (Percent change from preceding comparable period)
1. From fourth quarter of preceding year to fourth quarter of year shown. 2. Includes related electronic components. ... Not applicable. Source: Federal Reserve, G.17 Statistical Release, "Industrial Production and Capacity Utilization."
Annual rate Monthly rate
Capacity Utilization (Percent of capacity)
1972- 1994- 2001- 2008 2009 2008 95 02
Sector average high low Q4 Q1 Q2 May June
Total industry 80.9 84.9 73.5 74.2 70.4 68.4 68.2 68.0
Source: Federal Reserve, G.17 Statistical Release, "Industrial Production and Capacity Utilization."
II-7
3 The series for capacity utilization in manufacturing begins in January 1948. 4 Boeing had expected to begin deliveries of the Dreamliner in 2010. As of Greenbook publication,
Boeing had not announced a revised delivery schedule for the 787. 5 Boeing lowered its expected deliveries for both the 747 freighter and the 777 starting around midyear.
The staff estimates that output per hour in the nonfarm business sector increased at an annual rate of 5.3 percent in the second quarter after edging up at a rate of 0.3 percent in the first quarter. Over the four quarters ending in the second quarter of this year, labor productivity is estimated to have risen 1.6 percent.
Industrial Production
The pace of decline in industrial production (IP) slowed markedly to a still considerable annual rate of about 12 percent in the second quarter. The available indicators of production for July, including weekly output data, suggest that IP increased noticeably last month, led by a jump in motor vehicle assemblies; excluding motor vehicles, output in manufacturing likely rose a bit last month. Regarding capacity utilization, the factory operating rate recorded another historical low in June: At 64.6 percent, this rate was about 4 percentage points below its previous cyclical record low in December 1982.3
After having fallen at an annual rate of nearly 70 percent in the first quarter, the production of motor vehicles and parts declined another 14 percent in the second quarter. Preliminary estimates for July indicate that light vehicle assemblies rose sharply and, combined with a concurrent rise in parts output, likely contributed about ¾ percentage point to the rate of change in total IP last month. Elsewhere in the transportation sector, the output of aircraft and parts declined roughly 16½ percent at an annual rate in the second quarter, as production moved down following a post-strike rebound to a somewhat above normal level earlier this year. Recently, Boeing announced a further delay in the 787 Dreamliner program.4 Despite the delay, commercial aircraft production probably will remain close to current levels in coming months due to Boeing’s large backlog of orders.5
After tumbling in the first quarter, the production of high-tech equipment fell at a more modest annual rate of 7½ percent in the second quarter. Production in the various components was mixed last quarter, as continued declines in the output of computers and communications equipment were partly offset by an increase in semiconductor output. The second-quarter gain in semiconductors was mostly due to higher chip production, particularly of microprocessors and DRAM, which partly reflected the replenishment of inventories following substantial reductions in the past few quarters; output in nonchip categories, such as circuit boards, continued to move down. For computers, unit
II-8
Indicators of High-Tech Manufacturing Activity
2002 2003 2004 2005 2006 2007 2008 2009 5.5
6.0
6.5
7.0
7.5 8.0 8.5 9.0 9.510.0
11.0
12.0
Note: FRB seasonals. MPU is a microprocessor unit. Q3 Intelrevenue is the midpoint of the range given by the company’sguidance as of July 14, 2009. Source: Intel; Semiconductor Industry Association.
Worldwide MPU shipments
Intel revenue
Billions of dollars, ratio scale
Q3
MPU Shipments and Intel Revenue
2002 2003 2004 2005 2006 2007 2008 2009 60
70
80
90
100
110
120
130
140
June
Shipments
Orders
Note: U.S. and Canadian orders and shipments of bare andloaded circuit boards. Source: Institute for Printed Circuits.
Billions of dollars
Circuit Board Orders and Shipments
2002 2003 2004 2005 2006 2007 2008 20090.40
0.45
0.50
0.55
0.60
0.65
0.70
0.75
0.80
10.5
11.011.512.012.513.0
14.0
15.0
16.0
17.0
18.0
Q2
Millions of units, ratio scale
PCs (right scale)
Servers (left scale)
Millions of units, ratio scale
Note: FRB seasonals. PC and server units represent the most recent U.S. data available from IDC. Q2 PC units are from the Top 10data release. Q2 server units are also from the Top 10 (with total servers implied from PC servers) data release. Source: IDC.
U.S. Personal Computer and Server Absorption
2003 2004 2005 2006 2007 2008 200940
50
60
70
80
90Diffusion index
Q2
Note: Based on survey question on firms’ plans to increase or decrease their spending on high-tech equipment in the next 12 months. Source: NABE Industry Survey.
High-Tech Spending Plans
2001 2002 2003 2004 2005 2006 2007 2008 200930
35
40
45
50
55
60
657075
Annual average
Note: FRB seasonals. Includes AT&T, Verizon, Sprint Nextel,and companies related by merger, acquisition, or spinoff. Source: Securities and Exchange Commission filings.
Q2
Billions of dollars, ratio scale
Capital Expenditures by Selected Telecommunications Service Providers
2002 2003 2004 2005 2006 2007 2008 2009 60
80
100
120
140
U.S. sales
Cisco
Note: FRB seasonals. Q3 Cisco revenue is the midpointof the company’s guidance as of August 5, 2009. Source: Synergy Research Group and Cisco Systems.
Q1
+ Q3
2006:Q1 = 100
Cisco Revenue and U.S. Sales of High-EndData Networking Equipment
II-9
shipments moved slightly higher in the second quarter, but real output fell as production shifted toward lower-valued machines, such as netbooks. The output of communications equipment in the second quarter declined at an annual rate of 20 percent, a decrease broadly consistent with the steep drop in capital expenditures by major telecommunications service providers over the first half of the year.
Indicators of future movements in high-tech output continue to be mixed. For semiconductors, Intel is upbeat about semiconductor demand over the remainder of this year, but it also reported that its revenue will decline in the third quarter, partly because of the shift to lower-priced chips. After having plunged in the first quarter, orders for circuit boards increased last quarter, and shipments rose in June for the first time this year. Further downstream, anecdotes remain mixed, but several industry sources report an increase in third-quarter PC demand. Cisco recently announced that its revenue was flat in the second quarter and will be little changed in the third quarter. Although Cisco reported that its orders began to increase last quarter, it was not certain that the pickup would be sustained. Finally, the diffusion index of planned capital spending on high-tech equipment in the NABE’s quarterly survey was little changed in the second quarter; at about 50, the index suggests that high-tech spending is likely to remain lackluster in the near term.
In the energy sector, production fell at an annual rate of 14 percent in the second quarter, reflecting weather-related drops in the output of utilities and continued sharp declines in drilling activity.
Excluding the production of energy, motor vehicles, aircraft, and high-technology products, output fell at an annual rate of 11 percent in the second quarter, about one-half of the pace of decline in the first quarter. While the markedly slower pace of decline was broadly based, a notable exception was the output of business equipment, whose 21 percent plunge last quarter was only slightly less steep than in the first quarter. Elsewhere, the production of consumer goods fell at an annual rate of 5 percent last quarter—after dropping 9 percent in the first quarter—as declines continued in both durables and nondurables. The indexes for both construction and business supplies also fell at a slower pace last quarter. The production of durable materials declined at an annual rate of 24 percent in the second quarter, but the index for nondurable materials was little changed, in part because of higher output in the chemical industry.
Indicators of near-term manufacturing activity have brightened somewhat recently and suggest that factory output is poised to turn up modestly in the next few months. The
II-10
Indicators of Industrial Activity
15.0
15.5
16.0
16.5
17.0
17.5
18.0
18.5
19.0Index
Oct. Nov. Dec. Jan. Feb. Mar. Apr. May June July2008 2009
Note: One index point equals 1 percent of 2002 total industrialoutput. Source: Federal Reserve, G.17 Statistical Release, "IndustrialProduction and Capacity Utilization."
Monthly aggregate of weekly indexWeekly index
Weekly Production Index excluding Motor Vehicles
2002 2003 2004 2005 2006 2007 2008 20090.0
0.1
0.2
0.3
0.4
0.5
0.6
0.7
0.8
0.9
1.0
0
2
4
6
8
10
12
14Millions of unitsMillions of units
+July
Medium and heavy trucks(left scale)
Note: July values are based on latest industry schedules. Source: Ward’s Communications.
+
Autos and light trucks(right scale)
Motor Vehicle Assemblies
1975 1980 1985 1990 1995 2000 2005 2010 0
10
20
30
40
50
60
70
80
90
100
NBER peak
Note: The diffusion index equals the percentage of seriesthat increased relative to 3 months earlier plus one-half thepercentage that were unchanged. Source: Federal Reserve, G.17 Statistical Release, "IndustrialProduction and Capacity Utilization."
June
Index
IP Diffusion Index
2007 2008 2009 2010
0
20
40
60
80
100
120
140
160
180
Note: 1998 price-weighted index. Actual completions equaldeliveries plus the change in the stock of finished aircraft.
Source: Boeing.
Boeing strike
Actual
2002 = 100
Boeing Commercial Aircraft Completions: Actual
2002 2003 2004 2005 2006 2007 2008 2009 2010-8
-6
-4
-2
0
2
4
6
10
20
30
40
50
60
70
80Percent
ISM (right scale)
RADGO (left scale)
Note: The measure for real adjusted durable goods orders(RADGO) is a 3-month moving average. Source: Institute for Supply Management (ISM). RADGO is compiled by FRB staff based on data from the Bureau of Labor Statistics and the U.S. Census Bureau.
July
Diffusion index
June
ISM New Orders Diffusion Index and Change in Real Adjusted Durable Goods Orders
2002 2003 2004 2005 2006 2007 2008 2009 90
95
100
105
110
115
120
125
130
Foreign
Domestic
Note: The foreign IP index is a fixed-weighted averageof IP indexes from Canada, Mexico, Japan, China, the UnitedKingdom, Germany, France, Taiwan, and Italy. Source: Federal Reserve, G.17 Statistical Release, "IndustrialProduction and Capacity Utilization." The foreign IP index is a staffcalculation based on IP indexes reported by the included countries.
May
June
2002 = 100
U.S. and Foreign Industrial Production Indexes
m1ars02
Typewritten Text
Content partially redacted.
II-11
6 About 40 percent of the jump in schedules this quarter reflects the planned resumption of production
at GM and Chrysler. The other 60 percent reflects scheduled production increases at the other major automakers, particularly Ford and Toyota.
three-month moving average of the staff’s series on real adjusted durable goods orders rose for the second straight month in June, and both the diffusion index of new orders from the national manufacturing ISM survey and the average of the new orders diffusion indexes from the regional manufacturing surveys moved above 50 last month. Lastly, manufacturing activity in the foreign sector appears to have edged up in recent months, possibly signaling the return of some external support for domestic manufacturing.
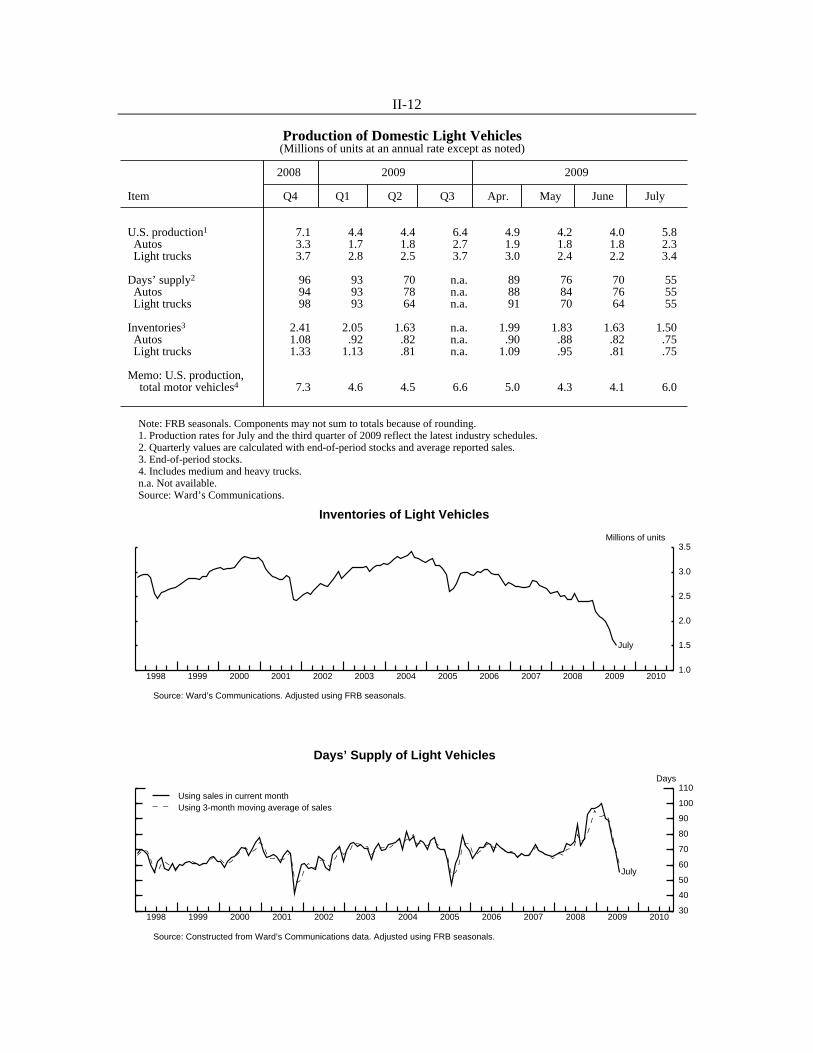
Motor Vehicles
Production of light motor vehicles was at an annual rate of about 4½ million units in the second quarter—little changed from its historically low first-quarter rate—as the effects of the shutdowns at GM and Chrysler were offset by modest increases in production at most other automakers. The pullback in production this year has slashed dealers’ stocks of domestic light vehicles to extremely low levels, and the days’ supply of vehicles fell from a peak of 100 days in February to a fairly comfortable 70 days at the end of the second quarter. Days’ supply fell further to an extremely low level in July as sales were boosted appreciably by the government’s so called cash-for-clunkers program (see below for more discussion).
The latest industry schedules call for production to rise substantially in the third quarter, to an annual rate of 6.4 million units, reflecting the resumption of operations at GM and Chrysler and efforts by other automakers to boost assemblies now that inventories have become leaner.6 The weekly production data we have received for July point to an appreciable rise in vehicle output. Production at scheduled levels this quarter should help bring inventories into better balance.
Sales of light motor vehicles edged up in the second quarter, rising for the first time since the recession began. The improvement in the second quarter coincided with both a decrease in consumers’ concerns about tight credit conditions and a rise in the percentage of respondents in the Reuters/University of Michigan Surveys of Consumers noting lower prices and the availability of good deals.
II-12
Production of Domestic Light Vehicles(Millions of units at an annual rate except as noted)
Memo: U.S. production, total motor vehicles4 7.3 4.6 4.5 6.6 5.0 4.3 4.1 6.0
Note: FRB seasonals. Components may not sum to totals because of rounding. 1. Production rates for July and the third quarter of 2009 reflect the latest industry schedules. 2. Quarterly values are calculated with end-of-period stocks and average reported sales. 3. End-of-period stocks. 4. Includes medium and heavy trucks. n.a. Not available. Source: Ward’s Communications.
Note: Components may not sum to totals because of rounding. 1. Excludes some vehicles produced in Canada that are classified as imports by the industry. 2. Domestic market share excludes sales of foreign brands affiliated with the Detroit Three. Source: Ward’s Communications. Adjusted using FRB seasonals.
2002 2003 2004 2005 2006 2007 2008 2009 201020
30
40
50
60
70
80
90
100
110 Percent
0
20
40
60
80
100
120
140
160
180Index
20
30
40
50
60
70
80
90
100
110
July
JulyGood time to buy: low prices(left scale)
Appraisal of car-buying conditions (right scale)
Car-Buying Attitudes
Source: Reuters/University of Michigan Surveys of Consumers.
2004 2005 2006 2007 2008 20091000
1400
1800
2200
2600
3000
Aug.2
Current dollars per vehicle, ratio scale Average Value of Incentives on Light Vehicles
Note: Weekly weighted average of customer cash rebate and the present value of interest rate reduction. Source: J.D. Power and Associates. Adjusted using FRB seasonals.
m1ars02
Typewritten Text
Content redacted.
m1pmg01
Typewritten Text
Content redacted.
II-14
Real Personal Consumption Expenditures(Percent change from preceding comparable period)
Note: Shaded bars indicate periods of business recession as defined by the National Bureau of Economic Research (NBER). The NBER peak is the last business cycle peak as defined by the NBER.
Change in Real PCE Goods
Source: U.S. Department of Commerce, Bureau of Economic Analysis.
Note: Shaded bars indicate periods of business recession as defined by the National Bureau of Economic Research (NBER). The NBER peak is the last business cycle peak as defined by the NBER. Source: U.S. Department of Commerce, Bureau of Economic Analysis.
2007 2008 2009-0.8
-0.6
-0.4
-0.2
-0.0
0.2
0.4
0.6
0.8
1.0
-0.8
-0.6
-0.4
-0.2
-0.0
0.2
0.4
0.6
0.8
1.0Percent
Monthly
6-monthmoving average
June
II-15
7 Sales at GM, which emerged from bankruptcy on July 10, increased significantly in July after having
been well maintained in recent months. In spite of the company’s highly publicized restructuring, its market share has recovered some after bottoming out earlier this year. In contrast, although Chrysler, which emerged from bankruptcy on June 10, also realized a jump in July sales, it has ceded market share.
8 Many automakers also launched extremely generous promotions to coincide with the start of the government’s cash for clunkers program.
9 Eligible trade-ins are limited to vehicles in drivable condition, which have been continuously insured by the same owner for at least a year prior to trade-in, were manufactured in model year 1984 or later, and have a combined fuel economy rating of 18 miles per gallon (mpg) or less. Trade-ins must be replaced by a new vehicle priced at $45,000 or less. The new auto must get at least 22 mpg and be at least 4 mpg more fuel efficient than the old vehicle to qualify for a $3,500 voucher; if the new car gets at least 10 mpg more than the old vehicle, the voucher is worth $4,500. New light trucks must get at least 18 mpg and be at least 2 mpg more fuel efficient than the old vehicle to qualify for a $3,500 voucher; if the new vehicle gets at least 5 mpg more than the old, the voucher is worth $4,500. Dealers must first provide documentation that trade-ins have been scrapped.
10 As of Greenbook publication, the Congress was considering an extension of funding for cash for clunkers.
In July, sales of light motor vehicles soared about 1.5 million units, to an annual rate of 11.2 million.7 As noted, the surge in demand last month largely resulted from the cash for clunkers program, and the composition of the sales increase was heavily skewed towards automobiles.8 The Congress allocated $1 billion to the program under the Consumer Assistance to Recycle and Save (or CARS) Act, which was enacted in June. The program—which provides auto dealers with vouchers to be applied against the purchase price of new vehicles after eligible trade-ins—officially began on July 27 and was expected to run through the end of October.9 However, the response so dramatically exceeded expectations that all of the vouchers appear to have been exhausted by early August.10 Although the program is boosting sales significantly, much of that increment in demand appears likely to be borrowed from later in the year.
Consumer Spending
Consumer spending in the first half of this year moved a little lower, on balance, after having fallen sharply in the second half of last year. The fiscal stimulus package, including lower tax withholdings for workers, one-time payments for retirees, and increased benefits for the unemployed, has provided a noticeable boost to disposable income in the first half of the year but could not overcome the restraint on household purchases from the weak labor market and the substantial earlier declines in net worth. Real PCE edged down 0.1 percent in June after holding steady in May and declining 0.2 percent in April. Apart from the jump in motor vehicle sales last month, indicators of other spending in July, such as ICSC’s weekly chain store sales and MasterCard’s estimate of retail sales, were mixed.
II-16
Fundamentals of Household Spending
-6
-4
-2
0
2
4
6
8
-6
-4
-2
0
2
4
6
812-month percent change
1999 2001 2003 2005 2007 2009
June
Note: Values for December 2004 and December 2005 exclude the effect on income of the one-time Microsoft dividendin December 2004. Source: U.S. Department of Commerce, Bureau of Economic Analysis.
Change in Real Disposable Personal Income
-6
-4
-2
0
2
4
6
8
-6
-4
-2
0
2
4
6
8Percent
1999 2001 2003 2005 2007 2009 Note: The value for December 2004 excludes the effecton income of the one-time Microsoft dividend in that month.
June
Source: U.S. Department of Commerce, Bureau of Economic Analysis.
Personal Saving Rate
5000
7600
10200
12800
15400
18000 Index
4.0
4.5
5.0
5.5
6.0
6.5
7.0Ratio
1999 2001 2003 2005 2007 2009
Household Net Worthand Dow Jones Total Market Index
Total Market Index(left scale)
Ratio of householdnet worth to DPI*
(right scale)
* The value for 2004:Q4 excludes the effect on income ofthe one-time Microsoft dividend in December 2004. Source: Federal Reserve Board; U.S. Department of Commerce, Bureau of Economic Analysis; Wall Street Journal.
Aug. 5
Q2
-1
0
1
2
3
4
5
6
7
-1
0
1
2
3
4
5
6
7Percent
1999 2001 2003 2005 2007 2009
Target Federal Funds Rateand 10-Year Treasury Yield
Note: Shaded bars indicate periods of business recession as defined by the National Bureau of Economic Research (NBER). The NBER peakis the last business cycle peak as defined by the NBER. Source: Reuters/University of Michigan Surveys of Consumers; Conference Board.
July
July
Consumer Confidence
II-17
The personal saving rate, which had jumped slightly above 6 percent in May, moved back down in June to 4½ percent. In large part, the recent movements in the saving rate appear to reflect the transitory boost to disposable income from the fiscal stimulus in recent months. Nonetheless, even after smoothing through the effects of temporary stimulus, the data suggest that households are saving a higher proportion of their income than prior to the recession, as would be expected given the enormous loss of wealth. Whether a structural shift in the saving function is in process will be difficult to discern for quite a while.
Although the usual determinants of spending remain weak, some of the conditions facing households have generally improved recently. Household net worth, while still far below its pre-recession levels, is receiving a boost from the rise in equity prices since their low point in March. In addition, the July Senior Loan Officer Opinion Survey on Bank Lending Practices (SLOOS) indicates that the amount of additional tightening of conditions and standards for consumer credit has moderated further. That said, the weak labor market continues to place significant strains on households. Even though higher transfers and lower taxes led to a significant increase in disposable income in the second quarter, nominal wages and salaries recorded another large decrease last quarter (albeit less than the decrease in the first quarter), and the unemployment rate has continued to rise. In addition, measures of consumer sentiment recently have retraced a portion of their earlier gains, although they still remain well above levels seen at the turn of the year.
Housing
Data from the housing sector over the past few months indicate that construction activity may finally be emerging from its extended decline. In June, single-family housing starts registered a sizable increase, and the level of starts stood 30 percent above its record low in the first quarter of this year. Adjusted permit issuance—which is often a more reliable indicator of the underlying pace of new construction activity—was somewhat below the rate of starts in June but also has generally moved up in recent months. However, in the much smaller multifamily sector, starts have continued to decline, on net, this year after having plunged in the second half of 2008 amid tight credit conditions and rapidly deteriorating demand fundamentals for apartment buildings.
The latest sales data suggest that new housing demand may also be strengthening after having stabilized in the early portion of this year. The Census Bureau’s measure of the number of new-home sales agreements jumped to an annual rate of 384,000 units in June, an increase of 17 percent from the record low in January.
II-18
Private Housing Activity(Millions of units, seasonally adjusted; annual rate except as noted)
2009
Sector 2008 Q1 Q2 Apr. May June
All units Starts .91 .53 .54 .48 .56 .58 Permits .91 .53 .53 .50 .52 .57
Multifamily units Starts .284 .170 .118 .091 .151 .112 Built for rent .217 .140 n.a. n.a. n.a. n.a. Built for sale .068 .030 n.a. n.a. n.a. n.a. Permits .330 .170 .123 .120 .112 .137
Condos and co-ops Existing home sales .563 .467 .520 .490 .500 .570
1. Adjusted permits equal permit issuance plus total starts outside of permit-issuing areas. 2. At current sales rate; expressed as the ratio of seasonally adjusted inventories to seasonally adjusted
sales. Quarterly and annual figures are averages of monthly figures. n.a. Not available. Source: Census Bureau.
Private Housing Starts and Permits(Seasonally adjusted annual rate)
Single-family starts
Single-family adjusted permits
June
Note: Adjusted permits equal permit issuance plus total starts outside of permit-issuing areas. Source: Census Bureau.
Multifamily startsJune
II-19
. Although sales levels still remain quite modest, they have been enough,
given the very slow pace of production, to pare the overhang of unsold single-family houses: In June, these inventories stood at about one-half of their peak in the summer of 2006, and the months’ supply of new homes was down considerably from its record high in January.
Sales of existing single-family houses, which had been fairly flat early in the year, posted their third consecutive monthly increase in June, and pending home sales agreements through June suggest that resale activity will ascend further in the months ahead.11 To be sure, the existing-home market has been supported for much of the year by heightened volumes of transactions involving bank-owned and other distressed properties, which reportedly accounted for about 40 to 45 percent of all sales transactions between December and April—roughly double their share over the same period in the preceding year.12 More recently, however, estimates from the National Association of Realtors indicate that distressed sales dropped to one-third of existing-home transactions in May and June; this development suggests that the most recent uptick in resales has been driven by an increase in transactions of nondistressed properties. Meanwhile, though foreclosure activity has been very elevated for some time now, existing-home inventories have been on a downward trajectory (both in levels and in relation to sales) since early 2008.13
The apparent stabilization in housing demand seen in recent months is likely due, in part, to improvements in housing affordability stemming from low rates for conforming mortgages and lower house prices. Even though the market for private-label nonprime mortgages remains closed, rates for conforming 30-year fixed-rate mortgages—at about 5¼ percent—remain very low by historical standards, and spreads between rates for
11 According to the National Association of Realtors, the high proportion of distressed sales and the unusually tight credit conditions in the housing market have made pending home sales a less-informative leading indicator of existing home sales than usual.
12 Although the data on existing home sales include only sales handled by real estate agents, many foreclosure-related sales are captured in these statistics because banks frequently hire real estate agents to sell repossessed properties.
13 This measure of existing-home inventories includes many structures that are still occupied by owners and renters. The staff estimates that about 1.65 million vacant single-family houses were for sale in the second quarter, up about 40 percent from the level that prevailed when home sales peaked in the summer of 2005. The staff’s measure of vacant homes probably understates the true overhang because it does not factor in vacant houses that are being withheld from the market or are being offered for rent.
II-20
Indicators of Single-Family Housing
2002 2004 2006 2008 20100.2
0.4
0.6
0.8
1.0
1.2
1.4
1.6
Millions of units (annual rate)
0.0
0.1
0.2
0.3
0.4
0.5
0.6
Millions of units (annual rate)
Large homebuilders(right scale)
Total (left scale)
June
2001 2003 2005 2007 2009
Source: For total, Census Bureau; for large homebuilders,National Association of Home Builders.
June
New Single-Family Home Sales
2002 2004 2006 2008 20103.5
4.0
4.5
5.0
5.5
6.0
6.5
Millions of units (annual rate)
60
70
80
90
100
110
120
130
140Index (2001=100)
Existing home sales(left scale)
June
2001 2003 2005 2007 2009
Pending home sales (right scale)
Source: National Association of Realtors.
June
Existing Single-Family Home Sales
2002 2004 2006 2008 20104.5
5.0
5.5
6.0
6.5
7.0
7.5
4.5
5.0
5.5
6.0
6.5
7.0
7.5Percent
2001 2003 2005 2007 2009
30-year conforming FRM
Aug. 5
Source: Federal Home Loan Mortgage Corporation. Note: 2-week moving average.
Mortgage Rates
2002 2004 2006 2008 2010200
250
300
350
400
450
500
550
600 Thousands of units
1
2
3
4
5
6
7
8
9
10
11
12
13Months
June
2001 2003 2005 2007 2009
Inventories of new homes(left scale)
Months’ supply (right scale)
Inventories of New Homes
Note: Months’ supply is calculated using the 3-month movingaverage of sales. Source: Census Bureau.
June
and Months’ Supply
2002 2004 2006 2008 2010-30
-25
-20
-15
-10
-5
0
5
10
15
20
-30
-25
-20
-15
-10
-5
0
5
10
15
20Percent change from year earlier
2001 2003 2005 2007 2009
Source: For FHFA, Federal Housing Finance Agency; for S&P/Case-Shiller, Standard & Poor’s; for LP,LoanPerformance, a division of First American CoreLogic.
May
May
May
Monthly FHFA purchase-only indexLP price index20-city S&P/Case-Shiller monthly price index
Prices of Existing Homes
2007 2008 2009-80
-60
-40
-20
0
20
40
60
80
-80
-60
-40
-20
0
20
40
60
80Diffusion index
Note: Diffusion index is constructed by subtractingexpectations of decrease from expectations of increase. Source: Reuters/University of Michigan Surveys of Consumers.
July
July
5 years ahead
1 year ahead
House Price Expectations
II-21
jumbo and standard conforming loans have continued to narrow in recent months (even if they remain elevated relative to pre-crisis norms). As for house prices, the repeat-sales price index for existing single-family homes calculated by LoanPerformance fell 9¼ percent over the 12 months ending in May, a somewhat slower rate of decrease than over the preceding 12-month period.14 Although the declines in house prices over the past several years have been good for affordability, that positive influence appears still to be tempered to a degree by the sizable number of potential homebuyers who remain hesitant to purchase houses for fear of additional price declines.
Equipment and Software
Real investment in equipment and software (E&S) continued to contract sharply in the second quarter, although the estimated 8¼ percent annual rate of decline was substantially smaller than in the previous two quarters. The moderation in the rate of decrease in E&S spending resulted from a flattening in business purchases of motor vehicles and a slower rate of decline elsewhere.
Business outlays on motor vehicles leveled off in the second quarter after an extended period of steep declines. Medium and heavy truck sales increased in both May and June. However, both truck sales and orders remain extremely depressed. Deliveries to rental car companies dropped in May and June but rebounded some last month.15 Demand for light vehicles from other businesses moved sideways last quarter—albeit at a very low level—and increased a fair bit in July.
In the high-tech sector, real spending declined, on balance, in the second quarter, though with mixed results across components. Real outlays on computers and peripheral equipment edged up at an annual rate of about 5 percent in the second quarter, the first increase since a year ago. However, the BEA estimates that business spending on software continued to fall in the second quarter, at an annual rate of 12½ percent. As for forward-looking indicators, orders for high-tech equipment were up, on balance, in recent months from their low point in the first quarter, but the NABE index of capital spending plans for computers and communications equipment remained at a low level in July.
14 Although some measures of house prices have been about flat in recent months, the monthly data
tend to be noisy and are subject to revision. 15
.
II-22
2000 2002 2004 2006 200870
90
110
130
150
170
190210
240
7
9
11
13
15
17
1921
242000 = 100 Billions of chained (2000) dollars, ratio scale
2000 2001 2002 2003 2004 2005 2006 2007 2008 2009
June
Note: Shipments are deflated by the staff price indexfor computers and peripheral equipment, which is derivedfrom the quality-adjusted price indexes of the BEA. Source: Census Bureau; FRB Industrial Production.
Real M3shipments
(right scale)
Industrial production(left scale)
Computers and Peripherals
2000 2002 2004 2006 20082
5
8
11
14
1720
2
5
8
11
14
1720
Billions of chained (2000) dollars, ratio scale
2000 2001 2002 2003 2004 2005 2006 2007 2008 2009
June
Note: Shipments and orders are deflated by a price index that is derived from the pre-benchmark revision quality-adjusted price indexes of the BEA and uses the producerprice index for communications equipment for monthlyinterpolation. Source: Census Bureau.
ShipmentsOrders
Communications Equipment
2000 2002 2004 2006 2008120
260
400
540
680820960
1240
120
260
400
540
680820960
1240Thousands of units, ratio scale
2000 2001 2002 2003 2004 2005 2006 2007 2008 2009
June
Note: Annual rate, FRB seasonals. Source: For sales, Ward’s Communications; for orders, ACT Research.
Sales of class 4-8 trucks
Net new ordersof class 5-8 trucks
Medium and Heavy Trucks
2000 2002 2004 2006 200830
34
38
42
46
50
54
59
30
34
38
42
46
50
54
59Billions of chained (2000) dollars, ratio scale
2000 2001 2002 2003 2004 2005 2006 2007 2008 2009
June
Note: Shipments and orders are deflated by the staff priceindexes for the individual equipment types included in thiscategory. Indexes are derived from the pre-benchmark revisionquality-adjusted price indexes of the BEA. Source: Census Bureau.
Orders
Shipments
Non-High-Tech, Nontransportation Equipment
Orders and Shipments of Nondefense Capital Goods(Percent change; seasonally adjusted current dollars)
Memo: Shipments of complete aircraft2 40.3 36.8 38.5 36.2 35.8
1. Excludes most terrestrial transportation equipment. 2. From Census Bureau, Current Industrial Reports; billions of dollars, annual rate. Source: Census Bureau.
Source: U.S. Dept. of Commerce, Bureau of Economic Analysis.
NBER peak
Note: Shaded bar indicates a period of business recession as defined by the National Bureau of Economic Research (NBER).The NBER peak is the last business cycle peak as defined by the NBER.
Real Business Output
1990 1995 2000 2005 2010-15
-10
-5
0
5
10
15
20
-15
-10
-5
0
5
10
15
204-quarter percent change
1991 1993 1995 1997 1999 2001 2003 2005 2007 2009
Q2
Source: Staff calculation.
NBER peak
User Cost of Capital
1990 1995 2000 2005 20104
6
8
10
12
14
16
18
20
4
6
8
10
12
14
16
18
20Percent
1991 1993 1995 1997 1999 2001 2003 2005 2007 2009
10-year BBB
10-year high-yield
Aug
Note: End of month. August value as of August 5. Source: Merrill Lynch.
NBER peak
Corporate Bond Yields
1990 1995 2000 2005 2010-4
0
4
8
12
16
20 Percent
-22
-18
-14
-10
-6
-2
2
6
10
14
18Percent
1991 1993 1995 1997 1999 2001 2003 2005 2007 2009
June
Credit more difficult to obtain (left scale)
Credit expected to be tighter (right scale)
Note: Of borrowers who sought credit in the past 3 months,the proportion that reported or expected more difficulty inobtaining credit less the proportion that reported or expectedmore ease in obtaining credit. Seasonally adjusted. Source: National Federation of Independent Business (NFIB).
NBER peak
NFIB: Survey on Loan Availability
1990 1995 2000 2005 201020
30
40
50
60
70
80
20
30
40
50
60
70
80Diffusion index
1991 1993 1995 1997 1999 2001 2003 2005 2007 2009
July
Source: Institute for Supply Management (ISM), ManufacturingISM Report on Business; Philadelphia Fed Business Outlook Survey.
NBER peakISMPhiladelphia Fed
Surveys of Business Conditions
II-24
Nonresidential Construction and Indicators(All spending series are seasonally adjusted at an annual rate)
2000 2002 2004 2006 2008 2010240
260
280
300
320
340
360
380
240
260
280
300
320
340
360
380Billions of chained (2005) dollars
1999 2001 2003 2005 2007 2009
June
Note: Nominal Construction Put in Place (CPIP) deflated bythe revised prices of the Bureau of Economic Analysis (BEA)through Q2. Source: Census Bureau.
Total Structures
2000 2002 2004 2006 2008 20100
10
20
30
40
50
60
70
80
90
100
110
120
0
10
20
30
40
50
60
70
80
90
100
110
120Billions of chained (2005) dollars
1999 2001 2003 2005 2007 2009
Office, Commercial,
Note: Nominal CPIP deflated through Q1 by BEA prices from the Q1 final release and by staff projection for Q2.Other consists of structures for religious organizations,education, lodging, amusement and recreation,transportation, and health care. Source: Census Bureau.
Office
CommercialJune
Other
Communication
Communication, and Other
2000 2002 2004 2006 2008 201015
20
25
30
35
40
45
50
55
60
65
70
75
15
20
25
30
35
40
45
50
55
60
65
70
75Billions of chained (2005) dollars
1999 2001 2003 2005 2007 2009
JuneManufacturing
Power
Note: Nominal CPIP deflated through Q1 by BEA prices from the Q1 final release and by staff projection for Q2. Source: Census Bureau.
Manufacturing and Power
2000 2002 2004 2006 2008 2010-2.5
-2.0
-1.5
-1.0
-0.5
0.0
0.5
1.0
1.5
2.0
2.5
3.0 Percent
20
25
30
35
40
45
50
55
60Diffusion index
June
1999 2001 2003 2005 2007 2009
Architectural Billings andNonresidential Construction Employment
Note: Both series are 3-month moving averages. Employmentconsists of industrial, commercial, and specialty trade construction. Source: For billings, American Institute of Architects; foremployment, U.S. Department of Labor, Bureau of Labor Statistics.
June
Billings (right scale)
Change inemployment (left scale)
2000 2002 2004 2006 2008 20103
6
9
12
15
18
3
6
9
12
15
18Percent
1999 2001 2003 2005 2007 2009
Note: Industrial space includes both manufacturingstructures and warehouses. Source: Torto Wheaton Research.
Q1
Office
Retail
Industrial
Vacancy Rates
2000 2002 2004 2006 2008 20100
5
10
15
20
25
30
35 Millions of feet
400
600
800
1000
1200
1400
1600
1800
2000
2200
2400
2600Number
Drilling rigsin operation(right scale)
July
1999 2001 2003 2005 2007 2009 Note: The July readings for drilling rigs are based ondata through July 31, 2009. Both series are seasonallyadjusted by FRB staff. Source: For footage drilled, U.S. Department of Energy,Energy Information Agency; for drilling rigs, Baker Hughes.
Footage drilled (left scale)
June
Drilling and Mining Indicators
II-25
Outside of high-tech and transportation, real spending on equipment dropped again in the second quarter but at a less precipitous pace than in the previous quarter. Although orders in June remained below shipments in this category, the gap has closed somewhat, implying a slower rate of decline in firms’ backlogs of unfilled orders and suggesting somewhat diminished downward pressure on shipments in coming months.
Although the fundamental determinants of investment in E&S remain weak, conditions appear less unfavorable, on balance, than earlier in the year. In particular, the decline in business output was less pronounced last quarter than in prior quarters, and the user cost of capital fell back somewhat in the second quarter after spiking last year. Other forward-looking indicators have generally improved recently, but they remain at levels consistent with a weak outlook for E&S investment. Corporate bond spreads over Treasury securities have continued to ease, and monthly surveys of business conditions and sentiment generally have been less downbeat than earlier in the year. In addition, the July SLOOS reported that the net percentage of banks that tightened on commercial and industrial loans receded somewhat, although the share of small businesses reporting increased difficulty in obtaining credit remained quite high in the June NFIB survey.
Nonresidential Construction
Conditions in the nonresidential construction sector generally remain dismal, with spending in most major categories remaining on a downward trajectory through June. While real spending excluding drilling and mining moved up somewhat in the second quarter, this increase came on the heels of significant declines over the preceding two quarters and was driven almost entirely by energy-related projects (such as new electricity generation facilities and refinery expansions), which surged noticeably in the second quarter. Apart from this pocket of strength, construction activity continues to be under downward pressure from a slew of negative fundamentals: Available data show that vacancy rates are rising and that property prices are generally plunging across sectors. In addition, measures of architectural billings through June remained at levels consistent with further spending declines, and the nonresidential construction industry has continued to shed workers. Finally, as indicated by the July SLOOS, the financing environment for nonresidential construction projects remains very tight, and available Call Report data from the first quarter show that banks are paring back nonresidential construction lending.
Real spending on drilling and mining structures dropped at an annual rate of 70 percent in the second quarter after an even larger decline in the first quarter; available indicators suggest that activity has tracked sideways at a low level in recent weeks. The steep net
II-26
2000 2002 2004 2006 20081.1
1.2
1.3
1.4
1.5
1.6
1.7
1.8
1.9
1.1
1.2
1.3
1.4
1.5
1.6
1.7
1.8
1.9 Months
2000 2001 2002 2003 2004 2005 2006 2007 2008 2009
May
June
Census book-value data
Staff flow-of-goods system
Note: Flow-of-goods system covers total industry ex.motor vehicles and parts, and inventories are relativeto consumption. Census data cover manufacturing and trade ex. motor vehicles and parts, and inventories arerelative to sales. Source: Census Bureau; staff calculation.
Inventory Ratios ex. Motor Vehicles
2000 2002 2004 2006 200835
40
45
50
55
60
35
40
45
50
55
60 Index
2000 2001 2002 2003 2004 2005 2006 2007 2008 2009
July
Note: A number above 50 indicates inventories are "too high." Source: Institute for Supply Management (ISM), ManufacturingISM Report on Business.
ISM Customers’ Inventories:Manufacturing
Nonfarm Inventory Investment (Billions of dollars; seasonally adjusted annual rate)
2008 2009
Measure and sector Q4 Q1 Q2 Apr. May June
Real inventory investment(chained 2000 dollars)Total nonfarm business e -35.7 -114.9 -148.6 ... ... ... Motor vehicles -.7 -63.6 -47.1 ... ... ... Nonfarm ex. motor vehicles e -35.0 -51.3 -101.5 ... ... ...
Book-value inventory investment(current dollars) Manufacturing and trade ex. wholesale and retail motor vehicles and parts -155.9 -143.2 n.a. -147.7 -108.5 n.a. Manufacturing -65.2 -77.3 -57.3 -73.4 -48.4 -50.1 Wholesale trade ex. motor vehicles & parts -55.7 -47.3 n.a. -48.4 -35.4 n.a. Retail trade ex. motor vehicles & parts -34.9 -18.6 n.a. -26.0 -24.8 n.a.
... Not applicable. e Staff estimate of real inventory investment based on revised book-value data. Source: For real inventory investment, U.S. Dept. of Commerce, BEA; for book-value data, Census Bureau.
II-27
16 In all, real nonfarm inventories are estimated to have fallen at an annual rate of $149 billion in the
second quarter, with about one-third of this liquidation occurring in the motor vehicle sector. 17 The ARRA and expanded EUC benefits are estimated to have boosted outlays in the April–June
period of this year by about $64 billion. In the same period last year, spending was increased by about $30 billion by the portion of the 2008 stimulus rebates that was scored as a budget outlay. As a result, the rise in stimulus-related payments contributed around 4 percentage points to the 10 percent increase in outlays in the April–June period.
decline in energy prices from last summer’s peak has greatly diminished incentives for additional drilling activity. This downward pressure has been particularly pronounced in the natural gas sector, as spot prices have remained near a seven-year low because of weak demand and a glut of new supply from recently developed fields.
Business Inventories
The sharp cuts in production this year have reduced inventory stocks significantly, though stocks remain high relative to the weak level of sales. In the second quarter, real nonfarm inventories excluding motor vehicles are estimated to have fallen at an annual rate of $102 billion following a decline of $51 billion in the first quarter.16 Similarly, the staff’s flow-of-goods (FOG) inventory system indicates a considerable reduction in inventories last quarter. Nonetheless, both the Census and FOG system measures of months’ supply remain high, suggesting that further inventory cuts are in store if sales remain near their current pace. However, the ISM’s index of customers’ inventories moved further into favorable territory in July; this reading hints at more-modest declines in inventory stocks going forward.
Federal Government Sector
The deficit in the federal unified budget deteriorated further in June. The budget costs associated with the Troubled Asset Relief Program (TARP), the conservatorship of the mortgage-related GSEs, the American Recovery and Reinvestment Act of 2009 (ARRA), and the effects of the recession on revenues and outlays have all contributed to the continued widening of the budget gap. The deficit for the 12 months ending in June totaled almost $1.3 trillion, about $1 trillion larger than in the same period a year earlier.
Federal outlays, adjusted for payment-timing shifts and excluding financial transactions such as those related to the TARP and the GSE conservatorship, were 10 percent higher in the April–June period than a year earlier. The surge in these outlays has primarily reflected an increase in stimulus-related spending and the rise in income-support payments as labor market conditions have deteriorated.17 Notably, outlays for regular unemployment insurance benefits have soared, and payments for the temporary EUC program have been greater than anticipated last winter when the program was expanded.
II-28
Federal Government Budget(Unified basis; adjusted for payment-timing shifts and financial
transactions; data from Monthly Treasury Statement)
Note: Thin line includes deficit effects of financial transactions related to Troubled Asset Relief Program (TARP) and government-sponsored enterprise equity purchase programs.
1. Includes Social Security, Medicare, Medicaid, and income security programs. ... Not applicable.
II-29
Effects of Recent Stimulus Actions on Federal Unified Budget (Billions of dollars, effect on deficit)
Component 2009
Q1 Q2
Deficit 23 91
Outlays 17 64Unemployment benefits 8 12 Social Security and veterans’ one-time
payments, food stamps, student aid 0 17 Grants for Medicaid and education 9 21 Other expenditures 0 14
Taxes 6 27 Individual income taxes 1 12 Corporate income taxes 5 15
Note: Includes effects of the American Recovery and Reinvestment Act and all payments by the emergency unemployment compensation program.
Source: Recovery.gov; Monthly Treasury Statement; U.S. Congress, Joint Committee on Taxation; staff estimates.
18 While the 2009 stimulus plan is estimated to have reduced individual income tax receipts by about
$12 billion in the April–June period, the stimulus tax rebates in 2008 lowered individual taxes by about $50 billion during the same period last year. In addition, the 2008 and 2009 stimulus packages reduced corporate income taxes by similar amounts in both years, largely through the temporary bonus depreciation provision. Thus, tax cuts associated with fiscal stimulus actions have not contributed to the year-over-year decline in total tax receipts.
In addition, the stimulus package has boosted federal aid to state and local governments. As measured in the NIPA, real federal expenditures increased at an annual rate of 11 percent in the second quarter, largely reflecting a sharp rebound in defense purchases from a relatively low level in the first quarter.
Receipts in the April–June period dropped 24 percent relative to a year earlier as economic activity declined.18 Individual income and payroll taxes fell 20 percent, mostly reflecting the decrease in wages and salaries and the likely lower capital gains realizations. Corporate income taxes were substantially lower than a year earlier, as corporate profits have fallen.
Source: U.S. Dept. of Commerce, Bureau of Economic Analysis; national income and product accounts.
Spending4-quarter moving average
Real Spending on Consumption and Investment
-10
0
10
20
30
40
50
-10
0
10
20
30
40
50
Thousands of jobs, monthly average
1999 2001 2003 2005 2007 2009
Q2
Source: U.S. Dept. of Labor, Bureau of Labor Statistics,Employment Situation.
Net Change in Employment
190
200
210
220
230
240
250
190
200
210
220
230
240
250
Billions of chained (2005) dollars, annual rate
Q2
Note: Nominal CPIP deflated by BEA prices. Source: Census Bureau, Construction Spending.
1999 2001 2003 2005 2007 2009
Real Construction
-25
-20
-15
-10
-5
0
5
10
15
20
25
30
-25
-20
-15
-10
-5
0
5
10
15
20
25
30
Percent change from year earlier
1999 2001 2003 2005 2007 2009
Totalrevenues
Individual and corporate income taxes
Q1
Source: Census Bureau,Quarterly Summary of Stateand Local Government Tax Revenue.
State Revenues
-10
-5
0
5
10
15
20
25
-10
-5
0
5
10
15
20
25
Percent change from year earlier
1999 2001 2003 2005 2007 2009
Property taxes
Total revenues
Q1
Source: Census Bureau,Quarterly Summary of Stateand Local Government Tax Revenue.
Local Revenues
II-31
19 Although less than $1 billion in infrastructure funds had been distributed by the end of the second
quarter, states may have used their own funds to finance projects in anticipation of stimulus funds expected later in the year.
20 As noted in the appendix, the definition of the price index for PCE excluding food and energy has changed to include restaurant meals. Because the BEA released its monthly detail on PCE prices just before Greenbook publication, the coverage here is briefer than usual.
State and Local Government Sector
Real purchases by state and local governments rose at a relatively robust pace in the second quarter. Following sharp drop-offs in the previous two quarters, real investment spending rebounded in the second quarter, increasing at an estimated annual rate of about 18 percent. This substantial boost in spending is likely attributable to a number of factors, including anticipatory spending of stimulus funds, easing of credit conditions in the municipal bond market, and significant reductions in construction costs.19 However, these data are very volatile, and some of this strength may be reversed in coming months. Hiring by state and local governments continues to be lackluster. Employment gains in the second quarter averaged 4,000 per month, significantly below the average of roughly 16,000 per month in the previous five years.
According to the Census Bureau, state tax revenues continued to plummet in the first quarter, falling about 12 percent relative to a year earlier. The declines were widespread, with 45 out of 50 states experiencing a drop in revenue. The falloff in state revenues—which was sharper than states expected—has left many states scrambling to close budget shortfalls for the current fiscal year. For example, the California legislature recently approved a package to help close the estimated $26 billion budget shortfall that had opened up for the current fiscal year after having already implemented substantial budget cuts and tax increases in February.
Prices
Overall PCE prices moved up 0.5 percent in June following little change in each of the previous three months. The June pickup reflected a sizable jump in gasoline prices, stemming from the earlier increases in crude oil prices. Over the 12 months ending in June, headline consumer prices declined about ½ percent, compared with a rise of about 4 percent over the year-earlier period. Excluding food and energy, PCE prices increased 0.2 percent in June; over the past 12 months, these prices have risen 1½ percent.20
Although energy prices jumped in June, the latest available survey data show that gasoline prices essentially flattened out in July. With crude oil prices up from their
II-32
Price Measures(Percent change)
12-month change 3-month change 1-month change
Annual rate Monthly rate
June June Mar. June May JuneMeasures 2008 2009 2009 2009 2009 2009
1. Higher-frequency figures are not applicable for data that are not seasonally adjusted (n.s.a.). 2. All PCE prices for food and beverages at home are staff estimates. ... Not applicable. Source: For consumer price index (CPI) and producer price index (PPI), U.S. Dept. of Labor, Bureau of Labor Statistics; for personal consumption expenditures (PCE), U.S. Dept. of Commerce, Bureau of Economic Analysis.
II-33
Consumer Prices(12-month change except as noted)
2000 2002 2004 2006 2008-1
0
1
2
3
4
5
-1
0
1
2
3
4
5 Percent
2001 2003 2005 2007 2009
June
Total PCE
Core PCE
Source: U.S. Dept. of Commerce, Bureau of EconomicAnalysis.
PCE Prices
2000 2002 2004 2006 20080
1
2
3
4
0
1
2
3
4 Percent
2001 2003 2005 2007 2009
June
June
chainedCPI
PCE
CPI
Source: For CPI, U.S. Dept. of Labor, Bureau of LaborStatistics; for PCE, U.S. Dept. of Commerce, Bureau ofEconomic Analysis.
CPI and PCE ex. Food and Energy
2000 2002 2004 2006 20080
1
2
3
0
1
2
3 Percent
2001 2003 2005 2007 2009
JuneJune
Market-based components
Source: U.S. Dept. of Commerce, Bureau of EconomicAnalysis.
PCE excluding Food and Energy
2000 2002 2004 2006 2008-2
-1
0
1
2
3
4
5
-2
-1
0
1
2
3
4
5 Percent
2001 2003 2005 2007 2009
June
3-month change, annual rate
Source: U.S. Dept. of Commerce, Bureau of EconomicAnalysis.
PCE excluding Food and Energy
2000 2002 2004 2006 2008-3
-2
-1
0
1
2
3
4
-3
-2
-1
0
1
2
3
4 Percent
2001 2003 2005 2007 2009
June
Source: U.S. Dept. of Labor, Bureau of Labor Statistics.
Services ex. energy
Goods ex. food and energy
CPI Goods and Services
2000 2002 2004 2006 2008-1
0
1
2
3
4
5
-1
0
1
2
3
4
5 Percent
2001 2003 2005 2007 2009
June
Source: U.S. Dept. of Labor, Bureau of Labor Statistics.
3-month change, annual rate
CPI excluding Food and Energy
II-34
Energy and Food Price Indicators(Data from U.S. Department of Energy, Energy Information Administration, except as noted)
2005 2006 2007 2008 200960
80
100
120
140
160
180
60
80
100
120
140
160
180Cents per gallon
Retail price less average spot crude price*
* Regular grade seasonally adjusted by FRB staff,less average spot crude price: 60% West Texas intermediate,40% Maya heavy crude. Includes gasoline taxes.
Aug. 3
Total Gasoline Margin
2005 2006 2007 2008 200950
100
150
200
250
300
350
400
450
50
100
150
200
250
300
350
400
450Cents per gallon
* Regular grade seasonally adjusted by FRB staff. ** 60% West Texas intermediate, 40% Maya heavy crude.
Retail price*Rack price
Average spot crude price**
Aug. 3
Gasoline Price Decomposition
2006 2007 2008 2009180
190
200
210
220
230
240
250
180
190
200
210
220
230
240
250Millions of barrels
Note: Bounds are defined as the monthly mean over thepreceding five years, plus or minus the standard deviationfor each month. Monthly data through May 2009,weekly data thereafter. * The RBOB component of total motor gasoline inventoriesis adjusted for ethanol use after 2006, boosting reportedstocks; estimated by FRB staff.
July 31
Adjusted for ethanol use*
Gasoline Inventories
2005 2006 2007 2008 20090
2
4
6
8
10
12
14
16
0
2
4
6
8
10
12
14
16Dollars per million BTU
Note: National average spot price. Source: Bloomberg.
Source: U.S. Dept. of Commerce, Bureau of Economic Analysis. *All values are staff estimates.
PCE: Food at Home and Core Prices
II-35
21 The definition of the PCE price index for food and beverages has been changed to exclude restaurant
meals, which are now considered services in the national accounts.
average in June and July, retail gasoline prices are likely to rise somewhat over the next couple of months. Spot prices for natural gas have leveled out in recent months after plunging to very low levels this spring, and retail prices for natural gas increased slightly in June following large declines in the first five months of this year. Consumer prices for electricity continued to fall in June, as earlier declines in fossil fuel input costs have continued to pass through to electricity rates.
We estimate that PCE food prices flattened out in June after having fallen for five consecutive months, a pattern suggesting that the pass-through from the dramatic downturn in spot prices of farm products in the second half of last year may now be complete.21 Spot prices for a wide variety of farm products moved up noticeably in the earlier part of this year, but many have retreated, on balance, over the past two months. Futures prices, however, continue to point to increases in farm prices over the rest of the year.
Excluding food and energy, PCE prices rose at an annual rate of about 1¾ percent in the first half of this year. This pace reflects the net effect of a number of factors. Low readings on nonmarket price inflation apparently pushed down core PCE price inflation significantly around the turn of the year. But the tax-related hike in tobacco prices this spring boosted core inflation noticeably. In recent months, nonmarket prices have no longer been pushing down core inflation, and tobacco prices have changed little. Both the overall index of core PCE prices and its market-based component rose 0.1 percent in May and 0.2 percent in June.
Nearly all of the broad measures of inflation have slowed over the past four quarters. Headline PCE prices in the second quarter were slightly lower than a year earlier, compared with a rise of 3¾ percent in the four quarters ending in the second quarter of last year, and core PCE inflation stepped down from 2½ percent to 1½ percent. The price index for gross domestic purchases has decelerated considerably—by an amount similar to that for overall PCE prices—whereas changes in GDP prices, which exclude the price of imported oil, have slowed by less over the past year.
Median year-ahead inflation expectations in the Reuters/Michigan survey, which stood at 2.9 percent in the final July survey, have been holding relatively steady in recent months after bouncing back from about 2 percent around the turn of the year. Longer-term expectations stood at 3.0 percent in July, about the same as the average over 2008.
II-36
Broad Measures of Inflation(Percent change, Q2 to Q2)
Measure 2006 2007 2008 2009
Product pricesGDP price index 3.6 3.0 1.9 1.5 Less food and energy 3.6 2.7 2.4 .9
Nonfarm business chain price index 3.5 2.4 1.1 1.7
Expenditure pricesGross domestic purchases price index 3.9 2.8 3.5 -.1 Less food and energy 3.4 2.6 2.8 .9
PCE price index 3.2 2.4 3.8 -.2 Less food and energy 2.3 2.2 2.5 1.6
PCE price index, market-based components 3.3 2.3 3.7 .0 Less food and energy 2.2 2.0 2.3 2.1
CPI 3.9 2.6 4.3 -.9 Less food and energy 2.5 2.3 2.3 1.8
Chained CPI 3.6 2.4 3.8 -1.2 Less food and energy 2.2 1.8 2.0 1.4
Median CPI 2.8 3.1 3.0 2.4 Trimmed mean CPI 2.6 2.7 3.0 1.9
Source: For CPI, U.S. Dept. of Labor, Bureau of Labor Statistics; for all else, U.S. Dept. of Commerce,Bureau of Economic Analysis.
1. Percent change from the same period in the preceding year. 2. Responses to the question, By about what percent do you expect prices to go up, onaverage, during the next 12 months? 3. Responses to the question, By about what percent per year do you expect prices to go up,on average, during the next 5 to 10 years? 4. Median CPI and PCE price projections. ... Not applicable. n.a. Not available. Source: For CPI, U.S. Dept. of Labor, Bureau of Labor Statistics; for Reuters/Michigan Survey,Reuters/University of Michigan Surveys of Consumers; for professional forecasters, the Federal ReserveBank of Philadelphia.
II-37
Measures of Expected Inflation
1975 1980 1985 1990 1995 2000 2005 20100
2
4
6
8
10
12
0
2
4
6
8
10
12Percent
1973 1977 1981 1985 1989 1993 1997 2001 2005 2009
Survey Measures (Reuters/University of Michigan)
Q2
Median, next 12 months
Median, next 5 to 10 years
Quarterly
Source: Reuters/University of Michigan Surveys of Consumers.
2005 2006 2007 2008 20090
1
2
3
4
5
6
0
1
2
3
4
5
6Percent
Monthly
July
1975 1980 1985 1990 1995 2000 2005 20100
2
4
6
8
10
12
0
2
4
6
8
10
12Percent
1973 1977 1981 1985 1989 1993 1997 2001 2005 2009
Inputs to Models of Inflation
Source: For the distributed lag of core PCE inflation, FRB staff calculations; for the FRB/US measure, for 2007 forward, the medianprojection for PCE inflation over the next 10 years from the Survey of Professional Forecasters (SPF); for 1990 to 2006, the equivalentSPF projection for the CPI; for 1981 to 1989, a related survey for the CPI conducted by Richard Hoey; and for the period preceding 1981,a model-based estimate constructed by Board staff. The survey data before 2007 are adjusted down 0.5 percentage point to put the CPIprojections approximately on a PCE basis.
Note: The distributed lag of core PCE inflation is derived from one of the reduced-form Phillips curves used by Board staff.
Note: Based on a comparison of an estimated TIPS (Treasury inflation-protected securities) yield curve with an estimated nominaloff-the-run Treasury yield curve, with an adjustment for the indexation-lag effect. Source: FRB staff calculations.
5 to 10 years ahead
Next 5 years
Quarterly
Q2
2005 2006 2007 2008 2009-2
-1
0
1
2
3
4
-2
-1
0
1
2
3
4Percent
Weekly
Aug. 4
II-38
Commodity Price Indexes
1992 1994 1996 1998 2000 2002 2004 2006 2008 2010
100 100
30
60
100
140
180
Note: The (JOC) industrial price index is based almost entirely on industrial commodities, with a small Journal of Commerce weight given to energy commodities. Copyright for JOC data is held by CIBCR, 1994.
Ratio scale, 2006 = 100
Metals
Industrials
Aug. 4
1991 1993 1995 1997 1999 2001 2003 2005 2007 2009
Journal of Commerce
1992 1994 1996 1998 2000 2002 2004 2006 2008 2010
200
300
400
500
600
200
300
400
500
600
150
250
350
450
550
650Ratio scale, 1967 = 100
Note: The Commodity Research Bureau (CRB) spot industrials index consists entirely of industrial commodities, excludingenergy. The CRB futures index gives about a 60 percent weight to food commodities and splits the remaining weight roughlyequally among energy commodities, industrial commodities, and precious metals.
1. From the last week of the preceding year to the last week of the year indicated. 2. June 16, 2009, is the Tuesday preceding publication of the June Greenbook.
II-39
1990 1995 2000 2005 2010-5
0
5
10
15
20
-5
0
5
10
15
20Percent
1993 1998 2003 2008
June
Change in ECI Benefits (unpublished)* (Private-industry workers; 12-month change)
Source: U.S. Dept. of Labor, Bureau of Labor Statistics.
Health Insurance
1990 1995 2000 2005 2010-15
-10
-5
0
5
10
15
20
-15
-10
-5
0
5
10
15
20Percent
1993 1998 2003 2008
June
Source: U.S. Dept. of Labor, Bureau of Labor Statistics.
Nonproduction Bonuses
1990 1995 2000 2005 2010-10
-5
0
5
10
15
20
25
30
-10
-5
0
5
10
15
20
25
30Percent
1993 1998 2003 2008
June
Source: U.S. Dept. of Labor, Bureau of Labor Statistics.
*The data on the costs of individual benefits should be interpreted with care because, with the exception of health insurance, theydo not meet BLS’s standard publication criteria.
Retirement and Savings
1990 1995 2000 2005 2010-10
-5
0
5
10
15
20
-10
-5
0
5
10
15
20Percent
1993 1998 2003 2008
June
Source: U.S. Dept. of Labor, Bureau of Labor Statistics.
Workers’ Compensation Insurance
Quarterly change (compound annual rate) 1
Change in Employment Cost Index of Hourly Compensationfor Private-Industry Workers
*All values are staff estimates. Source: U.S. Dept. of Labor, Bureau of Labor Statistics.
Productivity and costs*
ECI
Q2
Compensation per Hour (Percent change from year-earlier period)
1996 1998 2000 2002 2004 2006 2008-3
-2
-1
0
1
2
3
4
5
6
-3
-2
-1
0
1
2
3
4
5
6Percent
Note: All values are staff estimates. Source: U.S. Dept. of Labor, Bureau of Labor Statistics.
Q2
Unit Labor Costs (Percent change from year-earlier period)
1996 1998 2000 2002 2004 2006 2008 20100
1
2
3
4
5
0
1
2
3
4
5Percent
1997 1999 2001 2003 2005 2007 2009
June
Source: U.S. Dept. of Labor, Bureau of Labor Statistics.
Average Hourly Earnings (Percent change from year-earlier period)
Hourly Compensation and Unit Labor Costs(Percent change from preceding period at compound annual rate; based on seasonally adjusted data)
2007:Q2 2008:Q2 2008 2009to to
Category 2008:Q2 2009:Q2 Q3 Q4 Q1 Q2
Compensation per hourNonfarm business 2.7 .9 4.4 2.8 -2.6 -.8
Output per hourNonfarm business 2.6 1.6 -.1 .8 .3 5.3
Unit labor costsNonfarm business .1 -.6 4.5 2.0 -2.8 -5.9
Note: All figures are staff estimates. Source: U.S. Dept. of Labor, Bureau of Labor Statistics.
II-41
22 The ECI benefits data are unpublished. 23 The series for P&C hourly compensation in the nonfarm business sector begins in 1949. The actual
data on P&C hourly compensation in the second quarter are scheduled to be released by the BLS on August 11.
At earlier stages of processing, the PPI for core intermediate materials turned up in June following a string of monthly declines that likely reflected pass-through from the large declines in spot commodity prices in the second half of last year. Commodity prices rebounded considerably over the first six months of this year, and they have increased noticeably further since the June Greenbook. In particular, the CRB index of spot industrial prices has risen about 10 percent since the middle of June, and the Journal of Commerce index of industrial materials has increased about 12½ percent. Price increases have been widespread for industrial materials, with particularly large increases for prices of metals.
Labor Costs
All of our measures of hourly compensation and wages suggest that labor costs have decelerated sharply this year in response to the considerable deterioration in labor market conditions. The ECI for private industry workers increased at an annual rate of only ¾ percent in the first half of 2009 after having risen nearly 2½ percent in 2008. The slowdown was broadly similar for both the wages and the benefits components of the index, with the step-down in benefits primarily reflecting a large drop in nonproduction bonuses.22 After incorporating sizable changes to the wages and salary data in the comprehensive revision to the NIPA, we currently estimate that P&C hourly compensation in the nonfarm business sector fell at an annual rate of 1¾ percent in the first half of 2009 after having risen 2½ percent in 2008; if these estimates prove accurate, the decline in the first half of this year would be the largest drop in nominal compensation on record.23
Page II-42 intentionally left blank
Appendix
1 The most important definitional change was the incorporation of a new classification structure for
PCE. In addition, the BEA changed its procedures for treating natural disasters so that the components of national income—which are meant to capture income from current production—are insulated from the direct effects of property damage.
2 The rate of change of real GDP was revised up between 1997 and 2002, reflecting the incorporation of information from the 2002 input-output tables. As a result, the 2001 recession now looks a little milder than it did before.
II-A-1
Comprehensive Revision of the National Income and Product Accounts
The comprehensive revision of the national income and product accounts (NIPA) was released on July 31. The revision reflected the incorporation by the Bureau of Economic Analysis (BEA) of more-comprehensive source data as well as some changes in methodology and definitions.1
The most notable revision is that the four-quarter change in real GDP was revised down by 1 percentage point in 2008, to 1.9 percent, and by nearly another 1 percentage point at an annual rate in 2009:Q1, to negative 6.4 percent. These downward revisions occurred in a variety of expenditure categories, with the largest contributions coming from personal consumption expenditures, net exports, and inventory investment. Revisions to the rates of change in real GDP in the preceding few years were small.2 The recent revisions make the recession look somewhat deeper than before, and they help reduce (but not eliminate) the tension between the published declines in real GDP and the labor market data. The revisions also leave the change in GDP in 2008 closer to that year’s change in gross domestic income (GDI), though the change in GDI was also revised down in earlier years such that, on net, the statistical discrepancy was about unrevised in the first quarter.
The change in real disposable personal income (DPI) was also revised downward over the past two years and especially in the first quarter, as new source data pointed to considerably greater weakness in both employee compensation and household receipts of dividend income. In the 1990s, however, real DPI is now estimated to have been substantially higher, reflecting new estimates of unreported proprietors’ income, rental income, and the cost of so-called cafeteria benefits plans; this higher level of income carried forward. Thus, the personal saving rate was revised up about 1 percentage point, on average, from the mid-1990s through 2007. More recently, however, the downward revision to the change in real DPI was greater than the downward revision to real PCE, and the saving rate is now reported to have increased less over the past year than before; indeed, the saving rate was revised down slightly in 2009:Q1. The level of corporate profits was also revised downward over the past few years, and the profit share of GNP is now about 1 percentage point lower than before.
Given these new data, we now estimate that output per hour in the nonfarm business sector rose 1 percent during 2008, a downward revision of about 1¼ percentage points. In addition, we estimate that the change in compensation per hour in the nonfarm business sector will be revised
II-A-2
Comprehensive Revision to the National Income and Product Accounts(Data from national income and product accounts)
3 The definitional change to core PCE prices was associated with the new classification structure for
PCE in which restaurant meals were moved out of nondurable goods and into a new “food services” category; as noted, these food services are now included in core PCE. (For more discussion of the definitional changes to core and market-based PCE, see Deborah Lindner and David Lebow (2009), “Core PCE Price Inflation in the Upcoming Comprehensive Revision,” memorandum to the Federal Open Market Committee, Board of Governors of the Federal Reserve System, Division of Research and Statistics, July 15.)
down sharply to an increase of only 2½ percent in 2008 and to a decline of 2½ percent at an annual rate in 2009:Q1. With these revisions, compensation per hour now shows a clear and substantial deceleration over the past year, and we estimate that unit labor costs will be reported to have declined over the past year.
The BEA’s changes to its price indexes were generally small. PCE inflation was revised down in 2008 and again in the first quarter of 2009, primarily reflecting new estimates for the change in the nonmarket component of prices. Core PCE prices were affected by a change in definition, as restaurant meals are now included in core prices; core PCE price inflation generally revised slightly higher with this new definition. However, despite the definitional change, core PCE inflation is now estimated to have been lower in the first quarter because of new lower estimates of the change in nonmarket prices. The market-based component of core PCE prices underwent a more substantial change in definition (involving the treatment of hospitals and other nonprofit institutions), and the change in these prices was revised up about ¼ percentage point per year, on average, over history. Note that these definitional changes to core PCE and market-based PCE did not affect overall PCE prices.3
Last page of Domestic Nonfinancial Developments
Domestic FinancialDevelopments
III-T-1Selected Financial Market Quotations(One-day quotes in percent except as noted)
Change to Aug. 4 from2007 2009 selected dates (percentage points)
Instrument 2007 2009 2009 Aug. 6 Apr. 28 June 22 Aug. 4 Aug. 6 Apr. 28 June 22
1. Secondary market. 2. Financial commercial paper. 3. Bid rates for Eurodollar deposits collected around 9:30 a.m. eastern time. 4. Derived from a smoothed Treasury yield curve estimated using off-the-run securities. 5. Derived from a smoothed Treasury yield curve estimated using all outstanding securities and adjusted for the carry effect. 6. Most recent Thursday quote. 7. Constant-maturity yields estimated from Fannie Mae domestic noncallable coupon securities. 8. Derived from smoothed corporate yield curves estimated using Merrill Lynch bond data. _______________________________________________________________________
NOTES: August 6, 2007, is the day before the August 2007 FOMC meeting. April 28, 2009, is the day before the April 2009 FOMC monetary policy announcement. June 22, 2009, is the day before the most recent FOMC monetary policy announcement. ________________________________________________________________________
III-C-1Policy Expectations and Treasury Yields
2.2
2.4
2.6
2.8
3.0
3.2
3.4
3.6
3.8
4.0
June 23 June 26 July 1 July 6 July 9 July 14 July 17 July 22 July 27 July 30 Aug. 40.8
1.0
1.2
1.4
1.6
1.8
2.0
2.2
2.4Percent Percent
FOMCstatement
Employmentreport
Retail salesPPI CPI
Chairman’stestimony
Existinghome sales
ISMmanufacturing data
Mar. 2010 Eurodollar(right scale)
10-year Treasury yield(left scale)
Interest Rates
Note: 5-minute intervals. 8:00 a.m. to 4:00 p.m. No adjustments for term premiums. Source: Bloomberg.
0.0
0.5
1.0
1.5
2.0
2.5
3.0
3.5Percent
August 4, 2009
June 23, 2009
May Sept. Jan. May Sept. Jan. May2009 2010 2011
Implied Federal Funds Rate
Note: Estimated from federal funds and Eurodollar futures, with an allowance for term premiums and other adjustments. Source: Chicago Mercantile Exchange; Chicago Board ofTrade.
1 3 5 7 10 200.0
0.5
1.0
1.5
2.0
2.5
3.0
3.5
4.0
4.5
5.0Percent
Treasury Yield Curve
Years ahead Note: Smoothed yield curve estimated from off-the-run Treasurycoupon securities. Yields shown are those on notional par Treasurysecurities with semiannual coupons. Source: Federal Reserve Bank of New York.
Jan. May Sept. Jan. May Sept. Jan. May2007 2008 2009
-2
-1
0
1
2
3
4
5Percent
Jan. May Sept. Jan. May Sept. Jan. May2007 2008 2009
5 to 10 years ahead
Next 5 years*
Inflation Compensation
Daily
Note: Estimates based on smoothed nominal and inflation-indexedTreasury yields. *Adjusted for lagged indexation of Treasury inflation-protectedsecurities. Source: Federal Reserve Bank of New York.
JuneFOMC
Aug. 4
Domestic Financial Developments
III-1
Overview Conditions in financial markets showed signs of continued improvement over the intermeeting period, as risk premiums generally narrowed and the functioning of short-term funding markets improved a bit. Broad stock price indexes rose about 13 percent, reflecting strong second-quarter earnings reports and indications that the economy is stabilizing. Bank equity prices rose in line with the broader indexes. Both the expected path of the funds rate as well as nominal Treasury yields were little changed over the period, while near-term inflation compensation fell slightly. Spreads on BBB-rated and speculative-grade corporate bonds narrowed further and are now a bit below their peak levels following the 2001 recession. The spread over Treasury yields of the rates on conforming fixed-rate mortgages and adjustable-rate mortgages declined, but the latter remained elevated.
Bond and equity issuance by nonfinancial corporations slowed in July, and outstanding bank loans to households and nonfinancial businesses continued to decline. The available indicators suggest that household credit quality deteriorated further in recent months, while indicators of business credit quality were mixed. The July Senior Loan Officer Opinion Survey on Bank Lending Practices indicated that demand weakened and banks continued to tighten standards and terms on all major loan categories, although the net percentages of banks doing so declined further.
Treasury Yields and Policy Expectations The expected path of the funds rate derived from futures quotes was little changed, on net, over the intermeeting period. Investors initially marked up their policy expectations following the release of the June FOMC statement as they apparently interpreted the statement as suggesting a more favorable assessment of growth prospects than had been anticipated. However, investors marked down the expected policy path after the June employment report and the Chairman’s semiannual monetary policy testimony. Market participants reportedly took note of the comments indicating that monetary policy would be highly accommodative for an extended period and seemed more confident that the FOMC had the tools necessary to withdraw policy accommodation in a smooth and timely manner when needed. With our standard term premium assumptions, futures quotes indicate that market participants continue to expect the onset of policy tightening in the first quarter of 2010. However, none of the respondents to the August primary dealer survey expect a rate increase before the second quarter of 2010.
III-2
July Nov. Mar. July Nov. Mar. July2007 2008 2009
20
40
60
80
100
120July 2, 2007 = 100
Daily
S&P Bank Equity Index
Source: Bloomberg.
Aug. 4
JuneFOMC
July Nov. Mar. July Nov. Mar. July2007 2008 2009
0
50
100
150
200
250
300
350
400
Basis points
Daily
CDS Spreads for Selected Bank Holding Companies
Note: Median spreads for 6 bank holding companies:Bank of America, Citigroup, Goldman Sachs, JPMorgan Chase,Morgan Stanley, and Wells Fargo. Source: Markit.
JuneFOMC
Aug. 4
1
2
3
4
5
6
Jan. Feb. Mar. Apr. May June July2009
1000
2000
3000
4000
5000
6000
7000
8000Index: Jan. 2, 2009=100 Basis points
Stock price (left scale)5-year CDS (right scale)
Daily
CIT Stock Price and CDS Spread
Source: Bloomberg; Markit.
Aug. 4
JuneFOMC
July Nov. Mar. July Nov. Mar. July2007 2008 2009
0
50
100
150
200
250
300
350
400Basis points
1-month3-month6-month
JuneFOMC
Libor over OIS Spread
Daily
Source: British Bankers’ Association and Prebon.
Aug. 5
July Nov. Mar. July Nov. Mar. July2007 2008 2009
0
100
200
300
400
500
600
700
800Basis points
ABCPA2/P2
Aug. 4
JuneFOMC
Daily
Spreads on 30-day Commercial Paper
Note: The ABCP spread is the AA ABCP rate minus the AAnonfinancial rate. The A2/P2 spread is the A2/P2 nonfinancialrate minus the AA nonfinancial rate. Source: Depository Trust & Clearing Corporation.
Aug. Dec. Apr. Aug. Dec. Apr. Aug.2007 2008 2009
0
50
100
150
200
250
300
350
400
450
500
$ Billions
Primary creditTAFPDCFAMLFCPFF
JuneFOMC
Federal Reserve Credit Outstanding
Source: Federal Reserve.
Daily
Aug. 4
Financial Institutions, Short-Term Funding Markets, and Liquidity Facilities
III-3
Yields on nominal Treasury securities were little changed, on net, over the intermeeting period, despite sizeable intraday movements in response to macroeconomic data releases and Federal Reserve communications. The June employment report sent yields lower, while the stronger-than-expected reports on housing starts and manufacturing activity precipitated rate increases. Option-implied volatility on 10-year Treasury yields remained high, although it declined somewhat on balance.
Five-year TIPS-based inflation compensation declined about 15 basis points, on net, over the intermeeting period, while five-year inflation compensation five years ahead increased about 25 basis points. Changes in survey-based measures of inflation expectations were mixed.
Financial Institutions Investor sentiment toward the financial sector improved further over the intermeeting period, boosted, in part, by second-quarter earnings results that were generally better than expected at larger banking institutions. Bank equity prices rose about 17 percent over the period, and CDS spreads on financial firms declined. Nonetheless, some investors commented that the positive upside surprises at large financial institutions were mostly related to investment banking and trading activities, which are less prominent sources of revenue at smaller or regional institutions, and mortgage refinancing activity, which may recede if longer-term rates rise. Market participants also focused on the large consumer loan losses reported by many banks.
The financial condition of CIT Group, Inc., one of the largest lenders to middle-market firms, worsened sharply over the period. After failing to receive government support, CIT obtained $3 billion in private financing on July 20 from some of its largest existing bondholders. While reports suggest that CIT has averted a near-term funding crisis, prices of CDS contracts on CIT indicate that the risk of bankruptcy continues to be very high. Broader conditions in financial markets have to date remained largely unaffected by these developments.
Short-Term Funding Markets Functioning in short-term funding markets generally showed further improvement over the intermeeting period. Consistent with a reduction in concerns about the financial condition of large banking institutions, Libor rates continued to edge down. Three- and six-month Libor-OIS spreads—while still somewhat elevated by historical standards—declined a bit further and stand at levels last recorded in early 2008. The changes to
III-4
1 The Federal Reserve announced the extension of the AMLF, CPFF, PDCF, TSLF, and the temporary
reciprocal currency arrangements (swap lines) through February 1, 2010. Auctions under the TSLF Schedule 1 and TSLF Options Program were suspended. The frequency of Schedule 2 TSLF auctions was reduced to one every four weeks and the offered amount was reduced. The authorization for the MMIFF was not extended, and an additional administrative criterion was established for use of the AMLF. In view of the decreasing need for TAF funding, the amounts auctioned at the biweekly auctions of TAF funds was reduced from $150 billion to $125 billion for auctions after July 13. On July 24, these amounts were further reduced to $100 billion.
Regulation D that became effective on July 2 appeared to have only a small effect on trading in the overnight federal funds market.
Bid-asked spreads for most types of repurchase agreements ticked down. Since the June Greenbook, spreads on A2/P2-rated commercial paper and AA-rated ABCP were little changed, on net, remaining at the low end of their ranges over the past two years. Outstanding commercial paper in the CPFF declined from roughly $110 billion to $60 billion in July, as only 40 percent of the volume of maturing paper coming due was rolled back into the facility.
Federal Reserve Purchase Programs and Facilities Over the intermeeting period, total Federal Reserve assets remained around $2 trillion, as an increase in securities held roughly offset declines in funds supplied under credit and liquidity facilities. Around $59 billion in Treasury securities was purchased, including $1.5 billion in TIPS, bringing the total amount of purchases to about $227 billion. Further, the Federal Reserve purchased about $12 billion in agency debt and about $124 billion in agency MBS. Market commentary and the results of the August primary dealer survey suggest that investors expect no modifications to Federal Reserve purchase programs at the upcoming FOMC meeting.
On June 25, the Federal Reserve announced extensions of and modifications to a number of its liquidity programs.1 Reaction in financial markets to the announcement was muted, and participation in these facilities generally continued to decline over the intermeeting period. TALF loans backed by asset-backed securities totaled $5.4 billion in July, and loans backed by legacy commercial mortgage-backed securities equaled $636 million. No requests for loans to finance new-issue CMBS were submitted.
III-5
Stock Prices and Corporate Interest Rates Broad stock price indexes rose about 13 percent, on net, over the intermeeting period, as investors responded to strong second-quarter earnings reports and indications that the economy may be stabilizing. The spread between the staff’s estimate of the expected real equity return over the next 10 years for S&P 500 firms and an estimate of the real 10-year Treasury yield—a gauge of the equity risk premium—narrowed a bit but remained high by recent historical standards. Option-implied volatility on the S&P 500 index also declined a bit further.
Over the intermeeting period, yields on BBB-rated and speculative-grade corporate bonds declined about 80 and 140 basis points, respectively. As a result, corporate bond spreads narrowed further and are now below the peak levels reached in 2002 following the previous recession. Excluding effects related to CIT, staff estimates of bid-asked spreads for both investment-grade and speculative-grade corporate bonds were little changed. Conditions in the leveraged loan market continued to improve as secondary-market prices rose further and bid-asked spreads narrowed.
Corporate Earnings and Credit Quality With most reports in hand and analyst estimates for the rest, operating earnings per share for S&P 500 firms in the second quarter are estimated to have come in about 25 percent below year-earlier levels, less negative than first-quarter growth. The four-quarter rate of decline for nonfinancial firms in the index also appears to have turned up. In addition, the data suggest that, on a nonseasonally adjusted quarter-over-quarter basis, operating earnings rose substantially in the second quarter, for both nonfinancial as well as financial constituents. Moreover, both the financial and nonfinancial reports were substantially stronger than market participants had expected, with about three-fourths of the reports exceeding analysts’ expectations—a high share by historical standards. The magnitude of the positive surprises was also large. In contrast, reported revenues were close to analyst estimates on average, an indication that the earnings news primarily reflects larger-than-anticipated cost reductions. Companies’ guidance about future earnings has been neutral overall, and an index of revisions to analysts’ forecasts of year-ahead earnings for S&P 500 firms turned slightly positive over the past two months after having been deeply negative for more than a year.
Indicators of the credit quality of nonfinancial firms were mixed. The aggregate ratio of debt to assets for nonfinancial corporations rose in the first quarter, as did the aggregate liquid asset ratio. Moody’s ratings downgrades of corporate bonds of nonfinancial
III-6
Corporate Yields, Risk Spreads, and Stock Prices
50
75
100
125
150
175200225
June 23, 2009 = 100
June Aug. Oct. Dec. Feb. Apr. June Aug.2008 2009
Selected Stock Price Indexes
Daily
S&P 500
S&P FinancialJune
FOMC
Source: Standard & Poor’s.
Aug4
-2
0
2
4
6
8
10
12
14Percent
1991 1994 1997 2000 2003 2006 2009
Expected Real Equity Return andLong-Run Treasury Yield
Monthly
Expected 10-year real equity return
Expected real yield on 10-year Treasury*
+
+
Aug. 4
* Off-the-run 10-year Treasury yield less Philadelphia Fed 10-yearexpected inflation. + Denotes the latest observation using daily interest rates andstock prices and latest earnings data from I/B/E/S. Source: Thomson Financial.
5
15
25
35
45
55
65
75
85
95
Percent
2003 2005 2007 2009
Implied Volatility on S&P 500 (VIX)
Weekly Friday*June
FOMC
Aug. 4
* Latest observation is for most recent business day. Source: Chicago Board of Exchange.
3
5
7
9
11
13
15
17
19
21
23
Percent
2003 2005 2007 2009
Corporate Bond Yields
Daily
10-year high-yield
10-year BBB
June FOMC
Aug. 4
Note: Yields from smoothed yield curves based on Merrill Lynchbond data.
0
300
600
900
1200
1500
1800
2100Basis points
2003 2005 2007 2009
Corporate Bond Spreads
Daily
10-year high-yield
10-year BBB
June FOMC
Aug. 4
Note: Corporate yields from smoothed yield curves based onMerrill Lynch bond data and spreads measured relative tocomparable-maturity Treasury securities.
0
50
100
150
200
250
300
350
400
450
500Basis points
2005 2006 2007 2008 2009
Estimated Median Bid-Asked Spreadfor Corporate Bonds
Daily
Investment-grade
High-yield
June FOMC
Aug. 4
Source: Staff estimate using data from the National Assn. ofSecurities Dealers’ Trade Reporting and Compliance Engine.
III-7
Corporate Earnings and Credit Quality
-70-60-50-40-30-20-10 0 10 20 30 40 50
Percent
All firmsNonfinancial firms
1999 2001 2003 2005 2007 2009
S&P 500 Earnings Per Share
Change from 4 quarters earlier
Q2
Q2
Source: Thomson Financial.
e
e
-20
-16
-12
-8
-4
0
4Percent
All firmsNonfinancial firms
2003 2005 2007 2009
Revisions to Expected S&P 500 Earnings
Monthly
Mid- July
Note: Index is a weighted average of the percent change in theconsensus forecasts of current-year and following-year earnings pershare for a fixed sample. Source: Thomson Financial.
0.24
0.27
0.30
0.33
0.36
0.04
0.06
0.08
0.10
0.12
0.14
0.16Ratio Ratio
1989 1993 1997 2001 2005 2009
Financial Ratios for Nonfinancial Corporations
Debt overtotal assets(left scale)
Liquid assets overtotal assets(right scale)
Q1
Q1
Note: Data are annual through 1999 and quarterly starting in2000:Q1. Source: Calculated using Compustat data.
Percent of outstandings
60
40
20
0
20
40
1991 1994 1997 2000 2003 2006 2009
Upgrades
Downgrades
Annual rate
Bond Ratings Changes of Nonfinancial Companies
Source: Calculated using data from Moody’s Investors Service.
H1H2
Q1Q2
0
1
2
3
4
5
6
7
8
9
10Percent of liabilities
1994 1997 2000 2003 2006 2009
Expected Nonfinancial Year-Ahead Defaults
Monthly
July
Note: Firm-level estimates of default weighted by firm liabilities asa percent of total liabilities, excluding defaulted firms. Source: Calculated using Moody’s KMV.
0
1
2
3
4
5
6
7
8Percent of outstandings
1991 1994 1997 2000 2003 2006 2009
Selected Default and Delinquency Rates
C&I loan delinquency rate
Bond default rate*
June
Q1
* 6-month trailing defaults divided by beginning-of-periodoutstandings, at an annual rate. Source: For default rate, Moody’s Investors Service; fordelinquency rate, Call Report.
III-8
Business FinanceGross Issuance of Securities by U.S. Corporations
(Billions of dollars; monthly rates, not seasonally adjusted)
2008 2009
Type of security 2005 2006 2007 H1 H2 Q1 Q2 July p
Note: Components may not sum to totals because of rounding. 1. Excludes private placements and equity-for-equity swaps that occur in restructurings. 2. Data include regular and 144a private placements. Bond totals reflect gross proceeds rather than par value of original discount bonds. Bonds are categorized according to Moody’s bond ratings or to Standard & Poor’s if unrated by Moody’s. 3. End-of-period basis, seasonally adjusted. p Forecast based on preliminary data. Source: Depository Trust & Clearing Corporation; Thomson Financial; Federal Reserve Board.
-80
-60
-40
-20
0
20
40
60
80Billions of dollars
2005 2006 2007 2008 2009
Commercial paper* C&I loans* Bonds
Total
H1
H2
Q1
Q2
July p
Monthly rate, nonfinancial firms
Selected Components of Net Debt Financing
* Seasonally adjusted, period-end basis. p Preliminary. Source: Depository Trust & Clearing Corporation; ThomsonFinancial; Federal Reserve Board.
-100
-80
-60
-40
-20
0
20
40
60
80Billions of dollars
2005 2006 2007 2008 2009
Public issuance Private issuance Repurchases Cash mergers
Total H1 H2Q1
e
Monthly rate, nonfinancial firms
Components of Net Equity Issuance
e Staff estimate. Source: Thomson Financial, Investment Benchmark Report;Money Tree Report by PricewaterhouseCoopers, NationalVenture Capital Association, and Venture Economics.
III-9
companies continued to substantially outpace upgrades in the second quarter, but the pace of deterioration moderated some from that observed in the first quarter. The expected default frequency for nonfinancial firms from Moody’s KMV dropped in July to about one-half of its peak level earlier in the year, as stock price gains translated into higher estimated asset values and lower leverage. The six-month trailing bond default rate ticked up in June with the default of General Motors.
Business Finance Gross speculative-grade and investment-grade bond issuance by nonfinancial corporations slowed in July from its outsized second-quarter pace. Issuance of institutional loans in the syndicated leveraged loan market reportedly continued to be extremely weak. Meanwhile, bank loans and commercial paper continued to run off, leaving net debt financing by nonfinancial corporations at around zero.
The pace of gross public equity issuance by nonfinancial firms, both from seasoned and initial-public offerings, slowed in July following a very robust second quarter. Equity retirements from cash-financed mergers and estimated share repurchases were modest in the first quarter and outpaced by issuance. As a result, net equity issuance in the first quarter was positive for the first time since 2002. In the second quarter, announcements of mergers and acquisitions and new share repurchase programs remained weak. Equity issuance by financial firms slowed to a trickle in July after ballooning in the second quarter, when banks raised most of the equity capital required by the SCAP and many other financial institutions sold additional shares. Financial bond issuance was solid, with only about 20 percent issued under the FDIC’s Temporary Liquidity Guarantee Program.
Commercial Real Estate Commercial real estate markets have remained under considerable strain. Outstanding commercial mortgage debt was roughly flat in the first quarter, the weakest performance since 1995, and bank balance sheet data point to a further contraction in the second quarter. Sales of commercial properties continued to drop in the second quarter, with the monthly average now at levels last seen at the beginning of this decade. Moreover, nearly 40 percent of properties were sold at a nominal loss. Commercial real estate prices dropped again in May and June, leaving the price indexes about one-third lower than their peak levels in 2007. The delinquency rate on securitized commercial mortgages shot up further in June from its already elevated level in May, in part owing to the bankruptcy of General Growth Properties.
III-10
2000 2002 2004 2006 2008
-3
0
3
6
9
12
15
18
21
24Percent change, annual rate
Q1
Commercial Mortgage Debt
Quarterly
Source: Federal Reserve.
0
20
40
60
80
100
120
140
2001 2003 2005 2007 2009 0
10
20
30
40
50
Billions of dollars Percent
Dollar value of all sales (left scale)% of properties sold at nominal loss (right scale)
July
July
Commercial Real Estate Sales
Note: Three-month moving averages shown. Source: Real Capital Analytics.
1994 1997 2000 2003 2006 2009 25
50
75
100
125
150
175
200
225Index, 2001:Q1=100
NCREIF TBI (quarterly)Moody’s index (monthly)
Q2
May
Prices of Commercial Real Estate
Source: NCREIF; MIT Center for Real Estate; Moody’s.1997 1999 2001 2003 2005 2007 2009
0
1
2
3
4
Percent
Q1
Q1
June
At lifeinsurancecompanies
CMBS
At commercial banks*
Delinquency Rates on Commercial Mortgageson Existing Properties
Note: Data series begin in 2007:Q1. Source: Call Reports.
Apr. Aug. Dec. Apr. Aug. Dec. Apr.2007 2008 2009
0 10 20 30 40 50 60 70 80 90100110120
CMBX Percent
Junior AAA
BBB-
Senior AAA
July 30
June FOMC
Daily, by rating
Commercial Mortgage CDS Index Prices
Note: Each index corresponds to pools of mortgages securitizedin 2006:H1. Source: JPMorgan Chase & Co.
Commercial Real Estate
III-11
Commercial mortgage CDS spreads narrowed over the intermeeting period, primarily in response to two policy actions and announcements. The first CMBS subscription in TALF, though small in size, apparently reduced the uncertainty regarding the criteria the Federal Reserve would apply to reject legacy CMBS. In addition, the announcement that the Public-Private Investment Program would finance investment in AAA-rated CMBS bonds that had been downgraded and thus were ineligible for legacy TALF financing reportedly helped mitigate much of the negative effects of recent downgrades by rating agencies.
Household Finance The rate on 30-year conforming fixed-rate mortgages dropped back below 5½ percent over the intermeeting period, with its spread to the 10-year Treasury yield narrowing slightly. The spread of the yield on the 5/1 hybrid adjustable-rate mortgage (ARM) over the 2-year Treasury yield declined but remained elevated. Issuance of MBS by the housing-related GSEs was about the same in May as in April. MBS issuance by Ginnie Mae grew slightly in May, while the private-label MBS market remained shuttered.
Home prices showed some signs of stabilization in April and May. The Federal Housing Finance Agency index and the LoanPerformance national index dropped 6 percent and 9 percent, respectively, over the year ending in May, while the S&P/Case-Shiller 20-city index posted a decline of 17 percent over the same period. Monthly readings on the LoanPerformance index actually increased in March, April, and May, though the monthly data are particularly noisy and subject to large revisions. Delinquency rates of both prime and subprime mortgages continued to rise.
Issuance of consumer ABS has reached its pre-crisis levels, mainly driven by TALF-financed issues. Spreads on AAA-rated ABS were about unchanged over the intermeeting period and remained well below their peaks at the end of 2008. Interest rates on new auto loans were about flat in the second quarter at levels well below those seen earlier this year, and interest rates on credit cards were little changed in May. Delinquency rates on auto loans at captive finance companies rose a little in April and May; delinquency rates on credit card loans were little changed over the same period and remain near their highest levels in more than a decade.
Possibly reflecting an improvement in risk appetites—and perhaps stimulated by recent outsized returns—long-term mutual funds, particularly bond funds, attracted considerable
III-12
Oct. Apr. Oct. Apr Oct. Apr. Oct.3.5
4.0
4.5
5.0
5.5
6.0
6.5
7.0
7.5
8.0Percent
June FOMC
30-year conforming fixed-rate mortgage rate
MBS yield
July 29
Aug. 4
2006 2007 2008 2009
Mortgage Rate and MBS Yield
Weekly
Note: For MBS yield, Fannie Mae 30-year current coupon rate. Source: For mortgage rate, Freddie Mac; for MBS yield, Bloomberg.
Oct. Apr. Oct. Apr Oct. Apr. Oct. 50
100
150
200
250
300
350
400
450
500
550
600Basis points
30-yr FRM to 10-yr Treasury5/1 ARM to 2-yr Treasury
June FOMC
July 29
July 29
2006 2007 2008 2009
Spread of Mortgage Rate to Treasury Yield
Weekly
Note: Spreads are relative to corresponding off-the-runTreasury yields. Source: Bloomberg; Freddie Mac.
0
50
100
150
200
250
300Billions of dollars
2002 2003 2004 2005 2006 2007 2008 2009
Non-agencyGSEsGinnie Mae
Monthly rate
Agency and Non-Agency MBS Issuance
H1
H2H1
Q3Q4J.
F.
M.
A.M.
Source: For agency issuance, Fannie Mae, Freddie Mac,and Ginnie Mae; for non-agency, Inside Mortgage Finance.
2003 2005 2007 2009-25
-20
-15
-10
-5
0
5
10
15
20Percent change from a year earlier
FHFA price indexLoanPerformance price index20-city S&P/Case-Shiller price index
Prices of Existing Homes
Monthly
Source: For FHFA, Federal Housing Finance Agency; for S&P/Case-Shiller, Standard & Poor’s; for LoanPerformance, First American CoreLogic.
May
May
May
2001 2003 2005 2007 2009 0
3
6
9
12
15Percent of loans
Variable-rateFixed-rate
June
June
Delinquencies on Prime Mortgages
Monthly
Note: Percent of loans 90 or more days past due or inforeclosure. Prime includes near-prime mortgages. Source: McDash Analytics.
2001 2003 2005 2007 2009 0
5
10
15
20
25
30
35
40
Percent of loans
Variable-rateFixed-rate
May
May
Delinquencies on Subprime Mortgages
Monthly
Note: Percent of loans 90 or more days past due or inforeclosure. Rates are for securitized loans. Source: LoanPerformance, a division of First American CoreLogic.
Residential Mortgages
III-13
0
4
8
12
16
20
24
28Billions of dollars
2005 2006 2007 2008 2009
TALF facilitated Non-TALF
H1
Q3
Q4 J F
M A
M
J
J*
Gross Consumer ABS Issuance
Monthly rate
Note: Credit card, auto, and student loan ABS. * Through July 29. Source: Inside MBS & ABS, Merrill Lynch, Bloomberg,Federal Reserve.
May Sept. Feb. June Oct. Feb. June2007 2008 2009
0
100
200
300
400
500
600
700Basis points
2-year credit card2-year auto
Weekly
Aug. 7
June FOMC
AAA ABS Spreads over Swaps
Source: For credit cards and auto, Citigroup Global Markets.
2007 2008 2009 4 5 6 7 8 910111213141516
Percent
New auto loans
Credit cardsall accounts
June FOMC
Consumer Loan Rates
Aug. 2
May
Source: For credit cards, Federal Reserve; for new auto loans, PIN.1997 1999 2001 2003 2005 2007 2009
1
2
3
4
5
6
7Percent
Auto loans at captive finance companies
Credit card loans in securitized pools
Nonrevolvingconsumer loans atcommercial banks
May
May
Q1
Delinquencies on Consumer Loans
Source: For auto loans, Federal Reserve; for credit cards, Moody’sInvestors Service; for nonrevolving consumer loans, Call Report.
Consumer Credit and Household Wealth
Net Flows into Mutual Funds(Billions of dollars, monthly rate)
Note: Indirect bids and actual allotment are a percentage ofthe total amount accepted, including the amount tendered tothe Federal Reserve. Moving averages include 2-, 5-, and 10-year original auctions and reopenings. Source: Federal Reserve Board.
2001 2003 2005 2007 2009 0
5
10
15
20
25
30Basis points
Average Absolute Nominal Yield CurveFitting Error
Daily
Note: Calculated from securities with 2 to 10 years until maturity,excluding on-the-run and first off-the-run securities. Source: Federal Reserve Board.
JuneFOMC
Aug. 4
2004 2005 2006 2007 2008 2009 0
50
100
150
200
250Billions of dollars
Daily Treasury Market Volume
Note: July observation is the month-to-date average. Source: Bloomberg.
Monthly average
Aug.
2001 2003 2005 2007 2009 0
10
20
30
40
50
60
70
Basis points
10-year note
Treasury On-the-Run Premium
Monthly average
Note: Computed as the spread of the yield read from an estimatedoff-the-run yield curve over the on-the-run Treasury yield. Julyobservation is the month-to-date average. Source: Federal Reserve Bank of New York.
JuneFOMC
Aug.
Jan. May Oct. Mar. Aug. Jan. May2007 2008 2009
0
500
1000
1500
2000
2500
3000Billions of dollars
July 22
JuneFOMC
Weekly
Treasury Fails-to-Deliver
Source: Federal Reserve Board, FR 2004, Government SecuritiesDealers Reports.
III-15
inflows in June and July. In contrast, money market mutual funds saw net outflows over the same period as yields on these funds remained extremely low.
Treasury and Agency Finance Over the intermeeting period, ten auctions of Treasury securities totaling $252 billion were held. Although the auctions were for record amounts, they were generally well received early in the intermeeting period, with bid-to-cover ratios near or above recent levels. Foreign demand at these auctions also appeared solid. However, auctions for the two- and five-year notes during the week of July 27 were met with tepid demand. In its midquarter refunding announcement, the Treasury indicated that its financing needs likely would require gradually increasing auction sizes and making potential changes in the auction calendar and in the range of benchmark securities offered. The Treasury also indicated that TIPS issuance would likely increase in fiscal year 2010 and that it is considering replacing the 20-year TIPS with a 30-year TIPS. Changes to the TIPS program will be announced in November. Finally, the Treasury noted that it expects to reach the debt ceiling in the last quarter of this calendar year.
Indicators of Treasury market functioning were little changed over the intermeeting period, and functioning continues to be somewhat impaired. However, fitting errors from the staff’s nominal yield curve model continued to shrink and are now at levels similar to those seen in early 2008, pointing to improved market performance. Bid-asked spreads held roughly steady, and trading volumes remain low. The staff’s measure of the on-the-run liquidity premium for the 10-year Treasury note was little changed at elevated levels, although well below its peak last fall.
Auctions of agency debt were generally well received during the intermeeting period. The spread between yields on senior and subordinated agency debt narrowed significantly following the announcement by Freddie Mac that it would be tendering offers for all of its outstanding subordinated debt. On July 20, Freddie Mac announced the pricing of the tender offers and reported that it tendered nearly $3.9 billion of its $4.4 billion of outstanding subordinated debt. Market participants reportedly expect Fannie Mae to follow suit by buying back its subordinated debt.
State and Local Government Finance Conditions in the municipal bond market were little changed over the intermeeting period. Gross issuance of long-term municipal bonds was solid in July, mostly driven by the strength in new capital issuance. Short-term issuance was moderate, consistent with
III-16
State and Local Government FinanceGross Offerings of Municipal Securities
(Billions of dollars; monthly rate, not seasonally adjusted)
2008 2009
Type of security 2005 2006 2007 H1 H2 Q1 Q2 July p
1. Includes issues for public and private purposes. 2. All issues that include any refunding bonds. p Forecast based on preliminary data through July 30, 2009. Source: Thomson Financial.
1. For years, Q4 to Q4; for quarters and months, calculated from corresponding average levels.2. Nonbank traveler’s checks are not listed.3. Sum of demand deposits, other checkable deposits, and savings deposits.e Estimated.Source: Federal Reserve.
III-18
Commercial Bank Credit(Percent change, annual rate, except as noted; seasonally adjusted)
Type of credit 2007 2008 H2 Q1 Q2 June July Level1
Note: Yearly annual rates are Q4 to Q4; quarterly and monthly annual rates use corresponding average levels. Data have beenadjusted to remove the effects of mark-to-market accounting rules (FAS 115) and the initial consolidation of certain variableinterest entities (FIN 46). Data also account for the effects of nonbank structure activity of $5 billion or more. 1. Billions of dollars. Pro rata averages of weekly (Wednesday) levels. 2. Excludes interbank loans. 3. Includes an estimate of outstanding loans securitized by commercial banks. 4. Includes private mortgage-backed securities; securities of corporations, state and local governments, and foreign governments;and any trading account securities that are not Treasury or agency securities. e Estimated. Source: Federal Reserve.
III-19
typical seasonal patterns. Yields on long-term municipal bonds were little changed over the intermeeting period, as were their ratios to yields on comparable-maturity Treasury securities. Rating upgrades in the second quarter continued to outpace downgrades, as rating agencies continued to implement changes to the rating scale for municipal credits toward the more lenient corporate scale. On July 14, Moody’s lowered California's credit rating from A2 to Baa1. However, on July 24, the state reached a deal to close its $26 billion budget gap, alleviating concern of near-term further deterioration of the state’s credit quality. Investors reportedly remain concerned about the state’s longer-term budget.
Money and Bank Credit M2 increased slightly, on net, over the past two months. Retail money market mutual funds and small time deposits dropped sharply in June and are estimated to have contracted again in July, likely reflecting the very low rates of interest on these assets and a continued reallocation of wealth toward riskier assets. These declines were partly offset by net growth of liquid deposits, suggesting some portfolio reallocation within M2 assets as well. Currency growth was also weak, on balance, which reportedly reflects soft foreign demand with global economic conditions stabilizing. The monetary base declined appreciably in June and July because of a reduction in use of liquidity and credit facilities that more than offset continued large-scale asset purchases.
Commercial bank credit contracted further in June and July, as all major loan categories declined. Core loans fell at an 8¾ percent pace, on average, reflecting weaker demand for most types of loans, some substitution from bank loans to other funding sources, and an ongoing tightening of lending standards and terms. C&I loans dropped steeply amid subdued origination activity and broad-based paydowns of outstanding loans. In the July Senior Loan Officer Opinion Survey, respondents indicated that the most important reasons for the decline in C&I loans this year were weaker demand from creditworthy borrowers and the deterioration in credit quality that has reduced the number of firms that respondents viewed as creditworthy. The contraction in commercial real estate lending accelerated, as large fractions of respondents in the July survey again noted tighter standards. While that fraction was down somewhat from the April survey, it remained higher than the fraction for any other loan category aside from nontraditional mortgages.
Regarding lending to households, residential real estate loans are estimated to have contracted in July for the fourth straight month, in part because of a continued rapid pace of securitizations and loan sales to the GSEs. The contraction in home equity lending
III-20
steepened in June and July, likely owing in part to further reductions in the credit lines of existing customers over the past few months, as indicated in the July Senior Loan Officer Opinion Survey. The stock of consumer loans originated by banks continued to shrink at a moderate pace in June and July, while on-balance-sheet holdings decreased more rapidly. The decline in consumer loans is consistent with weaker demand and some further tightening of standards and terms.
Appendix
III-A-1
1 Respondent banks received the survey on or after July 14, 2009, and their responses were due on July
28, 2009. 2 For questions that ask about lending standards, reported net percentages equal the percentage of
banks that reported tightening standards (“tightened considerably” or “tightened somewhat”) minus the percentage of banks that reported easing standards (“eased considerably” or “eased somewhat”). For questions that ask about demand, reported net percentages equal the percentage of banks that reported stronger demand (“substantially stronger” or “moderately stronger”) minus the percentage of banks that reported weaker demand (“substantially weaker” or “moderately weaker”).
Senior Loan Officer Opinion Survey on Bank Lending Practices
The July 2009 Senior Loan Officer Opinion Survey on Bank Lending Practices addressed changes in the supply of, and demand for, loans to businesses and households over the past three months. The survey also included two sets of special questions: The first set asked banks to rank the causes of declines this year in commercial and industrial (C&I) lending, and the second set asked banks about their expectations for lending standards relative to norms over the past decade. This appendix is based on responses from 55 domestic banks and 23 U.S. branches and agencies of foreign banks.1
In the July survey, domestic banks indicated that they continued to tighten standards and terms over the past three months on all major types of loans to businesses and households, although the net percentages of banks that tightened declined compared to the April survey.2 Demand for loans continued to weaken across all major categories except for prime residential mortgages. The fraction of domestic banks reporting additional weakening in demand in this survey was slightly less than in the April survey for C&I loans and home equity lines of credit, approximately the same for commercial real estate (CRE) and nontraditional residential mortgages, and slightly more for consumer loans.
In response to a special question on the sources of decline in C&I lending this year, domestic banks ranked decreased loan demand and deteriorating credit quality as the most important sources. In response to a second special question, most banks expected their lending standards to remain tighter than average across all lending categories until at least the second half of 2010; for below-investment-grade firms and nonprime households, the expected timing is later, with many banks reporting that standards for such borrowers will remain tighter than average for the foreseeable future. On balance, the largest banks generally expected lending standards to remain stringent for longer than other banks.
Lending to Businesses Questions on commercial and industrial lending. About 30 percent of domestic respondents, on net, reported tightening standards on C&I loans to large firms. That percentage is roughly
PercentNet Percentage of Domestic Respondents Reporting Stronger Demand for Commercial and Industrial Loans
III-A-3
10 percentage points lower than in the April survey, continuing the declining trend that began after the measure reached a peak of roughly 85 percent in the November 2008 survey. Standards on C&I loans to small firms were reported as having been tightened by a net fraction of about 35 percent of domestic respondents, down from above 40 percent in April and 70 percent in January.
Tightening of the various terms on C&I loans by domestic respondents continued, but, in general, the net fractions that reported tightening continued to fall from their highs in late 2008. Approximately 60 percent, on net, reported increasing spreads of loan rates for large firms, compared with 80 percent in April. For small firms, about 65 percent reported increasing spreads, compared with 75 percent in April. These movements contrast with the narrowing in corporate bond spreads over the same period. Significant net fractions of respondents continued to report tightening of other price terms on loans to firms of all sizes; in particular, the costs of credit lines and premiums charged on riskier loans were reported as having been tightened by net fractions in excess of 50 percent of respondents.
U.S. branches and agencies of foreign banks also reported tightening their business lending stance further over the past three months. For C&I lending, the net percentage that reported having done so was again lower than in the previous survey. About 15 percent of foreign banks, on net, reported tightening credit standards for C&I loans, compared with 30 percent in April and 65 percent in January. Regarding lending terms, about 30 percent of foreign banks, on net, reported increasing the costs of credit lines, compared with 65 percent in April. The net percentage of foreign respondents that reported increasing premiums on riskier loans was 30 percent, down from 70 percent in April. In addition, about 15 percent of foreign banks reported increasing the spreads of loan rates over their cost of funds, down from about 60 percent in April.
The predominant reasons banks gave for tightening credit standards or terms for C&I loans resembled those reported in the previous two surveys. Both domestic and foreign respondents nearly unanimously cited a less favorable or more uncertain economic outlook and large majorities cited a reduced tolerance for risk. Domestic respondents also widely noted a worsening of industry-specific problems, while foreign respondents were more likely to cite an increase in defaults by borrowers in public debt markets, as well as deterioration in their banks’ current or expected capital positions. The net fraction of foreign banks reporting concern over decreased liquidity in the secondary market for C&I loans fell substantially to 30 percent from about 70 percent in the April survey.
Considerable net fractions of domestic respondents again reported weaker demand for C&I loans from firms of all sizes. About 45 percent of domestic respondents reported weaker demand for C&I loans to large firms, on net, and 55 percent indicated weaker demand from small firms; these figures are somewhat lower than the April figures of 60 and 65 percent for large and small firms,
Net Percentage of Domestic Respondents Reporting Stronger Demand for Commercial Real Estate Loans
III-A-5
respectively. About one-fourth of reporting foreign banks, on net, indicated weaker demand for C&I loans, in contrast to the April survey, in which these banks reported that demand was about unchanged, on net.
Both foreign and domestic respondents unanimously cited a decreased financing need by customers for investment in plant or equipment as a reason for weaker demand for C&I loans over the past three months. The other predominant reasons for weaker demand included decreases in the need to finance inventories, accounts receivable, and mergers or acquisitions. On net, about 25 percent of domestic banks reported that inquiries from potential business borrowers had declined during the survey period, slightly less than was reported in April. A little more than 15 percent of foreign banks reported a decline in such inquiries, an increase from the April survey.
Special Question on Commercial and Industrial Lending The July survey included a special question on C&I lending. To gather information about the effects of supply and demand in the market for C&I loans, the survey asked banks to rank the relative importance of five potential sources of the decline in C&I lending this year. According to domestic banks, the most important factor, on average, was lower loan demand from creditworthy borrowers because their funding needs have declined, followed by deteriorating credit quality of potential borrowers. Foreign banks, in contrast, ranked lower loan demand due to reduced funding needs third, and listed deteriorating credit quality as the most important reason, followed by tighter bank lending standards. Despite strong corporate bond issuance over the past few months and improved functioning in the commercial paper markets, both domestic and foreign banks indicated that one of the least two important factors (among those listed on the survey) was the availability of other sources of funding. Respondents also indicated that higher spreads and fees were relatively unimportant.
Questions on commercial real estate lending. The fraction of domestic respondents that reported tightening standards on CRE loans fell to about 45 percent, compared with 65 percent in April. Still, this fraction is higher than that reported for C&I loans and all consumer lending categories except nontraditional residential mortgages. About 45 percent of foreign banks also reported tightening standards on CRE loans, a slight increase from the figure reported in April. The net percentage of domestic respondents that reported weaker demand for CRE loans fell slightly to roughly 65 percent, but it remained large by historical standards and relative to other loan categories. About 45 percent of foreign respondents also reported weaker demand, a slight increase from the April survey.
Lending to Households Questions on residential real estate lending. After holding nearly flat in the April survey, the net percentage of domestic banks that tightened standards on prime residential real estate loans
III-A-6
-20
0
20
40
60
80
100
1990 1992 1994 1996 1998 2000 2002 2004 2006
Percent
All residential
Net Percentage of Domestic Respondents Tightening Standards for Residential Mortgage Loans
Note: For data starting in 2007:Q2, changes in standards for prime, nontraditional, and subprime mortgage loans are reported separately.
Q2 Q4 Q2 Q4 Q2 Q4
2007 2008 2009
-20
0
20
40
60
80
100
Percent
Prime
Nontraditional
Subprime
-80
-60
-40
-20
0
20
40
60
80
1990 1992 1994 1996 1998 2000 2002 2004 2006
Percent
All residential
Net Percentage of Domestic Respondents Reporting Stronger Demand for Residential Mortgage Loans
Note: For data starting in 2007:Q2, changes in demand for prime, nontraditional, and subprime mortgage loans are reported separately.
Q2 Q4 Q2 Q4 Q2 Q4
2007 2008 2009
-80
-60
-40
-20
0
20
40
60
80Percent
Prime
Nontraditional
Subprime
Measures of Supply and Demand for Residential Mortgage Loans
III-A-7
3 Responses to the this question that asks about demand for prime mortgages are highly correlated with
refinancing activity despite our instructions to consider only new originations as opposed to the refinancing of existing mortgages.
resumed declining from its peak level of about 75 percent one year ago. The measure fell approximately 25 percentage points in this survey to roughly 20 percent. For the second consecutive survey, domestic banks reported increased demand from prime borrowers for residential mortgages; however, consistent with the recent reduction in refinancing activity, the net fraction fell to 15 percent from 35 percent in April.3 The net fraction of respondents that tightened standards on nontraditional residential mortgages fell to roughly 45 percent from 65 percent in April. The net fraction that reported weaker demand for such mortgages was little changed at around 15 percent.
The net fraction of domestic banks that reported tightening their lending standards on home equity lines of credit fell to roughly 30 percent from 50 percent in the April survey, and the fraction of banks reporting weaker demand for home equity lines of credit decreased to about 15 percent from 30 percent in the April survey.
Questions on consumer lending. For the second consecutive survey, domestic banks reported little change in their willingness to make consumer installment loans. The net fraction of domestic banks that reported tighter credit card lending standards fell significantly from nearly 60 percent to around 35 percent. Similarly, the net fraction of domestic banks that reported tighter standards on consumer loans other than credit cards declined to 35 percent from 45 percent in April. For both credit card and other consumer loans, domestic banks continued to report tightening of loan terms and conditions, although the net fractions of banks that tightened were not as high as in April. The net fraction of domestic banks reporting weaker demand for all types of consumer loans rose a few percentage points to about 20 percent.
Questions on existing credit lines. As in the April survey, significant net fractions of respondents reported decreasing the sizes of credit lines for existing customers on all types of business and consumer accounts surveyed. Nevertheless, these net percentages edged down for all categories of credit lines.
Special Questions on the Levels of Lending Standards A set of special questions asked domestic banks about the level of their current lending standards relative to the average level over the past decade (longer-term average) and about their expectations for this relative level in the future. Most of the recurring survey questions ask banks about changes in the levels of their lending standards over the past three months rather than about the levels of their lending standards. Because recent survey responses have indicated widespread tightening of standards, these special questions were intended to elicit information about whether banks have responded to the current economic downturn by pushing the level of
PercentNet Percentage of Domestic Respondents Reporting Stronger Demand for Consumer Loans
III-A-9
4 Because of data limitations, weights correspond to loan types but not to credit quality categories. For
example, the loan amounts used to calculate the weighted distribution of responses for investment-grade C&I lending standards are the same weights used to calculate the distribution of responses for non-investment-grade C&I lending standards.
their lending standards above the longer-term average and, if so, whether the elevated level of standards is expected to persist for some time.
For C&I loans to investment-grade firms, 50 percent of the respondents reported that their standards were tighter than the longer-term average but were expected to return to average levels by the end of 2010 or earlier. In addition, 25 percent of respondents indicated that standards on investment-grade C&I loans were not tighter than the longer-term average. Around 20 percent of respondents indicated that they expected C&I lending standards for both investment-grade and non-investment-grade C&I loans to remain tighter than their longer-term average for the foreseeable future. When weighted by outstanding C&I loan amounts on banks’ books, this measure rose to nearly 25 percent for both credit quality classifications.4
With respect to CRE lending standards, nearly all banks indicated that current standards were tighter than their longer-term average levels. Around 40 percent expected standards to return to longer-term average levels by the second half of 2010 or in 2011 for both investment-grade and non-investment-grade lending. However, 40 percent indicated that standards for investment-grade CRE lending would remain tighter than their longer-term average levels into the foreseeable future, and about 55 percent expected this outcome for non-investment-grade CRE loans.
For prime residential real estate lending (including home equity lines of credit), of the respondents that reported that standards were currently tighter than longer-term average levels, about one-half expected standards to return to those levels by the end of 2011, with most of those expecting a return by the second half of 2010. When weighted by residential real estate loans on banks’ books, however, the fraction that indicated standards would indefinitely remain tighter than their longer-term average levels rose from less than one-half to more than three-fourths. The comparable measure for nonprime standards was about 60 percent unweighted, and about 80 percent when weighted.
With respect to prime credit card borrowers, in the unweighted analysis, roughly one-third of respondents expected standards to remain tighter that their longer-term average levels for the foreseeable future, while one-fourth expected a return to longer-term average levels in 2011, and one-fourth expected a return earlier than 2011. Lending standards for nonprime credit card borrowers were expected to remain tight for a longer period, with two-thirds of respondents not expecting a return to longer-term average levels for the foreseeable future. When weighted by credit card loans on banks’ books, about 80 percent of respondents reported that credit card lending standards would remain tighter than average for the foreseeable future for both prime and
III-A-10
nonprime borrowers. The weighted analysis also showed that almost all respondents with large credit card operations considered credit card lending standards to be tighter than the average over the past decade.
When asked about expected lending standards for other consumer loans to prime and nonprime borrowers, 25 percent and about 20 percent of respondents, respectively, reported that standards for such loans were not tighter than longer-term average levels. Another 50 percent and 25 percent of respondents, respectively, indicated that standards for consumer loans to prime and nonprime borrowers were tighter than longer-term average levels but would ease by the end of 2011 or earlier. Weighting by on-balance-sheet loans, however, again indicated much smaller percentages of loans at banks for which respondents either expect standards to ease in the nearer term or view standards as not currently tighter than average. For prime borrowers, nearly 65 percent of outstanding other consumer loans were held by respondents that did not see their standards for other consumer loans easing to longer-term average levels in the foreseeable future, and only 10 percent of loans were held by respondents that reported prime lending standards were not tighter than longer-term average levels. For nonprime borrowers on a weighted basis, about 85 percent of other consumer loans were held by respondents that did not expect lending standards for these loans to ease to longer-term average levels in the foreseeable future, and around 5 percent of other consumer loans were held by banks that indicated their nonprime standards on such loans were not tighter than longer-term average levels.
III-A-11
When respondents expect their C&I lending standards to return to longer-run norms
2
11
36
5
21
25
0
4
29
31
23
13
Percent
Investment-grade firms
Below-investment-grade firms
When respondents expect their CRE lending standards to return to longer-run norms
0
2
22
20
40
16
0
0
10
29
53
8
Percent
Investment-grade firms
Below-investment-grade firms
When respondents expect their residential real estate (RRE) lending standards to return to longer-run norms
2
6
27
13
42
10
0
4
12
15
58
12
Percent
Prime household borrowers
Nonprime household borrowers
By the end of 2009
In the first half of 2010
In 2011
Tighter than longer-run average levels for the foreseeable future
Current level is not tighter than average level over past decade
In the second half of 2010
By the end of 2009
In the first half of 2010
In 2011
Tighter than longer-run average levels for the foreseeable future
Current level is not tighter than average level over past decade
In the second half of 2010
By the end of 2009
In the first half of 2010
In 2011
Tighter than longer-run average levels for the foreseeable future
Current level is not tighter than average level over past decade
In the second half of 2010
III-A-12
When respondents expect their credit card (CC) lending standards to return to longer-run norms
3
10
13
26
32
16
0
6
11
67
11
6
Percent
Prime household borrowers
Nonprime household borrowers
When respondents expect their other consumer standards to return to longer-run norms
2
6
23
19
25
25
0
4
7
14
57
18
Percent
Prime household borrowers
Nonprime household borrowers
Percent of respondents that expect their lending standards to remain tighter than average for the foreseeable future
24
41
78
63
20
40 42
32
25
77
C&I CRE RRE CC Other
Per
cent
Weighted by loans on balance sheet
Unweighted
By the end of 2009
In the first half of 2010
In 2011
Tighter than longer-run average levels for the foreseeable future
Current level is not tighter than average level over past decade
In the second half of 2010
By the end of 2009
In the first half of 2010
In 2011
Tighter than longer-run average levels for the foreseeable future
Current level is not tighter than average level over past decade
Goods, net -840.2 -715.3 -496.1 -463.5 -39.2 -39.9 -37.3Services, net 144.3 137.3 131.4 135.0 10.7 11.1 11.4
n.a. Not available. ... Not applicable. BOP Balance of payments. NIPA National income and product accounts. e BOP data are two months at an annual rate; NIPA data are BEA’s advance estimate. Source: U.S. Dept. of Commerce, Bureau of Economic Analysis; Census Bureau.
U.S. International Transactions Trade in Goods and Services In May, the U.S. international trade deficit narrowed to $26 billion, the smallest deficit since 1999, as exports increased moderately and imports declined.
The value of exports of goods and services rose 1.6 percent in May after falling 2 percent in April. The May increase was led by a climb in exports of industrial supplies, particularly of petroleum products, and reflected both higher prices and greater volumes. Exports of capital goods and consumer goods rose modestly, whereas automotive products and services fell.
Despite the May increase, the average value of exports in April and May declined 8.5 percent at an annual rate from the first quarter, with exports of capital goods recording the most pronounced weakness. Most other major categories of exports also declined, with only industrial supplies and agricultural goods showing increases, helped by higher commodity prices.
IV-2
U.S. International Trade in Goods and Services
2000 2002 2004 2006 2008-900
-800
-700
-600
-500
-400
-300
-200
-100
0
May
(Quarterly)
Trade BalanceBillions of dollars, annual rate
2000 2002 2004 2006 2008-2.0
-1.5
-1.0
-0.5
0.0
0.5
1.0
1.5
2.0
2.5
3.0
3.5
Contribution of Net Exports to Growth of Real Gross Domestic Product
Percentage points, annual rate
2000 2002 2004 2006 20080
50
100
150
200
250
300
350
400
450
500
550
600
Source: U.S. Dept. of Commerce, Bureau of Economic Analysis; Census Bureau.
Industrialsupplies
Consumergoods
Aircraft
Capital goodsex. aircraft
Selected ExportsBillions of dollars, annual rate
2000 2002 2004 2006 20080
50
100
150
200
250
300
350
400
450
500
550
600
Consumergoods
Industrialsupplies
Oil
Capital goods
Selected ImportsBillions of dollars, annual rate
IV-3
U.S. Exports and Imports of Goods and Services(Billions of dollars; annual rate, balance of payments basis)
Levels Change1
2009 2009 2009 2009Q1 Q2e Apr. May Q1 Q2e Apr. May
Exports of goods and services 1501.2 1468.3 1456.9 1479.7 -195.4 -32.9 -30.3 22.8
1. Change from previous quarter or month.e Estimate based on average of two months.Source: U.S. Dept. of Commerce, Bureau of Economic Analysis; Census Bureau.
IV-4
The value of imports of goods and services fell 0.6 percent in May, a deceleration from April’s 1.5 percent decline. Imports of petroleum products exhibited the largest decline in May, with the fall wholly reflecting lower volumes, as petroleum prices rose. Imports of services and automotive products moved down a touch, while industrial supplies were flat. Overall imports of consumer goods were also flat, as a large decline in pharmaceuticals offset increases in a number of other goods. In contrast, imports of computers moved up strongly.
The average value of imports in April and May fell 14 percent at an annual rate from the first quarter. Lower imports of industrial supplies and capital goods accounted for most of the decline, but services and automotive products also declined. In contrast, imports of consumer goods and petroleum recorded small increases.
Prices of Internationally Traded Goods Non-oil imports. In June, prices of imported core goods rose 0.2 percent, following a 0.3 percent increase in May. The June increase reflected higher prices for material-intensive goods, which rose 0.6 percent. Within that category, higher prices for unfinished metals led to an increase in prices for industrial supplies, and prices for imported foods also rose. Prices for finished goods edged up, increasing 0.1 percent across all major categories.
The average level of core import prices in the second quarter was 1.2 percent (a.r.) below the first-quarter average, a much smaller drop than the 11.3 percent decline observed in the first quarter. One factor contributing to the difference was a deceleration in prices of material-intensive goods, which fell only 2.6 percent in the second quarter after having fallen 30.1 percent in the first quarter. Likewise, prices for finished goods fell less in the second quarter than in the first. In contrast, prices for capital goods excluding computers and semiconductors fell more rapidly in the second quarter, dropping 1.6 percent after having declined only 0.7 percent in the first quarter.
Oil. The Bureau of Labor Statistics price index of imported oil rose for a fifth straight month, increasing more than 20 percent in June. The spot price of West Texas intermediate (WTI) crude oil rose by a similar amount, averaging just less than $70 per barrel for the month as a whole. In July, the price of spot WTI was volatile but, on net, was little changed, and closed most recently on August 4 at $71.42 per barrel. The lack
IV-5
of change of oil prices on balance reflects the offsetting of positive news regarding global economic activity by high global crude and petroleum product inventories and increased OPEC production.
1. Excludes computers, semiconductors, and natural gas.2. Excludes computers and semiconductors.n.a. Not available. ... Not applicable.BLS Bureau of Labor Statistics.NIPA National income and product accounts.Source: U.S. Dept. of Commerce, Bureau of Economic Analysis; Bureau of Labor Statistics.
IV-8
Exports. Core export prices jumped 1.4 percent in June after increasing 0.7 percent in May. Prices for material-intensive goods rose 2.9 percent, led by higher prices for agricultural exports. Prices for finished goods rose 0.2 percent, as higher prices for capital goods excluding computers and semiconductors and for consumer goods offset falling prices for automotive products.
The average level of core export prices in the second quarter was up 3.1 percent at an annual rate from the first-quarter average. The rise can be attributed to the 20.8 percent increase in prices of agricultural products, which had fallen at a 12.3 percent pace in the first quarter. For non-agricultural industrial supplies, after a 28.4 percent price decline in the first quarter, prices were up 2 percent in the second quarter. Prices of exported finished goods firmed 0.5 percent on balance.
IV-9
U.S. International Financial Transactions Since the previous Greenbook, we have received Treasury data on international financial transactions for May and June that support the view that tensions in financial markets eased in those months. Private investors both in the United States and abroad appear to have resumed purchases of riskier cross-border securities. Foreign private investors have also resumed their purchases of U.S. Treasuries. Foreign official inflows picked up further in May and June and the more recent custody data from FRBNY suggest they weakened only slightly in July. Notwithstanding their strong demand for Treasuries in June, foreign private investors’ purchases of U.S. Treasuries in the second quarter were well below those in the first quarter and the second half of last year (see line 4a of the table “Summary of U.S. International Transactions” and the upper panels of the figure “Private Securities Flows through June 2009”). However, foreign private investors’ purchases of U.S. stocks picked up smartly in the second quarter, with large purchases in May and June (line 4d). Foreign investors sold little U.S. agency and corporate debt, on net, in May and June, in marked contrast to the large net sales recorded since last summer (lines 4b and 4c). Similarly, U.S. investors made sizable purchases of foreign securities in the second quarter (line 5 and the bottom panels of the figure “Private Securities Flows through June 2009”), a significant swing from the net sales recorded in the second half of last year. Foreign official inflows in the second quarter were well above the pace of the first quarter (see line 1 of the table “Summary of U.S. International Transactions”) and exceeded their 2007-08 rate.
. As has been the case since
last summer, official inflows continue to be overwhelmingly into U.S. Treasury securities (see the figure “Foreign Official Financial Inflows through June 2009”). FRBNY custody data indicate that official acquisitions of U.S. Treasuries remained strong in July, although total official inflows appear to have weakened a touch as most countries reduced their holdings of agencies. Amounts outstanding of the Fed’s central bank liquidity swaps have declined to $76 billion as of July 31; the unwinding of these swaps is recorded as a reduction in U.S. official claims on foreigners (line 2). U.S. banks continued to lend abroad in June
IV-10
(line 3), allowing foreign banks to reduce their draws on the swap lines. A slight upward trend in gross cross-border bank claims (not shown), also reflects this reengagement.
IV-11
IV-12
IV-13
IV-14
Foreign Financial Markets Stock markets rose globally, on net, and the dollar depreciated mildly against most currencies as positive U.S. earnings reports and news of strong growth in emerging Asia lifted investor sentiment. European and Japanese stock indexes have increased roughly 9 and 6 percent, respectively, since the June Greenbook. European bank stocks rose about 17 percent, spurred by early reports of better-than-expected profits among some European banks as well as by strong earnings reports from some U.S. financial institutions. Mutual fund flows to the EMEs turned positive after a brief period of outflows in late June; emerging Asian stock markets have increased 8 to 25 percent, while emerging Latin American stock markets have increased 2 to 15 percent. Since the June Greenbook, the dollar has depreciated about 4 percent on a trade-weighted basis against the major foreign currencies and about 1 percent against the currencies of other important trading partners of the United States.
Overnight interest rates in the euro area have declined to about 35 basis points in the wake of the June 24 injection by the European Central Bank (ECB) of one-year funds at a fixed rate of 1 percent. Banks took down a record €442 billion in the operation, increasing euros outstanding from ECB refinancing operations 45 percent. The ECB also began its purchases of covered bonds, buying roughly €5 billion of bonds so far. Yields on intermediate-term European covered bonds have declined roughly 30 basis points since the purchases began in early July. In contrast, yields on longer-dated gilts rose as much as 19 basis points immediately after the Bank of England (BOE) surprised markets by leaving the size of its Asset Purchase Facility (APF) unchanged at £125 billion at its July MPC meeting. Gilt yields continued to edge higher as the bank’s purchases neared their limit under the facility, which was reached last week; however, the completion of purchases, which was expected, had little apparent impact on the gilt market. Market participants were divided as to whether the BOE would authorize any further purchases at its August meeting, but the MPC decided to renew its purchases just as the Greenbook closed. Citing the depth of the recession, the BOE raised the size of the APF to £175 billion and widened the set of gilts it would purchase, stating that it expected to conduct its additional purchases over the next three months. Benchmark gilt yields fell about 20 basis points on the announcement.
Although the BOE may yet choose to make further use of its Asset Purchase Facility, bank officials have begun to publicly discuss the outlines of a possible exit strategy; Deputy Governor Charles Bean disclosed that it was quite likely that the BOE would raise its benchmark interest rate before selling any securities acquired through the
IV-15
Facility. ECB officials have also begun to publicly discuss the outlines of an eventual exit strategy–ECB Vice President Lucas Papademos stated that the decision to drain excess liquidity need not be made before interest rates were raised. He also implied that the ECB would eventually revert to its pre-crisis method of conducting refinancing operations, in which it auctioned fixed amounts of funds that banks compete to borrow, rather than offering funds in whatever quantities banks demand at fixed rates.
Spreads between euro and sterling Libor and corresponding overnight index swap rates have declined since the June Greenbook, and functioning in the FX swap market has reportedly improved. Nonetheless, spreads in the FX swap market remained well above their pre-crisis levels, and market participants welcomed the Federal Reserve’s June 25 announcement that it would extend its swap lines with other central banks through February 2010. The ECB, BOE, and Swiss National Bank (SNB) announced that they would continue to conduct 7- and 84-day auctions of dollar funding until at least September 30, but they discontinued their 28-day auctions, citing low demand. The SNB, ECB, Polish central bank, and Hungarian central bank also separately agreed to continue their own one-week swap operations supporting the exchange of euro and Swiss francs until at least the end of October.
IV-16
IV-17
IV-18
IV-19
IV-20
IV-21
Developments in Advanced Foreign Economies Recent indicators of economic activity in the advanced foreign economies suggest that the pace of contraction has moderated further. Purchasing managers indexes (PMIs) continued to rebound, although they do not yet point to expansion for all countries. Industrial production, while remaining well below pre-crisis levels, jumped in Japan, edged up in the euro area, and stabilized further elsewhere. Economic sentiment indicators also improved. However, labor market conditions continued to deteriorate, and credit standards remain generally tight.
Twelve-month consumer price inflation moderated further, with all major advanced foreign economies except the United Kingdom experiencing negative headline inflation. Excluding all food and energy prices, consumer price inflation has remained roughly stable. Over the intermeeting period, the ECB began to implement its plan to purchase €60 billion of covered bonds over the next 12 months, and the BOE expanded its asset purchase program from £125 billion to £175 billion.
Japanese Real GDP(Percent change from previous period except as noted, s.a.a.r.)
Component
1. Q4/Q4.2. Percentage point contribution to GDP growth.Source: Haver Analytics.
2008 2009
In Japan, indicators for the second quarter are positive on balance. Real exports surged a record 60 percent at an annual rate in the second quarter, but their level remains depressed, at 30 percent below their 2008 peak. After a 22 percent plunge in the first quarter, industrial production rose 8.3 percent in the second quarter but remains at a low level. These developments, combined with much-better-than-expected growth in real consumption, point to a return to positive growth in the second quarter.
In contrast, performance in the housing and labor sectors has continued to be poor. Except for the temporary, regulation-induced decline in 2007, housing starts are at their lowest level since records began in 1965. Starts fell about 16 percent over the second quarter and are down more than 30 percent in the past 12 months. House price appreciation in the major cities, which had turned positive in 2007, moved back down, falling almost 10 percent through the first quarter from a year earlier.
The deterioration in the labor market continues. The job openings-to-applicants ratio (the number of officially posted job openings relative to the number of officially registered job seekers) reached a record low level of 0.43 in June. Employment fell 2.1 percent over the past 12 months, the largest fall since 1955. The unemployment rate rose to 5.4 percent in June. Furthermore, the 12-month change of real wages reached a record-
IV-24
low of negative 5.3 percent in June; in manufacturing, real wages fell more than 12 percent.
Japanese consumer prices fell 1.8 percent over the 12 months ending in June. Prices excluding food and energy fell 0.7 percent over the same period.
The BOJ left its target for the call rate unchanged at 0.1 percent over the intermeeting period and extended its program of purchases of commercial paper, corporate bonds, equities, and government bonds until the end of this year. On July 21, Prime Minister Taro Aso dissolved the lower house of Parliament; general elections will be held on August 30.
IV-25
Japan
60
70
80
90
100
110
120
2001 2003 2005 2007 2009 Source: Haver Analytics.
Industrial productionTertiary services
Economic Activity2005 = 100
60
70
80
90
100
110
120
130
140
150
2001 2003 2005 2007 2009 Source: Haver Analytics.
Real exportsReal imports
Real Trade2005 = 100
0.4
0.5
0.6
0.7
0.8
0.9
1.0
1.1
1.2
3.5
4.0
4.5
5.0
5.5
6.0
2001 2003 2005 2007 2009 Source: Haver Analytics.
Unemployment rate (right scale)Job openings to applications (left scale)
Labor Market Ratio Percent
-2
-1
0
1
2
3
2001 2003 2005 2007 2009 *Excludes all food and energy; staff calculations. Source: Haver Analytics.
Economic Indicators(Percent change from previous period except as noted; seasonally adjusted)
Indicator
1. Private sector excluding ships and electric power. 2. Tankan survey, diffusion index. Level. 3. Percent change from year earlier; not seasonally adjusted. n.a. Not available. ... Not applicable. Source: Haver Analytics.
IV-26
20071 20081
Q2 Q3 Q4 Q1
GDP 2.2 -1.7 -1.0 -1.5 -6.9 -9.7
Total domestic demand 2.0 -.4 -2.2 1.3 -2.9 -7.6
Consumption 1.2 -.7 -1.2 -.1 -1.8 -1.8
Investment 3.2 -5.4 -5.1 -4.2 -15.4 -15.4
Government consumption 2.0 2.2 3.5 2.0 1.4 .8
Inventories2 .2 .7 -.9 1.6 1.1 -3.6
Exports 3.9 -6.6 -1.3 -2.4 -26.1 -30.9
Imports 3.5 -3.9 -3.9 3.8 -19.1 -27.0
Net exports2 .2 -1.3 1.1 -2.7 -4.1 -2.2
France 2.2 -1.7 -1.6 -.8 -5.7 -4.8
Germany 1.7 -1.8 -2.0 -2.1 -8.6 -14.4
Italy .2 -3.0 -2.2 -3.1 -8.3 -10.1
Euro-Area Real GDP(Percent change from previous period except as noted, s.a.a.r.)
Component
Memo:GDP of selected countries
1. Q4/Q4.2. Percentage point contribution to GDP growth.Source: Haver Analytics.
2008 2009
In the euro area, recent indicators suggest that the pace of contraction moderated in the second quarter. Industrial production rose 0.5 percent in May after declining 7.4 percent in the first quarter and 1.4 percent in April; in particular, Germany’s industrial production jumped 3.7 percent in May. Retail sales grew 0.2 percent in April, the first positive reading in seven months, but fell 0.5 percent in May and 0.2 percent in June. The business climate index, as well as consumer and industrial confidence, has rebounded somewhat in each month since April. PMIs generally posted gains from April to July, although they are still in the contraction region. The Ifo index of German business sentiment edged up further in July, continuing a recovery from its historical low in March.
However, labor market conditions continued to worsen. The euro-area unemployment rate rose to 9.4 percent in May, up from a low of 7.2 percent in early 2008. The extent of deterioration has varied considerably among euro-area countries, with the Spanish unemployment rate up more than 10 percentage points from its most recent low, while Germany’s unemployment rate has risen only ½ percentage point. The relatively small
IV-27
response of the German unemployment rate partly reflects government subsidies to firms to retain employees.
The net percentage of euro-area banks reporting a tightening of credit standards applied to firms declined to 21 percent in the second quarter, down from 43 percent in the first. The net tightening continued to mainly reflect expectations regarding general economic activity and the industry or firm-specific outlook. The net percentage of banks reporting a tightening of credit standards for loans to households for house purchase and for consumer credit also decreased in the second quarter.
According to the flash estimate, twelve-month euro-area July inflation was negative 0.6 percent. In June, headline inflation was negative 0.1 percent. The downturn in energy prices has been an important factor in the decline of inflation: Twelve-month energy price inflation in June was negative 11.9 percent, off from the peak of 17 percent in mid-2008. Excluding energy and food, June inflation edged down to 1.4 percent.
The Governing Council of the ECB kept its benchmark policy rate unchanged at 1 percent at its August 6 meeting. Following the ECB’s record liquidity injection of €442 billion in one-year funds, the overnight EONIA rate has declined to about 0.35 percent since end-June, just above the 0.25 percent rate on the ECB’s deposit facility. The ECB has begun to implement plans to buy €60 billion worth of covered bonds, and by early August had purchased about €5 billion in such bonds.
IV-28
Euro Area
50
100
150
200
250
2001 2003 2005 2007 2009 Source: Haver Analytics.
ExportsImports
Nominal Exports and ImportsBillions of U.S. dollars
-40
-30
-20
-10
0
10
20
2001 2003 2005 2007 2009 Source: Haver Analytics.
Consumer confidenceIndustrial confidence
Economic SentimentPercent balance
7.0
7.5
8.0
8.5
9.0
9.5
10.0
2001 2003 2005 2007 2009 Source: Haver Analytics.
Unemployment RatePercent
-1
0
1
2
3
4
5
2001 2003 2005 2007 2009 *Excludes all food and energy; staff calculations. Source: Haver Analytics.
Economic Indicators(Percent change from previous period except as noted; seasonally adjusted)
Indicator
1. Excludes construction. 2. Excludes motor vehicles. 3. Eurostat harmonized definition. Percent change from year earlier. n.a. Not available. ... Not applicable. M3 Manufacturers’ shipments, inventories, and orders. Source: Haver Analytics.
IV-29
20071 20081
Q3 Q4 Q1 Q2
GDP 2.4 -1.8 -2.9 -7.0 -9.3 -3.1
Total domestic demand 3.1 -2.9 -3.1 -8.7 -9.5 n.a.
Consumption 2.2 -.5 -1.3 -4.3 -5.3 n.a.
Investment 4.9 -7.8 -10.7 -4.7 -26.9 n.a.
Government consumption 1.2 3.5 1.9 4.3 .9 n.a.
Inventories2 .6 -2.0 -.8 -6.3 -1.5 n.a.
Exports 3.4 -3.8 -1.7 -15.6 -25.0 n.a.
Imports 5.6 -7.7 -2.8 -20.2 -24.1 n.a.
Net exports2 -.8 1.4 .4 2.1 .4 n.a.
U.K. Real GDP(Percent change from previous period except as noted, s.a.a.r.)
Component
1. Q4/Q4.2. Percentage point contribution to GDP growth.n.a. Not available.Source: Haver Analytics.
2008 2009
In the United Kingdom, real GDP contracted 3.1 percent at an annual rate in the second quarter, according to the preliminary estimate, bringing the cumulative drop in activity since early 2008 to almost 6 percent. The output of services industries fell 2.6 percent, with the largest declines observed in the transportation sector. The volume of activity in production and construction industries contracted 0.6 percent and 8.4 percent, respectively.
Indicators received since the last Greenbook are broadly consistent with a stabilization of economic activity in recent months, but signs of a general economic recovery remain limited. The PMIs for manufacturing and services stood at 50.8 and 53.2 in July, and indicators of consumer and business confidence improved further. The Labor Force Survey measure of the unemployment rate jumped to 7.6 percent in April, and the claims-based measure ticked up to 4.8 percent in June. Both the Halifax and Nationwide house price indexes have edged up in recent months, after having fallen about 20 percent from their peaks.
The supply of credit to the nonfinancial sector continues to be tight, and the demand for credit very weak. Net lending to private nonfinancial corporations again turned negative in the second quarter, while net lending secured by dwellings reached a historical low. According to the BOE’s Credit Conditions Survey, lenders reported an increase in default rates and losses given default on both corporate and household loans in the three months
IV-30
to mid-June. However, respondents on net expected an increase in the availability of credit to households and corporations over the following three months.
The 12-month rate of headline inflation moderated to 1.8 percent in June, falling below the BOE’s 2 percent target for the first time since September 2007. Producers’ input prices fell 11.0 percent in June from a year earlier. Wage inflation has slowed noticeably in recent months. Average earnings including bonuses rose 2½ percent in the year to May, 1½ percentage points less than its average growth rate over the previous five years.
On August 6, the Monetary Policy Committee of the BOE expanded its asset purchase program from £125 billion to £175 billion and widened the range of gilts it was willing to acquire. The Committee allowed itself three months to complete the additional purchases.
IV-31
United Kingdom
-1
0
1
2
3
4
5
6
2001 2003 2005 2007 2009 *Excludes all food and energy; staff calculations. Source: Haver Analytics.
Economic Indicators(Percent change from previous period except as noted; seasonally adjusted)
Indicator
1. Percent change from year earlier. 2. Percent balance. 3. Level in billions of U.S. dollars. n.a. Not available. ... Not applicable. Source: Haver Analytics; FRB staff calculations.
IV-32
20071 20081
Q2 Q3 Q4 Q1
GDP 2.8 -1.0 .3 .4 -3.7 -5.4
Total domestic demand 6.6 -1.1 2.9 .6 -6.1 -9.9
Consumption 5.4 .2 1.1 .6 -3.1 -1.6
Investment 4.5 -3.6 -.2 .6 -14.8 -20.6
Government consumption 3.7 3.1 4.6 .0 2.5 1.2
Inventories2 1.7 -1.1 1.3 .1 -1.2 -4.3
Exports -1.5 -7.3 -4.1 -4.1 -17.7 -30.4
Imports 8.5 -7.7 3.0 -3.4 -23.4 -37.8
Net exports2 -4.2 .7 -2.4 -.4 2.2 3.6
Canadian Real GDP(Percent change from previous period except as noted, s.a.a.r.)
Component
1. Q4/Q4.2. Percentage point contribution to GDP growth.Source: Haver Analytics.
2008 2009
In Canada, indicators received so far for the second quarter have been mixed. Monthly GDP fell 5.9 percent at an annual rate in May, following a 2.5 percent contraction in April. Housing starts declined a further 8½ percent in the second quarter. Employment also fell over the second quarter, albeit at a slower pace than in the first quarter. On the positive side, retail sales rose ¾ percent and building permits increased in May. In addition, business credit rose ½ percent in June, and the balance of opinion for future sales from the Bank of Canada’s business outlook survey hit a near-record high.
Twelve-month headline inflation in June declined to negative 0.3 percent, down sharply from its 3.5 percent peak in August 2008. Inflation excluding food and energy remained at around 1 percent. Median hourly earnings were down ½ percent in the second quarter.
The BOC kept its overnight target rate unchanged, at 0.25 percent, at its policy meeting in late July. In the statement following the meeting, the BOC reiterated its intention, conditional on the outlook for inflation, to keep its target rate at this level until the end of the second quarter of 2010. The BOC also revised up its projections for growth somewhat, citing a more modest retrenchment of household and business spending, improved financial conditions, and better terms of trade than had been projected in April.
IV-33
Canada
-4
-2
0
2
4
6
8
2001 2003 2005 2007 2009 Note: Constructed from various Statistics Canada surveys andsupplements to the quarterly income and expenditure-based estimates. Source: Haver Analytics.
Real Gross Domestic Product by IndustryPercent change from year earlier
70
80
90
100
110
120
130
140
150
160
2001 2003 2005 2007 2009 Source: Haver Analytics.
Real exportsReal imports
Real Trade2002 = 100
5.5
6.0
6.5
7.0
7.5
8.0
8.5
9.0
2001 2003 2005 2007 2009 Source: Haver Analytics.
Unemployment RatePercent
-1
0
1
2
3
4
5
6
2001 2003 2005 2007 2009 *Excludes all food and energy; staff calculations. Source: Haver Analytics.
Industrial production -3.2 -4.9 n.a. -1.7 -1.1 -1.9 n.a.
New manufacturing orders -9.2 -12.8 n.a. -3.1 -.4 -13.4 n.a.
Retail sales -1.7 -1.1 n.a. .7 -.4 .7 n.a.
Employment .1 -1.4 -.4 -.4 .2 -.2 .0
Wholesale sales -7.6 -7.2 n.a. -1.1 .2 .0 n.a.
Ivey PMI1 43.8 41.5 53.4 43.2 53.7 48.4 58.2
Economic Indicators(Percent change from previous period and seasonally adjusted, except as noted)
Indicator
1. PMI Purchasing managers index. Not seasonally adjusted. 50+ indicates expansion. n.a. Not available. Source: Haver Analytics; Bank for International Settlements.
IV-34
Economic Situation in Other Countries
Recent data show that economic activity surged across emerging Asia in the second quarter. Real GDP rebounded sharply in China and South Korea, and the preliminary estimate in Singapore indicates substantial growth. In China, policy stimulus lifted activity, which in turn contributed to boosting exports of other countries in Asia. Indicators for these other countries also point to a strong rebound in the second quarter. In Latin America, activity remained depressed in Mexico, partly reflecting the adverse effect of the swine flu outbreak. In contrast, activity in Brazil appears to have recovered. Twelve-month consumer price inflation further moderated across the emerging market economies, with several countries in Asia registering deflations. After cutting policy rates aggressively earlier, many central banks kept their policy rates on hold while others in Brazil, Mexico, Indonesia, the Philippines, and Russia continued to lower them.
The staff estimates that in China real GDP rose 18½ percent at an annual rate in the second quarter. The jump in growth partly reflects strong fixed-asset investment, which was 36 percent higher in the second quarter than a year earlier. Investment was supported by the fiscal stimulus package and a massive surge in bank lending. Industrial production also grew at a solid pace in the second quarter. In a promising signal of external demand, the export order subindex of the manufacturing PMI, which crossed into expansionary range in May, rose further in June and July. The trade surplus in the second quarter narrowed to $145 billion, as exports flattened and imports rose sharply, driven in part by the increase in commodity prices and stronger domestic demand.
Benchmark interest rates and banks’ reserve requirements have been on hold since the end of last year, but Chinese authorities have been encouraging loan growth this year after limiting credit growth the past few years. Consequently, outstanding loans in June were 34 percent higher than a year earlier. Chinese authorities expressed concerns that the lending may prompt asset bubbles and nonperforming loans, but they were not likely to significantly curtail lending in the near term. Thus far, the loan growth has not triggered inflationary pressures. Chinese consumer prices in June were 1¾ percent below their year-earlier level, and prices were flat in the second quarter relative to the first.
IV-35
Chinese Economic Indicators(Percent change from previous period, seasonally adjusted, except as noted)
1. Gross domestic product. Annual rate. Quarterly data estimated by staff from reported 4-quarter growth rates. Annual data are Q4/Q4. 2. Non-seasonally adjusted percent change from year-earlier period, except annual data, which are Dec./Dec. 3. Billions of U.S. dollars, annual rate. Imports are valued at cost, insurance, and freight. n.a. Not available. ... Not applicable. Source: CEIC.
Indicator
India’s indicators suggest robust growth in the second quarter. Industrial production grew in April and May. The headline PMI averaged 55, up from about 47 in the previous two quarters, suggesting an expansion in economic activity. Exports rose in the second quarter, ending three consecutive quarters of declines, but even higher imports kept the trade balance in deficit. Twelve-month consumer price inflation fell in May and rose back up in June due to higher food prices, but the closely watched wholesale price index fell sharply in June, primarily reflecting declines in energy prices. The government released its 2009-10 fiscal year budget, which targets a deficit of 6¾ percent of GDP. Citing lack of sufficient detail regarding medium-term consolidation of government finances, markets reacted poorly, with the local market index falling, the rupee depreciating, and sovereign bond spreads widening.
IV-36
Indian Economic Indicators(Percent change from previous period, seasonally adjusted, except as noted)
1. Gross domestic product. Annual rate. Annual data are Q4/Q4. 2. Non-seasonally adjusted percent change from year-earlier period, except annual data, which are Dec./Dec. 3. Billions of U.S. dollars, annual rate. 4. Billions of U.S. dollars, not seasonally adjusted, annual rate. n.a. Not available. ... Not applicable. Source: CEIC.
Indicator
IV-37
China and India
75
100
125
150
175
200
225
250
275
300
325
350
375
2003 2004 2005 2006 2007 2008 2009Source: CEIC.
ChinaIndia
Industrial ProductionJan. 2000 = 100
-2
0
2
4
6
8
10
12
2003 2004 2005 2006 2007 2008 2009Source: China Statistic and Consultancy Service Center; CEIC.
Consumer PricesPercent change from year earlier
-20
-10
0
10
20
30
40
50
2003 2004 2005 2006 2007 2008 2009Source: China Statistic and Consultancy Service Center; CEIC.
1. Gross domestic product. Annual rate. Annual data are Q4/Q4. n.a. Not available. ... Not applicable. Source: CEIC; Reuters.
Economic activity in the newly industrialized economies (NIEs)1 rebounded sharply in the second quarter as exports, particularly to China, generally picked up and as domestic demand strengthened in some cases. In South Korea, real GDP grew at a 9¾ percent pace, supported by strong domestic demand resulting mainly from the effects of previous policy easing, and by exports. In Singapore, the advanced estimate (unofficial) suggests that activity also rebounded sharply, ending four consecutive quarters of negative growth, on account of strong activity in the biomedical and electronic sectors. In Taiwan, industrial production rose steeply in the second quarter, and exports shot up, partly owing to the upturn in the high-tech sector. In addition, a recent surge in imports of capital goods and consumer products suggests that domestic demand has likely firmed. Hong Kong’s indicators, including improvements in consumer sentiment and increases in property prices, also point to recovery of activity in the second quarter.
Twelve-month consumer price inflation continued to fall across the region, reflecting slack in economic activity and, in some cases, declines in domestic energy prices and transport costs. Amid the lower inflation and still-fragile economic environment, central banks have kept policy rates on hold at low levels.
IV-39
Economic Indicators for Newly Industrialized Economies: Merchandise Trade Balance(Billions of U.S. dollars; seasonally adjusted annual rate)
Economic Indicators for Newly Industrialized Economies: Consumer Price Inflation(Non-seasonally adjusted percent change from year earlier except as noted)
1. Association of Southeast Asian Nations. 2. Gross domestic product. Annual rate. Annual data are Q4/Q4. 3. Annual data are annual averages. 4. Staff estimate. n.a. Not available. ... Not applicable. Source: CEIC.
Indicator
Across the Association of Southeast Asian Nations (ASEAN-4)2, economic indicators suggest a rebound in activity during the second quarter, particularly in Thailand, which experienced the sharpest decline over the previous two quarters. Exports from the region have picked up, aided by demand from China, and industrial production has generally moved up in the second quarter. Twelve-month consumer price inflation continued to fall across the region, with Thailand and Malaysia registering deflation in recent months. The central banks in Indonesia and the Philippines further eased monetary policy, lowering rates 25 basis points in July.
IV-42
ASEAN-41 Economic Indicators: Merchandise Trade Balance(Billions of U.S. dollars; seasonally adjusted annualized rate)
1. Association of Southeast Asian Nations. n.a. Not available. Source: CEIC; Bank of Thailand; Philippines Economic Indicators Telegram (PEIT); Monetary Authority of Singapore.
Indicator
ASEAN-41 Economic Indicators: Consumer Price Inflation(Non-seasonally adjusted percent change from year earlier except as noted)
1. Gross domestic product. Annual rate. Annual data are Q4/Q4. 2. Percent; counts as unemployed those working 1 hour a week or less. 3. Non-seasonally adjusted percent change from year-earlier period, except annual data, which are Dec./Dec. 4. Billions of U.S. dollars, annual rate. 5. Billions of U.S. dollars, not seasonally adjusted, annual rate. n.a. Not available. ... Not applicable. Source: Haver Analytics; Bank of Mexico.
Indicator
In Mexico, real GDP likely continued to contract in the second quarter, albeit at a slower pace than in the first. Industrial production fell sharply in May due to a two-week shutdown of manufacturing plants in response to the swine flu outbreak. The automotive sector showed signs of improvements with auto exports increasing and inventories falling, but production was held back by the restructuring of Chrysler and General Motors. Both exports and imports rose in June, but they remained relatively weak overall. The unemployment rate rose to 5¾ percent in the second quarter.
Twelve-month headline consumer price inflation is abating, reflecting tepid domestic demand and the stabilization of the peso, but remained stubornly above the upper limit of the Bank of Mexico’s 2-to-4 percent target range. Nevertheless, the Bank of Mexico cut its policy rate 75 basis points to 4½ percent during the intermeeting period. In the legislative elections held on July 5, the ruling PAN party lost the majority of the lower house of Congress to the opposition PRI party. The results cast some uncertainty over the Calderon administration’s ability to achieve its economic reform agenda.
In Brazil, data releases suggest that activity likely recovered in the second quarter, supported in part by the fiscal stimulus. Brazil also benefited from strong Asian growth, which lifted exports of primary commodities. Retail sales edged up over the April-May period and appear to have been strong in June, boosted by tax holidays for autos and
IV-45
Brazilian Economic Indicators(Percent change from previous period, seasonally adjusted, except as noted)
1. Gross domestic product. Annual rate. Annual data are Q4/Q4. 2. Percent. 3. Non-seasonally adjusted percent change from year-earlier period, except annual data, which are Dec./Dec. Price index is IPCA. 4. Billions of U.S. dollars, annual rate. 5. Billions of U.S. dollars, not seasonally adjusted, annual rate. n.a. Not available. ... Not applicable. Source: Haver Analytics; IMF International Financial Statistics database; Intituto Brasileiro de Geografia e Estatistica.
Indicator
appliances as well as by solid credit growth to households. Industrial production rebounded in the second quarter, but remained well below its peak of last fall. Anecdotal reports suggest that inventories have been winding down.
Inflationary pressures continued to abate, with 12-month consumer price inflation falling below 5 percent in June for the first time since 2007. At its mid-July meeting, the central bank of Brazil cut its target for the policy rate 50 basis points to a record low of 8¾ percent. The accompanying statement was widely interpreted as signaling no additional cuts this year. The government’s development bank, the only domestic source of long-term lending, also reduced its loan rates. Net capital inflows continued, prompting the central bank to intervene in the foreign exchange market to mitigate upward pressures on the real.
IV-46
Latin America
70
80
90
100
110
120
130
140
150
160
2003 2004 2005 2006 2007 2008 2009Source: Fundacion de Investigaciones Economicas Latinoamericanas; Haver Analytics.
BrazilMexico
Industrial ProductionJan. 2000 = 100
0
5
10
15
20
2003 2004 2005 2006 2007 2008 2009Source: IMF International Financial Statistics; Getulio Vargas Foundation;, Haver Analytics; Bank of Mexico.
Consumer PricesPercent change from year earlier
-3
-2
-1
0
1
2
3
4
5
2003 2004 2005 2006 2007 2008 2009Source: IMF International Financial Statistics, Bank of Mexico.
2003 2004 2005 2006 2007 2008 2009Source: Haver Analytics; Bank for International Settlements.
Gross External DebtPercent of Gross Domestic Product
0
10
20
30
40
50
60
70
80
90
2003 2004 2005 2006 2007 2008 2009Source: Bank for International Settlements.
Short-Term External DebtPercent of reserves
IV-47
In Russia, first-quarter real GDP contracted at an unprecedented 30 percent annual rate. The decline was broad based, with sizable contractions in private consumption, investment, and exports. Indicators suggest that real GDP was flat in the second quarter. Although industrial production contracted and retail sales remained weak, activity in the construction and agriculture sectors was strong. Also, exports in April and May rose following several months of declines. Twelve-month consumer price inflation has moderated over the past few months, with the June reading falling below 12 percent for the first time since January of last year. Amid the declines in inflation and weak economic activity, the central bank cut its policy rate 50 basis points in early July to 11 percent, bringing the cumulative rate reduction for the past four months to 200 basis points. The central bank has been intervening in the foreign exchange market to stem ruble appreciation, resulting in a renewed accumulation of foreign exchange reserves, which have risen $30 billion since March to about $410 billion by the end of June.
In emerging Europe, economic activity continued to fall in the three Baltic economies of Estonia, Lithuania, and Latvia in the second quarter following substantial double-digit real GDP contractions in the first. Lithuania's real GDP plunged at an annual rate of 34 percent in the second quarter, and the available indicators for Estonia and Latvia also point to further contractions. In late July the IMF and Latvia agreed on a set of policy actions that will put the country's IMF program back on track and free up a second tranche of IMF funding of about €200 million. In exchange for the aid, Latvia will undertake additional budget tightening throughout 2012. Lithuania indicated that it could seek IMF assistance to help finance its budget deficit. Elsewhere in emerging Europe, economic activity also remained depressed in the second quarter, but to a substantially lesser degree than in the first.
Last page of International Developments
Abbreviations–Part 2
Abbreviations—Part 2
V-1
ABCP asset-backed commercial paper
ABS asset-backed securities
AMLF Asset-Backed Commercial Paper Money Market Mutual Fund Liquidity
Facility
ARM adjustable-rate mortgage
ARRA American Recovery and Reinvestment Act of 2009
ASEAN-4 Association of Southeast Asian Nations (Indonesia, Malaysia,
the Philippines, and Thailand)
BEA Bureau of Economic Analysis, Department of Commerce
BLS Bureau of Labor Statistics, Department of Labor
BOC Bank of Canada
BOE Bank of England
BOJ Bank of Japan
CARS Consumer Assistance to Recycle and Save
CDS credit default swap
C&I commercial and industrial
CMBS commercial mortgage-backed securities
CPFF Commercial Paper Funding Facility
CPI consumer price index
CPIP construction put in place
CRB Commodity Research Bureau
CRE commercial real estate
DPI disposable personal income
DRAM dynamic random-access memory
ECB European Central Bank
ECI employment cost index
EME emerging market economy
EONIA euro overnight index average
E&S equipment and software
V-2
EUC emergency unemployment compensation
FDIC Federal Deposit Insurance Corporation
FOG flow of goods
FOMC Federal Open Market Committee; also, the Committee
FRBNY Federal Reserve Bank of New York
FX foreign exchange
GDI gross domestic income
GDP gross domestic product
GM General Motors
GNP gross national product
GSE government-sponsored enterprise
ICSC International Council of Shopping Centers
IP industrial production
ISM Institute for Supply Management
Libor London interbank offered rate
LSAP large-scale asset purchase
MBS mortgage-backed securities
MMIF Money Market Investor Funding Facility
MPC Monetary Policy Committee
mpg miles per gallon
NABE National Association of Business Economists
NFIB National Federation of Independent Business
NIEs newly industrialized economies (Hong Kong, South Korea, Singapore,
and Taiwan)
NIPA national income and product accounts
OIS overnight index swap
OPEC Organization of the Petroleum Exporting Countries
PAN National Action Party
PC personal computer
P&C Productivity and Costs
V-3
PCE personal consumption expenditures
PDCF Primary Dealer Credit Facility
PMI purchasing managers index
PPI producer price index
PRI Institutional Revolutionary Party
SCAP Supervisory Capital Assessment Program
SLOOS Senior Loan Officer Opinion Survey on Bank Lending Practices