Page 1
Sector Thematic
Food & Grocery
From a disruptor’s lens
The view from a disruptor’s lens is a salivating one as short of a few well-
capitalised operators, the organised Food & Grocery ecosystem remains (1)
profitless, (2) cash-strapped and (3) supported by increasing crutches (high gross
margins, inefficient cost structures and increasing vendor support). Our read-
through across the ecosystem suggests (1) the phase of capital dumping by
global/domestic biggies may soon be upon us, (2) selection/pricing arbitrage vis-
a-vis industry bellwether DMART continues to shrink, (3) margin cracks are
imminent and (4) Reliance Retail-FRL combination could change the complexion
of competition in top Indian districts.
Jay Gandhi Retail, Paints
[email protected]
+91-22-6171-7320
Page 2
09 February 2021 Sector Thematic
Food & Grocery
HSIE Research is also available on Bloomberg ERH HDF <GO> & Thomson Reuters
From a disruptor’s lens The view from a disruptor’s lens is a salivating one as short of a few well-
capitalised operators, the organised Food & Grocery ecosystem remains (1)
profitless, (2) cash-strapped and (3) supported by increasing crutches (high
gross margins, inefficient cost structures and increasing vendor support). Our
read-through across the ecosystem suggests (1) the phase of capital dumping
by global/domestic biggies may soon be upon us, (2) selection/pricing
arbitrage vis-a-vis industry bellwether DMART continues to shrink, (3)
margin cracks are imminent and (4) Reliance Retail-FRL combination could
change the complexion of competition in top Indian districts.
Capital dumping is likely to take center-stage: Global/domestic retailers
Amazon, Walmart-backed Flipkart and Reliance Retail (refer link) have
significantly strengthened their war chests for investments in supply chain,
fulfillment capabilities and pricing/selection. An inkling of this can already
be seen in the reducing selection/pricing arbitrage of DMART over these
biggies. Fulfillment/supply chain investments of Amazon’s F&G unit (adj.
for scale) is already >6x that of DMART’s (Comparison: DMART Ready vs
Amazon). Former remains aggressive on footprint expansion.
Margin crack for ecosystem is imminent: Over FY15-20, despite low
competitive intensity, most organised grocers’ sales velocity (1-4% CAGR)
has undershot inflation, signaling a gradual but structural footfall reduction.
Most (1) continue to hide behind high gross margins as cost of retailing
remains inefficient and (2) have bare-bone investments in online fulfilment
capabilities. Moreover, as subsidised home delivery becomes table stakes,
even the best (D-MART) may get arm-twisted into bringing a part of online
fulfillment costs on their books (not factored in, remains a risk to estimates).
Thus, the imperative to remain competitive (reducing GMs) + rising cost of
retailing is likely to crack operational margins for the ecosystem over FY21-
25. This has played out globally too (Walmart’s CY15-20 margin crack).
Reliance + Future Retail > DMART in store density: Post integration and, if
executed well, the Reliance Retail + FRL store network is likely to get nearly
as dense as DMART’s (Refer table) in the latter’s key markets (HSIE: 48% of
DMART’s stores, 65-70% of revenue). These markets are the most
populated/over-retailed districts in India with high PCI. Hence, the rise in
competitive intensity/price action and near-zero sourcing margin arbitrage
seems to be a foregone conclusion. The high population density in these
districts could help fulfill JioMART orders within controlled costs too.
Meanwhile, well-funded e-grocers are scaling up nicely: Even pre-
COVID19, e-grocers had been scaling up nicely. The concoction of (1) higher
AoVs and GMs (3) lower CACs and (4) better national brands representation
has changed the complexion of online grocers’ P&L during the pandemic.
Survivors don’t offer any margin of safety: While consolidation in F&G is
imminent, survivors (DMART) do not offer any margin of safety at 75x+
FY23 P/E. DMART’s growth is likely to be healthy (21/23/23%
revenue/EBITDA/PAT CAGR), largely underpinned by network expansion.
Alas, pressure on sales velocity and margins remains probabilistically high
as deep-pocketed operators enter DMART’s key catchments. We maintain
our SELL recommendation on DMART with a DCF-based TP: 2,160/sh –
implying 34x FY23 EV/EBITDA + 2x FY23 sales for e-comm. Note: we
currently have an SOTP-based fair value of Rs. 3,743bn for RRVL, implying
20x FY23 EV/EBITDA + 3x FY23 sales for its e-comm business.
Jay Gandhi
[email protected]
+91-22-6171-7320
Page 3
Page | 2
F&G: Sector Thematic
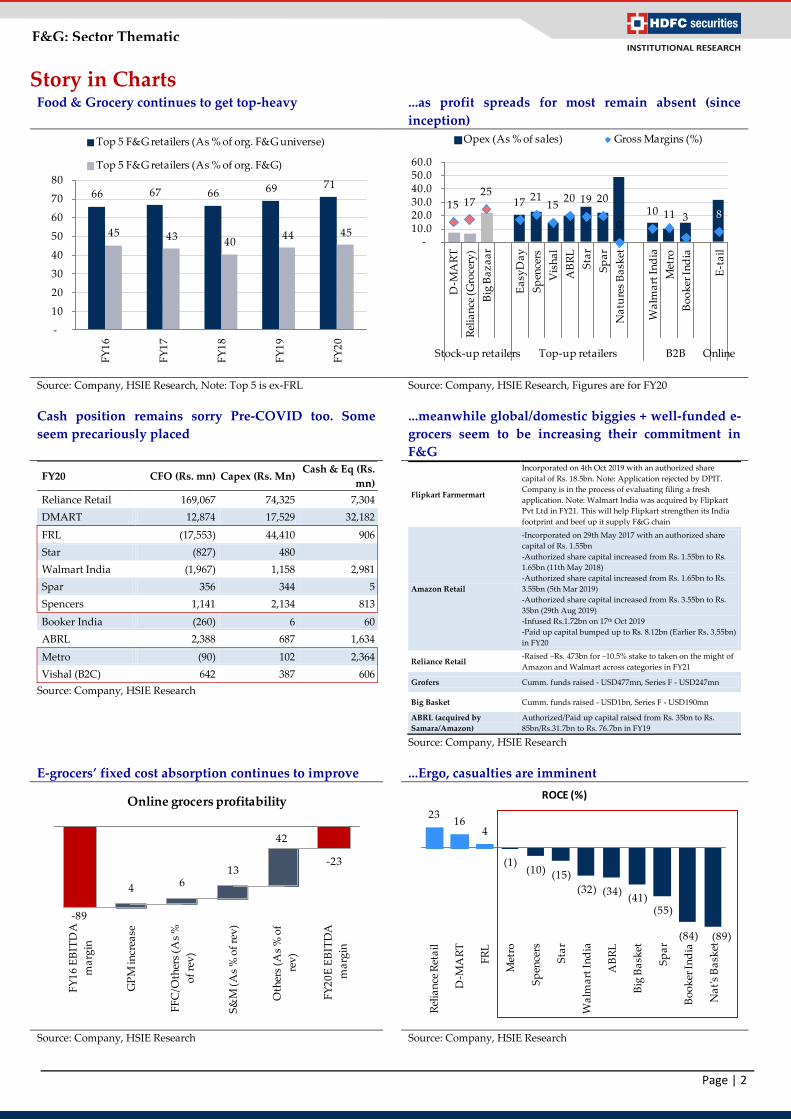
Story in Charts Food & Grocery continues to get top-heavy ...as profit spreads for most remain absent (since
inception)
Source: Company, HSIE Research, Note: Top 5 is ex-FRL Source: Company, HSIE Research, Figures are for FY20
Cash position remains sorry Pre-COVID too. Some
seem precariously placed
...meanwhile global/domestic biggies + well-funded e-
grocers seem to be increasing their commitment in
F&G
FY20 CFO (Rs. mn) Capex (Rs. Mn) Cash & Eq (Rs.
mn)
Reliance Retail 169,067 74,325 7,304
DMART 12,874 17,529 32,182
FRL (17,553) 44,410 906
Star (827) 480
Walmart India (1,967) 1,158 2,981
Spar 356 344 5
Spencers 1,141 2,134 813
Booker India (260) 6 60
ABRL 2,388 687 1,634
Metro (90) 102 2,364
Vishal (B2C) 642 387 606
Source: Company, HSIE Research
Flipkart Farmermart
Incorporated on 4th Oct 2019 with an authorized share
capital of Rs. 18.5bn. Note: Application rejected by DPIT.
Company is in the process of evaluating filing a fresh
application. Note: Walmart India was acquired by Flipkart
Pvt Ltd in FY21. This will help Flipkart strengthen its India
footprint and beef up it supply F&G chain
Amazon Retail
-Incorporated on 29th May 2017 with an authorized share
capital of Rs. 1.55bn
-Authorized share capital increased from Rs. 1.55bn to Rs.
1.65bn (11th May 2018)
-Authorized share capital increased from Rs. 1.65bn to Rs.
3.55bn (5th Mar 2019)
-Authorized share capital increased from Rs. 3.55bn to Rs.
35bn (29th Aug 2019)
-Infused Rs.1.72bn on 17th Oct 2019
-Paid up capital bumped up to Rs. 8.12bn (Earlier Rs. 3.55bn)
in FY20
Reliance Retail -Raised ~Rs. 473bn for ~10.5% stake to taken on the might of
Amazon and Walmart across categories in FY21
Grofers Cumm. funds raised - USD477mn, Series F - USD247mn
Big Basket Cumm. funds raised - USD1bn, Series F - USD190mn
ABRL (acquired by
Samara/Amazon)
Authorized/Paid up capital raised from Rs. 35bn to Rs.
85bn/Rs.31.7bn to Rs. 76.7bn in FY19
Source: Company, HSIE Research
E-grocers’ fixed cost absorption continues to improve
...Ergo, casualties are imminent
Source: Company, HSIE Research Source: Company, HSIE Research
66 67 66 69 71
45 43 40 44 45
-
10
20
30
40
50
60
70
80
FY
16
FY
17
FY
18
FY
19
FY
20
Top 5 F&G retailers (As % of org. F&G universe)
Top 5 F&G retailers (As % of org. F&G)
15 1725
17 2115
20 19 20
010 11 3 8
-10.0 20.0 30.0 40.0 50.0 60.0
D-M
AR
T
Rel
ian
ce (
Gro
cery
)
Big
Ba
za
ar
Ea
syD
ay
Sp
ence
rs
Vis
ha
l
AB
RL
Sta
r
Sp
ar
Na
ture
s B
ask
et
Wa
lma
rt I
nd
ia
Met
ro
Bo
ok
er I
nd
ia
E-t
ail
Stock-up retailers Top-up retailers B2B Online
Opex (As % of sales) Gross Margins (%)
-89
-23
4 6
13
42
FY
16
EB
ITD
A
ma
rgin
GP
M in
crea
se
FF
C/O
ther
s (A
s %
of
rev
)
S&
M (
As
% o
f re
v)
Oth
ers
(As
% o
f
rev
)
FY
20
E E
BIT
DA
ma
rgin
Online grocers profitability23
16 4
(1)(10) (15)
(32) (34)(41)
(55)
(84) (89)
Rel
ian
ce R
eta
il
D-M
AR
T
FR
L
Met
ro
Sp
ence
rs
Sta
r
Wa
lma
rt I
nd
ia
AB
RL
Big
Ba
sket
Sp
ar
Bo
ok
er I
nd
ia
Na
t's
Ba
sket
ROCE (%)
Page 4
Page | 3
F&G: Sector Thematic
Contents
Capital dumping to take centerstage .................................................................................4
Margin crack for the ecosystem is imminent ..............................................................4
Increasing cost of retailing and margin crack is a global trend ................................5
Case Study: Globally, even the best got bruised! .......................................................7
Could this happen to DMART? ....................................................................................8
DMART Ready vs Amazon India’s F&G performance .............................................8
Reliance Retail + Future Group > DMART in store density: ........................................9
District-wise store map across per capita income and population density ..........10
Market share gain in top districts unlikely for DMART ......................................... 10
D-MART’s pricing/assortment arbitrage over peers continues to shrink ............... 11
Well funded e-grocers scaling up nicely ........................................................................ 14
Case Study: Grofers ...................................................................................................... 15
The heat is being felt by offline grocers already ...................................................... 16
Comparative Analysis ........................................................................................................17
Page 5
Page | 4
F&G: Sector Thematic
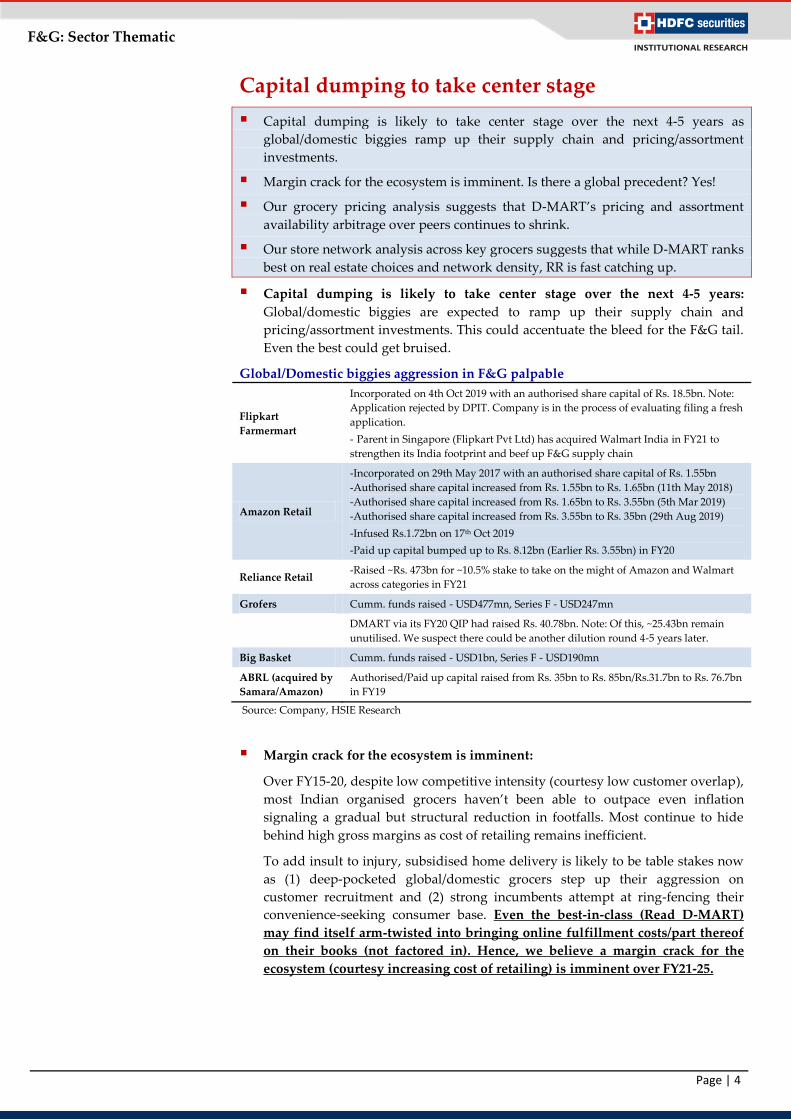
Capital dumping to take center stage
Capital dumping is likely to take center stage over the next 4-5 years as
global/domestic biggies ramp up their supply chain and pricing/assortment
investments.
Margin crack for the ecosystem is imminent. Is there a global precedent? Yes!
Our grocery pricing analysis suggests that D-MART’s pricing and assortment
availability arbitrage over peers continues to shrink.
Our store network analysis across key grocers suggests that while D-MART ranks
best on real estate choices and network density, RR is fast catching up.
Capital dumping is likely to take center stage over the next 4-5 years:
Global/domestic biggies are expected to ramp up their supply chain and
pricing/assortment investments. This could accentuate the bleed for the F&G tail.
Even the best could get bruised.
Global/Domestic biggies aggression in F&G palpable
Flipkart
Farmermart
Incorporated on 4th Oct 2019 with an authorised share capital of Rs. 18.5bn. Note:
Application rejected by DPIT. Company is in the process of evaluating filing a fresh
application.
- Parent in Singapore (Flipkart Pvt Ltd) has acquired Walmart India in FY21 to
strengthen its India footprint and beef up F&G supply chain
Amazon Retail
-Incorporated on 29th May 2017 with an authorised share capital of Rs. 1.55bn
-Authorised share capital increased from Rs. 1.55bn to Rs. 1.65bn (11th May 2018)
-Authorised share capital increased from Rs. 1.65bn to Rs. 3.55bn (5th Mar 2019)
-Authorised share capital increased from Rs. 3.55bn to Rs. 35bn (29th Aug 2019)
-Infused Rs.1.72bn on 17th Oct 2019
-Paid up capital bumped up to Rs. 8.12bn (Earlier Rs. 3.55bn) in FY20
Reliance Retail -Raised ~Rs. 473bn for ~10.5% stake to take on the might of Amazon and Walmart
across categories in FY21
Grofers Cumm. funds raised - USD477mn, Series F - USD247mn
DMART via its FY20 QIP had raised Rs. 40.78bn. Note: Of this, ~25.43bn remain
unutilised. We suspect there could be another dilution round 4-5 years later.
Big Basket Cumm. funds raised - USD1bn, Series F - USD190mn
ABRL (acquired by
Samara/Amazon)
Authorised/Paid up capital raised from Rs. 35bn to Rs. 85bn/Rs.31.7bn to Rs. 76.7bn
in FY19
Source: Company, HSIE Research
Margin crack for the ecosystem is imminent:
Over FY15-20, despite low competitive intensity (courtesy low customer overlap),
most Indian organised grocers haven’t been able to outpace even inflation
signaling a gradual but structural reduction in footfalls. Most continue to hide
behind high gross margins as cost of retailing remains inefficient.
To add insult to injury, subsidised home delivery is likely to be table stakes now
as (1) deep-pocketed global/domestic grocers step up their aggression on
customer recruitment and (2) strong incumbents attempt at ring-fencing their
convenience-seeking consumer base. Even the best-in-class (Read D-MART)
may find itself arm-twisted into bringing online fulfillment costs/part thereof
on their books (not factored in). Hence, we believe a margin crack for the
ecosystem (courtesy increasing cost of retailing) is imminent over FY21-25.
Page 6
Page | 5
F&G: Sector Thematic
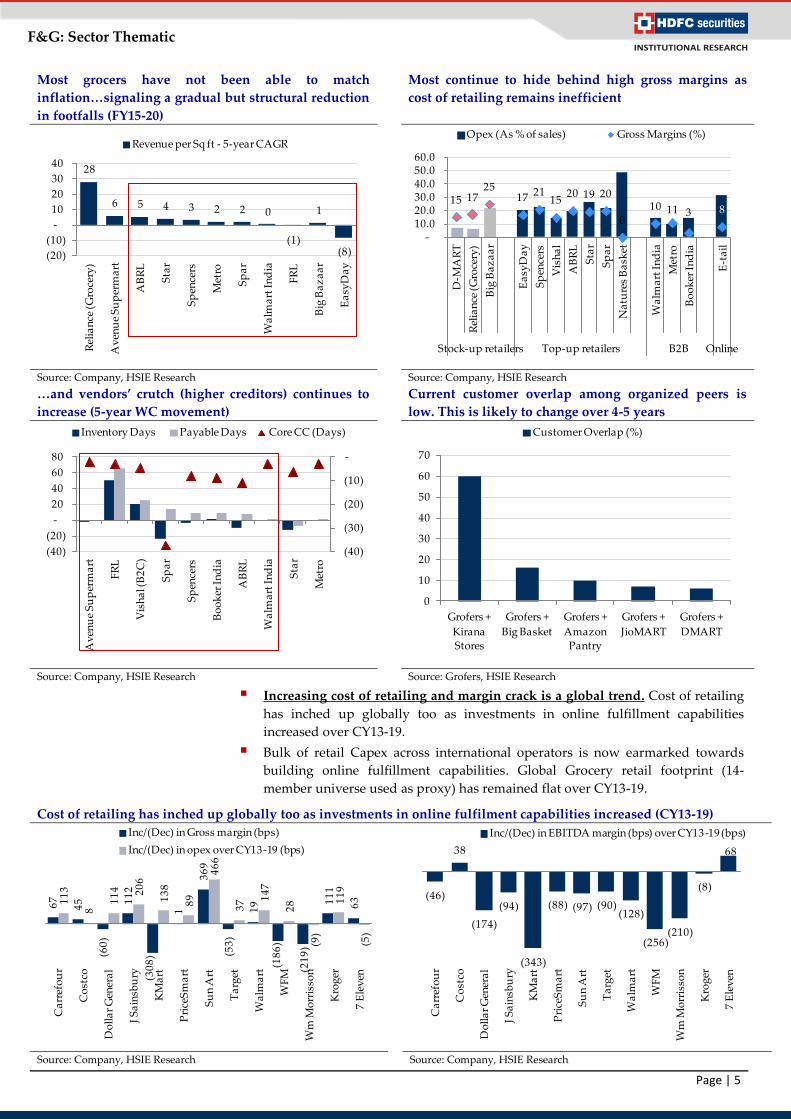
Most grocers have not been able to match
inflation…signaling a gradual but structural reduction
in footfalls (FY15-20)
Most continue to hide behind high gross margins as
cost of retailing remains inefficient
Source: Company, HSIE Research Source: Company, HSIE Research
…and vendors’ crutch (higher creditors) continues to
increase (5-year WC movement)
Current customer overlap among organized peers is
low. This is likely to change over 4-5 years
Source: Company, HSIE Research Source: Grofers, HSIE Research
Increasing cost of retailing and margin crack is a global trend. Cost of retailing
has inched up globally too as investments in online fulfillment capabilities
increased over CY13-19.
Bulk of retail Capex across international operators is now earmarked towards
building online fulfillment capabilities. Global Grocery retail footprint (14-
member universe used as proxy) has remained flat over CY13-19.
Cost of retailing has inched up globally too as investments in online fulfilment capabilities increased (CY13-19)
Source: Company, HSIE Research Source: Company, HSIE Research
28
6 5 4 3 2 2 0
(1)
1
(8)(20)
(10)
-
10
20
30
40
Rel
ian
ce (
Gro
cery
)
Av
enu
e S
up
erm
art
AB
RL
Sta
r
Sp
ence
rs
Met
ro
Sp
ar
Wa
lma
rt I
nd
ia
FR
L
Big
Ba
za
ar
Ea
syD
ay
Revenue per Sq ft - 5-year CAGR
15 1725
17 2115
20 19 20
010 11 3 8
-10.0 20.0 30.0 40.0 50.0 60.0
D-M
AR
T
Rel
ian
ce (
Gro
cery
)
Big
Ba
za
ar
Ea
syD
ay
Sp
ence
rs
Vis
ha
l
AB
RL
Sta
r
Sp
ar
Na
ture
s B
ask
et
Wa
lma
rt I
nd
ia
Met
ro
Bo
ok
er I
nd
ia
E-t
ail
Stock-up retailers Top-up retailers B2B Online
Opex (As % of sales) Gross Margins (%)
(40)
(30)
(20)
(10)
-
(40)
(20)
-
20
40
60
80
Av
enu
e S
up
erm
art
FR
L
Vis
ha
l (B
2C
)
Sp
ar
Sp
ence
rs
Bo
ok
er I
nd
ia
AB
RL
Wa
lma
rt I
nd
ia
Sta
r
Met
ro
Inventory Days Payable Days Core CC (Days)
0
10
20
30
40
50
60
70
Grofers +
Kirana
Stores
Grofers +
Big Basket
Grofers +
Amazon
Pantry
Grofers +
JioMART
Grofers +
DMART
Customer Overlap (%)
67
45
(60
)
11
2
(30
8)
1
36
9
(53
)
19
(18
6)
(21
9)
11
1
63
11
3
8 1
14
20
6
13
8
89
46
6
37
14
7
28
(9)
11
9
(5)
Ca
rref
ou
r
Co
stco
Do
lla
r G
ener
al
J S
ain
sbu
ry
KM
art
Pri
ceS
ma
rt
Su
n A
rt
Ta
rget
Wa
lma
rt
WF
M
Wm
Mo
rris
son
Kro
ger
7 E
lev
en
Inc/(Dec) in Gross margin (bps)
Inc/(Dec) in opex over CY13-19 (bps)
(46)
38
(174)
(94)
(343)
(88) (97) (90)(128)
(256)(210)
(8)
68
Ca
rref
ou
r
Co
stco
Do
lla
r G
ener
al
J S
ain
sbu
ry
KM
art
Pri
ceS
ma
rt
Su
n A
rt
Ta
rget
Wa
lma
rt
WF
M
Wm
Mo
rris
son
Kro
ger
7 E
lev
en
Inc/(Dec) in EBITDA margin (bps) over CY13-19 (bps)
Page 7
Page | 6
F&G: Sector Thematic
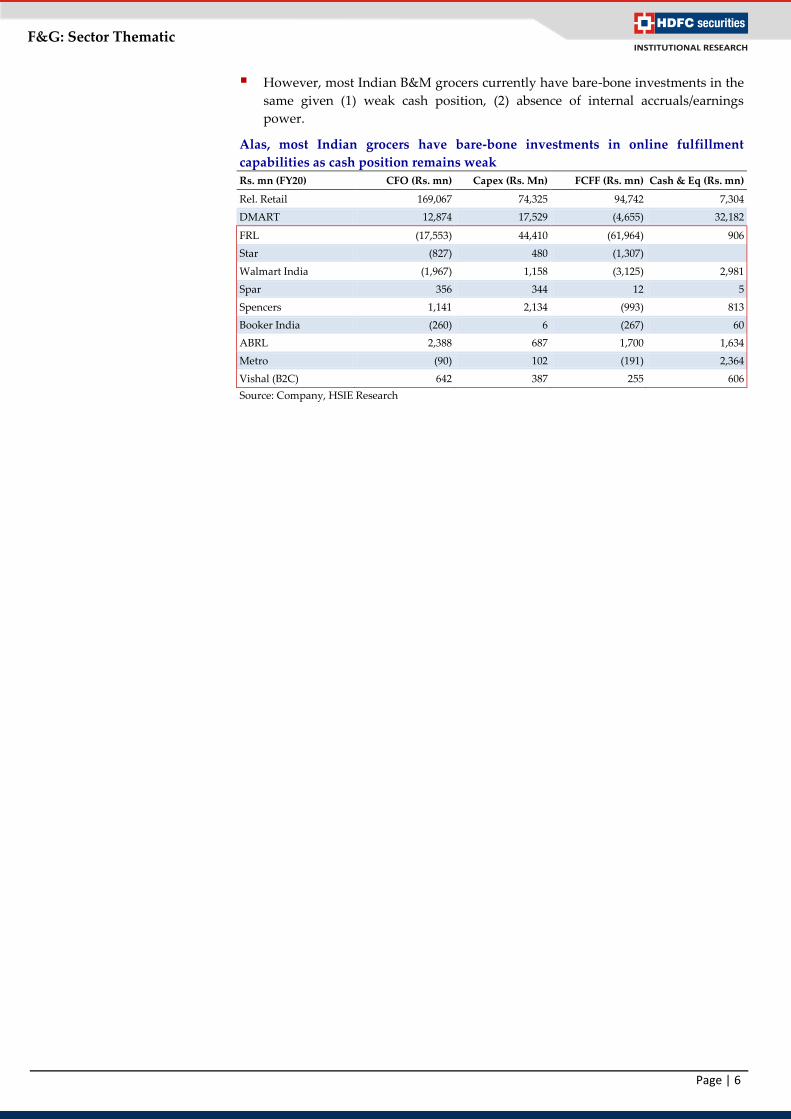
However, most Indian B&M grocers currently have bare-bone investments in the
same given (1) weak cash position, (2) absence of internal accruals/earnings
power.
Alas, most Indian grocers have bare-bone investments in online fulfillment
capabilities as cash position remains weak
Rs. mn (FY20) CFO (Rs. mn) Capex (Rs. Mn) FCFF (Rs. mn) Cash & Eq (Rs. mn)
Rel. Retail 169,067 74,325 94,742 7,304
DMART 12,874 17,529 (4,655) 32,182
FRL (17,553) 44,410 (61,964) 906
Star (827) 480 (1,307)
Walmart India (1,967) 1,158 (3,125) 2,981
Spar 356 344 12 5
Spencers 1,141 2,134 (993) 813
Booker India (260) 6 (267) 60
ABRL 2,388 687 1,700 1,634
Metro (90) 102 (191) 2,364
Vishal (B2C) 642 387 255 606
Source: Company, HSIE Research
Page 8
Page | 7
F&G: Sector Thematic
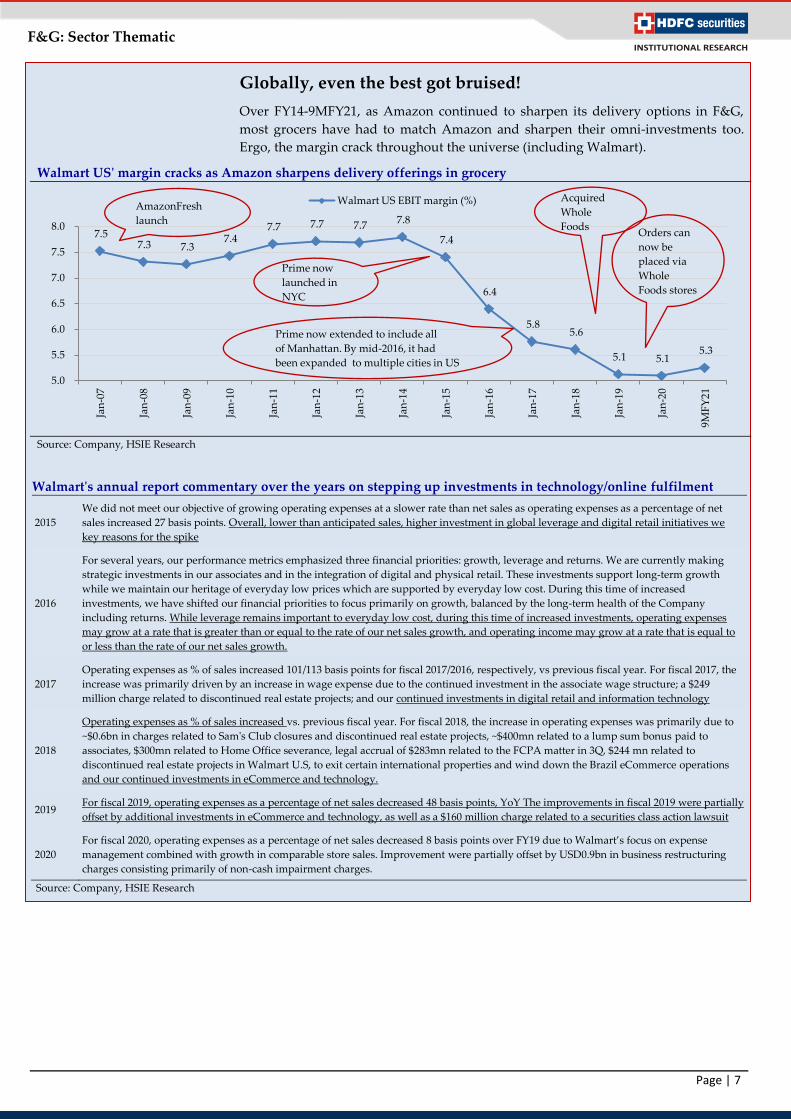
Globally, even the best got bruised!
Over FY14-9MFY21, as Amazon continued to sharpen its delivery options in F&G,
most grocers have had to match Amazon and sharpen their omni-investments too.
Ergo, the margin crack throughout the universe (including Walmart).
Walmart US' margin cracks as Amazon sharpens delivery offerings in grocery
Source: Company, HSIE Research
Walmart's annual report commentary over the years on stepping up investments in technology/online fulfilment
2015
We did not meet our objective of growing operating expenses at a slower rate than net sales as operating expenses as a percentage of net
sales increased 27 basis points. Overall, lower than anticipated sales, higher investment in global leverage and digital retail initiatives we
key reasons for the spike
2016
For several years, our performance metrics emphasized three financial priorities: growth, leverage and returns. We are currently making
strategic investments in our associates and in the integration of digital and physical retail. These investments support long-term growth
while we maintain our heritage of everyday low prices which are supported by everyday low cost. During this time of increased
investments, we have shifted our financial priorities to focus primarily on growth, balanced by the long-term health of the Company
including returns. While leverage remains important to everyday low cost, during this time of increased investments, operating expenses
may grow at a rate that is greater than or equal to the rate of our net sales growth, and operating income may grow at a rate that is equal to
or less than the rate of our net sales growth.
2017
Operating expenses as % of sales increased 101/113 basis points for fiscal 2017/2016, respectively, vs previous fiscal year. For fiscal 2017, the
increase was primarily driven by an increase in wage expense due to the continued investment in the associate wage structure; a $249
million charge related to discontinued real estate projects; and our continued investments in digital retail and information technology
2018
Operating expenses as % of sales increased vs. previous fiscal year. For fiscal 2018, the increase in operating expenses was primarily due to
~$0.6bn in charges related to Sam's Club closures and discontinued real estate projects, ~$400mn related to a lump sum bonus paid to
associates, $300mn related to Home Office severance, legal accrual of $283mn related to the FCPA matter in 3Q, $244 mn related to
discontinued real estate projects in Walmart U.S, to exit certain international properties and wind down the Brazil eCommerce operations
and our continued investments in eCommerce and technology.
2019 For fiscal 2019, operating expenses as a percentage of net sales decreased 48 basis points, YoY The improvements in fiscal 2019 were partially
offset by additional investments in eCommerce and technology, as well as a $160 million charge related to a securities class action lawsuit
2020
For fiscal 2020, operating expenses as a percentage of net sales decreased 8 basis points over FY19 due to Walmart’s focus on expense
management combined with growth in comparable store sales. Improvement were partially offset by USD0.9bn in business restructuring
charges consisting primarily of non-cash impairment charges.
Source: Company, HSIE Research
7.5 7.3 7.3
7.4 7.7 7.7 7.7
7.8
7.4
6.4
5.8 5.6
5.1 5.1 5.3
5.0
5.5
6.0
6.5
7.0
7.5
8.0
Jan
-07
Jan
-08
Jan
-09
Jan
-10
Jan
-11
Jan
-12
Jan
-13
Jan
-14
Jan
-15
Jan
-16
Jan
-17
Jan
-18
Jan
-19
Jan
-20
9MF
Y21
Walmart US EBIT margin (%)
Prime now
launched in
NYC
Prime now extended to include all
of Manhattan. By mid-2016, it had
been expanded to multiple cities in US
Acquired
Whole
Foods Orders can
now be
placed via
Whole
Foods stores
AmazonFresh
launch
Page 9
Page | 8
F&G: Sector Thematic
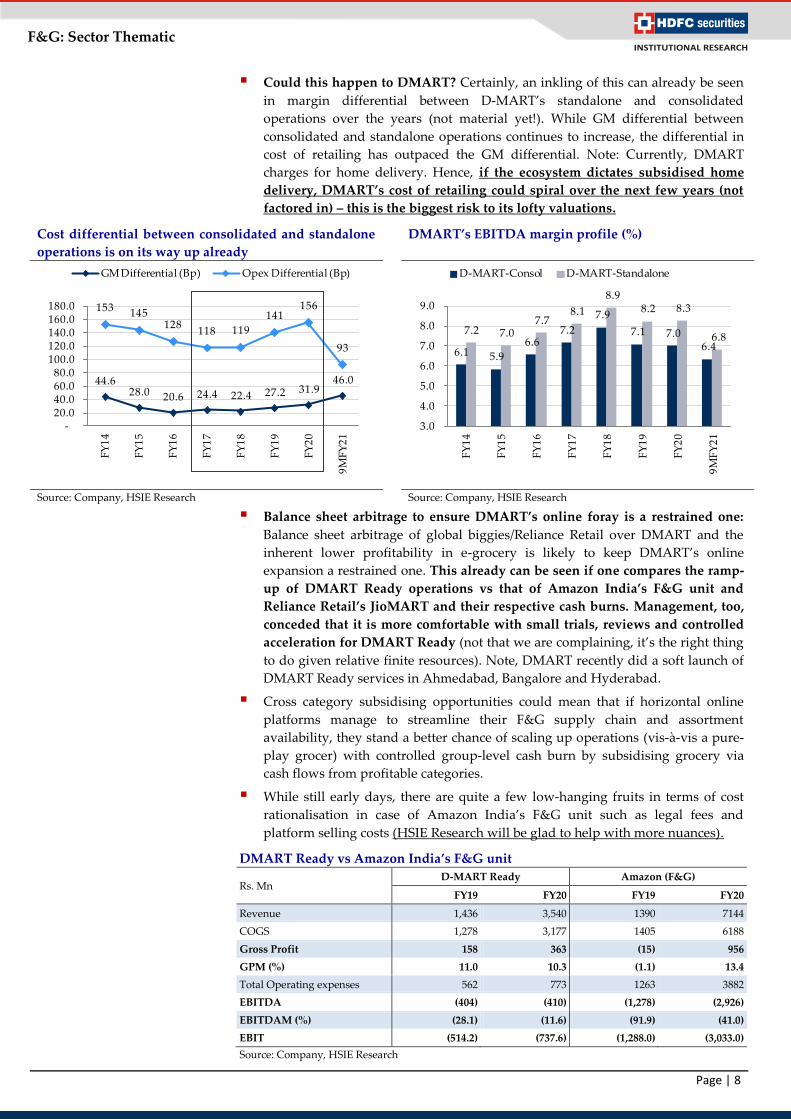
Could this happen to DMART? Certainly, an inkling of this can already be seen
in margin differential between D-MART’s standalone and consolidated
operations over the years (not material yet!). While GM differential between
consolidated and standalone operations continues to increase, the differential in
cost of retailing has outpaced the GM differential. Note: Currently, DMART
charges for home delivery. Hence, if the ecosystem dictates subsidised home
delivery, DMART’s cost of retailing could spiral over the next few years (not
factored in) – this is the biggest risk to its lofty valuations.
Cost differential between consolidated and standalone
operations is on its way up already
DMART’s EBITDA margin profile (%)
Source: Company, HSIE Research Source: Company, HSIE Research
Balance sheet arbitrage to ensure DMART’s online foray is a restrained one:
Balance sheet arbitrage of global biggies/Reliance Retail over DMART and the
inherent lower profitability in e-grocery is likely to keep DMART’s online
expansion a restrained one. This already can be seen if one compares the ramp-
up of DMART Ready operations vs that of Amazon India’s F&G unit and
Reliance Retail’s JioMART and their respective cash burns. Management, too,
conceded that it is more comfortable with small trials, reviews and controlled
acceleration for DMART Ready (not that we are complaining, it’s the right thing
to do given relative finite resources). Note, DMART recently did a soft launch of
DMART Ready services in Ahmedabad, Bangalore and Hyderabad.
Cross category subsidising opportunities could mean that if horizontal online
platforms manage to streamline their F&G supply chain and assortment
availability, they stand a better chance of scaling up operations (vis-à-vis a pure-
play grocer) with controlled group-level cash burn by subsidising grocery via
cash flows from profitable categories.
While still early days, there are quite a few low-hanging fruits in terms of cost
rationalisation in case of Amazon India’s F&G unit such as legal fees and
platform selling costs (HSIE Research will be glad to help with more nuances).
DMART Ready vs Amazon India’s F&G unit
Rs. Mn D-MART Ready Amazon (F&G)
FY19 FY20 FY19 FY20
Revenue 1,436 3,540 1390 7144
COGS 1,278 3,177 1405 6188
Gross Profit 158 363 (15) 956
GPM (%) 11.0 10.3 (1.1) 13.4
Total Operating expenses 562 773 1263 3882
EBITDA (404) (410) (1,278) (2,926)
EBITDAM (%) (28.1) (11.6) (91.9) (41.0)
EBIT (514.2) (737.6) (1,288.0) (3,033.0)
Source: Company, HSIE Research
44.6 28.0 20.6 24.4 22.4 27.2 31.9
46.0
153 145 128
118 119
141 156
93
-20.0 40.0 60.0 80.0
100.0 120.0 140.0 160.0 180.0
FY
14
FY
15
FY
16
FY
17
FY
18
FY
19
FY
20
9M
FY
21
GM Differential (Bp) Opex Differential (Bp)
6.1 5.9
6.6 7.2
7.9
7.1 7.0 6.4
7.2 7.0 7.7
8.1
8.9 8.2 8.3
6.8
3.0
4.0
5.0
6.0
7.0
8.0
9.0
FY
14
FY
15
FY
16
FY
17
FY
18
FY
19
FY
20
9M
FY
21
D-MART-Consol D-MART-Standalone
Page 10
Page | 9
F&G: Sector Thematic
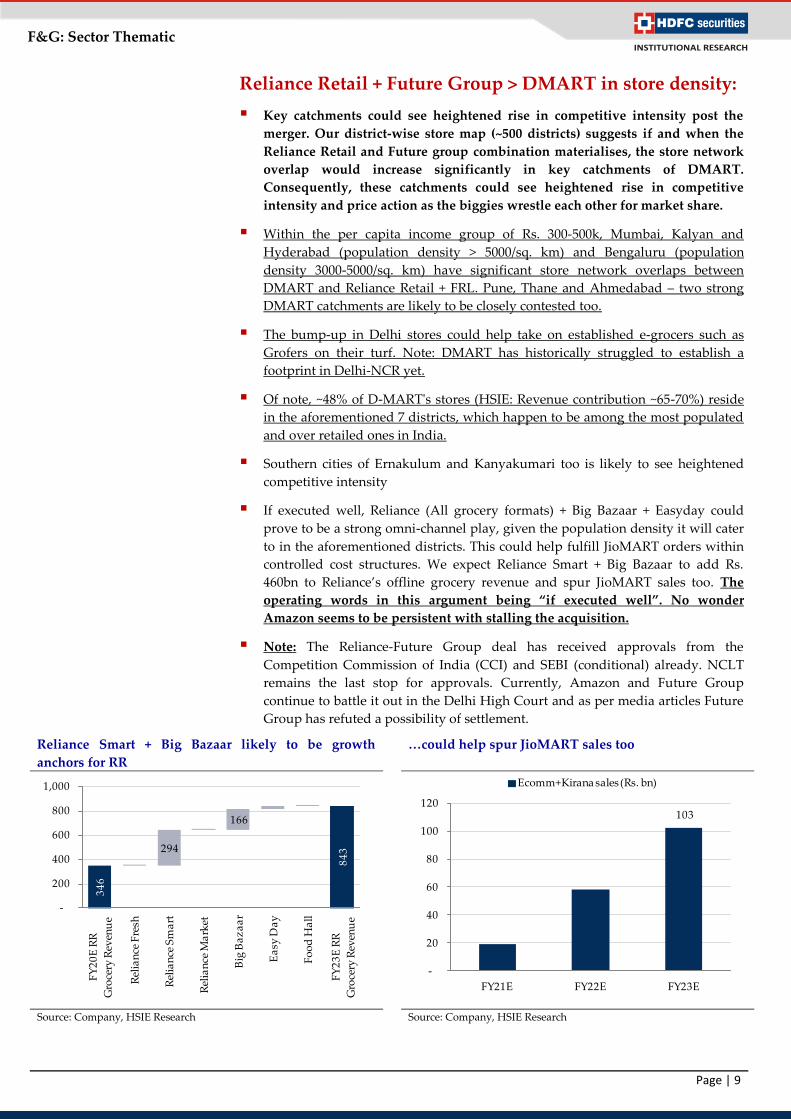
Reliance Retail + Future Group > DMART in store density:
Key catchments could see heightened rise in competitive intensity post the
merger. Our district-wise store map (~500 districts) suggests if and when the
Reliance Retail and Future group combination materialises, the store network
overlap would increase significantly in key catchments of DMART.
Consequently, these catchments could see heightened rise in competitive
intensity and price action as the biggies wrestle each other for market share.
Within the per capita income group of Rs. 300-500k, Mumbai, Kalyan and
Hyderabad (population density > 5000/sq. km) and Bengaluru (population
density 3000-5000/sq. km) have significant store network overlaps between
DMART and Reliance Retail + FRL. Pune, Thane and Ahmedabad – two strong
DMART catchments are likely to be closely contested too.
The bump-up in Delhi stores could help take on established e-grocers such as
Grofers on their turf. Note: DMART has historically struggled to establish a
footprint in Delhi-NCR yet.
Of note, ~48% of D-MART's stores (HSIE: Revenue contribution ~65-70%) reside
in the aforementioned 7 districts, which happen to be among the most populated
and over retailed ones in India.
Southern cities of Ernakulum and Kanyakumari too is likely to see heightened
competitive intensity
If executed well, Reliance (All grocery formats) + Big Bazaar + Easyday could
prove to be a strong omni-channel play, given the population density it will cater
to in the aforementioned districts. This could help fulfill JioMART orders within
controlled cost structures. We expect Reliance Smart + Big Bazaar to add Rs.
460bn to Reliance’s offline grocery revenue and spur JioMART sales too. The
operating words in this argument being “if executed well”. No wonder
Amazon seems to be persistent with stalling the acquisition.
Note: The Reliance-Future Group deal has received approvals from the
Competition Commission of India (CCI) and SEBI (conditional) already. NCLT
remains the last stop for approvals. Currently, Amazon and Future Group
continue to battle it out in the Delhi High Court and as per media articles Future
Group has refuted a possibility of settlement.
Reliance Smart + Big Bazaar likely to be growth
anchors for RR
…could help spur JioMART sales too
Source: Company, HSIE Research Source: Company, HSIE Research
34
6
84
3 294
166
-
200
400
600
800
1,000
FY
20
E R
R
Gro
cery
Rev
enu
e
Rel
ian
ce F
resh
Rel
ian
ce S
ma
rt
Rel
ian
ce M
ark
et
Big
Ba
za
ar
Ea
sy D
ay
Fo
od
Ha
ll
FY
23
E R
R
Gro
cery
Rev
enu
e
103
-
20
40
60
80
100
120
FY21E FY22E FY23E
Ecomm+Kirana sales (Rs. bn)
Page 11
Page | 10
F&G: Sector Thematic
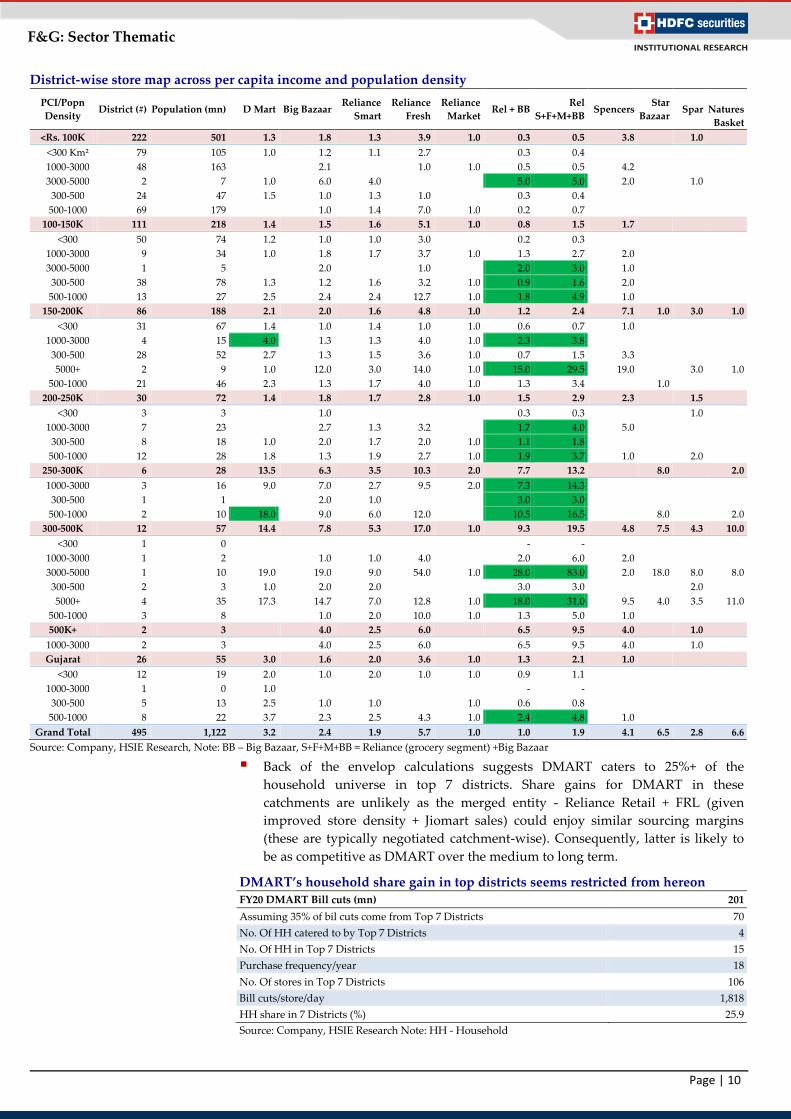
District-wise store map across per capita income and population density
PCI/Popn
Density District (#) Population (mn) D Mart Big Bazaar
Reliance
Smart
Reliance
Fresh
Reliance
Market Rel + BB
Rel
S+F+M+BB Spencers
Star
Bazaar Spar
Natures
Basket
<Rs. 100K 222 501 1.3 1.8 1.3 3.9 1.0 0.3 0.5 3.8
1.0
<300 Km² 79 105 1.0 1.2 1.1 2.7 #DIV/0! 0.3 0.4 #DIV/0! ###### ###### #DIV/0!
1000-3000 48 163 #DIV/0! 2.1 #DIV/0! 1.0 1.0 0.5 0.5 4.2 ###### ###### #DIV/0!
3000-5000 2 7 1.0 6.0 4.0 #DIV/0! #DIV/0! 5.0 5.0 2.0 ###### 1.0 #DIV/0!
300-500 24 47 1.5 1.0 1.3 1.0 #DIV/0! 0.3 0.4 #DIV/0! ###### ###### #DIV/0!
500-1000 69 179 #DIV/0! 1.0 1.4 7.0 1.0 0.2 0.7 #DIV/0! ###### ###### #DIV/0!
100-150K 111 218 1.4 1.5 1.6 5.1 1.0 0.8 1.5 1.7
<300 50 74 1.2 1.0 1.0 3.0 #DIV/0! 0.2 0.3 #DIV/0! ###### ###### #DIV/0!
1000-3000 9 34 1.0 1.8 1.7 3.7 1.0 1.3 2.7 2.0 ###### ###### #DIV/0!
3000-5000 1 5 #DIV/0! 2.0 #DIV/0! 1.0 #DIV/0! 2.0 3.0 1.0 ###### ###### #DIV/0!
300-500 38 78 1.3 1.2 1.6 3.2 1.0 0.9 1.6 2.0 ###### ###### #DIV/0!
500-1000 13 27 2.5 2.4 2.4 12.7 1.0 1.8 4.9 1.0 ###### ###### #DIV/0!
150-200K 86 188 2.1 2.0 1.6 4.8 1.0 1.2 2.4 7.1 1.0 3.0 1.0
<300 31 67 1.4 1.0 1.4 1.0 1.0 0.6 0.7 1.0 ###### ###### #DIV/0!
1000-3000 4 15 4.0 1.3 1.3 4.0 1.0 2.3 3.8 #DIV/0! ###### ###### #DIV/0!
300-500 28 52 2.7 1.3 1.5 3.6 1.0 0.7 1.5 3.3 ###### ###### #DIV/0!
5000+ 2 9 1.0 12.0 3.0 14.0 1.0 15.0 29.5 19.0 ###### 3.0 1.0
500-1000 21 46 2.3 1.3 1.7 4.0 1.0 1.3 3.4 #DIV/0! 1.0 ###### #DIV/0!
200-250K 30 72 1.4 1.8 1.7 2.8 1.0 1.5 2.9 2.3
1.5
<300 3 3 #DIV/0! 1.0 #DIV/0! #DIV/0! #DIV/0! 0.3 0.3 #DIV/0! ###### 1.0 #DIV/0!
1000-3000 7 23 #DIV/0! 2.7 1.3 3.2 #DIV/0! 1.7 4.0 5.0 ###### ###### #DIV/0!
300-500 8 18 1.0 2.0 1.7 2.0 1.0 1.1 1.8 #DIV/0! ###### ###### #DIV/0!
500-1000 12 28 1.8 1.3 1.9 2.7 1.0 1.9 3.7 1.0 ###### 2.0 #DIV/0!
250-300K 6 28 13.5 6.3 3.5 10.3 2.0 7.7 13.2
8.0
2.0
1000-3000 3 16 9.0 7.0 2.7 9.5 2.0 7.3 14.3 #DIV/0! ###### ###### #DIV/0!
300-500 1 1 #DIV/0! 2.0 1.0 #DIV/0! #DIV/0! 3.0 3.0 #DIV/0! ###### ###### #DIV/0!
500-1000 2 10 18.0 9.0 6.0 12.0 #DIV/0! 10.5 16.5 #DIV/0! 8.0 ###### 2.0
300-500K 12 57 14.4 7.8 5.3 17.0 1.0 9.3 19.5 4.8 7.5 4.3 10.0
<300 1 0 #DIV/0! #DIV/0! #DIV/0! #DIV/0! #DIV/0! - - #DIV/0! ###### ###### #DIV/0!
1000-3000 1 2 #DIV/0! 1.0 1.0 4.0 #DIV/0! 2.0 6.0 2.0 ###### ###### #DIV/0!
3000-5000 1 10 19.0 19.0 9.0 54.0 1.0 28.0 83.0 2.0 18.0 8.0 8.0
300-500 2 3 1.0 2.0 2.0 #DIV/0! #DIV/0! 3.0 3.0 #DIV/0! ###### 2.0 #DIV/0!
5000+ 4 35 17.3 14.7 7.0 12.8 1.0 18.0 31.0 9.5 4.0 3.5 11.0
500-1000 3 8 #DIV/0! 1.0 2.0 10.0 1.0 1.3 5.0 1.0 ###### ###### #DIV/0!
500K+ 2 3
4.0 2.5 6.0 6.5 9.5 4.0
1.0
1000-3000 2 3 #DIV/0! 4.0 2.5 6.0 #DIV/0! 6.5 9.5 4.0 ###### 1.0 #DIV/0!
Gujarat 26 55 3.0 1.6 2.0 3.6 1.0 1.3 2.1 1.0
<300 12 19 2.0 1.0 2.0 1.0 1.0 0.9 1.1 #DIV/0! ###### ###### #DIV/0!
1000-3000 1 0 1.0 #DIV/0! #DIV/0! #DIV/0! #DIV/0! - - #DIV/0! ###### ###### #DIV/0!
300-500 5 13 2.5 1.0 1.0 #DIV/0! 1.0 0.6 0.8 #DIV/0! ###### ###### #DIV/0!
500-1000 8 22 3.7 2.3 2.5 4.3 1.0 2.4 4.8 1.0 ###### ###### #DIV/0!
Grand Total 495 1,122 3.2 2.4 1.9 5.7 1.0 1.0 1.9 4.1 6.5 2.8 6.6
Source: Company, HSIE Research, Note: BB – Big Bazaar, S+F+M+BB = Reliance (grocery segment) +Big Bazaar
Back of the envelop calculations suggests DMART caters to 25%+ of the
household universe in top 7 districts. Share gains for DMART in these
catchments are unlikely as the merged entity - Reliance Retail + FRL (given
improved store density + Jiomart sales) could enjoy similar sourcing margins
(these are typically negotiated catchment-wise). Consequently, latter is likely to
be as competitive as DMART over the medium to long term.
DMART’s household share gain in top districts seems restricted from hereon FY20 DMART Bill cuts (mn) 201
Assuming 35% of bil cuts come from Top 7 Districts 70
No. Of HH catered to by Top 7 Districts 4
No. Of HH in Top 7 Districts 15
Purchase frequency/year 18
No. Of stores in Top 7 Districts 106
Bill cuts/store/day 1,818
HH share in 7 Districts (%) 25.9
Source: Company, HSIE Research Note: HH - Household
Page 12
Page | 11
F&G: Sector Thematic
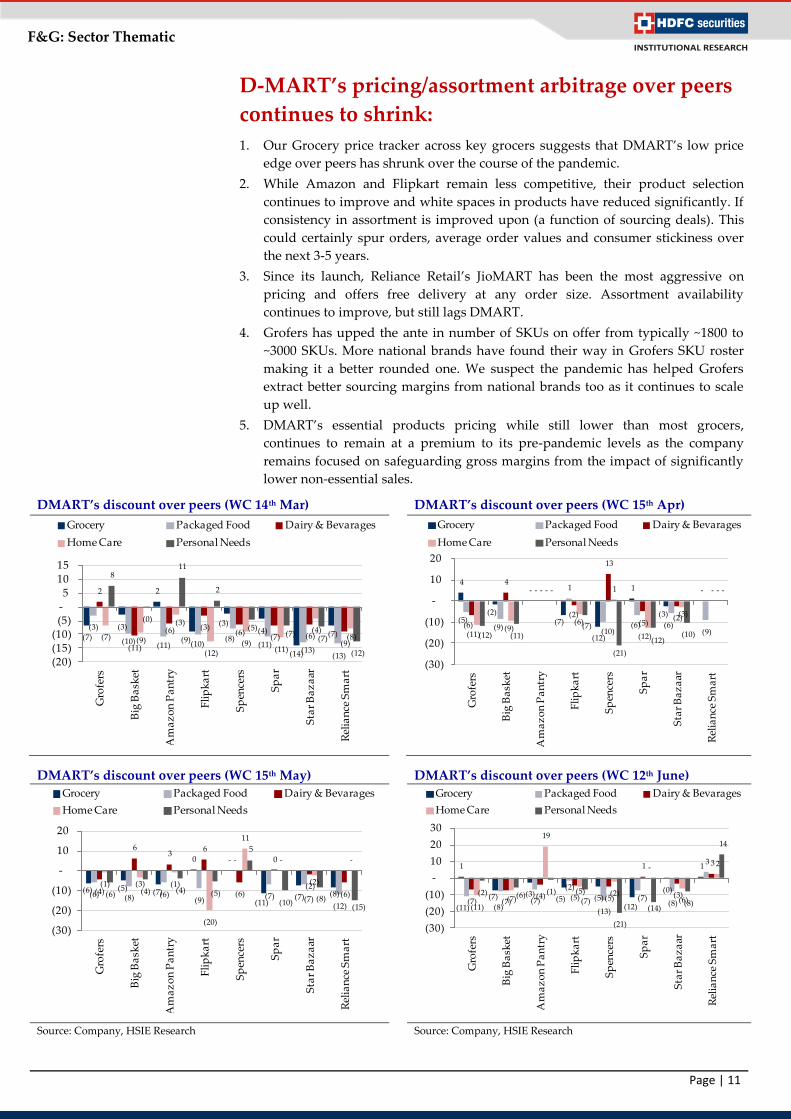
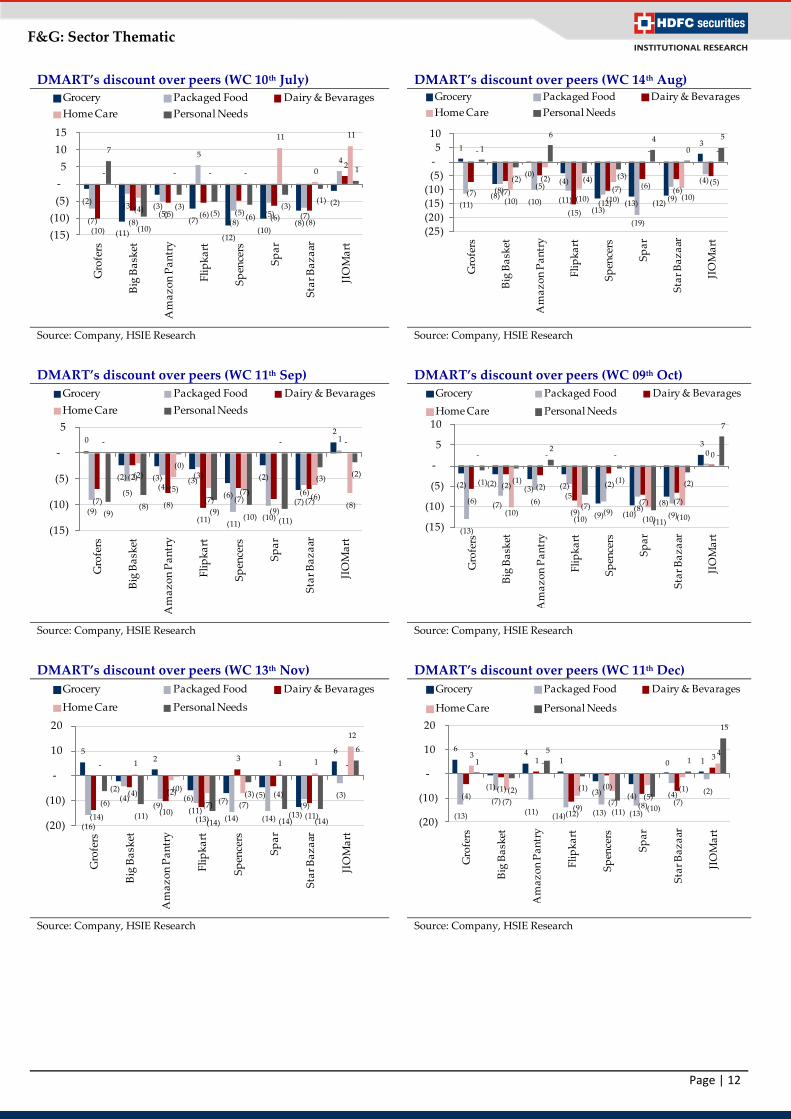
D-MART’s pricing/assortment arbitrage over peers
continues to shrink:
1. Our Grocery price tracker across key grocers suggests that DMART’s low price
edge over peers has shrunk over the course of the pandemic.
2. While Amazon and Flipkart remain less competitive, their product selection
continues to improve and white spaces in products have reduced significantly. If
consistency in assortment is improved upon (a function of sourcing deals). This
could certainly spur orders, average order values and consumer stickiness over
the next 3-5 years.
3. Since its launch, Reliance Retail’s JioMART has been the most aggressive on
pricing and offers free delivery at any order size. Assortment availability
continues to improve, but still lags DMART.
4. Grofers has upped the ante in number of SKUs on offer from typically ~1800 to
~3000 SKUs. More national brands have found their way in Grofers SKU roster
making it a better rounded one. We suspect the pandemic has helped Grofers
extract better sourcing margins from national brands too as it continues to scale
up well.
5. DMART’s essential products pricing while still lower than most grocers,
continues to remain at a premium to its pre-pandemic levels as the company
remains focused on safeguarding gross margins from the impact of significantly
lower non-essential sales.
DMART’s discount over peers (WC 14th Mar)
DMART’s discount over peers (WC 15th Apr)
DMART’s discount over peers (WC 15th May) DMART’s discount over peers (WC 12th June)
Source: Company, HSIE Research Source: Company, HSIE Research
(7)
(3)
2
(9)
(3)(4)
(14)
(7)(3)
(10) (11) (10)(8)
(11)(13)
(13)
2
(11)
(6) (3)(6)
(7) (6)(9)
(7) (9)
(3)
(12)(9)
(11)
(4)(8)
8
(0)
11
2
(5)(7)
(7)
(12)(20)(15)(10)
(5)-5
10 15
Gro
fers
Big
Ba
sket
Am
az
on
Pa
ntr
y
Fli
pk
art
Sp
ence
rs
Sp
ar
Sta
r B
az
aar
Rel
ian
ce S
ma
rt
Grocery Packaged Food Dairy & Bevarages
Home Care Personal Needs
4
(2)
-
(7)
(12)
1
(3)
-
(5)(9)
- 1
(10)(6) (6)
(9)(6)
4 -
(2)
13
(5)(2)
-
(11)(9)
-
(6)
1
(12)
(3)
-
(12) (11)
-
(7)
(21)
(12)(10)
-
(30)
(20)
(10)
-
10
20
Gro
fers
Big
Ba
sket
Am
az
on
Pa
ntr
y
Fli
pk
art
Sp
ence
rs
Sp
ar
Sta
r B
az
aar
Rel
ian
ce S
ma
rt
Grocery Packaged Food Dairy & Bevarages
Home Care Personal Needs
(6) (5) (7)
0 -
(11)(7) (8)(6) (8) (6)
(9)
-
(7) (7)(12)
(4)
6 3
6
(6)
0
(2)(6)
(1) (3) (1)
(20)
11
-
(2)
-
(6) (4) (4) (5)
5
(10) (8)(15)
(30)
(20)
(10)
-
10
20
Gro
fers
Big
Ba
sket
Am
az
on
Pa
ntr
y
Fli
pk
art
Sp
ence
rs
Sp
ar
Sta
r B
az
aar
Rel
ian
ce S
ma
rt
Grocery Packaged Food Dairy & Bevarages
Home Care Personal Needs
1
(7) (3)(5) (5)
(12)
(0)
1
(11) (8)(7)
(2)
(13)
(7)(8)
3
(7) (7)(4) (5) (5)
1
(3)
3
(11)(7)
19
(5) (2)
-
(6)
2
(2) (6) (1)(7)
(21)
(14)(8)
14
(30)
(20)
(10)
-
10
20
30
Gro
fers
Big
Ba
sket
Am
az
on
Pa
ntr
y
Fli
pk
art
Sp
ence
rs
Sp
ar
Sta
r B
az
aar
Rel
ian
ce S
ma
rt
Grocery Packaged Food Dairy & Bevarages
Home Care Personal Needs
Page 13
Page | 12
F&G: Sector Thematic
DMART’s discount over peers (WC 10th July) DMART’s discount over peers (WC 14th Aug)
Source: Company, HSIE Research Source: Company, HSIE Research
DMART’s discount over peers (WC 11th Sep) DMART’s discount over peers (WC 09th Oct)
Source: Company, HSIE Research Source: Company, HSIE Research
DMART’s discount over peers (WC 13th Nov) DMART’s discount over peers (WC 11th Dec)
Source: Company, HSIE Research Source: Company, HSIE Research
(2)
(11)
(3)
(7)
(12)(10)
(8)
(2)
(7)
(3)(5)
5
(8)(5) (7)
4
(10)(8)
(5) (6) (5)(6)
(8)
2 -
(4)
- - -
11
0
11
7
(10)
(3)(5) (6)
(3)(1)
1
(15)
(10)
(5)
-
5
10
15
Gro
fers
Big
Ba
sket
Am
az
on
Pa
ntr
y
Fli
pk
art
Sp
ence
rs
Sp
ar
Sta
r B
az
aar
JIO
Ma
rt
Grocery Packaged Food Dairy & Bevarages
Home Care Personal Needs
1
(8)
(0)(4)
(13)(13) (12)
3
(11)
(8)
(10) (11) (12)
(19)
(9)
(4)
(7) (7)(5)
(15)
(10)
(6)(6)
(5)
-
(10)
(2)
(10)(7)
-
(10)
-1
(2)
6
(4) (3)
4
0
5
(25)
(20)
(15)
(10)
(5)
-
5
10
Gro
fers
Big
Ba
sket
Am
az
on
Pa
ntr
y
Fli
pk
art
Sp
ence
rs
Sp
ar
Sta
r B
az
aar
JIO
Ma
rt
Grocery Packaged Food Dairy & Bevarages
Home Care Personal Needs
(2) (2)(3) (2)
(9) (10)
(8)
3
(13)
(7) (6)(5)
(9) (8)(9)
0
(6)
(2) (2)
(9)
(2)
(7) (7)
0 -
(10)
-
(10)
-
(10) (10)
-
(1) (1)
2
(7)
(1)
(11)
(2)
7
(15)
(10)
(5)
-
5
10
Gro
fers
Big
Ba
sket
Am
az
on
Pa
ntr
y
Fli
pk
art
Sp
ence
rs
Sp
ar
Sta
r B
az
aar
JIO
Ma
rt
Grocery Packaged Food Dairy & Bevarages
Home Care Personal Needs
6
(1)
4 1
(3) (4)
0 1
(13)
(7)
(11)(14) (13) (13)
(4) (2)(4)
(1)
1
(12)
(0)
(8) (7)
3 3
(7)
-
(9)(7)
(5)(1)
4 1
(2)
5
(1)
(11) (10)
1
15
(20)
(10)
-
10
20
Gro
fers
Big
Ba
sket
Am
az
on
Pa
ntr
y
Fli
pk
art
Sp
ence
rs
Sp
ar
Sta
r B
az
aar
JIO
Ma
rt
Grocery Packaged Food Dairy & Bevarages
Home Care Personal Needs
0
(2) (3) (3)
(6)
(2)
(7)
2
(9)
(5)(4)
(3)
(11)(10)
(6)
1
(7)
(2)
(8)
(11)
(7)
(9)(7)
--
(2)
(5)
(7)(7)
-
(6)(8)
(9)(8)
(0)
(9)(10) (11)
(3)(2)
(15)
(10)
(5)
-
5
Gro
fers
Big
Ba
sket
Am
az
on
Pa
ntr
y
Fli
pk
art
Sp
ence
rs
Sp
ar
Sta
r B
az
aar
JIO
Ma
rt
Grocery Packaged Food Dairy & Bevarages
Home Care Personal Needs
5
(2)
2
(6) (7)(5)
(13)
6
(16)
(4)(9)
(11)(14) (14)
(9)
(3)
(14)
(4)
(10)(13)
3
(4)
(11)
-- 1
(2)
(7) (7)
1 1
12
(6)
(11)
(0)
(14)
(3)
(14) (14)
6
(20)
(10)
-
10
20
Gro
fers
Big
Ba
sket
Am
az
on
Pa
ntr
y
Fli
pk
art
Sp
ence
rs
Sp
ar
Sta
r B
az
aar
JIO
Ma
rt
Grocery Packaged Food Dairy & Bevarages
Home Care Personal Needs
Page 14
Page | 13
F&G: Sector Thematic
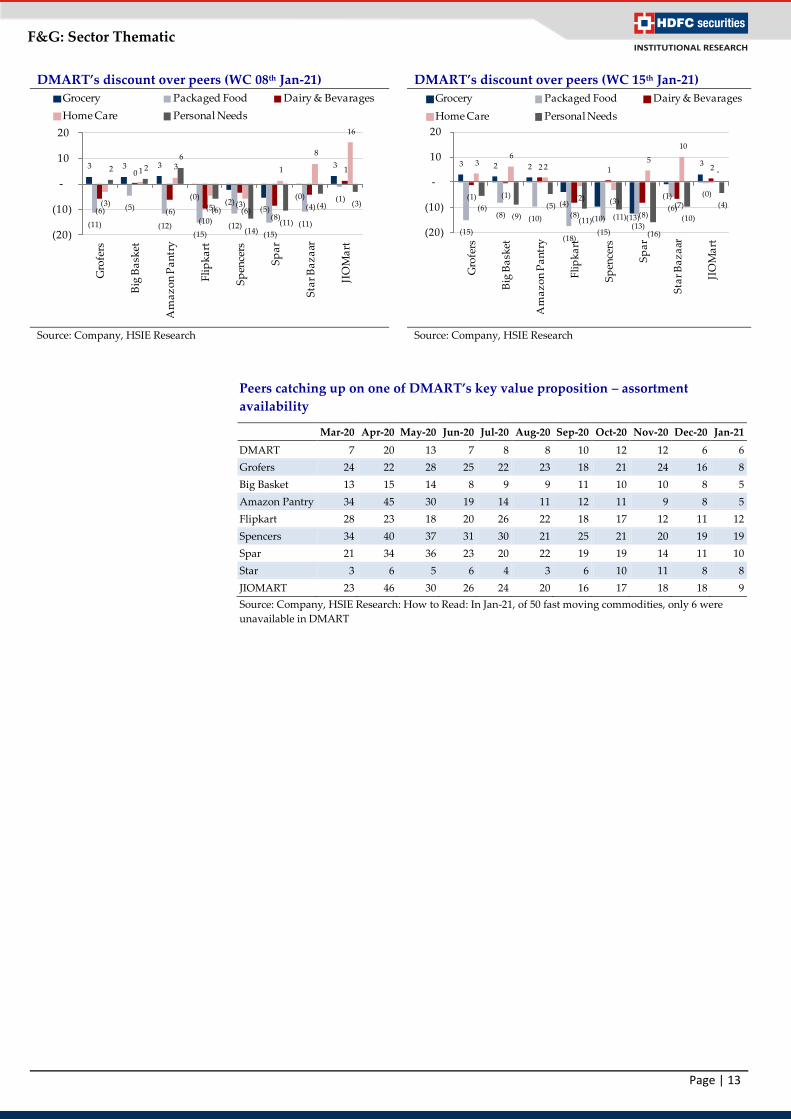
DMART’s discount over peers (WC 08th Jan-21) DMART’s discount over peers (WC 15th Jan-21)
Source: Company, HSIE Research Source: Company, HSIE Research
Peers catching up on one of DMART’s key value proposition – assortment
availability
Mar-20 Apr-20 May-20 Jun-20 Jul-20 Aug-20 Sep-20 Oct-20 Nov-20 Dec-20 Jan-21
DMART 7 20 13 7 8 8 10 12 12 6 6
Grofers 24 22 28 25 22 23 18 21 24 16 8
Big Basket 13 15 14 8 9 9 11 10 10 8 5
Amazon Pantry 34 45 30 19 14 11 12 11 9 8 5
Flipkart 28 23 18 20 26 22 18 17 12 11 12
Spencers 34 40 37 31 30 21 25 21 20 19 19
Spar 21 34 36 23 20 22 19 19 14 11 10
Star 3 6 5 6 4 3 6 10 11 8 8
JIOMART 23 46 30 26 24 20 16 17 18 18 9
Source: Company, HSIE Research: How to Read: In Jan-21, of 50 fast moving commodities, only 6 were
unavailable in DMART
3 3 3
(0)(2)
(5)
(0)
3
(11)
(5)
(12)(15)
(12)(15)
(11)
(1)
(6)
0
(6)(10)
(3)
(8)
(4)
1
(3)
1 3
(5) (6)
1
8
16
2 2
6
(6)
(14)(11)
(4) (3)
(20)
(10)
-
10
20
Gro
fers
Big
Ba
sket
Am
az
on
Pa
ntr
y
Fli
pk
art
Sp
ence
rs
Sp
ar
Sta
r B
az
aar
JIO
Ma
rt
Grocery Packaged Food Dairy & Bevarages
Home Care Personal Needs
3 2 2
(4)
(10) (13)
(1)
3
(15)
(8) (10)
(18)(15)
(13)
(6)
(0)(1) (1)
2
(8)
1
(8)(7)
2 3
6
2
(2) (3)
5
10
-
(6)(9)
(5)
(11) (11)
(16)
(10)
(4)
(20)
(10)
-
10
20
Gro
fers
Big
Ba
sket
Am
az
on
Pa
ntr
y
Fli
pk
art
Sp
ence
rs
Sp
ar
Sta
r B
az
aar
JIO
Ma
rt
Grocery Packaged Food Dairy & Bevarages
Home Care Personal Needs
Page 15
Page | 14
F&G: Sector Thematic
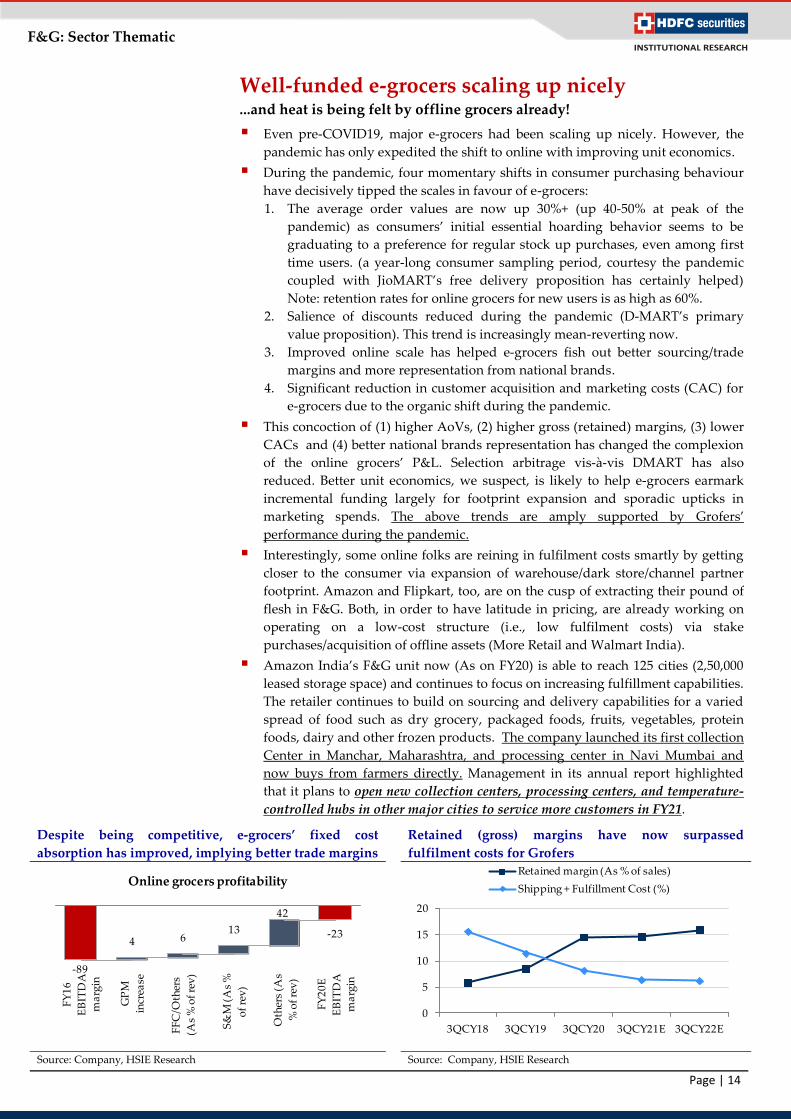
Well-funded e-grocers scaling up nicely ...and heat is being felt by offline grocers already!
Even pre-COVID19, major e-grocers had been scaling up nicely. However, the
pandemic has only expedited the shift to online with improving unit economics.
During the pandemic, four momentary shifts in consumer purchasing behaviour
have decisively tipped the scales in favour of e-grocers:
1. The average order values are now up 30%+ (up 40-50% at peak of the
pandemic) as consumers’ initial essential hoarding behavior seems to be
graduating to a preference for regular stock up purchases, even among first
time users. (a year-long consumer sampling period, courtesy the pandemic
coupled with JioMART’s free delivery proposition has certainly helped)
Note: retention rates for online grocers for new users is as high as 60%.
2. Salience of discounts reduced during the pandemic (D-MART’s primary
value proposition). This trend is increasingly mean-reverting now.
3. Improved online scale has helped e-grocers fish out better sourcing/trade
margins and more representation from national brands.
4. Significant reduction in customer acquisition and marketing costs (CAC) for
e-grocers due to the organic shift during the pandemic.
This concoction of (1) higher AoVs, (2) higher gross (retained) margins, (3) lower
CACs and (4) better national brands representation has changed the complexion
of the online grocers’ P&L. Selection arbitrage vis-à-vis DMART has also
reduced. Better unit economics, we suspect, is likely to help e-grocers earmark
incremental funding largely for footprint expansion and sporadic upticks in
marketing spends. The above trends are amply supported by Grofers’
performance during the pandemic.
Interestingly, some online folks are reining in fulfilment costs smartly by getting
closer to the consumer via expansion of warehouse/dark store/channel partner
footprint. Amazon and Flipkart, too, are on the cusp of extracting their pound of
flesh in F&G. Both, in order to have latitude in pricing, are already working on
operating on a low-cost structure (i.e., low fulfilment costs) via stake
purchases/acquisition of offline assets (More Retail and Walmart India).
Amazon India’s F&G unit now (As on FY20) is able to reach 125 cities (2,50,000
leased storage space) and continues to focus on increasing fulfillment capabilities.
The retailer continues to build on sourcing and delivery capabilities for a varied
spread of food such as dry grocery, packaged foods, fruits, vegetables, protein
foods, dairy and other frozen products. The company launched its first collection
Center in Manchar, Maharashtra, and processing center in Navi Mumbai and
now buys from farmers directly. Management in its annual report highlighted
that it plans to open new collection centers, processing centers, and temperature-
controlled hubs in other major cities to service more customers in FY21.
Despite being competitive, e-grocers’ fixed cost
absorption has improved, implying better trade margins
Retained (gross) margins have now surpassed
fulfilment costs for Grofers
Source: Company, HSIE Research Source: Company, HSIE Research
-89
-23 4 6
13
42
FY
16
EB
ITD
A
ma
rgin
GP
M
incr
ease
FF
C/O
ther
s
(As
% o
f re
v)
S&
M (
As
%
of
rev
)
Oth
ers
(As
% o
f re
v)
FY
20
E
EB
ITD
A
ma
rgin
Online grocers profitability
0
5
10
15
20
3QCY18 3QCY19 3QCY20 3QCY21E 3QCY22E
Retained margin (As % of sales)
Shipping + Fulfillment Cost (%)
Page 16
Page | 15
F&G: Sector Thematic
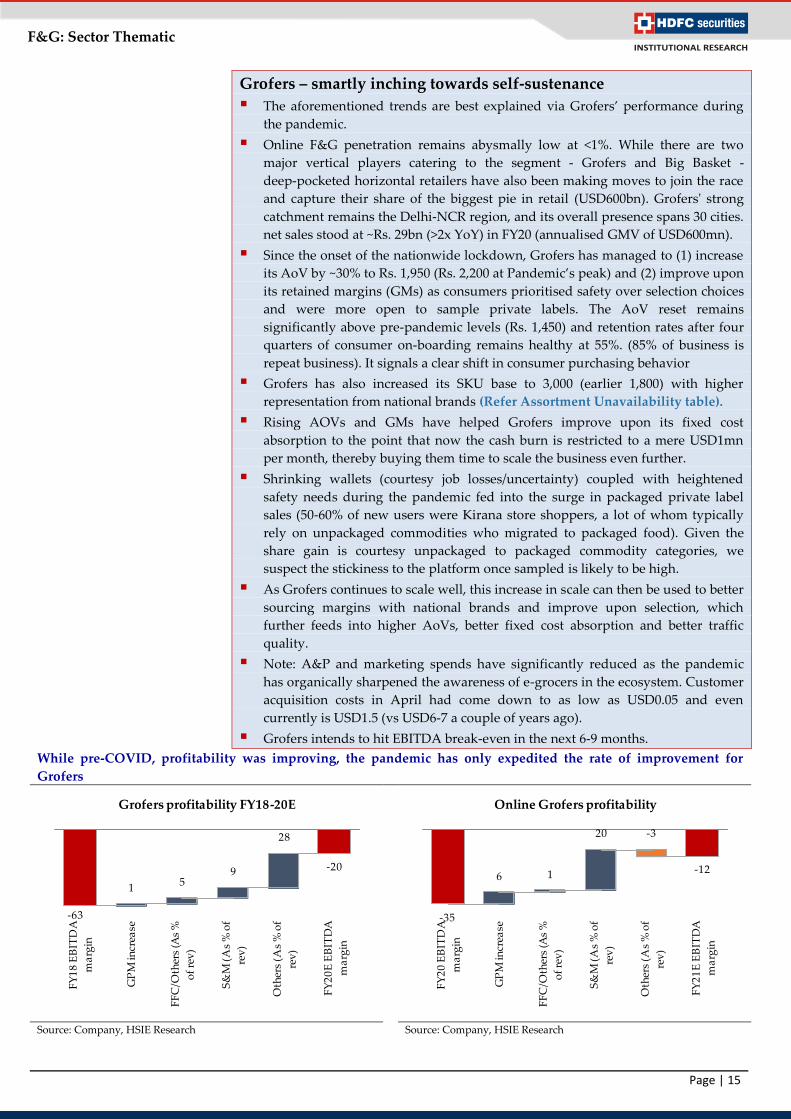
Grofers – smartly inching towards self-sustenance
The aforementioned trends are best explained via Grofers’ performance during
the pandemic.
Online F&G penetration remains abysmally low at <1%. While there are two
major vertical players catering to the segment ‐ Grofers and Big Basket -
deep‐pocketed horizontal retailers have also been making moves to join the race
and capture their share of the biggest pie in retail (USD600bn). Grofers' strong
catchment remains the Delhi‐NCR region, and its overall presence spans 30 cities.
net sales stood at ~Rs. 29bn (>2x YoY) in FY20 (annualised GMV of USD600mn).
Since the onset of the nationwide lockdown, Grofers has managed to (1) increase
its AoV by ~30% to Rs. 1,950 (Rs. 2,200 at Pandemic’s peak) and (2) improve upon
its retained margins (GMs) as consumers prioritised safety over selection choices
and were more open to sample private labels. The AoV reset remains
significantly above pre-pandemic levels (Rs. 1,450) and retention rates after four
quarters of consumer on-boarding remains healthy at 55%. (85% of business is
repeat business). It signals a clear shift in consumer purchasing behavior
Grofers has also increased its SKU base to 3,000 (earlier 1,800) with higher
representation from national brands (Refer Assortment Unavailability table).
Rising AOVs and GMs have helped Grofers improve upon its fixed cost
absorption to the point that now the cash burn is restricted to a mere USD1mn
per month, thereby buying them time to scale the business even further.
Shrinking wallets (courtesy job losses/uncertainty) coupled with heightened
safety needs during the pandemic fed into the surge in packaged private label
sales (50-60% of new users were Kirana store shoppers, a lot of whom typically
rely on unpackaged commodities who migrated to packaged food). Given the
share gain is courtesy unpackaged to packaged commodity categories, we
suspect the stickiness to the platform once sampled is likely to be high.
As Grofers continues to scale well, this increase in scale can then be used to better
sourcing margins with national brands and improve upon selection, which
further feeds into higher AoVs, better fixed cost absorption and better traffic
quality.
Note: A&P and marketing spends have significantly reduced as the pandemic
has organically sharpened the awareness of e-grocers in the ecosystem. Customer
acquisition costs in April had come down to as low as USD0.05 and even
currently is USD1.5 (vs USD6-7 a couple of years ago).
Grofers intends to hit EBITDA break-even in the next 6-9 months.
While pre-COVID, profitability was improving, the pandemic has only expedited the rate of improvement for
Grofers
Source: Company, HSIE Research
Source: Company, HSIE Research
-63
-20
1 5
9
28
FY
18
EB
ITD
A
ma
rgin
GP
M in
crea
se
FF
C/O
ther
s (A
s %
of
rev
)
S&
M (
As
% o
f
rev
)
Oth
ers
(As
% o
f
rev
)
FY
20
E E
BIT
DA
ma
rgin
Grofers profitability FY18-20E
-35
-12 6 1
20 -3
FY
20
EB
ITD
A
ma
rgin
GP
M in
crea
se
FF
C/O
ther
s (A
s %
of
rev
)
S&
M (
As
% o
f
rev
)
Oth
ers
(As
% o
f
rev
)
FY
21
E E
BIT
DA
ma
rgin
Online Grofers profitability
Page 17
Page | 16
F&G: Sector Thematic
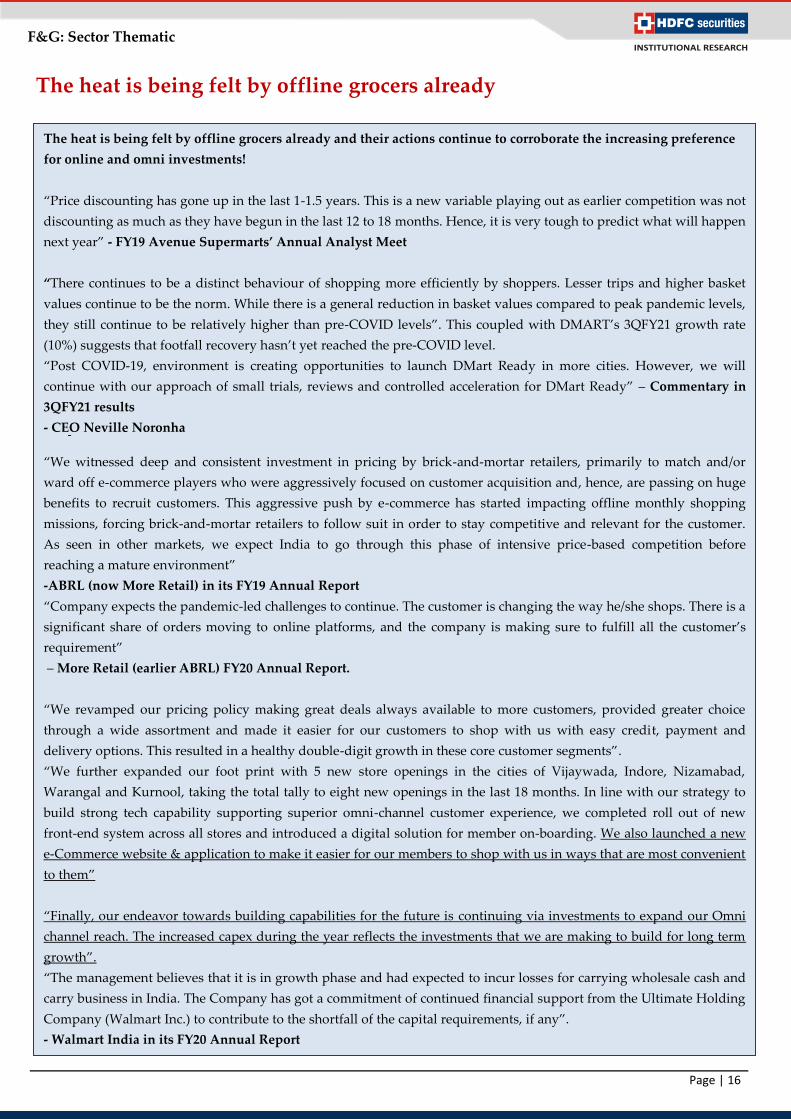
The heat is being felt by offline grocers already
The heat is being felt by offline grocers already and their actions continue to corroborate the increasing preference
for online and omni investments!
“Price discounting has gone up in the last 1-1.5 years. This is a new variable playing out as earlier competition was not
discounting as much as they have begun in the last 12 to 18 months. Hence, it is very tough to predict what will happen
next year” - FY19 Avenue Supermarts’ Annual Analyst Meet
“There continues to be a distinct behaviour of shopping more efficiently by shoppers. Lesser trips and higher basket
values continue to be the norm. While there is a general reduction in basket values compared to peak pandemic levels,
they still continue to be relatively higher than pre-COVID levels”. This coupled with DMART’s 3QFY21 growth rate
(10%) suggests that footfall recovery hasn’t yet reached the pre-COVID level.
“Post COVID-19, environment is creating opportunities to launch DMart Ready in more cities. However, we will
continue with our approach of small trials, reviews and controlled acceleration for DMart Ready” – Commentary in
3QFY21 results
- CEO Neville Noronha -
“We witnessed deep and consistent investment in pricing by brick-and-mortar retailers, primarily to match and/or
ward off e-commerce players who were aggressively focused on customer acquisition and, hence, are passing on huge
benefits to recruit customers. This aggressive push by e-commerce has started impacting offline monthly shopping
missions, forcing brick-and-mortar retailers to follow suit in order to stay competitive and relevant for the customer.
As seen in other markets, we expect India to go through this phase of intensive price-based competition before
reaching a mature environment”
-ABRL (now More Retail) in its FY19 Annual Report
“Company expects the pandemic-led challenges to continue. The customer is changing the way he/she shops. There is a
significant share of orders moving to online platforms, and the company is making sure to fulfill all the customer’s
requirement”
– More Retail (earlier ABRL) FY20 Annual Report.
“We revamped our pricing policy making great deals always available to more customers, provided greater choice
through a wide assortment and made it easier for our customers to shop with us with easy credit, payment and
delivery options. This resulted in a healthy double-digit growth in these core customer segments”.
“We further expanded our foot print with 5 new store openings in the cities of Vijaywada, Indore, Nizamabad,
Warangal and Kurnool, taking the total tally to eight new openings in the last 18 months. In line with our strategy to
build strong tech capability supporting superior omni-channel customer experience, we completed roll out of new
front-end system across all stores and introduced a digital solution for member on-boarding. We also launched a new
e-Commerce website & application to make it easier for our members to shop with us in ways that are most convenient
to them”
“Finally, our endeavor towards building capabilities for the future is continuing via investments to expand our Omni
channel reach. The increased capex during the year reflects the investments that we are making to build for long term
growth”.
“The management believes that it is in growth phase and had expected to incur losses for carrying wholesale cash and
carry business in India. The Company has got a commitment of continued financial support from the Ultimate Holding
Company (Walmart Inc.) to contribute to the shortfall of the capital requirements, if any”.
- Walmart India in its FY20 Annual Report
Page 18
Page | 17
F&G: Sector Thematic
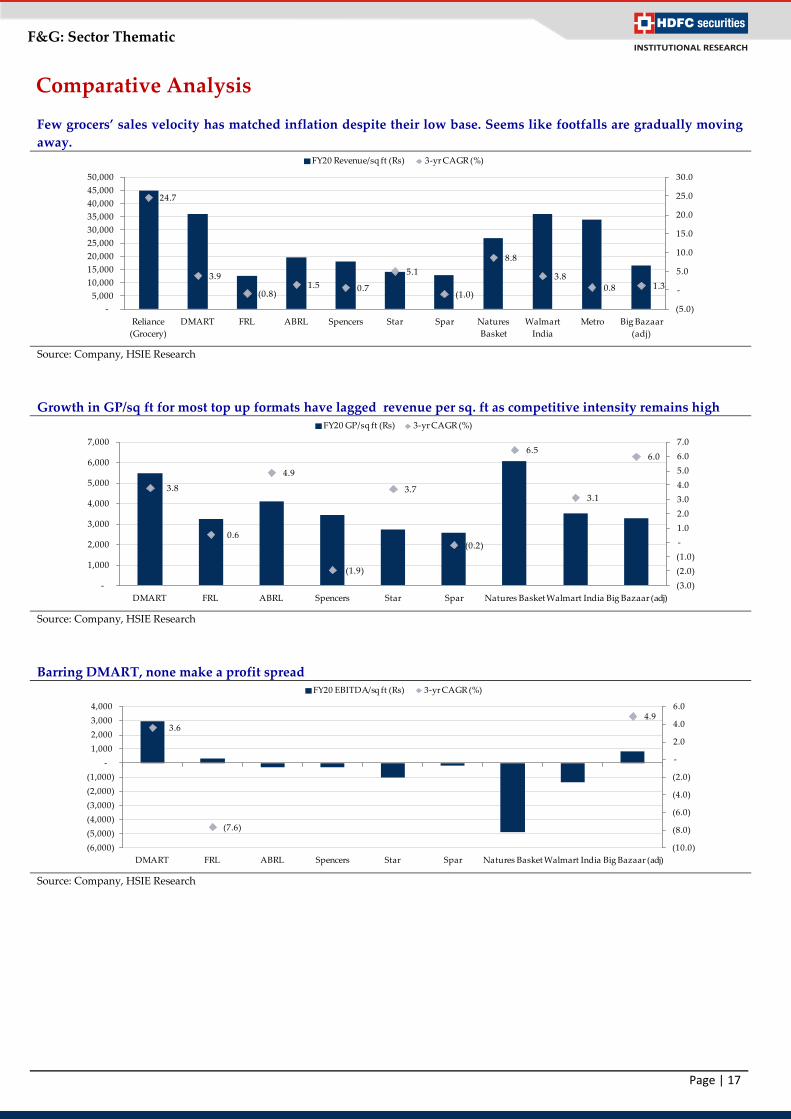
Comparative Analysis
Few grocers’ sales velocity has matched inflation despite their low base. Seems like footfalls are gradually moving
away.
Source: Company, HSIE Research
Growth in GP/sq ft for most top up formats have lagged revenue per sq. ft as competitive intensity remains high
Source: Company, HSIE Research
Barring DMART, none make a profit spread
Source: Company, HSIE Research
24.7
3.9
(0.8)1.5 0.7
5.1
(1.0)
8.8
3.8
0.8 1.3
(5.0)
-
5.0
10.0
15.0
20.0
25.0
30.0
-
5,000
10,000
15,000
20,000
25,000
30,000
35,000
40,000
45,000
50,000
Reliance
(Grocery)
DMART FRL ABRL Spencers Star Spar Natures
Basket
Walmart
India
Metro Big Bazaar
(adj)
FY20 Revenue/sq ft (Rs) 3-yr CAGR (%)
3.8
0.6
4.9
(1.9)
3.7
(0.2)
6.5
3.1
6.0
(3.0)
(2.0)
(1.0)
-
1.0
2.0
3.0
4.0
5.0
6.0
7.0
-
1,000
2,000
3,000
4,000
5,000
6,000
7,000
DMART FRL ABRL Spencers Star Spar Natures BasketWalmart India Big Bazaar (adj)
FY20 GP/sq ft (Rs) 3-yr CAGR (%)
3.6
(7.6)
4.9
(10.0)
(8.0)
(6.0)
(4.0)
(2.0)
-
2.0
4.0
6.0
(6,000)
(5,000)
(4,000)
(3,000)
(2,000)
(1,000)
-
1,000
2,000
3,000
4,000
DMART FRL ABRL Spencers Star Spar Natures Basket Walmart India Big Bazaar (adj)
FY20 EBITDA/sq ft (Rs) 3-yr CAGR (%)
Page 19
Page | 18
F&G: Sector Thematic
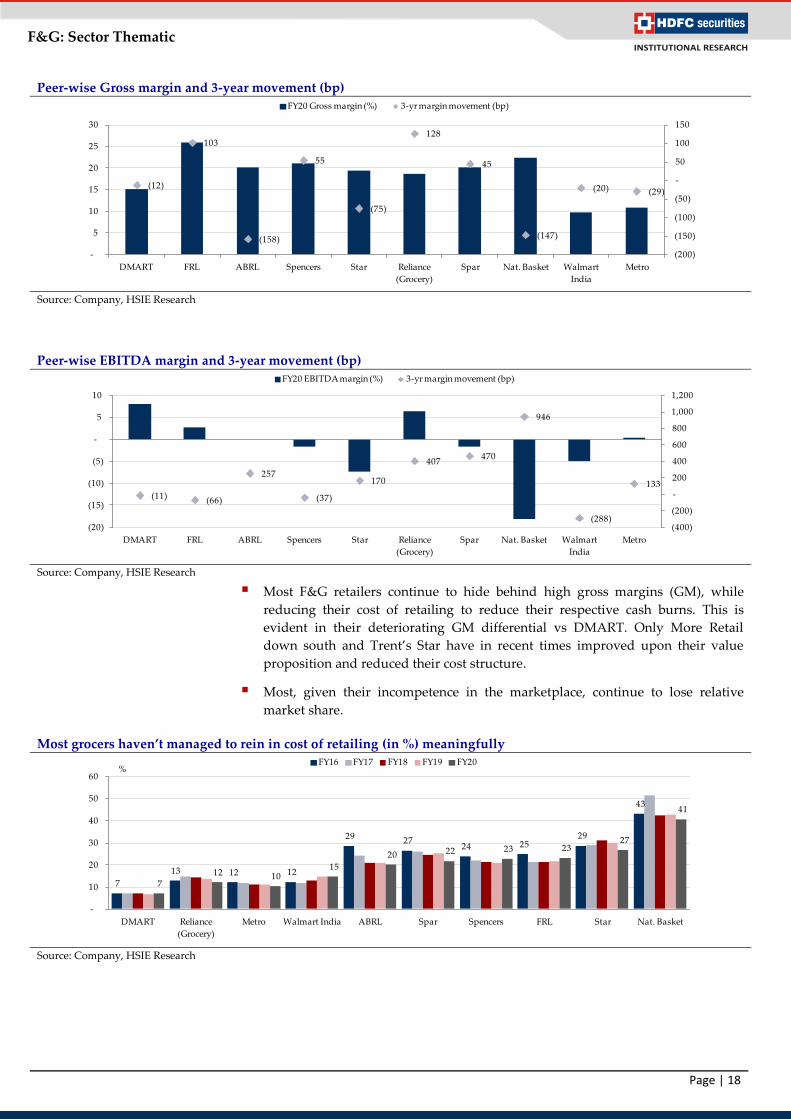
Peer-wise Gross margin and 3-year movement (bp)
Source: Company, HSIE Research
Peer-wise EBITDA margin and 3-year movement (bp)
Source: Company, HSIE Research
Most F&G retailers continue to hide behind high gross margins (GM), while
reducing their cost of retailing to reduce their respective cash burns. This is
evident in their deteriorating GM differential vs DMART. Only More Retail
down south and Trent’s Star have in recent times improved upon their value
proposition and reduced their cost structure.
Most, given their incompetence in the marketplace, continue to lose relative
market share.
Most grocers haven’t managed to rein in cost of retailing (in %) meaningfully
Source: Company, HSIE Research
(12)
103
(158)
55
(75)
128
45
(147)
(20) (29)
(200)
(150)
(100)
(50)
-
50
100
150
-
5
10
15
20
25
30
DMART FRL ABRL Spencers Star Reliance
(Grocery)
Spar Nat. Basket Walmart
India
Metro
FY20 Gross margin (%) 3-yr margin movement (bp)
(11) (66)
257
(37)
170
407 470
946
(288)
133
(400)
(200)
-
200
400
600
800
1,000
1,200
(20)
(15)
(10)
(5)
-
5
10
DMART FRL ABRL Spencers Star Reliance
(Grocery)
Spar Nat. Basket Walmart
India
Metro
FY20 EBITDA margin (%) 3-yr margin movement (bp)
7
13 12 12
29 27 24 25
29
43
7 12 10
15
20 22 23 23 27
41
-
10
20
30
40
50
60
DMART Reliance
(Grocery)
Metro Walmart India ABRL Spar Spencers FRL Star Nat. Basket
FY16 FY17 FY18 FY19 FY20%
Page 20
Page | 19
F&G: Sector Thematic
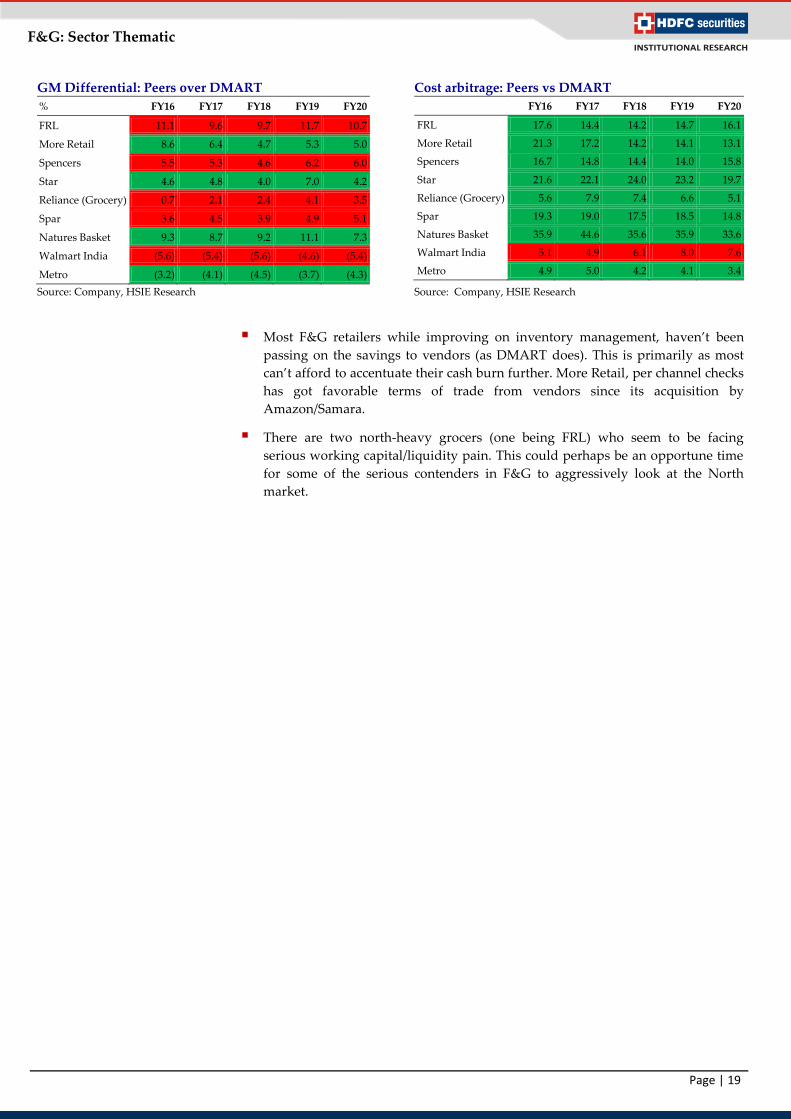
GM Differential: Peers over DMART Cost arbitrage: Peers vs DMART
% FY16 FY17 FY18 FY19 FY20
FRL 11.1 9.6 9.7 11.7 10.7
More Retail 8.6 6.4 4.7 5.3 5.0
Spencers 5.5 5.3 4.6 6.2 6.0
Star 4.6 4.8 4.0 7.0 4.2
Reliance (Grocery) 0.7 2.1 2.4 4.1 3.5
Spar 3.6 4.5 3.9 4.9 5.1
Natures Basket 9.3 8.7 9.2 11.1 7.3
Walmart India (5.6) (5.4) (5.6) (4.6) (5.4)
Metro (3.2) (4.1) (4.5) (3.7) (4.3)
FY16 FY17 FY18 FY19 FY20
FRL 17.6 14.4 14.2 14.7 16.1
More Retail 21.3 17.2 14.2 14.1 13.1
Spencers 16.7 14.8 14.4 14.0 15.8
Star 21.6 22.1 24.0 23.2 19.7
Reliance (Grocery) 5.6 7.9 7.4 6.6 5.1
Spar 19.3 19.0 17.5 18.5 14.8
Natures Basket 35.9 44.6 35.6 35.9 33.6
Walmart India 5.1 4.9 6.1 8.0 7.6
Metro 4.9 5.0 4.2 4.1 3.4
Source: Company, HSIE Research Source: Company, HSIE Research
Most F&G retailers while improving on inventory management, haven’t been
passing on the savings to vendors (as DMART does). This is primarily as most
can’t afford to accentuate their cash burn further. More Retail, per channel checks
has got favorable terms of trade from vendors since its acquisition by
Amazon/Samara.
There are two north-heavy grocers (one being FRL) who seem to be facing
serious working capital/liquidity pain. This could perhaps be an opportune time
for some of the serious contenders in F&G to aggressively look at the North
market.
Page 21
Page | 20
F&G: Sector Thematic
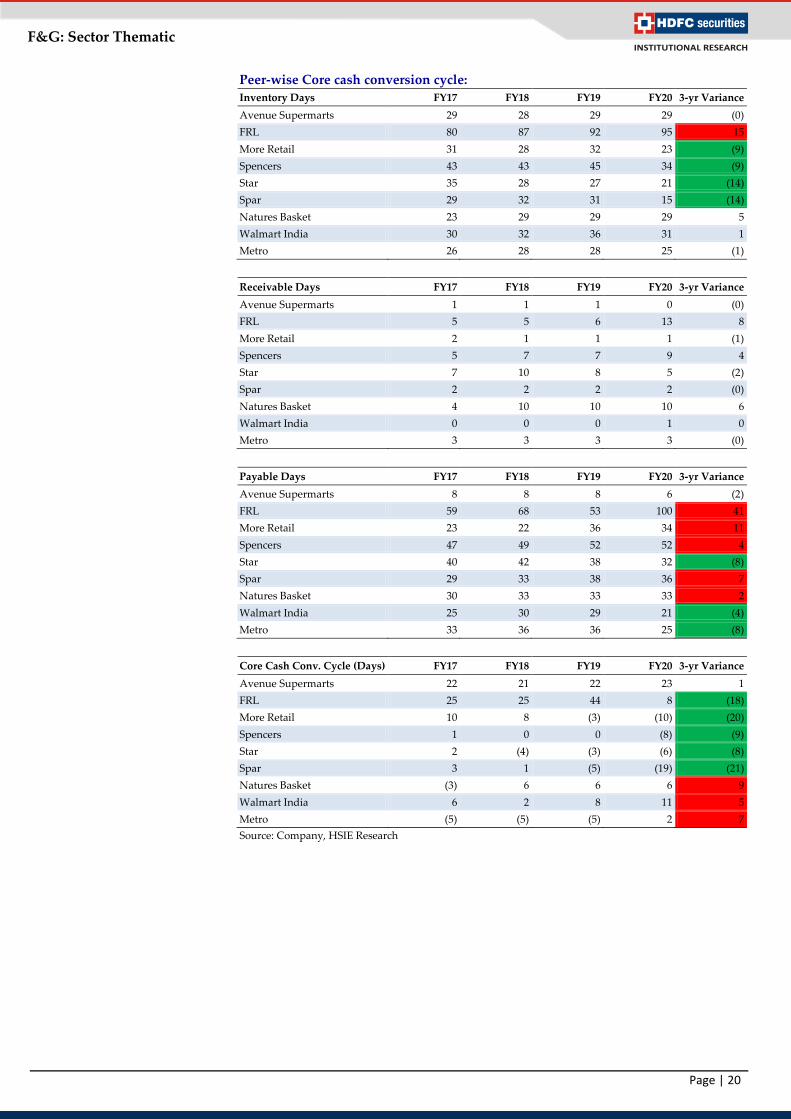
Peer-wise Core cash conversion cycle:
Inventory Days FY17 FY18 FY19 FY20 3-yr Variance
Avenue Supermarts 29 28 29 29 (0)
FRL 80 87 92 95 15
More Retail 31 28 32 23 (9)
Spencers 43 43 45 34 (9)
Star 35 28 27 21 (14)
Spar 29 32 31 15 (14)
Natures Basket 23 29 29 29 5
Walmart India 30 32 36 31 1
Metro 26 28 28 25 (1)
Receivable Days FY17 FY18 FY19 FY20 3-yr Variance
Avenue Supermarts 1 1 1 0 (0)
FRL 5 5 6 13 8
More Retail 2 1 1 1 (1)
Spencers 5 7 7 9 4
Star 7 10 8 5 (2)
Spar 2 2 2 2 (0)
Natures Basket 4 10 10 10 6
Walmart India 0 0 0 1 0
Metro 3 3 3 3 (0)
Payable Days FY17 FY18 FY19 FY20 3-yr Variance
Avenue Supermarts 8 8 8 6 (2)
FRL 59 68 53 100 41
More Retail 23 22 36 34 11
Spencers 47 49 52 52 4
Star 40 42 38 32 (8)
Spar 29 33 38 36 7
Natures Basket 30 33 33 33 2
Walmart India 25 30 29 21 (4)
Metro 33 36 36 25 (8)
Core Cash Conv. Cycle (Days) FY17 FY18 FY19 FY20 3-yr Variance
Avenue Supermarts 22 21 22 23 1
FRL 25 25 44 8 (18)
More Retail 10 8 (3) (10) (20)
Spencers 1 0 0 (8) (9)
Star 2 (4) (3) (6) (8)
Spar 3 1 (5) (19) (21)
Natures Basket (3) 6 6 6 9
Walmart India 6 2 8 11 5
Metro (5) (5) (5) 2 7
Source: Company, HSIE Research
Page 22
Page | 21
F&G: Sector Thematic
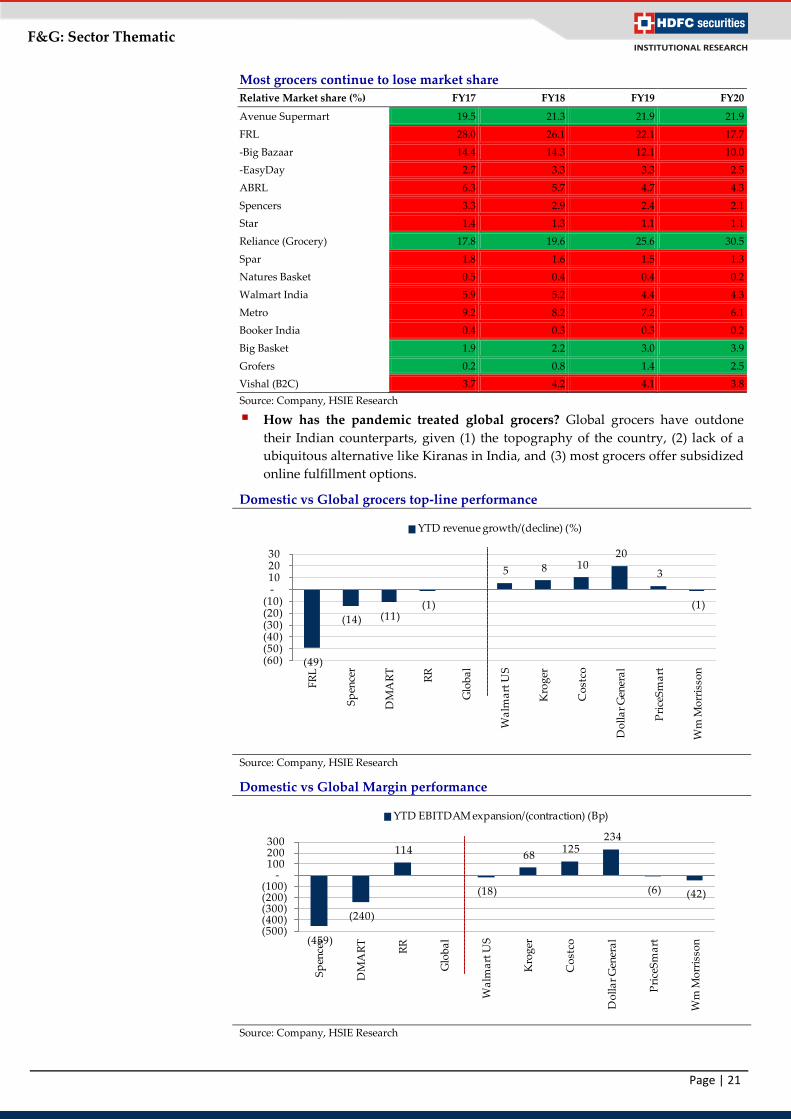
Most grocers continue to lose market share
Relative Market share (%) FY17 FY18 FY19 FY20
Avenue Supermart 19.5 21.3 21.9 21.9
FRL 28.0 26.1 22.1 17.7
-Big Bazaar 14.4 14.3 12.1 10.0
-EasyDay 2.7 3.3 3.3 2.5
ABRL 6.3 5.7 4.7 4.3
Spencers 3.3 2.9 2.4 2.1
Star 1.4 1.3 1.1 1.1
Reliance (Grocery) 17.8 19.6 25.6 30.5
Spar 1.8 1.6 1.5 1.3
Natures Basket 0.5 0.4 0.4 0.2
Walmart India 5.9 5.2 4.4 4.3
Metro 9.2 8.2 7.2 6.1
Booker India 0.4 0.3 0.3 0.2
Big Basket 1.9 2.2 3.0 3.9
Grofers 0.2 0.8 1.4 2.5
Vishal (B2C) 3.7 4.2 4.1 3.8
Source: Company, HSIE Research
How has the pandemic treated global grocers? Global grocers have outdone
their Indian counterparts, given (1) the topography of the country, (2) lack of a
ubiquitous alternative like Kiranas in India, and (3) most grocers offer subsidized
online fulfillment options.
Domestic vs Global grocers top-line performance
Source: Company, HSIE Research
Domestic vs Global Margin performance
Source: Company, HSIE Research
(49)
(14) (11)(1)
5 8 10 20
3
(1)
(60)(50)(40)(30)(20)(10)
-10 20 30
FR
L
Sp
ence
r
DM
AR
T
RR
Glo
ba
l
Wa
lma
rt U
S
Kro
ger
Co
stco
Do
lla
r G
ener
al
Pri
ceS
ma
rt
Wm
Mo
rris
son
YTD revenue growth/(decline) (%)
(459)
(240)
114
(18)
68 125
234
(6) (42)
(500)(400)(300)(200)(100)
-100 200 300
Sp
ence
r
DM
AR
T
RR
Glo
ba
l
Wa
lma
rt U
S
Kro
ger
Co
stco
Do
lla
r G
ener
al
Pri
ceS
ma
rt
Wm
Mo
rris
son
YTD EBITDAM expansion/(contraction) (Bp)
Page 23
Page | 22
F&G: Sector Thematic
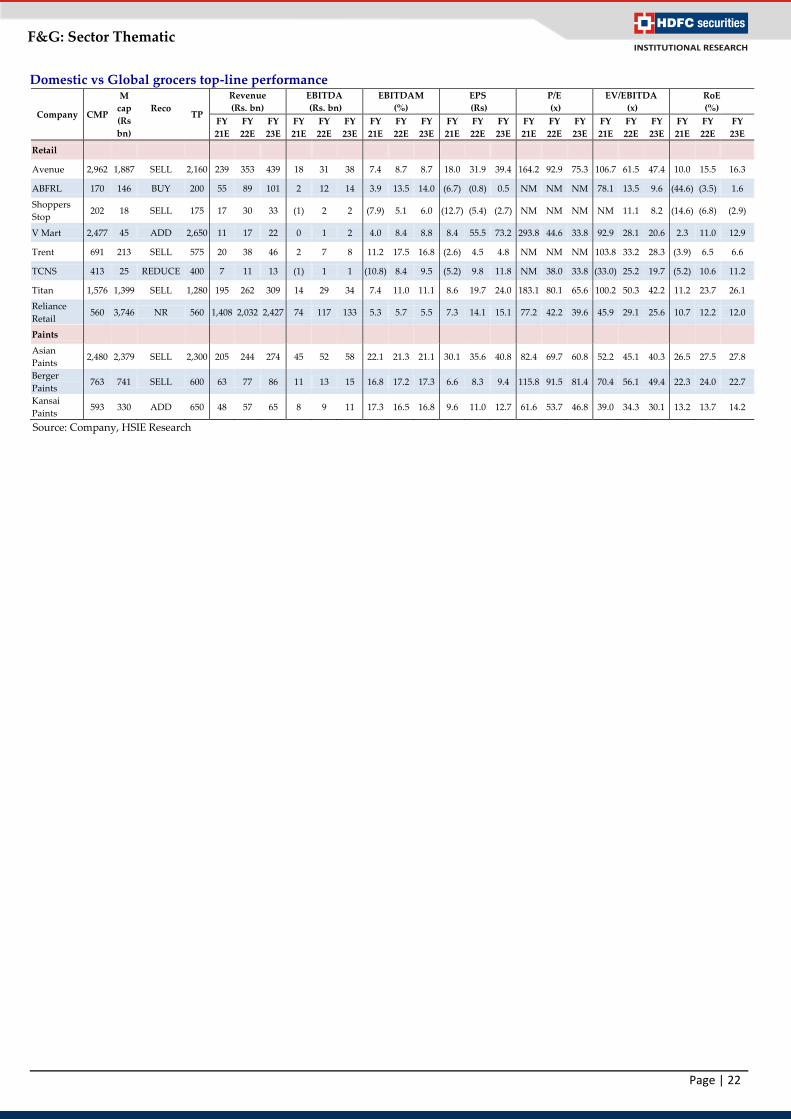
Domestic vs Global grocers top-line performance
Company CMP
M
cap
(Rs
bn)
Reco
TP
Revenue
(Rs. bn)
EBITDA
(Rs. bn)
EBITDAM
(%)
EPS
(Rs)
P/E
(x)
EV/EBITDA
(x)
RoE
(%)
FY
21E
FY
22E
FY
23E
FY
21E
FY
22E
FY
23E
FY
21E
FY
22E
FY
23E
FY
21E
FY
22E
FY
23E
FY
21E
FY
22E
FY
23E
FY
21E
FY
22E
FY
23E
FY
21E
FY
22E
FY
23E
Retail
Avenue 2,962 1,887 SELL 2,160 239 353 439 18 31 38 7.4 8.7 8.7 18.0 31.9 39.4 164.2 92.9 75.3 106.7 61.5 47.4 10.0 15.5 16.3
ABFRL 170 146 BUY 200 55 89 101 2 12 14 3.9 13.5 14.0 (6.7) (0.8) 0.5 NM NM NM 78.1 13.5 9.6 (44.6) (3.5) 1.6
Shoppers
Stop 202 18 SELL 175 17 30 33 (1) 2 2 (7.9) 5.1 6.0 (12.7) (5.4) (2.7) NM NM NM NM 11.1 8.2 (14.6) (6.8) (2.9)
V Mart 2,477 45 ADD 2,650 11 17 22 0 1 2 4.0 8.4 8.8 8.4 55.5 73.2 293.8 44.6 33.8 92.9 28.1 20.6 2.3 11.0 12.9
Trent 691 213 SELL 575 20 38 46 2 7 8 11.2 17.5 16.8 (2.6) 4.5 4.8 NM NM NM 103.8 33.2 28.3 (3.9) 6.5 6.6
TCNS 413 25 REDUCE 400 7 11 13 (1) 1 1 (10.8) 8.4 9.5 (5.2) 9.8 11.8 NM 38.0 33.8 (33.0) 25.2 19.7 (5.2) 10.6 11.2
Titan 1,576 1,399 SELL 1,280 195 262 309 14 29 34 7.4 11.0 11.1 8.6 19.7 24.0 183.1 80.1 65.6 100.2 50.3 42.2 11.2 23.7 26.1
Reliance
Retail 560 3,746 NR 560 1,408 2,032 2,427 74 117 133 5.3 5.7 5.5 7.3 14.1 15.1 77.2 42.2 39.6 45.9 29.1 25.6 10.7 12.2 12.0
Paints
Asian
Paints 2,480 2,379 SELL 2,300 205 244 274 45 52 58 22.1 21.3 21.1 30.1 35.6 40.8 82.4 69.7 60.8 52.2 45.1 40.3 26.5 27.5 27.8
Berger
Paints 763 741 SELL 600 63 77 86 11 13 15 16.8 17.2 17.3 6.6 8.3 9.4 115.8 91.5 81.4 70.4 56.1 49.4 22.3 24.0 22.7
Kansai
Paints 593 330 ADD 650 48 57 65 8 9 11 17.3 16.5 16.8 9.6 11.0 12.7 61.6 53.7 46.8 39.0 34.3 30.1 13.2 13.7 14.2
Source: Company, HSIE Research
Page 24
Page | 23
F&G: Sector Thematic
Thematic reports by HSIE
Cement: WHRS – A key cog in the
flywheel
Autos: Where are we on “S” curve? FMCG: Defensive businesses but
not valuations
Autos: A changed landscape Banks: Double whammy for some India Equity Strategy: Atma
Nirbhar Bharat
Indian IT: Demand recovery in
sight
Life Insurance: Recovery may be
swift with protection driving
margins
Retail: Whole flywheel is broken? Appliances: Looing beyond near-
term disruption
Pharma: Chronic therapy – A
portfolio prescription
Indian Gas: Looking beyond the
pandemic
India Equity Strategy: Quarterly
flipbook
Real Estate: Ripe for consumption Indian IT: expanding centre of
gravity
Indian Chemical: Evolution to
revolution!
Life Insurance: ULIP vs. MF Infrastructure: On the road to
rerating
Cement: Spotting the sweet spot Pharma: Cardiac: the heartbeat of
domestic market
Life Insurance: Comparative
annual report analysis
Indian microfinance: Should you
look micro as macros disappoint?
India Equity Strategy: Quarterly
flipbook
Autos: Divergent trends in PVs
and 2Ws
India Internet: the stage is set FMCG: Opportunity in adversity -
A comparative scorecard
Logistics: Indian Railways - getting
aggressive
Industrials: Triggering a new cycle Financial Services: Megatrends |
Re-bundling ahead
Indian IT: raising the bar
Page 25
Page | 24
F&G: Sector Thematic
Disclosure:
I, Jay Gandhi, MBA, author and the name subscribed to this report, hereby certify that all of the views expressed in this research report accurately reflect our
views about the subject issuer(s) or securities. HSL has no material adverse disciplinary history as on the date of publication of this report. We also certify that
no part of our compensation was, is, or will be directly or indirectly related to the specific recommendation(s) or view(s) in this report.
Research Analyst or his/her relative or HDFC Securities Ltd. does not have any financial interest in the subject company. Also Research Analyst or his relative
or HDFC Securities Ltd. or its Associate may have beneficial ownership of 1% or more in the subject company at the end of the month immediately preceding
the date of publication of the Research Report. Further Research Analyst or his relative or HDFC Securities Ltd. or its associate does not have any material
conflict of interest.
Any holding in stock –No
HDFC Securities Limited (HSL) is a SEBI Registered Research Analyst having registration no. INH000002475.
Disclaimer:
This report has been prepared by HDFC Securities Ltd and is solely for information of the recipient only. The report must not be used as a singular basis of any
investment decision. The views herein are of a general nature and do not consider the risk appetite or the particular circumstances of an individual investor;
readers are requested to take professional advice before investing. Nothing in this document should be construed as investment advice. Each recipient of this
document should make such investigations as they deem necessary to arrive at an independent evaluation of an investment in securities of the companies
referred to in this document (including merits and risks) and should consult their own advisors to determine merits and risks of such investment. The
information and opinions contained herein have been compiled or arrived at, based upon information obtained in good faith from sources believed to be
reliable. Such information has not been independently verified and no guaranty, representation of warranty, express or implied, is made as to its accuracy,
completeness or correctness. All such information and opinions are subject to change without notice. Descriptions of any company or companies or their
securities mentioned herein are not intended to be complete. HSL is not obliged to update this report for such changes. HSL has the right to make changes and
modifications at any time.
This report is not directed to, or intended for display, downloading, printing, reproducing or for distribution to or use by, any person or entity who is a citizen
or resident or located in any locality, state, country or other jurisdiction where such distribution, publication, reproduction, availability or use would be
contrary to law or regulation or what would subject HSL or its affiliates to any registration or licensing requirement within such jurisdiction.
If this report is inadvertently sent or has reached any person in such country, especially, United States of America, the same should be ignored and brought to
the attention of the sender. This document may not be reproduced, distributed or published in whole or in part, directly or indirectly, for any purposes or in
any manner.
Foreign currencies denominated securities, wherever mentioned, are subject to exchange rate fluctuations, which could have an adverse effect on their value or
price, or the income derived from them. In addition, investors in securities such as ADRs, the values of which are influenced by foreign currencies effectively
assume currency risk. It should not be considered to be taken as an offer to sell or a solicitation to buy any security.
This document is not, and should not, be construed as an offer or solicitation of an offer, to buy or sell any securities or other financial instruments. This report
should not be construed as an invitation or solicitation to do business with HSL. HSL may from time to time solicit from, or perform broking, or other services
for, any company mentioned in this mail and/or its attachments.
HSL and its affiliated company(ies), their directors and employees may; (a) from time to time, have a long or short position in, and buy or sell the securities of
the company(ies) mentioned herein or (b) be engaged in any other transaction involving such securities and earn brokerage or other compensation or act as a
market maker in the financial instruments of the company(ies) discussed herein or act as an advisor or lender/borrower to such company(ies) or may have any
other potential conflict of interests with respect to any recommendation and other related information and opinions.
HSL, its directors, analysts or employees do not take any responsibility, financial or otherwise, of the losses or the damages sustained due to the investments
made or any action taken on basis of this report, including but not restricted to, fluctuation in the prices of shares and bonds, changes in the currency rates,
diminution in the NAVs, reduction in the dividend or income, etc.
HSL and other group companies, its directors, associates, employees may have various positions in any of the stocks, securities and financial instruments dealt
in the report, or may make sell or purchase or other deals in these securities from time to time or may deal in other securities of the companies / organizations
described in this report.
HSL or its associates might have managed or co-managed public offering of securities for the subject company or might have been mandated by the subject
company for any other assignment in the past twelve months.
HSL or its associates might have received any compensation from the companies mentioned in the report during the period preceding twelve months from the
date of this report for services in respect of managing or co-managing public offerings, corporate finance, investment banking or merchant banking, brokerage
services or other advisory service in a merger or specific transaction in the normal course of business.
HSL or its analysts did not receive any compensation or other benefits from the companies mentioned in the report or third party in connection with
preparation of the research report. Accordingly, neither HSL nor Research Analysts have any material conflict of interest at the time of publication of this
report. Compensation of our Research Analysts is not based on any specific merchant banking, investment banking or brokerage service transactions. HSL may
have issued other reports that are inconsistent with and reach different conclusion from the information presented in this report.
Research entity has not been engaged in market making activity for the subject company. Research analyst has not served as an officer, director or employee of
the subject company. We have not received any compensation/benefits from the subject company or third party in connection with the Research Report.
HDFC securities Limited, I Think Techno Campus, Building - B, "Alpha", Office Floor 8, Near Kanjurmarg Station, Opp. Crompton Greaves, Kanjurmarg
(East), Mumbai 400 042 Phone: (022) 3075 3400 Fax: (022) 2496 5066 Compliance Officer: Binkle R. Oza Email: [email protected] Phone: (022)
3045 3600
HDFC Securities Limited, SEBI Reg. No.: NSE, BSE, MSEI, MCX: INZ000186937; AMFI Reg. No. ARN: 13549; PFRDA Reg. No. POP: 11092018; IRDA
Corporate Agent License No.: CA0062; SEBI Research Analyst Reg. No.: INH000002475; SEBI Investment Adviser Reg. No.: INA000011538; CIN -
U67120MH2000PLC152193
HDFC securities
Institutional Equities
Unit No. 1602, 16th Floor, Tower A, Peninsula Business Park,
Senapati Bapat Marg, Lower Parel, Mumbai - 400 013
Board: +91-22-6171-7330 www.hdfcsec.com