29
Food and Beverage M&A Landscape Spring 2018

Food and Beverage
M&A LandscapeS p r i n g 2 0 1 8
Food and Beverage M&A Landscape – Spring 2018
2
M&A Activity T a b l e o f C o n t e n t s
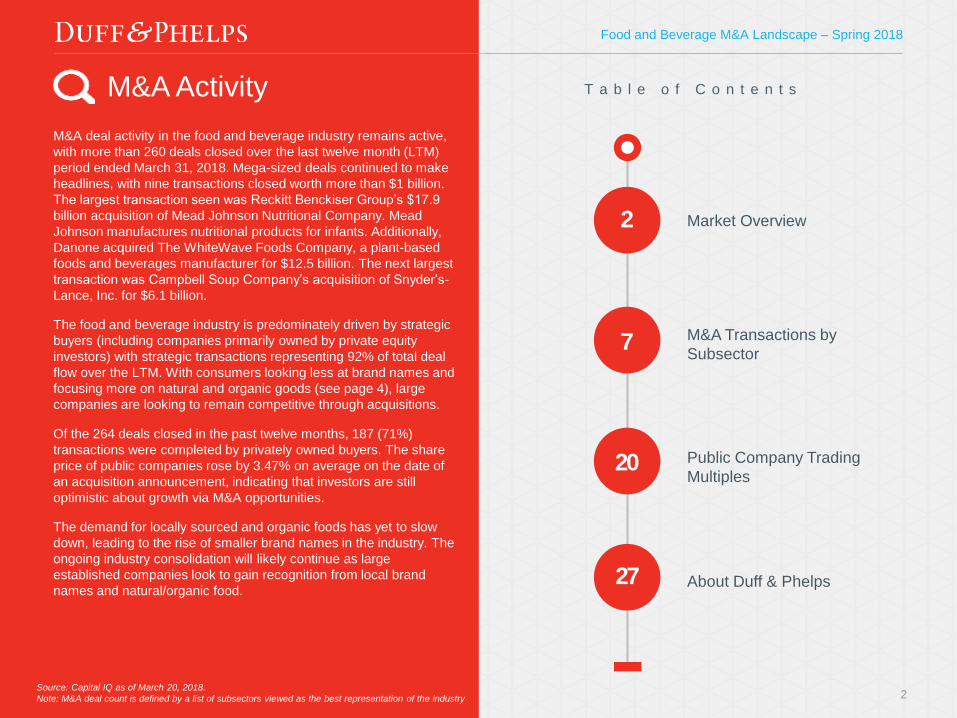
M&A deal activity in the food and beverage industry remains active,
with more than 260 deals closed over the last twelve month (LTM)
period ended March 31, 2018. Mega-sized deals continued to make
headlines, with nine transactions closed worth more than $1 billion.
The largest transaction seen was Reckitt Benckiser Group’s $17.9
billion acquisition of Mead Johnson Nutritional Company. Mead
Johnson manufactures nutritional products for infants. Additionally,
Danone acquired The WhiteWave Foods Company, a plant-based
foods and beverages manufacturer for $12.5 billion. The next largest
transaction was Campbell Soup Company’s acquisition of Snyder’s-
Lance, Inc. for $6.1 billion.
The food and beverage industry is predominately driven by strategic
buyers (including companies primarily owned by private equity
investors) with strategic transactions representing 92% of total deal
flow over the LTM. With consumers looking less at brand names and
focusing more on natural and organic goods (see page 4), large
companies are looking to remain competitive through acquisitions.
Of the 264 deals closed in the past twelve months, 187 (71%)
transactions were completed by privately owned buyers. The share
price of public companies rose by 3.47% on average on the date of
an acquisition announcement, indicating that investors are still
optimistic about growth via M&A opportunities.
The demand for locally sourced and organic foods has yet to slow
down, leading to the rise of smaller brand names in the industry. The
ongoing industry consolidation will likely continue as large
established companies look to gain recognition from local brand
names and natural/organic food.
Source: Capital IQ as of March 20, 2018.
Note: M&A deal count is defined by a list of subsectors viewed as the best representation of the industry
Market Overview2
M&A Transactions by
Subsector7
Public Company Trading
Multiples20
About Duff & Phelps27

Food and Beverage M&A Landscape – Spring 2018
3
Strategic vs. Financial
Buyer
Note: All amounts listed in USD unless otherwise noted. Includes Food & Beverage sector deals where the target was based in North America.Source: S&P Global Market Intelligence. Only transactions with over 50% of the company acquired are included in our analysis.
# of Closed Deals
56
44
61
79
66
7971
76
58
48
67
8174
52
6673
65
79
61 6460
Q1 Q2 Q3 Q4 Q1 Q2 Q3 Q4 Q1 Q2 Q3 Q4 Q1 Q2 Q3 Q4 Q1 Q2 Q3 Q4 Q1
2013 2014 2015 2016 2017 2018
Private71%
Public29%
By # of Closed Deals (LTM at Q1 2018)
Public vs. Private Buyer
Strategic92%
Financial8%
M&A Activity Continued

Food and Beverage M&A Landscape – Spring 2018
4
Demand for healthier food products continues to permeate the industry. Health conscious shoppers prefer natural, non-GMO and environmentally friendly food options, and are willing to pay more for it. A Consumer Reports study revealed that on average, organic foods were 47% more expensive than its non-organic counterpart.1
The trend towards healthier options is led by millennials, which represent approximately 29.7% of the U.S. population2 and 28.1% of the Canadian population.3 With technology allowing for quick and easy comparisons between food products, companies strive to differentiate themselves from the competition. Brand loyalty is no longer as strong of a factor for shoppers. According to the Ipsos MORI Global Trends 2017 survey, less than half of shoppers look for brand names when shopping for food items.4 There is an increased focus on local food products, with 67% of Americans and 68% of Canadians more likely to buy local produce.
Sales of health and wellness related products are outpacing total category growth by a significant margin, and the industry is clearly taking note. Significant acquisitions in the space include Danone’s acquisition of plant-based food and beverage manufacturer The WhiteWave Foods Company, Campbell Soup Company’s acquisition of natural and organic food producer Pacific Foods of Oregon, Inc., Groupe Lactalis S.A.’s acquisition of Stonyfield Farm, an organic yogurt producer and Kellogg’s acquisition of Chicago Bar, the owner of RXBAR protein bars. Most recently, The Hershey Company acquired Amplify Snack Brands, a better-for-you snack brand, for approximately $934 million. The deal closed on January 31, 2018.5
Similarly, the top three largest transactions involving a Canadian target are companies focused on healthier choices. Daiya Foods creates plant-based alternatives to dairy products, Kicking Horse provides organic and fair-trade coffees and L.B. Maple Treats provides a more natural source of sugar.
254%
3
Top Ingredients Avoided by North Americans
MSG1(% of respondents)
4
5
Antibiotics or Hormones Used
in Animal Products
Artificial Sweeteners
Artificial Preservatives
Food in a package with BPA
55%
54%
53%
53%
Source: Nielsen, 2016
4
Source: Nielsen, 2016
Growth in Sales in the United States by Claim
Organic
1
(Y-o-Y Volume Sales Growth)
2
3
5
Hormone-Free or Antibiotic-Free
GMO-Free
13.1%
21.7%
12.0%
7.5%
5.4%
Natural
Without Artificial Colors or Flavors
North America’s Health Kick Continues
1. Source: Consumer Reports
2. Source: U.S. Census Bureau
3. Source: Statistics Canada
4. Source: Ipsos
5. Source: S&P Global Market Intelligence
Food and Beverage M&A Landscape – Spring 2018
5
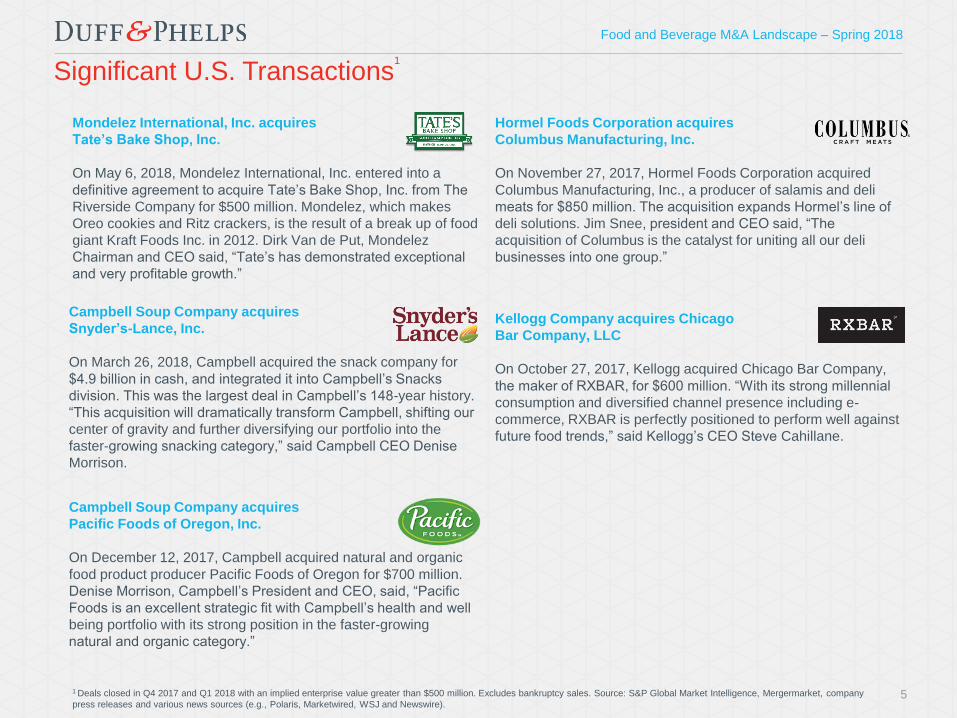
Significant U.S. Transactions1
1 Deals closed in Q4 2017 and Q1 2018 with an implied enterprise value greater than $500 million. Excludes bankruptcy sales. Source: S&P Global Market Intelligence, Mergermarket, company
press releases and various news sources (e.g., Polaris, Marketwired, WSJ and Newswire).
Campbell Soup Company acquires
Snyder’s-Lance, Inc.
On March 26, 2018, Campbell acquired the snack company for
$4.9 billion in cash, and integrated it into Campbell’s Snacks
division. This was the largest deal in Campbell’s 148-year history.
“This acquisition will dramatically transform Campbell, shifting our
center of gravity and further diversifying our portfolio into the
faster-growing snacking category,” said Campbell CEO Denise
Morrison.
Campbell Soup Company acquires
Pacific Foods of Oregon, Inc.
On December 12, 2017, Campbell acquired natural and organic
food product producer Pacific Foods of Oregon for $700 million.
Denise Morrison, Campbell’s President and CEO, said, “Pacific
Foods is an excellent strategic fit with Campbell’s health and well
being portfolio with its strong position in the faster-growing
natural and organic category.”
Hormel Foods Corporation acquires
Columbus Manufacturing, Inc.
On November 27, 2017, Hormel Foods Corporation acquired
Columbus Manufacturing, Inc., a producer of salamis and deli
meats for $850 million. The acquisition expands Hormel’s line of
deli solutions. Jim Snee, president and CEO said, “The
acquisition of Columbus is the catalyst for uniting all our deli
businesses into one group.”
Kellogg Company acquires Chicago
Bar Company, LLC
On October 27, 2017, Kellogg acquired Chicago Bar Company,
the maker of RXBAR, for $600 million. “With its strong millennial
consumption and diversified channel presence including e-
commerce, RXBAR is perfectly positioned to perform well against
future food trends,” said Kellogg’s CEO Steve Cahillane.
Mondelez International, Inc. acquires
Tate’s Bake Shop, Inc.
On May 6, 2018, Mondelez International, Inc. entered into a
definitive agreement to acquire Tate’s Bake Shop, Inc. from The
Riverside Company for $500 million. Mondelez, which makes
Oreo cookies and Ritz crackers, is the result of a break up of food
giant Kraft Foods Inc. in 2012. Dirk Van de Put, Mondelez
Chairman and CEO said, “Tate’s has demonstrated exceptional
and very profitable growth.”

Food and Beverage M&A Landscape – Spring 2018
6
Select Recent Canadian Transactions1
1 Deals closed in Q4 2017 and Q1 2018. Excludes bankruptcy sales. Source: S&P Global Market Intelligence, Mergermarket, company press releases and various news sources (e.g., Polaris,
Marketwired and Newswire.)
Agri-Marketing Corp. acquired by
Kemin Industries Inc.
On January 3, 2018, Kemin acquired the assets of its long-time
exclusive distributor Agri-Marketing Corp. Dr. Chris Nelson,
President and CEO of Kemin noted, “With this new location in
Canada, we are increasing our efforts to better serve our
current customers, as well as explore new opportunities for our
products and services to improve the quality of life for people
and animals in Canada.”
Best Cooking Pulses, Inc. acquired by
Avena Foods Limited
On January 8, 2018, Avena Foods Limited of Regina,
Saskatchewan acquired Best Cooking Pulses, Inc., located in
Manitoba. According to Peter Samson, chairman of Avena
Foods Limited, “BCP has a long-standing reputation for
providing best-in-class pulse ingredients. This partnership will
provide both companies with exciting new opportunities for our
customers and our growers.”
Pets4Life acquired by
Dane Creek Capital Corp.
On January 31, 2018, Dane Creek Capital Corp. (DCCC)
acquired Pets4Life, a leading manufacturer of gourmet frozen
raw pet food located in St. Thomas, Ontario. Pets4Life is one of
the few Canadian companies that also offers a wholly organic
line made with Certified Organic ingredients. This acquisition
marks DCCC’s second investment in the frozen raw space and
one of several planned investments in 2018.
Prairie Mushrooms Group acquired by
Highline Mushrooms
On March 7, 2018, Highline Mushrooms (a subsidiary of Fyffes
PLC) acquired Prairie Mushrooms, which continues to operate
as a subsidiary of Highline. The acquisition added five farms in
Alberta and British Columbia to expand the company’s Western
Canada operations, and is led by Prairie CEO, Duke Tran.

Food and Beverage M&A Landscape – Spring 2018
7
Recent North American M&A Activity by Subsector
General 9%
Dairy6%
Better-For-You6%
Specialty-Pet2%
Protein Producers
12%
Confectionery/Snacks6%
Agricultural15%
Ingredients5%
Bakery7%
Non-Alcoholic Beverages
11%
Alcoholic Beverages
21%
By Sector
Food and Beverage Subsector Definitions
Agricultural:Production and distribution of fresh produce.
Bakery:Production and distribution of baked goods.
Better-For-You:Differentiated food products with health benefits.
Confectionery/Snacks:Chocolate, candy, nuts and other convenient snack foods.
General:Conglomerates and general food businesses.
Dairy: Production and distribution of dairy or dairy by-products, such as cheese or yogurt.
Ingredients:Goods used in the production of other food related items.
Protein Producers:Meat and seafood producers and distributors.
Specialty-Pet:Pet food producers, distributors and retailers.
Non-Alcoholic Beverages:Beverages that do not contain alcohol.
Alcoholic Beverages:Wine, beer and spirits.
Deals by Subsector (Last Twelve Months as of Q1 2018)
Fo
od
Bev
era
ges
Source: Capital IQ as of March 20, 2018.
Note: M&A deal count is defined by a list of subsectors viewed as the best representation of the industry

Food and Beverage M&A Landscape – Spring 2018
8
Agricultural(USD in millions)
Date Target Enterprise LTM LTM EV/ EBITDA
Closed Target Location Target Business Description Acquirer Value Revenue EBITDA Revenue EBITDA Margin
3/14/2018
176 Acre Blueberry Farm
in Van Buren County,
Michigan
U.S.
176 Acre Blueberry Farm in Van Buren
County, Michigan, comprises a
blueberry farm consisting of 100
planted acres of blueberries.
Gladstone Land
Corporation$2.10 - - - - -
2/26/2018 Mann Packing Co., Inc. U.S.
Mann Packing Co., Inc. offers fresh-
cut and commodity vegetables for
retail, wholesale and foodservice
marketplaces.
Del Monte Fresh
Produce N.A., Inc.$360.85 $535.00 - 0.67x - -
12/18/2017Organic Almond Orchard
in CaliforniaU.S.
Organic Almond Orchard in California
comprises an almond orchard and is
located in the United States.
Gladstone Land
Corporation$5.90 - - - - -
12/12/2017Pacific Foods of Oregon,
Inc.U.S.
Pacific Foods of Oregon, Inc.
produces natural and organic food
products.
Campbell Investment
Company$700.00 $218.00 - 3.21x - -
11/18/2017 9020 2292 Québec Inc. CA
9020 2292 Québec Inc. engages in the
production of maple flakes, and
processing and bottling of maple syrup.
L.B. Maple Treat
Corporation$31.27 - $3.99 - 7.84x NA
Mean $220.02 $376.50 $3.99 1.94x 7.84x NA
Median $31.27 $376.50 $3.99 1.94x 7.84x NA
Recent North American M&A Activity1
1 Includes transactions where financial details were disclosed and where over 50% of the company was acquired. Source: S&P Global Market Intelligence as of March 31, 2018.

Food and Beverage M&A Landscape – Spring 2018
9
Bakery(USD in millions)
Date Target Enterprise LTM LTM EV/ EBITDA
Closed Target Location Target Business Description Acquirer Value Revenue EBITDA Revenue EBITDA Margin
2/5/2018
Sandwich Bros. of
Wisconsin Business of
Kangaroo Brands, Inc.
U.S.
Sandwhich Bros. of Wisconsin is a
Milwaukee-based maker of frozen
flatbread sandwiches.
Conagra Brands, Inc. - $60.00 - - - -
2/1/2018Certain U.S. Breakfast
Assets of Aryzta LLCU.S.
Certain U.S. Breakfast Assets of
Aryzta LLC comprises $10 million of
inventory and the property, plant,
equipment and customer relationships
serviced by the Chicago Cloverhill
bakery facility.
Hostess Brands, Inc. $25.00 - - - - -
10/16/2017 East Balt, Inc. U.S.
East Balt, Inc. produces buns, bagels,
English muffins, tortillas, breads and
specialty bakery products.
Grupo Bimbo, S.A.B.
de C.V.$650.00 $420.00 $70.00 1.55x 9.29x 16.67%
Mean $337.50 $240.00 $70.00 1.55x 9.29x 16.67%
Median $337.50 $240.00 $70.00 1.55x 9.29x 16.67%
Recent North American M&A Activity1
1 Includes transactions where financial details were disclosed and where over 50% of the company was acquired. Source: S&P Global Market Intelligence as of March 31, 2018.

Food and Beverage M&A Landscape – Spring 2018
10
Better-For-You(USD in millions)
Date Target Enterprise LTM LTM EV/ EBITDA
Closed Target Location Target Business Description Acquirer Value Revenue EBITDA Revenue EBITDA Margin
1/31/2018 Amplify Snack Brands, Inc. U.S.
Amplify Snack Brands, Inc. develops,
markets and distributes better-for-you
snack products in North America and
internationally.
The Hershey
Company$1,527.30 $371.67 $82.45 4.11x 18.53x 22.18%
1/29/2018Field Roast Grain Meat
Co., Inc.U.S.
Field Roast Grain Meat Co., Inc.
produces and markets vegan meat
products.
Maple Leaf Foods Inc. $120.00 $38.00 - 3.16x - -
1/24/2018Galaxy Nutritional Foods,
Inc.U.S.
Galaxy Nutritional Foods, Inc.
produces plant-based, cheese-free
products.
GreenSpace Brands
Inc.$16.91 $16.30 - 1.04x - -
12/13/2017 Inventure Foods, Inc. U.S.
Inventure Foods, Inc. manufactures
and markets healthy/natural and
indulgent specialty snack food
products in the United States and
internationally.
Utz Quality Foods,
LLC$140.54 $272.30 $2.12 0.52x - 0.78%
10/27/2017Chicago Bar Company
LLCU.S.
Chicago Bar Company LLC, doing
business as RXBAR, produces and
sells food protein bars in the United
States.
Kellogg Company $600.00 - - 5.00x - -
Mean $480.95 $174.57 $42.28 2.76x 18.53x 11.48%
Median $140.54 $155.15 $42.28 3.16x - 11.48%
Recent North American M&A Activity1
1 Includes transactions where financial details were disclosed and where over 50% of the company was acquired. Source: S&P Global Market Intelligence as of March 31, 2018.

Food and Beverage M&A Landscape – Spring 2018
11
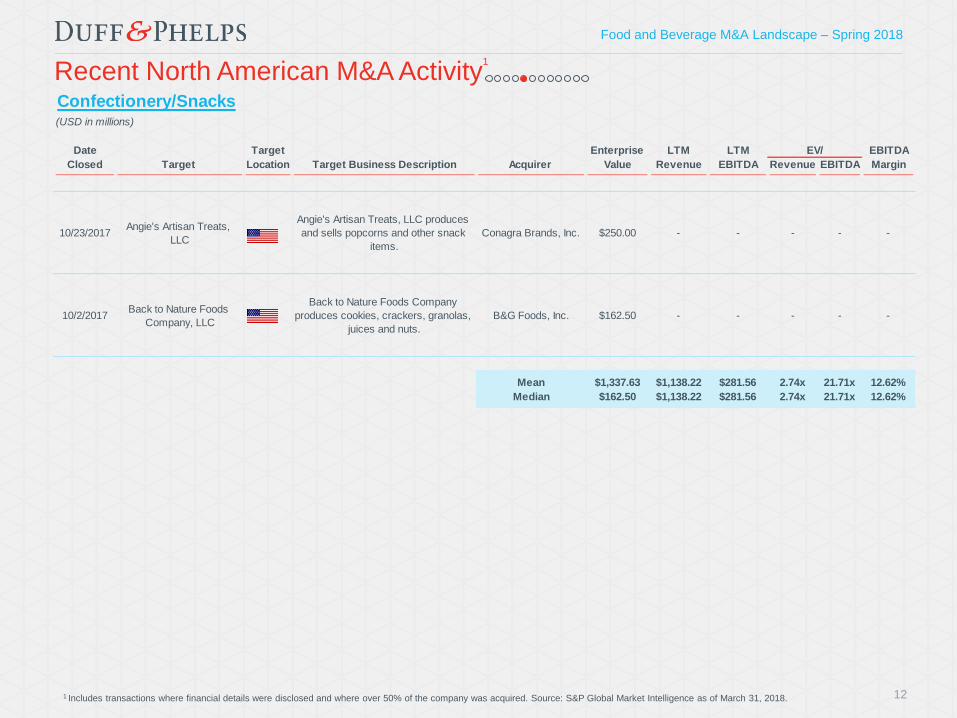
Confectionery/Snacks(USD in millions)
Date Target Enterprise LTM LTM EV/ EBITDA
Closed Target Location Target Business Description Acquirer Value Revenue EBITDA Revenue EBITDA Margin
3/31/2018U.S. Confectionery
Business of Nestlé S.A.U.S.
As of March 31, 2018, U.S.
Confectionery Business of Nestlé S.A.
was acquired by Ferrero International
S.A.
Ferrero International
S.A.$2,800.00 - - - - -
3/26/2018 Snyder's-Lance, Inc. U.S.
Snyder's-Lance, Inc. engages in the
manufacture, distribution, marketing
and sale of snack food products in
North America and Europe.
Campbell Soup
Company$6,113.59 $2,231.44 $281.56 2.74x 21.71x 12.62%
3/14/2018
Brands and Macadamia
Snack Business of Royal
Hawaiian Macadamia Nut,
Inc.
U.S.
Brands and Macadamia Snack
Business of Royal Hawaiian
Macadamia Nut, Inc. engages in
marketing and retail sale of
macadamia nuts.
MacFarms Of Hawaii,
LLC$2.71 - - - - -
2/28/2018
Royal Hawaiian Orchards
brand of Royal Hawaiian
Orchards, LP
U.S.
Royal Hawaiian Orchards brand of
Royal Hawaiian Orchards, LP
comprises macadamia nut-based
snacks business.
Buderim Group
Limited$3.09 - - - - -
11/30/2017Squirrel Brand LP, Certain
AssetsU.S.
Certain Assets of Squirrel Brand LP,
comprises roasted and flavored nuts
manufacturing business.
John B. Sanfilippo &
Son, Inc.$31.50 - - - - -
11/27/2017Old Lyme Gourmet
CompanyU.S.
Old Lyme Gourmet Company, doing
business as, Deep River Snacks
produces and sells snacks.
Arca Continental, S.
A. B. de C. V.- $45.00 - - - -
Recent North American M&A Activity1
1 Includes transactions where financial details were disclosed and where over 50% of the company was acquired. Source: S&P Global Market Intelligence as of March 31, 2018.
Food and Beverage M&A Landscape – Spring 2018
12
Confectionery/Snacks(USD in millions)
Date Target Enterprise LTM LTM EV/ EBITDA
Closed Target Location Target Business Description Acquirer Value Revenue EBITDA Revenue EBITDA Margin
10/23/2017Angie's Artisan Treats,
LLCU.S.
Angie's Artisan Treats, LLC produces
and sells popcorns and other snack
items.
Conagra Brands, Inc. $250.00 - - - - -
10/2/2017Back to Nature Foods
Company, LLCU.S.
Back to Nature Foods Company
produces cookies, crackers, granolas,
juices and nuts.
B&G Foods, Inc. $162.50 - - - - -
Mean $1,337.63 $1,138.22 $281.56 2.74x 21.71x 12.62%
Median $162.50 $1,138.22 $281.56 2.74x 21.71x 12.62%
Recent North American M&A Activity1
1 Includes transactions where financial details were disclosed and where over 50% of the company was acquired. Source: S&P Global Market Intelligence as of March 31, 2018.

Food and Beverage M&A Landscape – Spring 2018
13
General (USD in millions)
Date Target Enterprise LTM LTM EV/ EBITDA
Closed Target Location Target Business Description Acquirer Value Revenue EBITDA Revenue EBITDA Margin
1/12/2018 Bob Evans Farms, Inc. U.S.
Bob Evans Farms, Inc. produces and
distributes food products for grocery
retailers in the United States.
Post Holdings, Inc. $1,741.35 $418.17 $64.75 4.16x 26.90x 15.48%
11/30/2017All assets of Groupe
Commensal Inc.CA
All assets of Groupe Commensal Inc.
comprises manufacturing operations
of commensal products for
restaurants.
Unknown/Individual
Buyer(s)$3.34 - - - - -
11/10/2017Original Philly Holdings,
Inc.U.S.
Original Philly Holdings, Inc., through
its subsidiaries, produces raw and
fully cooked Philly-style sandwich
steak and cheesesteak appetizer
products.
Tyson Foods, Inc. $226.00 $130.00 - 1.74x - -
11/2/2017Preferred Brands
International Inc.U.S.
Preferred Brands International Inc.
produces ready-to-eat Indian entrees,
Asian noodles and rice products.
Effem Holdings
Limited$172.83 - - - - -
Mean $535.88 $274.08 $64.75 2.95x 26.90x 15.48%
Median $199.41 $274.08 $64.75 2.95x 26.90x 15.48%
Recent North American M&A Activity1
1 Includes transactions where financial details were disclosed and where over 50% of the company was acquired. Source: S&P Global Market Intelligence as of March 31, 2018.

Food and Beverage M&A Landscape – Spring 2018
14
Dairy(USD in millions)
Date Target Enterprise LTM LTM EV/ EBITDA
Closed Target Location Target Business Description Acquirer Value Revenue EBITDA Revenue EBITDA Margin
12/12/2017 Betin, Inc U.S.
Betin, Inc, doing business as
Montchevre, produces and sells goat
cheese.
Saputo Inc. $263.94 $116.44 - 2.27x - -
Mean $263.94 $116.44 NA 2.27x NA NA
Median $263.94 $116.44 NA 2.27x NA NA
Recent North American M&A Activity1
1 Includes transactions where financial details were disclosed and where over 50% of the company was acquired. Source: S&P Global Market Intelligence as of March 31, 2018.

Food and Beverage M&A Landscape – Spring 2018
15
Ingredients(USD in millions)
Date Target Enterprise LTM LTM EV/ EBITDA
Closed Target Location Target Business Description Acquirer Value Revenue EBITDA Revenue EBITDA Margin
2/27/2018 ERS Holdings, LLC U.S.
ERS Holdings, LLC develops Ready
To Infuse Cannabis (RTIC) technology
transforming cannabis oil into powder
for infusion into food and beverage
products.
Pivot
Pharmaceuticals Inc.$6.25 - - - - -
1/30/2018 Minsa Corporation U.S.
Minsa Corporation owns and operates
corn flour manufacturing plant and
engages in the production and sale of
corn flour.
Bunge North America,
Inc.$75.00 - - - - -
12/4/2017
Gertrude Hawk
Chocolates, Inc.,
Ingredients Division
U.S.
Gertrude Hawk Chocolates, Inc.,
Ingredients Division comprises the
manufacturing of small peanut butter
cups and specialty chocolate
ingredients for ice cream and snack
food manufacturers.
Barry Callebaut AG - $83.00 - - - -
Mean $40.63 $83.00 NA NA NA NA
Median $40.63 $83.00 NA NA NA NA
Recent North American M&A Activity1
1 Includes transactions where financial details were disclosed and where over 50% of the company was acquired. Source: S&P Global Market Intelligence as of March 31, 2018.

Food and Beverage M&A Landscape – Spring 2018
16
Protein Producers(USD in millions)
Date Target Enterprise LTM LTM EV/ EBITDA
Closed Target Location Target Business Description Acquirer Value Revenue EBITDA Revenue EBITDA Margin
11/27/2017Columbus Manufacturing,
Inc.U.S.
Columbus Manufacturing, Inc.
produces salamis and deli meats.
Hormel Foods
Corporation- $300.00 - - - -
11/1/2017Joseph Epstein Food
Enterprises, Inc.U.S.
Joseph Epstein Food Enterprises, Inc.
manufactures food products, which
includes turkey meatballs.
MamaMancini's
Holdings, Inc.$5.29 - - - - -
Mean $5.29 $300.00 NA NA NA NA
Median $5.29 $300.00 NA NA NA NA
Recent North American M&A Activity1
1 Includes transactions where financial details were disclosed and where over 50% of the company was acquired. Source: S&P Global Market Intelligence as of March 31, 2018.

Food and Beverage M&A Landscape – Spring 2018
17
Specialty-Pet(USD in millions)
Date Target Enterprise LTM LTM EV/ EBITDA
Closed Target Location Target Business Description Acquirer Value Revenue EBITDA Revenue EBITDA Margin
12/19/2017Omega Protein
CorporationU.S.
Omega Protein Corporation develops,
produces and delivers products to
enhance the nutritional integrity of
foods, dietary supplements and animal
feeds worldwide.
Cooke Inc. $487.67 $342.36 $60.20 1.4x 8.1x 17.58%
Mean $487.67 $342.36 $60.20 1.42x 8.10x 17.58%
Median $487.67 $342.36 $60.20 1.42x 8.10x 17.58%
Recent North American M&A Activity1
1 Includes transactions where financial details were disclosed and where over 50% of the company was acquired. Source: S&P Global Market Intelligence as of March 31, 2018.
Food and Beverage M&A Landscape – Spring 2018
18
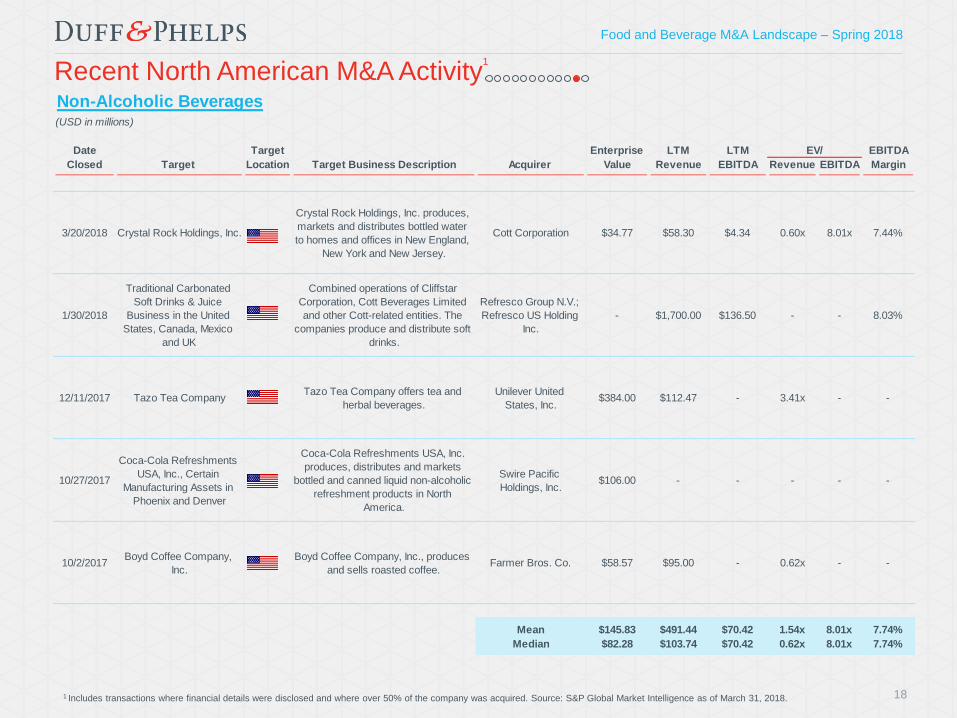
Non-Alcoholic Beverages(USD in millions)
Date Target Enterprise LTM LTM EV/ EBITDA
Closed Target Location Target Business Description Acquirer Value Revenue EBITDA Revenue EBITDA Margin
3/20/2018 Crystal Rock Holdings, Inc. U.S.
Crystal Rock Holdings, Inc. produces,
markets and distributes bottled water
to homes and offices in New England,
New York and New Jersey.
Cott Corporation $34.77 $58.30 $4.34 0.60x 8.01x 7.44%
1/30/2018
Traditional Carbonated
Soft Drinks & Juice
Business in the United
States, Canada, Mexico
and UK
U.S.
Combined operations of Cliffstar
Corporation, Cott Beverages Limited
and other Cott-related entities. The
companies produce and distribute soft
drinks.
Refresco Group N.V.;
Refresco US Holding
Inc.
- $1,700.00 $136.50 - - 8.03%
12/11/2017 Tazo Tea Company U.S.Tazo Tea Company offers tea and
herbal beverages.
Unilever United
States, Inc.$384.00 $112.47 - 3.41x - -
10/27/2017
Coca-Cola Refreshments
USA, Inc., Certain
Manufacturing Assets in
Phoenix and Denver
U.S.
Coca-Cola Refreshments USA, Inc.
produces, distributes and markets
bottled and canned liquid non-alcoholic
refreshment products in North
America.
Swire Pacific
Holdings, Inc.$106.00 - - - - -
10/2/2017Boyd Coffee Company,
Inc.U.S.
Boyd Coffee Company, Inc., produces
and sells roasted coffee.Farmer Bros. Co. $58.57 $95.00 - 0.62x - -
Mean $145.83 $491.44 $70.42 1.54x 8.01x 7.74%
Median $82.28 $103.74 $70.42 0.62x 8.01x 7.74%
Recent North American M&A Activity1
1 Includes transactions where financial details were disclosed and where over 50% of the company was acquired. Source: S&P Global Market Intelligence as of March 31, 2018.

Food and Beverage M&A Landscape – Spring 2018
19
Alcoholic Beverages(USD in millions)
Date Target Enterprise LTM LTM EV/ EBITDA
Closed Target Location Target Business Description Acquirer Value Revenue EBITDA Revenue EBITDA Margin
1/25/2018Evans Brewing Company
Inc.U.S.
Evans Brewing Company Inc.
produces and sells craft beer in the
United States.
I-ON Communications
Co., Ltd. (nka:I-ON
Communications
Corp.)
- $2.32 ($0.94) - - -
12/31/2017Record Street Brewing
CompanyU.S.
Record Street Brewing Company
produces beer.UPD Holding Corp. $1.60 - - - - -
10/2/2017
Vinnova Corporation
(nka:The Foreign Affair
Winery Ltd.)
CAVinnova Corporation produces wine
under the brand Foreign Affair Winery.
Corby Spirit and Wine
Limited$4.96 - - - - -
10/1/2017Tinhorn Creek Vineyards
Ltd.CA
Tinhorn Creek Vineyards Ltd.
produces red and white wines in
Canada.
Andrew Peller Limited $23.78 $5.76 - 4.13x - -
Mean $10.11 $4.04 ($0.94) 4.13x NA NA
Median $4.96 $4.04 ($0.94) 4.13x NA NA
Recent North American M&A Activity1
1 Includes transactions where financial details were disclosed and where over 50% of the company was acquired. Source: S&P Global Market Intelligence as of March 31, 2018.

Food and Beverage M&A Landscape – Spring 2018
20
▪ Enterprise Value to LTM EBITDA multiples for Food and Beverage companies have continued to increase when compared to median multiples of
the preceding five years across all food segments (see pages 21 and 22 for historical multiples by subsector).
▪ As of the close of Q1 2018, Specialty Pet, Non-Alcoholic Beverages and Better-for-You companies commanded the highest median EBITDA
multiples–with all three subsectors benefiting from continued growth and innovation in the sector as consumers move towards healthier lifestyles for
themselves and their pets.
▪ Key food trends have supported valuations for other subsectors–for example, increasing demand for specialty foods has steadily driven multiples for
Ingredients companies to a median of 15.5x in Q1 2018; whereas Confectionery/Snacks companies have benefitted from growing trends towards
convenience food choices, keeping median multiples near the 14.0x level in the first quarter.
▪ After three years of stable EBITDA multiples, alcoholic beverage companies saw their median EBITDA multiples drop in recent trading, reaching
14.4x in Q1 2018. This is largely due to consumer preferences shifting from traditional brands towards more premium wines and craft and specialty
beers. The established alcoholic beverage companies have seen a decline in revenue growth.
▪ Multiples for agricultural products have seen a significant rise recently, increasing to a median of 13.7x in Q1 2018 compared to an average of 9.6x
for the past five years; demand for agricultural products should continue to grow as end consumers move towards natural food sources.
Note: Sector constituents based on selected comparable companies; certain periods exclude outliers based on Duff & Phelps analysis; EBITDA does not reflect adjustments for extraordinary items.
EV = Enterprise Value = Market Capitalization + Total Debt + Preferred Equity – Cash and Short Term Investments. LTM = last twelve months. Source: S&P Global Market Intelligence; Q1 2018 as of close of March
31, 2018.
Public Company Trading Multiples
Source: S&P Global Market Intelligence; IBIS World 2016 Breweries in Canada and Distilleries in Canada; LCBO Annual Report
EV/LTM EBITDA Median Multiples by Subsector – close of Q1 2018
25.2x
16.3x 16.0x 15.5x14.4x 13.9x 13.7x
12.1x 11.5x
9.6x 9.3x
Median
13.8x

Food and Beverage M&A Landscape – Spring 2018
21
Agricultural Products Bakery Better-For-YouConfectionery/
Snacks
5-year median
EV/LTM EBITDA Median Multiples – Food Segments (Q1 2018)
Public Company Trading Multiples
General Dairy Ingredients Protein Producers
Note: Sector constituents based on selected comparable companies; certain periods exclude outliers based on Duff & Phelps analysis; EBITDA does not reflect adjustments for extraordinary items.
EV = Enterprise Value = Market Capitalization + Total Debt + Preferred Equity – Cash and Short Term Investments. LTM = last twelve months. Source: S&P Global Market Intelligence; Q1 2018 as of close of March
31, 2018.
Source: S&P Global Market Intelligence; IBIS World 2016 Breweries in Canada and Distilleries in Canada; LCBO Annual Report
9.5x
11.6x
10.2x9.7x
15.4x
13.2x
10.9x11.4x
10.2x 10.4x
11.9x 12.2x
17.3x18.7x
13.6x13.3x
18.2x
16.0x
14.0x
15.0x
13.3x
14.8x16.0x
13.8x
11.8x12.8x
14.0x 13.9x13.2x
11.5x 12.0x
13.5x14.0x
15.3x14.4x
9.2x
12.1x12.5x 12.9x 13.3x
14.1x
15.4x
9.9x
11.2x
8.6x9.1x
10.0x 9.6x
11.6x 11.2x
16.2x
14.5x
12.9x 13.1x 13.4x
9.7x

Food and Beverage M&A Landscape – Spring 2018
22
*Insufficient comparable companies from 2013–2018.
5-year median
EV/LTM EBITDA Median Multiples – Food Segments (Q1 2018)
Public Company Trading Multiples
Specialty–Pet* Non-Alcoholic Beverages Alcoholic BeveragesSpecialty-Pet*
Note: Sector constituents based on selected comparable companies; certain periods exclude outliers based on Duff & Phelps analysis; EBITDA does not reflect adjustments for extraordinary items.
EV = Enterprise Value = Market Capitalization + Total Debt + Preferred Equity – Cash and Short Term Investments. LTM = last twelve months. Source: S&P Global Market Intelligence; Q1 2018 as of close of March
31, 2018.
Source: S&P Global Market Intelligence; IBIS World 2016 Breweries in Canada and Distilleries in Canada; LCBO Annual Report
17.7x
21.7x
25.2x
11.9x12.7x
13.9x
16.1x 15.2x16.7x
18.0x17.1x 17.1x 17.2x
15.7x14.4x
21.5x
14.4x
16.6x

Food and Beverage M&A Landscape – Spring 2018
23
Five Year Revenue Growth Rate (CAGR)1 - Range and Median (Q1 2018)*
*Specialty-Pet companies were excluded due to insufficient data.1 The values above represent high, median and low data points for each category as of March 31, 2018. Source: S&P Global Market Intelligence; Q1 2018 as of close of March 31, 2018.
Enterprise Value/LTM EBITDA (by Sector)1 - Range and Median (Q1 2018)*
Select Public Company Operating and Trading Statistics
13.9%
8.1%13.6%
42.6%
23.2%
10.6%15.2%
12.1% 10.3%
22.1%
5.4% 6.7% 8.9%3.2% 3.7%
7.9%
1.3% 2.9% 2.4%
15.0%
0.7%5.3% 4.2%
-5.6%
-11.3%
-3.4%-7.6%
-2.9%-6.7%
2.8%
21.7x
12.2x
18.3x 18.9x
23.0x
13.4x
21.3x
13.6x
24.3x 25.0x
13.2x12.1x
16.0x13.8x
11.5x9.3x
15.7x
9.6x
16.7x14.4x
10.4x
7.7x
14.3x
10.3x8.6x
5.2x
9.7x
4.6x
13.7x11.5x

Food and Beverage M&A Landscape – Spring 2018
24
Public Company Trading Statistics
Source: S&P Global Market Intelligence as of March 31, 2018. Specific company selection based on a minimum value of $100MM of previous fiscal year’s revenue.
Definitions
CAGR: Compounded Annual Growth Rate
EBITDA: Earnings Before Interest, Taxes, Depreciation, and Amortization. EBITDA does not reflect adjustments for extraordinary items.
Enterprise Value: Market Capitalization + Total Debt + Preferred Equity + Minority Interest – Cash and Short Term Investments
LTM: Last Twelve Months
(USD in millions, except per share data)
31-Mar-18 % of Operating Metrics (LTM) Enterprise Value as a Multiple of
Stock 52-Wk Market Enterprise Revenue EBITDA Ret. on Net Debt/ Revenue EBITDA
Company HQ Price High Cap. Value Revenue CAGR, 5-Yr. Margin Assets Assets EBITDA LTM 2018E 2019E LTM 2018E 2019E
Agricultural Products
Lamb Weston Holdings, Inc. U.S. 58.22$ 96% 8,514$ 10,979$ 3,338$ NA 23.8% 2,754$ 14.0% 3.3x 3.3x 3.2x 3.1x 13.8x 13.8x 12.7x
Fresh Del Monte Produce Inc. U.S. 45.24 73% 2,205 2,554 4,160 3.9% 5.9% 3,347 3.4% 3.1x 0.6x NA NA 10.4x NA NA
Calavo Growers, Inc. U.S. 92.20 96% 1,618 1,648 1,097 13.9% 6.9% 361 11.1% 0.4x 1.5x 1.4x 1.2x 21.7x 19.3x 16.4x
Lassonde Industries Inc. CA 203.16 97% 1,420 1,577 1,217 8.3% 11.8% 842 7.8% 0.9x 1.3x 1.3x 1.2x 11.0x 10.4x 9.5x
Rogers Sugar Inc. CA 4.81 89% 508 768 584 5.7% 10.5% 646 5.5% 4.2x 1.3x 1.2x 1.2x 12.5x 9.7x 9.4x
Seneca Foods Corporation U.S. 27.70 73% 270 725 1,315 0.7% 3.2% 1,072 0.7% 10.6x 0.6x NA NA 17.2x NA NA
Landec Corporation U.S. 13.05 87% 360 415 537 5.2% NM 386 NM 1.9x 0.8x 0.8x 0.8x 15.7x 15.7x 14.0x
Median 89% 1,420$ 1,577$ 1,217$ 5.4% 8.7% 842$ 6.6% 3.1x 1.3x 1.3x 1.2x 13.8x 13.8x 12.7x
Mean 87% 2,128 2,667 1,750 6.3% 10.3% 1,344 7.1% 3.5x 1.3x 1.6x 1.5x 14.6x 13.8x 12.4x
Bakery
George Weston Limited CA 80.43$ 83% 10,292$ 24,208$ 38,508$ 8.1% 8.2% 30,699$ 4.1% 2.6x 0.6x 0.6x 0.6x 7.7x 7.4x 7.2x
Flowers Foods, Inc. U.S. 21.86 100% 4,608 5,437 3,921 5.3% 11.4% 2,660 7.0% 1.9x 1.4x 1.4x 1.4x 12.2x 11.7x 11.0x
Hostess Brands, Inc. U.S. 14.79 86% 1,478 2,683 776 NA 28.6% 2,966 4.0% 3.9x 3.5x 3.1x 3.0x 12.1x 11.9x 10.5x
Median 86% 4,608$ 5,437$ 3,921$ 6.7% 11.4% 2,966$ 4.1% 2.6x 1.4x 1.4x 1.4x 12.1x 11.7x 10.5x
Mean 89% 5,459 10,776 14,402 6.7% 16.1% 12,108 5.1% 2.8x 1.8x 1.7x 1.7x 10.6x 10.3x 9.6x
Better-For-You
The Hain Celestial Group, Inc. U.S. 32.07$ 70% 3,333$ 3,961$ 2,915$ 13.6% 9.5% 3,087$ 4.3% 2.3x 1.4x 1.3x 1.3x 14.3x 11.8x 10.9x
SunOpta Inc. CA 7.13 68% 619 1,145 1,280 4.2% 4.9% 982 1.8% 7.3x 0.9x 0.9x 0.9x 18.3x 12.8x 10.8x
The Simply Good Foods Company U.S. 13.73 86% 969 1,099 410 NA 16.8% 953 NA 1.6x 2.7x 2.6x 2.5x 16.0x 14.8x 14.0x
Median 70% 969$ 1,145$ 1,280$ 8.9% 9.5% 982$ 3.0% 2.3x 1.4x 1.3x 1.3x 16.0x 12.8x 10.9x
Mean 75% 1,640 2,068 1,535 8.9% 10.4% 1,674 3.0% 3.7x 1.6x 1.6x 1.6x 16.2x 13.1x 11.9x
Confectionery/Snacks
Mondelez International, Inc. U.S. 41.73$ 88% 61,555$ 79,527$ 26,247$ -5.6% 20.7% 64,503$ 4.1% 3.7x 3.0x 3.0x 2.9x 14.6x 14.6x 13.6x
The Hershey Company U.S. 98.96 85% 20,709 23,386 7,608 2.5% 23.7% 5,554 17.5% 1.4x 3.1x 3.0x 2.9x 13.0x 12.4x 12.0x
Post Holdings, Inc. U.S. 75.76 85% 5,206 11,013 5,740 42.6% 18.6% 12,673 4.1% 6.6x 1.9x 1.8x 1.7x 10.3x 8.9x 8.2x
J&J Snack Foods Corp. U.S. 136.56 87% 2,554 2,421 1,143 5.8% 14.3% 888 8.7% NA 2.1x 2.1x 2.0x 14.8x 14.5x 13.5x
Tootsie Roll Industries, Inc. U.S. 29.45 77% 1,897 1,902 519 -1.1% 19.4% 931 5.5% NA 3.7x NA NA 18.9x NA NA
John B. Sanfilippo & Son, Inc. U.S. 57.87 77% 656 724 879 4.0% 7.9% 426 8.2% 1.4x 0.8x 0.8x 0.8x 10.4x 9.9x 8.9x
Median 85% 3,880$ 6,717$ 3,442$ 3.2% 19.0% 3,242$ 6.8% 2.6x 2.6x 2.1x 2.0x 13.8x 12.4x 12.0x
Mean 83% 15,429 19,829 7,023 8.0% 17.5% 14,162 8.0% 3.3x 2.4x 2.1x 2.1x 13.7x 12.1x 11.3x

Food and Beverage M&A Landscape – Spring 2018
25
Public Company Trading Statistics
Source: S&P Global Market Intelligence as of March 31, 2018; for definitions refer to page 24.
(USD in millions, except per share data)
31-Mar-18 % of Operating Metrics (LTM) Enterprise Value as a Multiple of
Stock 52-Wk Market Enterprise Revenue EBITDA Ret. on Net Debt/ Revenue EBITDA
Company HQ Price High Cap. Value Revenue CAGR, 5-Yr. Margin Assets Assets EBITDA LTM 2018E 2019E LTM 2018E 2019E
General
The Kraft Heinz Company U.S. 62.29$ 66% 75,942$ 106,044$ 26,232$ NA 31.7% 120,232$ 3.8% 3.6x 4.0x 3.9x 4.0x 12.8x 12.5x 13.2x
General Mills, Inc. U.S. 45.06 74% 26,716 36,574 15,657 -2.1% 21.0% 22,241 7.5% 2.7x 2.3x 2.3x 2.1x 11.1x 11.2x 10.0x
Kellogg Company U.S. 65.01 88% 22,532 30,882 13,076 -2.2% 24.1% 16,702 10.4% 2.7x 2.4x 2.3x 2.3x 9.8x 12.0x 11.4x
The J. M. Smucker Company U.S. 124.01 92% 14,087 18,844 7,360 4.5% 22.2% 15,329 4.9% 2.9x 2.6x 2.6x 2.5x 11.5x 11.2x 10.8x
Conagra Brands, Inc. U.S. 36.88 90% 14,513 18,306 7,834 -11.3% 19.1% 10,463 7.2% 2.5x 2.3x 2.3x 2.3x 12.3x 12.2x 12.1x
Campbell Soup Company U.S. 43.31 73% 13,020 16,727 7,858 1.6% 24.9% 8,336 12.8% 1.9x 2.1x 1.9x 1.6x 8.6x 9.0x 7.9x
Pinnacle Foods Inc. U.S. 54.10 81% 6,447 9,153 3,157 5.0% 20.8% 6,578 5.3% 4.1x 2.9x 2.9x 2.9x 14.0x 13.0x 12.3x
TreeHouse Foods, Inc. U.S. 38.27 42% 2,156 4,546 6,252 23.2% 8.3% 5,786 2.6% 4.6x 0.7x 0.7x 0.7x 8.7x 8.3x 7.8x
B&G Foods, Inc. U.S. 23.70 55% 1,578 3,589 1,687 21.1% 18.6% 3,439 5.1% 6.3x 2.1x 2.1x 2.1x 11.4x 10.2x 9.9x
Premium Brands Holdings Corporation CA 91.89 100% 2,859 3,338 1,753 18.0% 8.3% 1,164 6.9% 3.4x 1.9x 1.5x 1.3x 23.0x 15.5x 13.1x
Lancaster Colony Corporation U.S. 123.14 91% 3,384 3,202 1,205 2.9% 16.6% 787 14.5% NA 2.7x 2.6x 2.6x 16.0x 16.2x 14.6x
Median 81% 13,020$ 16,727$ 7,360$ 3.7% 20.8% 8,336$ 6.9% 3.2x 2.3x 2.3x 2.3x 11.5x 12.0x 11.4x
Mean 77% 16,658 22,837 8,370 6.1% 19.6% 19,187 7.3% 3.5x 2.4x 2.3x 2.2x 12.6x 11.9x 11.2x
Dairy
Saputo Inc. CA 32.07$ 87% 12,422$ 13,713$ 9,184$ 10.6% 11.2% 6,377$ 8.5% 1.3x 1.5x 1.5x 1.3x 13.4x 13.6x 11.9x
Dean Foods Company U.S. 8.62 43% 787 1,684 7,795 -3.4% 4.2% 2,504 3.8% 2.7x 0.2x 0.2x 0.2x 5.2x 5.5x 5.2x
Lifeway Foods, Inc. U.S. 5.99 54% 95 95 119 7.9% 2.2% 65 -0.5% 0.5x 0.8x 0.9x 0.8x 36.8x NA NA
Median 54% 787$ 1,684$ 7,795$ 7.9% 4.2% 2,504$ 3.8% 1.3x 0.8x 0.9x 0.8x 13.4x 9.5x 8.5x
Mean 61% 4,435 5,164 5,699 5.0% 5.8% 2,982 3.9% 1.5x 0.8x 0.9x 0.8x 18.4x 9.5x 8.5x
Ingredients
Archer-Daniels-Midland Company U.S. 43.37$ 94% 24,252$ 30,989$ 61,366$ -7.6% 4.7% 41,100$ 2.4% 3.3x 0.5x 0.5x 0.5x 10.7x 9.7x 9.3x
McCormick & Company, Incorporated U.S. 106.39 95% 13,964 18,932 5,028 4.5% 19.8% 10,363 7.0% 5.2x 3.8x 3.5x 3.3x 19.0x 16.9x 15.8x
Bunge Limited U.S. 73.94 88% 10,418 15,314 45,314 -6.3% 2.2% 23,084 1.1% 6.2x 0.3x 0.3x 0.3x 15.4x 7.9x 7.7x
International Flavors & Fragrances Inc. U.S. 136.91 87% 10,804 12,080 3,399 3.8% 22.2% 4,599 9.3% 1.7x 3.6x 3.3x 3.2x 16.0x 15.3x 14.3x
Ingredion Incorporated U.S. 128.92 88% 9,313 10,599 5,848 -2.2% 18.6% 5,975 9.3% 1.1x 1.8x 1.8x 1.7x 9.7x 9.5x 9.1x
Sensient Technologies Corporation U.S. 70.58 83% 3,018 3,613 1,377 -1.1% 19.2% 1,775 7.9% 2.6x 2.6x 2.5x 2.4x 13.6x 12.9x 12.2x
Balchem Corporation U.S. 81.75 92% 2,619 2,798 618 14.2% 23.8% 968 6.8% 1.1x 4.5x 4.5x 4.3x 19.0x 17.7x 17.3x
AGT Food and Ingredients Inc. CA 12.94 51% 314 794 1,384 15.2% 2.7% 956 0.8% 10.1x 0.6x 0.5x 0.5x 21.3x 13.6x 9.7x
Median 88% 9,866$ 11,339$ 4,213$ 1.3% 18.9% 5,287$ 6.9% 2.9x 2.2x 2.2x 2.1x 15.7x 13.2x 10.9x
Mean 89% 9,338 11,890 15,542 2.5% 14.2% 11,103 5.6% 3.9x 2.2x 2.1x 2.0x 15.6x 13.0x 11.9x

Food and Beverage M&A Landscape – Spring 2018
26
Public Company Trading Statistics
Source: S&P Global Market Intelligence as of March 31, 2018; for definitions refer to page 24.
(USD in millions, except per share data)
31-Mar-18 % of Operating Metrics (LTM) Enterprise Value as a Multiple of
Stock 52-Wk Market Enterprise Revenue EBITDA Ret. on Net Debt/ Revenue EBITDA
Company HQ Price High Cap. Value Revenue CAGR, 5-Yr. Margin Assets Assets EBITDA LTM 2018E 2019E LTM 2018E 2019E
Protein Producers
Tyson Foods, Inc. U.S. 73.19$ 86% 26,898$ 36,308$ 39,307$ 3.5% 10.1% 28,046$ 7.9% 2.4x 0.9x 0.9x 0.9x 9.2x 8.2x 8.2x
Hormel Foods Corporation U.S. 34.32 90% 18,174 18,672 9,219 2.1% 14.9% 7,859 10.4% 0.4x 2.0x 1.9x 1.8x 13.6x 13.3x 12.4x
Pilgrim's Pride Corporation U.S. 24.61 64% 6,127 8,289 10,768 5.8% 12.7% 6,249 12.2% 1.6x 0.8x 0.7x 0.7x 6.1x 6.0x 6.0x
Seaboard Corporation U.S. 4,265.00 91% 4,992 4,008 5,989 -1.0% 6.2% 5,255 3.2% NA 0.7x NA NA 10.8x NA NA
Maple Leaf Foods Inc. CA 24.35 85% 3,084 2,922 2,736 -2.9% 9.0% 2,106 5.5% NA 1.1x 1.1x 1.0x 11.8x 9.6x 8.7x
Sanderson Farms, Inc. U.S. 119.02 67% 2,718 2,329 3,426 6.8% 14.9% 1,722 16.0% NA 0.7x 0.7x 0.6x 4.6x 5.9x 6.1x
Cal-Maine Foods, Inc. U.S. 43.70 87% 2,125 1,924 1,334 1.5% 8.3% 1,144 3.1% NA 1.4x 1.3x 1.3x NM 8.7x 9.3x
High Liner Foods Incorporated CA 8.65 52% 289 663 1,054 2.3% 5.2% 908 3.1% 7.0x 0.6x 0.6x 0.6x 12.0x 8.8x 8.3x
Clearwater Seafoods Incorporated CA 3.55 38% 227 580 495 12.1% 15.6% 615 4.3% 4.6x 1.2x 1.2x 1.2x 7.5x 7.4x 6.8x
Bridgford Foods Corporation U.S. 14.96 69% 136 129 168 5.6% 8.0% 92 6.8% NA 0.8x NA NA 9.6x NA NA
Median 77% 2,901$ 2,626$ 3,081$ 2.9% 9.6% 1,914$ 6.1% 2.4x 0.8x 1.0x 0.9x 9.6x 8.5x 8.3x
Mean 73% 6,477 7,582 7,450 3.6% 10.5% 5,400 7.2% 3.2x 1.0x 1.1x 1.0x 9.5x 8.5x 8.2x
Specialty-Pet
Blue Buffalo Pet Products, Inc. U.S. 39.81$ 99% 7,898$ 7,898$ 1,275$ 19.5% 24.6% 849$ 25.3% 0.4x 6.2x 5.7x 5.1x 25.2x 23.1x 17.9x
Freshpet, Inc. U.S. 16.45 79% 579 576 156 29.2% 6.5% 134 -1.2% NA 3.7x 3.1x 2.6x NM NM 17.2x
Median 89% 4,238$ 4,237$ 716$ 24.3% 15.5% 491$ 12.0% 0.4x 4.9x 4.4x 3.8x 25.2x 23.1x 17.6x
Mean 89% 4,238 4,237 716 24.3% 15.5% 491 12.0% 0.4x 4.9x 4.4x 3.8x 25.2x 23.1x 17.6x
Non-Alcoholic Beverages
The Coca-Cola Company U.S. 43.43$ 89% 184,806$ 214,191$ 33,918$ -6.7% 35.4% 93,282$ 6.6% 2.5x 6.3x 6.7x 6.4x 17.8x 18.7x 17.6x
PepsiCo, Inc. U.S. 109.15 89% 154,758 174,639 64,038 -0.5% 19.8% 81,887 8.4% 1.8x 2.7x 2.7x 2.6x 13.8x 13.1x 12.3x
Monster Beverage Corporation U.S. 57.21 81% 32,404 31,202 3,369 10.3% 38.1% 4,791 17.2% NA 9.3x 8.3x 7.5x 24.3x 22.4x 20.1x
Dr Pepper Snapple Group, Inc. U.S. 118.38 93% 21,335 25,704 6,774 2.4% 22.7% 10,179 8.2% 2.9x 3.8x 3.7x 3.6x 16.7x 15.9x 14.9x
Cott Corporation CA 14.70 83% 2,060 4,200 2,294 0.5% 12.0% 3,212 1.4% 3.9x 1.8x 1.8x 1.7x 15.2x 13.3x 12.4x
National Beverage Corp. U.S. 89.02 69% 4,149 3,989 943 7.4% 22.5% 401 34.6% NA 4.2x 4.1x 3.6x 18.8x 18.0x 15.4x
Farmer Bros. Co. U.S. 30.20 81% 506 584 571 2.8% 7.5% 454 2.1% 1.9x 1.0x 0.9x 0.9x 13.7x 11.0x 8.9x
Median 83% 21,335$ 25,704$ 3,369$ 2.4% 22.5% 4,791$ 8.2% 2.5x 3.8x 3.7x 3.6x 16.7x 15.9x 14.9x
Mean 84% 57,145 64,930 15,987 2.3% 22.6% 27,744 11.2% 2.6x 4.2x 4.0x 3.8x 17.2x 16.0x 14.5x
Alcoholic Beverages
Constellation Brands, Inc. U.S. 227.92$ 98% 43,620$ 54,532$ 7,585$ 22.1% 43.1% 20,539$ 7.9% 3.6x 7.2x 6.7x 6.3x 16.7x 17.4x 15.9x
Brown-Forman Corporation U.S. 54.40 96% 27,956 29,540 3,210 2.8% 36.8% 5,042 14.5% 1.5x 9.2x 9.0x 8.5x 25.0x 26.1x 23.5x
Molson Coors Brewing Company U.S. 75.33 77% 16,250 27,360 10,886 21.8% 21.8% 30,185 3.3% 4.6x 2.5x 2.5x 2.5x 11.5x 11.0x 10.7x
The Boston Beer Company, Inc. U.S. 189.05 93% 2,202 2,111 892 8.1% 19.6% 580 13.2% NA 2.4x 2.3x 2.2x 12.1x 12.5x 11.8x
Median 95% 22,103$ 28,450$ 5,398$ 15.0% 29.3% 12,790$ 10.6% 3.6x 4.9x 4.6x 4.4x 14.4x 15.0x 13.8x
Mean 91% 22,507 28,386 5,643 13.7% 30.3% 14,086 9.7% 3.3x 5.3x 5.1x 4.9x 16.3x 16.8x 15.5xer
*
* Blue Buffalo Pet Products, Inc. was acquired by General Mills, Inc. on April 24, 2018 and has been delisted from the NASDAQ. Given the acquisition was announced on February 23, 2018, the stock price
of Blue Buffalo Pet Products, Inc. may have been inflated as of March 31, 2018.
Food and Beverage M&A Landscape – Spring 2018
27
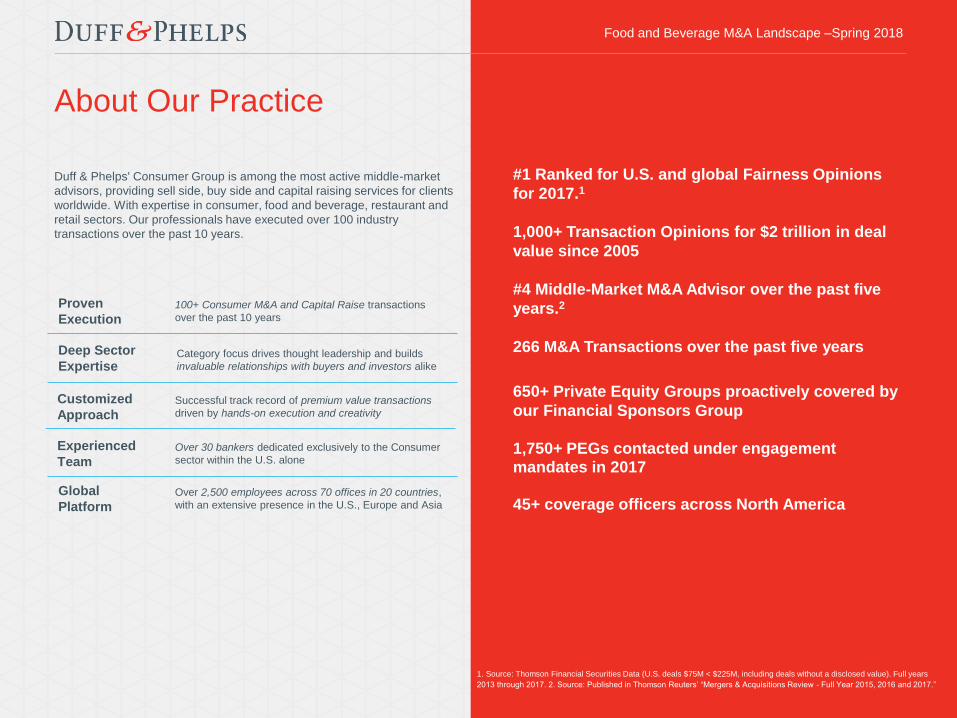
About Our Practice
Duff & Phelps' Consumer Group is among the most active middle-market
advisors, providing sell side, buy side and capital raising services for clients
worldwide. With expertise in consumer, food and beverage, restaurant and
retail sectors. Our professionals have executed over 100 industry
transactions over the past 10 years.
Proven
Execution100+ Consumer M&A and Capital Raise transactions
over the past 10 years
Deep Sector
ExpertiseCategory focus drives thought leadership and builds
invaluable relationships with buyers and investors alike
Customized
ApproachSuccessful track record of premium value transactions
driven by hands-on execution and creativity
Experienced
TeamOver 30 bankers dedicated exclusively to the Consumer
sector within the U.S. alone
Global
PlatformOver 2,500 employees across 70 offices in 20 countries,
with an extensive presence in the U.S., Europe and Asia
#1 Ranked for U.S. and global Fairness Opinions
for 2017.1
1,000+ Transaction Opinions for $2 trillion in deal
value since 2005
#4 Middle-Market M&A Advisor over the past five
years.2
266 M&A Transactions over the past five years
650+ Private Equity Groups proactively covered by
our Financial Sponsors Group
1,750+ PEGs contacted under engagement mandates in 2017
45+ coverage officers across North America
Food and Beverage M&A Landscape –Spring 2018
1. Source: Thomson Financial Securities Data (U.S. deals $75M < $225M, including deals without a disclosed value). Full years
2013 through 2017. 2. Source: Published in Thomson Reuters’ “Mergers & Acquisitions Review - Full Year 2015, 2016 and 2017.”

28
Food and Beverage M&A Landscape –Spring 2018
Sell Side AdvisorSell Side Advisor Buy Side Advisor Sell Side AdvisorDebt Placement
Sell Side AdvisorBuy Side AdvisorSell Side Advisor*
has been acquired by
Sell Side Advisor
Sell Side AdvisorSell Side Advisor Financial Advisor
Financial advisor to Hub
Group, Inc.
Sell Side Advisor Buy Side Advisor
Selected Duff & Phelps Food and Beverage Experience
Sell Side Advisor
has been acquired by
Sell Side Advisor
has acquired
has been acquired by has been acquired by has been acquired by has acquired
a portfolio company of
has been acquired by
has been acquired by has been acquired by
has acquired
a portfolio company of
has acquired Secured a senior credit
facility from a consortium of
banks including
has been acquired by
a division of
has been acquired by
*Completed by a Duff & Phelps professional.

Food and Beverage M&A Landscape – Spring 2018
29Copyright © 2018 Duff & Phelps LLC. All rights reserved.
Joshua BennGlobal Head of Consumer, Food &
Restaurants
New York
+1 212-450-2840
John BarrymoreManaging Director
New York
+1 212-871-2544
Ross FletcherManaging Director
Toronto
+1 416-361-2588
Contact Us
Howard JohnsonManaging Director
Toronto
+1 416-597-4500
Bob BartellGlobal Head of Corporate Finance
Chicago
+1 312-697-4654
Farzad MukhiDirector
Los Angeles
+1 424-249-1661
About Duff & Phelps
Duff & Phelps is the global advisor that protects, restores and
maximizes value for clients in the areas of valuation, corporate finance,
investigations, disputes, cyber security, compliance and regulatory
matters, and other governance-related issues. We work with clients
across diverse sectors, mitigating risk to assets, operations and people.
With Kroll, a division of Duff & Phelps since 2018, our firm has nearly
3,500 professionals in 28 countries around the world. For more
information, visit www.duffandphelps.com
M&A advisory, capital raising and secondary market advisory services in the United
States are provided by Duff & Phelps Securities, LLC. Member FINRA/SIPC.
Pagemill Partners is a Division of Duff & Phelps Securities, LLC. M&A advisory,
capital raising and secondary market advisory services in the United Kingdom are
provided by Duff & Phelps Securities Ltd. (DPSL), which is authorized and regulated
by the Financial Conduct Authority. M&A advisory and capital raising services in
Germany are provided by Duff & Phelps GmbH, which is a Tied Agent of DPSL.
Valuation Advisory Services in India are provided by Duff & Phelps India Private
Limited under a category 1 merchant banker license issued by the Securities and
Exchange Board of India.
Food and Beverage M&A Landscape – Spring 2018


