Food and Grocery Retailing in India – Market Summary & Forecasts Comprehensive overview of the market, consumer, and competitive context, with retail sales value and forecasts to 2019 Report Code: RT0145SR Published: March 2015 Report Price: US$1,250 (Single Copy)
Transcript
www.Conlumino-winesandspirits.com
Food and Grocery Retailing in India – Market Summary
& Forecasts Comprehensive overview of the market, consumer, and competitive context, with retail sales value and
Food and Grocery Retailing in India – Market Summary & Forecasts
Published: March 2015
Summary Methodology
Overview
All data in this series of retail reports from Conlumino is rigorously sourced using a comprehensive,
standardized methodology. This methodology ensures that all data is thoroughly researched and cross–
checked against a number of sources and validation processes. At the core of this methodology is a
triangulated market sizing approach, which ensures that results from different sources and approaches,
including Conlumino’s own industry surveys, are compared and a final consensus number between these
inputs is derived. In addition, standardized processes and quality controls across the entire data
collection, analysis and publication process ensure compliance and cross–checking of the data occurs at
each stage of the methodology.
The triangulated market sizing method
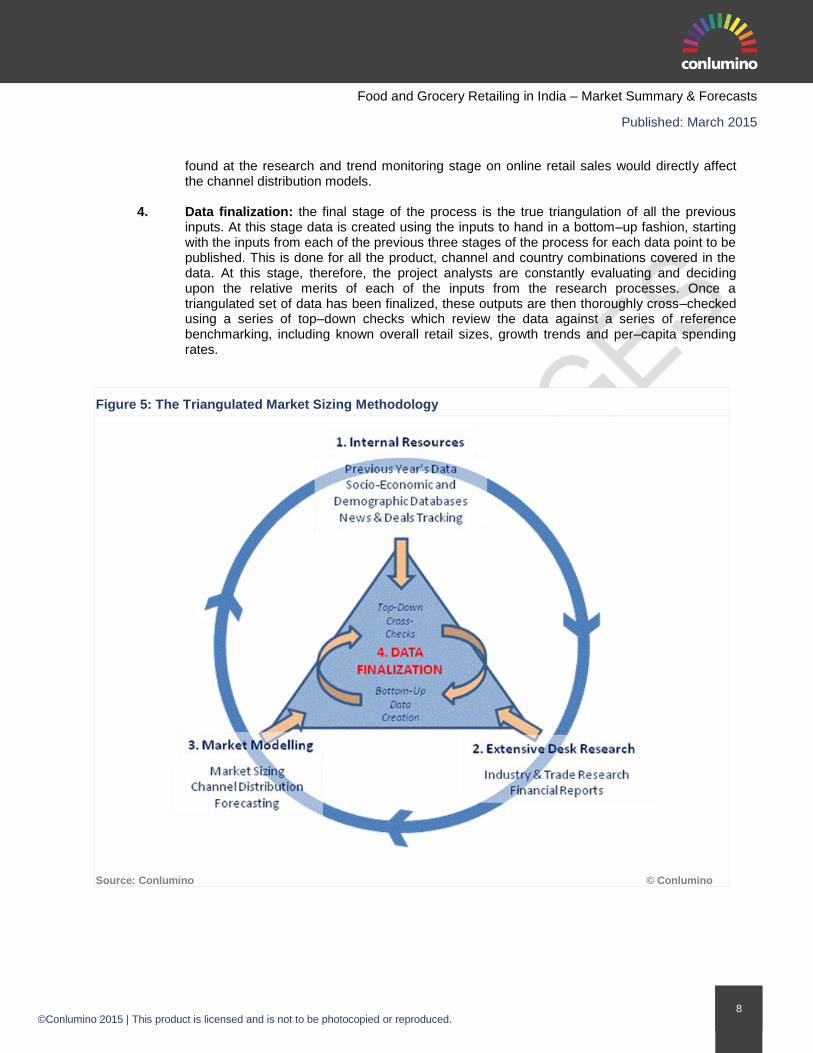
The triangulation method ensures that the results from three distinct phases of the research are brought
together and cross–compared before finalized market numbers are derived:
1. Existing internal resources: as retail data is compiled using a rolling annual program of industry research, the first stage of producing the data is to review the existing internal information, both from the last major data release, as well as that which has been collected on an ongoing basis throughout the year. This includes inputs about market as well as individual retailer performance. These sources are then reviewed and incorporated into data collection processes and databases before the second intensive phase of desk research.
2. Extensive desk research: this phase of the methodology incorporates the main phase of secondary research. This research is initially conducted across a wealth of information sources, as listed below. In addition, the results of any relevant surveys from other Conlumino projects are also fed into data collection sheets. Online industry surveys can include industry opinion surveys of retailers’ — and their suppliers’ — sentiment and consumer surveys of purchasing and retail behavior. Secondary sources include, but are not limited to, the following:
a. Industry surveys b. Industry and trade association research c. Trade portals d. Company filings and analyst presentations e. Broker and investment analyst reports f. International organizations g. Government statistics h. Retail media i. National Press, including both business and consumer titles
3. Market modeling: the next stage in the process is to feed the results of the above into
market models, which also include drive–based forecasting tools — which analyze drivers such as disposable income, product uptake, macro–economic drivers and market momentum — in order to fill in any gaps in the data and update forecast numbers. At this stage, the market models also look to update channel distribution data sets. For example, information
Food and Grocery Retailing in India – Market Summary & Forecasts
Published: March 2015
found at the research and trend monitoring stage on online retail sales would directly affect the channel distribution models.
4. Data finalization: the final stage of the process is the true triangulation of all the previous inputs. At this stage data is created using the inputs to hand in a bottom–up fashion, starting with the inputs from each of the previous three stages of the process for each data point to be published. This is done for all the product, channel and country combinations covered in the data. At this stage, therefore, the project analysts are constantly evaluating and deciding upon the relative merits of each of the inputs from the research processes. Once a triangulated set of data has been finalized, these outputs are then thoroughly cross–checked using a series of top–down checks which review the data against a series of reference benchmarking, including known overall retail sizes, growth trends and per–capita spending rates.
Figure 5: The Triangulated Market Sizing Methodology
Food and Grocery Retailing in India – Market Summary & Forecasts
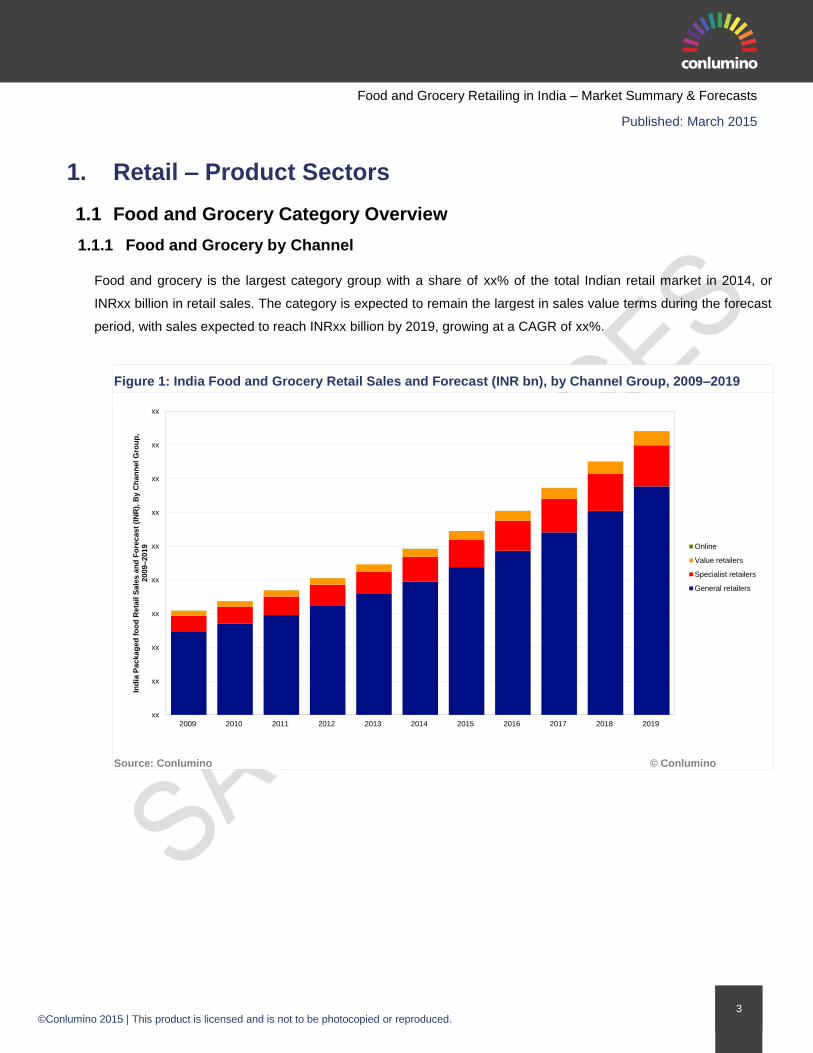
Published: March 2015
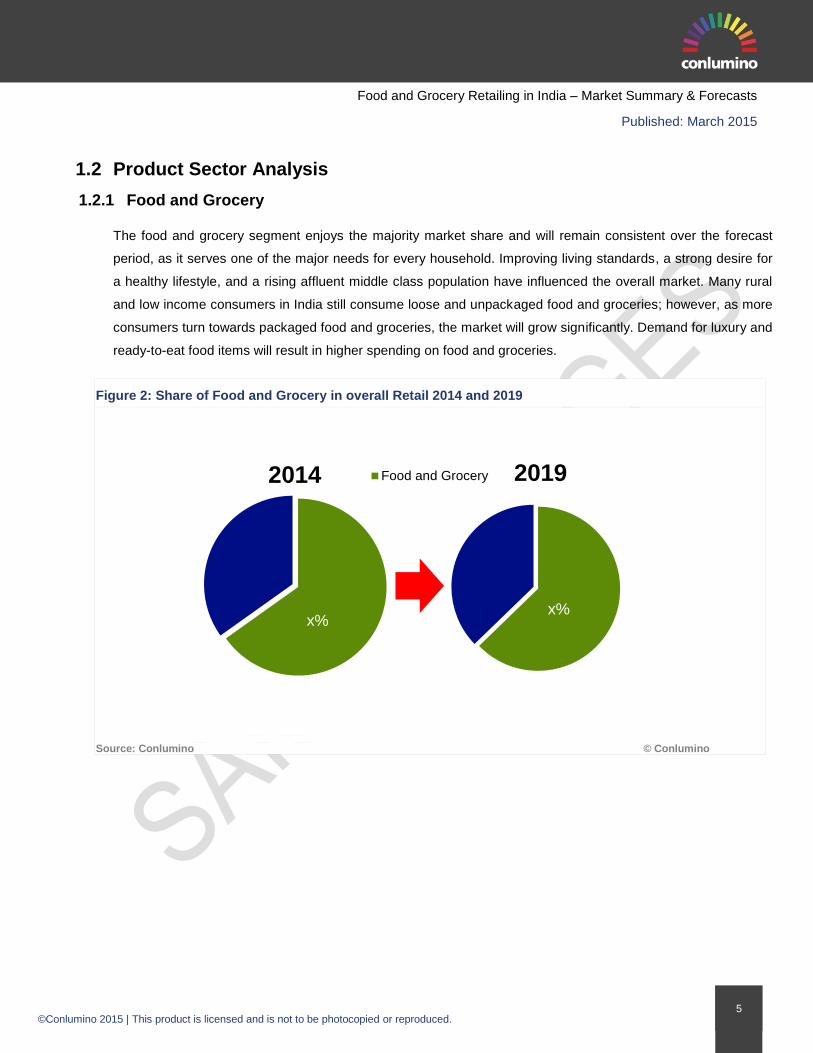
List of Figures
Figure 1: GDP Value (US$ Billion), 2008–2014E ......................................................................................................................................... 10 Figure 2: Growth Rate of GDP (US$ Billion, %), 2008–2014E ...................................................................................................................... 11 Figure 3: GDP Value and Growth (INR billion, %), 2008–2014 ..................................................................................................................... 12 Figure 4: Forecasts for GDP Value and Growth (INR Billion, %) 2014–2019 ............................................................................................... 13 Figure 5: Household Savings Rate as a Percentage of GDP (%), 2004–2014E ........................................................................................... 14 Figure 6: Share of Employment by Sector 2004 and 2014E ......................................................................................................................... 15 Figure 7: Unemployment Rate 2004–2014E................................................................................................................................................. 16 Figure 8: Inflation Growth Rates (%), 2004–2014 ......................................................................................................................................... 17 Figure 9: Household Consumption Expenditure of India (INR Billion), 2004 and 2014E ............................................................................... 18 Figure 10: Household Consumption Expenditure of Major Countries (US$ Billion), 2014E ........................................................................... 19 Figure 11: Growth of Household Consumption Expenditure (%), 2004–2014E ............................................................................................. 20 Figure 12: Rural and Urban Populations (millions) 2004, 2014 and 2019E ................................................................................................... 21 Figure 13: Total Population and Growth Rate (Millions, %), 2004–2019 ....................................................................................................... 22 Figure 14: Population Split by Gender (%),2014 and2019E ......................................................................................................................... 23 Figure 15: Population Split by Age Group (%), 2014 and 2019 ..................................................................................................................... 23 Figure 16: Per Capita Spend on Retail(INR), 2006 and 2014 ....................................................................................................................... 25 Figure 17: Per Capita Spend (INR) and Total Retail Spend by Age Group (%), 2006 and 2014 ................................................................... 25 Figure 18: Population distribution by income class and amenities owned by the Indian middle class, 2009–2010 ........................................ 27 Figure 19: Polarization of typical Indian shoppers ........................................................................................................................................ 30 Figure 20: Retail initiatives by Indian manufacturers in rural India ................................................................................................................ 32 Figure 21: Number of Inbound Tourists by Region (in thousands) - 2009 & 2014 ......................................................................................... 34 Figure 22: Key Components of Doing Business in India ............................................................................................................................... 36 Figure 23: Major guidelines for FDI in India .................................................................................................................................................. 38 Figure 24: Impediments to Growth ............................................................................................................................................................... 40 Figure 25: Share of Food and Grocery in overall Retail 2014 and 2019........................................................................................................ 43 Figure 26: Retail Sales Value and Growth (INR Billion, %) of Food and Grocery 2014–2019 ....................................................................... 44 Figure 27: Spend per Head on Food and Grocery 2014 and 2019 ............................................................................................................... 44 Figure 28: Online Spend in Food and Grocery 2014–2019 ........................................................................................................................... 45 Figure 29: Online Share of total Food and Grocery Spend 2014 and 2019 ................................................................................................... 45 Figure 30: Spending per Channel in Food and Grocery (%) 2014 and 2019 ................................................................................................. 46 Figure 31: India Food and Grocery Retail Sales and Forecast (INR bn), by Channel Group, 2009–2019 ..................................................... 47 Figure 32: India Food and Grocery Retail Market Dynamics, by Channel Group, 2009–2019 ....................................................................... 48 Figure 33: India Food and Grocery Retail Sales and Forecast (INR bn), by Category 2009–2019 ................................................................ 51 Figure 34: India Food and Grocery Retail Market Dynamics, by Category 2009–2019 ................................................................................. 52 Figure 35: India Drinks Retail Sales and Forecast (INR bn), by Channel Group, 2009–2019........................................................................ 55 Figure 36: India Household Products Retail Sales and Forecast (INR bn), by Channel Group, 2009–2019 .................................................. 58 Figure 37: India Packaged Food Retail Sales and Forecast (INR bn), by Channel Group, 2009–2019 ......................................................... 62 Figure 38: India Tobacco Retail Sales and Forecast (INR bn), by Channel Group, 2009–2019 .................................................................... 66 Figure 39: India Unpackaged Food Retail Sales and Forecast (INR bn), by Channel Group, 2009–2019 ..................................................... 69 Figure 40: The Triangulated Market Sizing Methodology .............................................................................................................................. 81