KK -2014 Food and Nutrition Security- In the context of The National Food Security Bill (ACT) • Kamala Krishnaswamy, MD. FASc, FAPASc,FAMS, FNAAS,FNA,FIUNS,FNAAS,FTWAS; Former Director, National Institute of Nutrition & Former President, Nutrition Society of India
Transcript
KK -2014
Food and Nutrition Security-In the context of
The National Food Security Bill (ACT)•
Kamala Krishnaswamy, MD.
FASc, FAPASc,FAMS,
FNAAS,FNA,FIUNS,FNAAS,FTWAS;Former Director, National Institute of Nutrition
&Former President, Nutrition Society of India
KK -2014
Food & Nutrition Security In India
Definition and components of Food and Nutrition security
Hunger index in India
Inflation and food prices and per capita intake of foods
Trends in Diet & Nutritional Status
The National Food Security Bill
Challenges
Conclusions
KK -2014
Food Security
“Food Security’ is achieved when it isensured that “all people, at all times,have physical, social and economicaccess to sufficient, safe and nutritiousfood which meets their dietary needs andfood preferences for an active andhealthy life”
World Food Summit, Rome, 1996
KK -2014
Nutritional status����
Food & Nutrition insecurity/security out comes����
AbsorbabilityUse + Utilization, care/feeding practices, diversified diet, intra household distribution Health care facilities, water & sanitation
Coalition for Sustainable Nutrition Security in India
• Nutrition security is broadly defined asPhysical. Economic and Social access andUtilisation of, an appropriate balanced diet, safedrinking water, environmental hygiene andprimary health care for all
• National Food security alone is not adequate fornutrition security .It is determined by severalfactors –
• Community & HH level distribution, poverty,literacy, potable water, sanitation & hygiene,cultural beliefs and practices.
Nutrition security is a critical input which fuels economic growth,development and health
KK -2014
Food & Nutrition security in IndiaA Backdrop
• India faced the worst Bengal famine 1943• Acute shortage of food , starvation & hunger• Agricultural production was low/depended on
imports• Poor distribution and networking• Very low purchasing power/Inadequate dietary
intakes• Poor quality of drinking water• Unhygienic environment/sanitation facilities• Illiteracy and low awareness• Poor access to health care facilities• High rates of undernutrition & micro nut.
malnutrition
KK -2014
During 1950 – 2008, production of food grainsincreased at an average annual rate of 2.5% comparedto the growth of population which averaged 2.1%during this period .The green revolution was a steptowards prosperity
Post liberalization and privatization period (1990 –2008), the rate of growth of food grains productiondecelerated to 1.2%, lower than the annual rate ofgrowth of population at 1.9%
Achievement of food security at the national level hasnot percolated down to the level of individualhousehold and has not resulted in Nutritional Security
FOOD & NUTRITION SECURITY A Backdrop-2
KK -2014
The India State Hunger Index and it s underlying components
Menon P, Deolalikar A, Bhaskar A. INDIA STATE HUNGER INDEX
KK -2014
Ranking of states within India from lowest to highest
India State Hunger Index scores
Purnima Menon, Anil Deolalikar, Bhaskar A. INDIA STATE HUNGER INDEX Comparisons of
Hunger Across States. Washington, D.C., Bonn, and Riverside • February 2009
KK -2014
Map of the India State Hunger Index, by severity
Purnima Menon, Anil Deolalikar, Anjor Bhaskar. INDIA STATE HUNGER INDEX Comparisons
of Hunger Across States. Washington, D.C., Bonn, and Riverside • February 2009
KK -2014
India State Hunger Index in relation to poverty
Purnima Menon, Anil Deolalikar, Anjor Bhaskar. INDIA STATE HUNGER INDEX Comparisons
of Hunger Across States. Washington, D.C., Bonn, and Riverside • February 2009
KK -2014
India State Hunger Index in relation to per capita income
Purnima Menon, Anil Deolalikar, Anjor Bhaskar. INDIA STATE HUNGER INDEX Comparisons
of Hunger Across States. Washington, D.C., Bonn, and Riverside • February 2009
KK -2014
Source: CSO, RBI, EAC to PM, Ministry of Finance; 10th March, 2014
Databook for DCH; 10th March, 2014
India - Macro-economic Summary : 1999-00 to 2013-14
(on 10th March, 2014)
3.3
7.1
3.6 3.4
5.5
6.5
3.7
6.5
4.8
8
3.6
9.68.8
7.4
6
2 1.9 1.72.1
2.7
3.93.1
4.8
8.6
0.6
3.8 3.6 3.6
4.8
3.1
0
2
4
6
8
10
12
Inflation-WPI(Average) %GDP
KK -2014
Indian Inflation: Wholesale Price Indices, 1995-96 to December 2012 (with base 2004-05:100)
Source: CSO, MOSPI
KK -2014
Transmission of Global food inflation into India
Source: MOSPI # The data for 2012-13 is for the period between April and December, 2012
KK -2014
Source : Changing pattern of food inflation
C. P. CHANDRASEKHAR & JAYATI GHOSH , Hindu business line; 24th June 2013
KK -2014
Source : Changing pattern of food inflation
C. P. CHANDRASEKHAR & JAYATI GHOSH , Hindu business line; 24th June 2013
KK -2014
KK -2014
Source: Indian agriculture: a big bet Apr 16, 2013 9:22am by Avantika Chilkoti http://blogs.ft.com/beyond-brics/2013/04/16/indian-agriculture-a-big-bet/#axzz2x8wQ8mG6
KK -2014
Temporal behavior of Price Indices of various Food Components (2004-05 to 2012-13)
Source: MOSPI # The calculations for FY 2012-13 are done for the period between April and December,2012.
Egg, Meat & fishPulses
MilkFruitsCerealsOil seedsEdible oils
KK -2014
Trends in production of food groups, India, 1951 to 2012
Source :Ministry of Agriculture, Government of India; 2013 &DAHDF. Basic Animal Husbandry statistics, 2012. AHS series 13. New Delhi: Ministry of Agriculture, Government of India; 2012Varadharajan KS, Thomas T, Kurpad AV, 2013
i) Vegetable Oils (x 10,000 metric tonnes); ii) Eggs (‘million numbers); and iii) Fish and Meat (x10,000 metric tonnes)
5o to 250million tons50 t0 250 million tons50 to 250 million tonsGrowth rate 3.5%
KK -2014
Per capita daily availability of food groups, India, 1950-51 to 2010-11
Net availability (after accounting for industrial uses and trade) is plotted for cereals & millets, pulses, sugar and vegetable oils; estimates for other food groups are based on production alone. Quantity in gram for all food groups, except Eggs (in numbers)
Source :Ministry of Agriculture, Government of India; 2013 &DAHDF. Basic Animal Husbandry statistics, 2012. AHS series 13. New Delhi: Ministry of Agriculture, Government of India; 2012Varadharajan KS, Thomas T, Kurpad AV, 2013From Varadharajan KS, Thomas T, Kurpad AV, 2013Varadharajan KS, Thomas T, Kurpad AV, 2013Varadharajan KS, Thomas T, Kurpad AV, 2013Varadharajan KS, Thomas T, Kurpad AV, 2013
Average Intake of Foodstuffs (per CU/day) as % of RDI by Period of Survey
PercentSource :NNMB 2012
KK -2014
Average Intake of Foodstuffs (per CU/day) as % of RDI by Period of Survey (contd.)
PercentSource :NNMB 2012
KK -2014
Average Intake of Nutrients (per CU/day) as % of RDI by Period of Survey
PercentSource :NNMB 2012
KK -2014Percent
Average Intake of Nutrients (per CU/day) as % of RDI by Period of Survey (Contd.)
Source :NNMB 2012
KK -2014
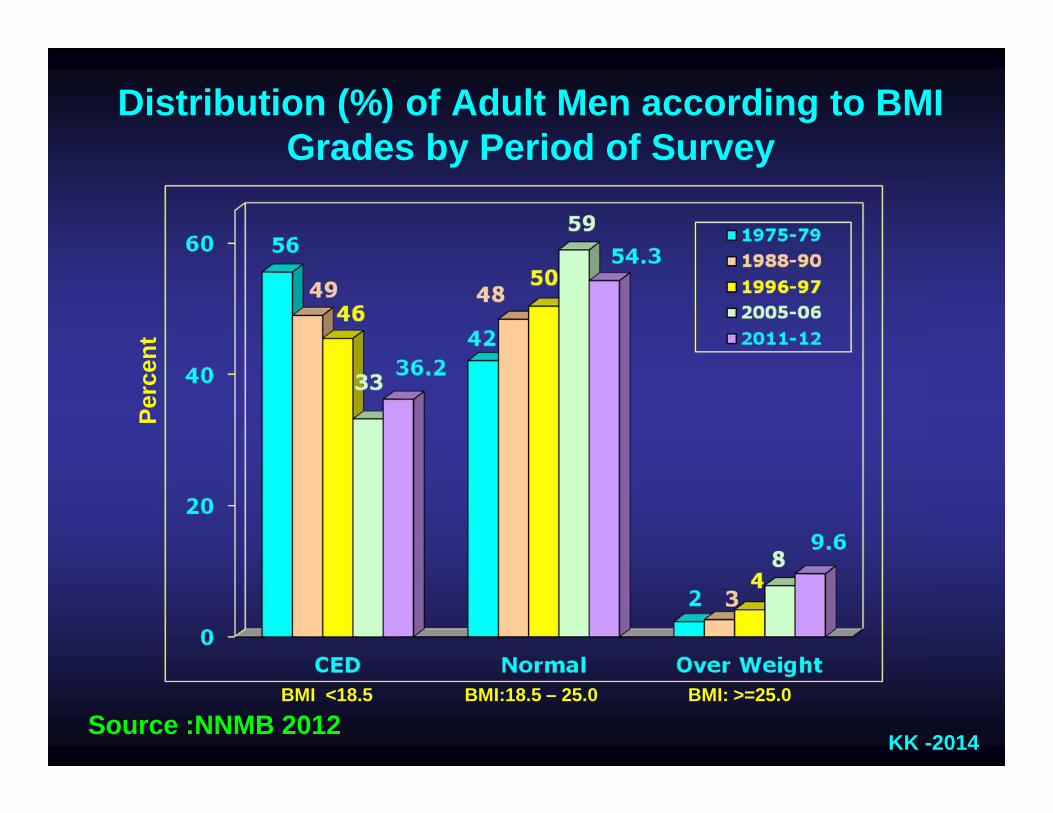
Distribution (%) of Adult Men according to BMI Grades by Period of Survey
Per
cen
t
BMI <18.5 BMI:18.5 – 25.0 BMI: >=25.0
Source :NNMB 2012
KK -2014
Distribution (%) of Adult Women according to BMI Grades by Period of Survey
Per
cen
t
BMI <18.5 BMI:18.5 – 25.0 BMI: >=25.0
Source :NNMB 2012
KK -2014
75.5
81.9
27.0
48.652.8
22.5
44.249.0
17.7
0
10
20
30
40
50
60
70
80
90
Underweight Stunting Wasting
PE
R C
EN
T
Prevalence (%) undernutrition among rural Preschool children in 10 NNMB States in India (2011-12)
1975-79
1996-97
2010-11
Source :NNMB 2012
KK -2014
Percentage of Under weight Children by State (<6 years)
KK -2014
Prevalence of Undernutrition among <5 years children according to Weight for Age
Faulty BF Faulty Complementary feeding
KK -2014
Access to services
25
23
72
27
37
83
0 20 40 60 80 100
piped water(indoors)
Flush Toilet
Electricity
Percent
2004-5 2011-12
NCAER Data (Hindu 3 April 2014)Even though incomes have more than doubled in the last 7 years, the access to public service is severely lacking
KK -2014
THE NATIONAL FOOD SECURITY ACT-2013
• An Act to provide for food and nutritionalsecurity in human life cycle approach,
• By ensuring access to adequate quantity ofquality food at affordable prices
• For people to live a life with dignity and formatters connected therewith or incidentalthereto.
Enacted by Parliament in the Sixty-fourth Year of the Republic of IndiaExtends to the whole of India.( A comprehensive legislation that entitlesevery citizen to the right to food security)
KK -2014
THE NATIONAL FOOD SECURITY ACT, 2013
• Every person belonging to priorityhouseholds, shall be entitled to receive 5 Kgsof food grains per person per month atsubsidized prices
• The poorest of the poor (Antyodaya)households are entitled to 35kgs/HH/M
• Coverage of Priority and Antyodayahouseholds (“eligible households”) is up to75% of the rural population and up to 50% ofthe urban population.
• Peoples representatives in the local selfgovernment will monitor the implementationat local level
KK -2014
Modus operandi
• The central government to procure foodgrains, create and maintain adequate modernfood storage facilities to prevent wastage,allocate and transport food grains to states
• The state governments will take delivery ofthe food grains and ensure its transport anddistribution up through the targeted publicdistribution system.
• At each district there will be a DistrictGrievance Redressal Officers appointed bystate governments
• Essentially a targeted PDS
KK -2014
Modus operandi
(3) Others: Access to—(a) Safe and adequate drinking water and
sanitation;(b) Health care;(c) Nutritional, health and education support to
adolescent girls;(d) Adequate pensions for senior citizens,
persons with disability and single women.
Rural Health Mission has impacted health care
KK -2014
Entitlement for special groups
THE NATIONAL FOOD SECURITY ACT, 2013
KK -2014
PROVISIONS FOR ADVANCING FOOD SECURITY
Revitalization of Agriculture• Agrarian reforms through measures for securing interests of small and
marginal farmers;Investments in agriculture, including research and development,extension services, micro and minor irrigation and power to increaseproductivity and production;
• Ensuring livelihood security to farmers by way of remunerative prices,access to inputs, credit, irrigation, power, crop insurance, etc.;
• Prohibiting unwarranted diversion of land and water from foodproduction.
Procurement, Storage and Movement related interventions—Incentivising decentralised procurement including procurement ofcoarse grains;Geographical diversification of procurement operations;Augmentation of adequate decentralised modern and scientificstorage;Giving top priority to movement of foodgrains by expanding the linecapacity of railways to facilitate foodgrain movement from surplus toconsuming regions
KK -2014
ENURING FOOD & NUTRITION SECURITY
• Ensuring food and nutrition security is a challenge forIndia, given its huge population and high levels ofpoverty and malnutrition( Slow decreasing trends).
• Food availability is threatened by the effects of climatechange and declining water resources.
• Economic access to food by about 1/3 -1/4of thepopulation living below the poverty line is problematic
• Despite impressive economic growth in the recentyears, the level of food distribution & absorption arelow.
• About 44% of children under the age of 5 areunderweight, 50% are stunted, around half of pregnantwomen and children are anemic.
• The majority of women do not have access to toiletfacilities and safe drinking water.
KK -2014
CHALLENGES
• Implementation/Social auditing/monitoring• Identifying beneficiaries is a problem• Storage and transport are difficult• Quality of food grains• Diversion of food grains• Pulses, oils, vegetables and fruits are needed for a balanced
diet.• Simultaneous efforts to promote the above• At community & HH levels , ICDS/MDM, community kitchens are
needed• Nutrition education/awareness/exclusive breast feeding/
complimentary foods• Intra family distribution• Immunization
Is the “right” to eat correct? Or is it right to work to eat. Should beproductive members of society & not be living on the streetstanding in line at the fare price shops.
KK -2014
Conclusions
• We need legislation to provide food for theneedy. Water/ sanitation –equally essential
• Skill development / livelihoods are essential.
• Food and nutrition security cannot beequated to food grains distribution.
• Holistic diets have other components as well.
• A lifecycle approach, educationempowerment, awareness generation areessential to tackle malnutrition.
• Develop nutrition sensitive agriculture
KK -2014
VISION – NUTRITION FOR ALLPolicy
AccessibleAvailable
Programmes Personnel
Public health
AbsorbableAffordable
Analysis Action
Assessment
Interdisciplinary
Empowerment
Ed
uca
tio
n
Economy En
viron
men
t
Food Nutritionsecurity
“Food Security” is achieved when it is ensured that “all people, at all times,have physical, social and economic access to sufficient, safe and nutritiousfood which meets their dietary needs and food preferences ,safe drinkingwater, sanitation, environmental hygiene, primary health care and educationso as to lead a healthy and productive life.
KK -2014
If you want one year of prosperity, grow grain.If you want ten years of prosperity, grow trees.
If you want one hundred years of prosperity, grow people.
Chinese Proverb
Thank you
KK -2014
Variation in share of food groups to total per capita food expenditure across different MPCE
decline classes, India 2009-10
NSSO. Level and Pattern of Consumer Expenditure: NSS 66th Round, 2009-10. Kolkata: National Sample Survey Organization office. Ministry of Statistics and Programme Implementation, Government of India; 2011.
KK -2014
INDIA - FACTS
• World's second-most populous country (1.24 x 10⁸)
• % of world Population – 17.5% (2014)
• GDP (nominal) Per capita $1,389 (2014 esti.)
• Life expectancy 68.89 years (2009 est.)
• Population growth - 1.76% per annum (2001–2011) down from 2.13% per annum (1991–2001).
• IMR - 30.15 deaths/1,000 live births (2009 est.)
• The human sex ratio (2011 census) 940 females per1,000 males
• HDI (2012) - 134 among 187
KK -2014
INDIA – FACTS II• Literacy rate (2011) - 74.04%: 65.46% among females and
82.14% among males.
• Kerala is the most literate (95.5%), while Bihar the least(67.8%)
• The median age was 24.9 in the 2001 census
• Area - Total 3,287,590 km2
• Water (%) - 9.6
• Medical advances & agricultural productivity (greenrevolution) have caused India's population growth
• WHO, states that 900,000 Indians die each yearfrom drinking contaminated water or breathing pollutedair
• There are around 50 physicians per 100,000 Indians
KK -2014
Changes at a glanceThe share of cereals in total calorie intake has declinedsince 1993-94 by nearly 7 percentage points in rural Indiaand about 3.5 percentage points in urban India. The shareof oil and fat has risen by 3 percentage points in both
The proportion of household with calorie intake below2700 Kcal has risen steadily since 1993-94; from under52% in rural India to nearly 62%, and from 57% in urbanIndia to about 63%
Protein intake has fallen from 60.2g to 55.0g per personper day in rural India and from 57.2g to 53.5g in urbanIndia over the period 1993-94 to 2009-10
In 1980 rural sanitation coverage was estimated at 1%and reached 21% in 2008. Also, the share of Indianswith access to improved sources of water hasincreased significantly from 72% in 1990 to 88% in 2008
in 2008 Urban Rural Total
Improved water source 96% 84% 88%
Improved sanitation 54% 21% 31%
KK -2014
Trends in food price Inflation, India 2004-12
The corresponding value of WPI is 100 for all itemsSource : Wholesale Price Index Data, Office of the EconomicAdviser to the Government of India, [cited 10 March, 2013];Available from: http://eaindustry.nic.in/
AFRIS. AsianFoodRegulationInformationService.
We have the largest database of Asian food regulations in the world and it’s FREE to use.
We publish a range of communication services, list a very large number of food events and online educational webinars and continue to grow our Digital