15
Food and You Survey Wave 4 (2016) User Guide NatCen Social Research A survey carried out for Food Standards Agency UK Data Archive Study Number 8193 - Food and You Survey, 2016
Food and You Survey
Wave 4 (2016)
User Guide NatCen Social Research A survey carried out for Food Standards Agency
UK Data Archive Study Number 8193 - Food and You Survey, 2016
NatCen Social Research 35 Northampton Square London EC1V 0AX T 020 7250 1866 www.natcen.ac.uk A Company Limited by Guarantee Registered in England No.4392418 A Charity registered in England and Wales (1091768) and Scotland (SC038454)
At NatCen Social Research we believe that social research has the power to make life better. By really understanding the complexity of people’s lives and what they think about the issues that affect them, we give the public a powerful and influential role in shaping decisions and services that can make a difference to everyone. And as an independent, not for profit organisation we’re able to put all our time and energy into delivering social research that works for society.
Contents
1 Overview of the survey ................................................ 4
1.1 Background ............................................................................................. 4
1.2 Sample Design ........................................................................................ 5
1.2.1 Sampling frame and stratification ............................................................. 5
1.2.2 Selecting addresses and participants ...................................................... 6
1.3 Data Collection ........................................................................................ 7
1.4 Response rates ....................................................................................... 8
1.5 Reports and publications ........................................................................ 8
2 Using the data ............................................................. 9
2.1 Documentation ........................................................................................ 9
2.2 Variables on the data file ........................................................................ 9
2.3 Multi-coded questions ........................................................................... 10
2.4 Missing value conventions .................................................................... 10
2.5 Notes about particular variables ............................................................ 11
2.5.1 Food Security ........................................................................................ 11
2.5.2 Index of Recommended Practice ........................................................... 12
3 Weighting .................................................................. 13
1 Overview of the survey
1.1 Background Since its inception in 2000, the Food Standards Agency (FSA) has
commissioned surveys to collect quantitative data on the public’s reported
behaviour, attitudes and knowledge relating to food and food safety. Between
2000 and 2007 the FSA ran the Consumer Attitudes Survey (CAS).1 In 2008
FSA’s Social Science Research Committee (SSRC) recommended that a new
survey – Food and You – be developed.2
Food and You was set up as a biennial, cross-sectional survey of adults aged
16 years and over living in private households in England, Wales and Northern
Ireland. Random probability sampling ensures that everyone in the included
countries had an equal chance of being selected to take part, so the results are
representative of the population. The first three waves of the survey were
carried out by TNS BMRB (in 2010, 2012 and 2014 respectively). NatCen
Social Research (NatCen), in collaboration with the Northern Ireland Statistics
and Research Agency (NISRA), have been contracted to carry out Waves 4, 5
and 6 of the survey.
Topics have reflected the priorities and interests of the FSA and the survey has
been an important means of measuring progress against the FSA’s Strategic
Plan 2010-20153, providing evidence to assess delivery across the FSA’s
strategic objectives.4 The first wave of Food and You (2010) assessed
consumer attitudes and behaviour to food-related issues falling under the FSA’s
remit. Following Wave 1, the questionnaire was reviewed extensively in light of
responsibility for nutrition in England and Wales being transferred from FSA in
2010.4
Wave 2 (2012) focussed on food safety and hygiene issues and Wave 3 (2014)
was designed to monitor changes since the previous two waves in attitudes and
reported behaviour about food issues, to identify at-risk groups for food safety
issues, and to explore public understanding of issues regarding the FSA’s
targets. For the first time at Wave 3, results from Food and You were published
1 Further information about the CAS can be found at:
http://tna.europarchive.org/20111116080332/http://www.food.gov.uk/science/socsci/surveys/foodsafety-nutrition-diet/. 2 See SSRC 2008 report, Monitoring Public Attitudes and Behaviour – A Review of the Agency’s
Consumer Attitudes Surveys http://ssrc.food.gov.uk/sites/default/files/mnt/drupal_data/sources/files/multimedia/pdfs/ssrc0822v1.pdf 3 https://www.food.gov.uk/sites/default/files/FSA%20strategy%20document%202015-
2020_April%202015_interactive%20%282%29.pdf 4 See the FSA Strategy to 2015
http://webarchive.nationalarchives.gov.uk/20120206100416/http://food.gov.uk/multimedia/pdfs/strategy20102015.pdf

as an official statistic, reflecting the robust methodology of the survey and the
development of a regular time series of data. Wave 4 of Food and You included
new questions to cover affordability of food, choice, security and sustainability.
New questions and modifications to the Wave 4 questionnaire were tested
using cognitive testing techniques. The questionnaire was piloted prior to the
start of mainstage fieldwork. Full details are given in the Development report.
Aims
Food and You provides data about the prevalence of different attitudes,
reported behaviour and knowledge about ways in which food is purchased,
stored, prepared and eaten. The aims of Wave 4 were to provide the FSA with
data on food hygiene and food safety and other food-related issues in order to:
explore public understanding and engagement with food safety
assess knowledge of messages and interventions aimed at raising
awareness and changing behaviour
describe public attitudes to food production and the food system
monitor trends in reported behaviour, attitudes and knowledge
(compared with data from the previous three waves or from other
sources)
identify target groups for future interventions (e.g. those most at risk or
those among whom FSA policies and initiatives are likely to have the
greatest impact)
provide indicators and evidence for tracking the FSA’s strategic plans3
1.2 Sample Design
1.2.1 Sampling frame and stratification
The sample was drawn from the Postcode Address File (PAF)5, a list of all the
addresses in the UK. In order to improve cost effectiveness, the addresses
were clustered into Primary Sampling Units (PSUs), small geographical areas,
based on postcode sectors, randomly selected from across England, Wales and
Northern Ireland. A list of addresses was randomly selected from each PSU.
The primary sampling units (PSUs) were postcode sectors. Sectors with fewer
than 500 addresses were grouped with a neighbouring sector and treated as a
single PSU.
5 The sample was drawn from the ‘small users’ sub-file of the Postcode Address File (PAF), a
computer list, prepared by the Post Office, of all the addresses (delivery points) which receive fewer than 25 articles of mail a day.
A multi-stage, random probability cross-sectional design incorporating the
following stages was used:
Stratification6
Selection of:
primary sampling units (PSUs)
addresses
dwelling unit7, where necessary
households8, where necessary
participants
Probability methods were applied at each stage, so that each adult had an
equal probability of selection.
Prior to selection of PSUs, the sampling frame9 was sorted by region
(Government Office Region, with Wales and Northern Ireland both treated as
separate regions). Within each region the PSUs were sorted by the percentage
of heads of households in a non-manual occupation (NS-SEC groups 1-3), the
percentage of households with no car, and population density (persons per
hectare). This was to ensure correct socio-economic representation when the
PSUs were selected.
1.2.2 Selecting addresses and participants
A total of 6,550 addresses were selected from 262 PSUs: 183 PSUs in
England, 39 in Wales and 40 in Northern Ireland.
At each address, the interviewer established the number of dwelling units and,
in cases where there were two or more (e.g. different flats or bedsits), selected
one unit at random using a Kish grid.10
Within each selected dwelling unit the interviewer enumerated the number of
households and, in cases where there were two or more (e.g. house shares),
selected one household at random, again using a Kish grid.11
6 Prior to selection the PSU sampling frame was sorted by Government Office Region (GOR)
with Wales and Northern Ireland both treated as separate regions. Within each GOR the PSUs were sorted by percentage of Household Reference Persons in a non-manual occupation (NS-SEC groups 1-3), the percentage of households with no car, and population density (persons per hectare). This ensured correct socio-economic representation when the PSUs were selected. 7 Dwelling units were defined as addresses or parts of addresses that have a lockable front
door, and to which only the inhabitants have access. Most addresses selected from the PAF contain a single dwelling unit. However, a small number of addresses contain multiple dwelling units (such as flats or bedsits). 8 Households were defined as groups of people who share cooking facilities and a living room,
sitting room or dining room. 9 The most up-to-date (August 2014) Postcode sector file was used; this included a list of
postcode sectors and the number of addresses registered within them. 10
Using a Kish grid ensures that the unit (dwelling unit, household or household members) is selected without interviewer bias. The number of units is listed across the top of the grid, with a random number below to indicate which unit should be selected.

Within the selected household, one adult aged 16 years and over was selected
to take part in the Food and You survey. In instances where there was more
than one eligible adult within the household, the interviewer listed all members
in alphabetical order of their first name and made a random selection using a
Kish grid.11
1.3 Data Collection Fieldwork for Food and You Wave 4 was carried out between 27 May and 30
September 2016. NatCen carried out fieldwork in England and Wales; NISRA
conducted fieldwork in Northern Ireland.
Fieldwork (both for NatCen and NISRA) was issued in three batches as follows:
Batch Start date End date
1 27th May 2016 7th July 2016
2 22nd June 2016 2nd August 2016
3 22nd July 2016 30th September 2016
An advance letter and leaflet describing the purpose of the survey and inviting
households to participate was sent to all sampled addresses before the
fieldwork start date. A few days later, interviewers visited the addresses to
determine whether the address was private, residential and occupied. They
then carried out the selection process.
Interviewers were required to make up to four attempts to contact each sampled
address. These calls were made on different days of the week, and at different
times of day. At least three calls were made on a weekday evening (after 6pm)
or at a weekend to maximise the probability of contact with the household
members.
Data was collected via face-to-face interviews using a Computer Assisted
Personal Interview (CAPI) method. CAPI interviewing involves the interviewer
reading questions from a laptop screen and entering the participants’ responses
into designated fields. This automated procedure allows quick and accurate
interviewing and data transmission.
The final Wave 4 questionnaire comprised nine distinct modules, relating to a
range of different behaviours, attitudes and knowledge pertaining to the FSA’s
policy interests:
Information about household members
Eating habits
Shopping habits
Food insecurity

Food safety
Food issues
Healthy eating (Northern Ireland only)
Health
Demographics
The interview also identified the Household Reference Person (HRP)11 in each
household and asked questions about housing tenure, as well as his or her
employment, to determine the socio-economic classification of the household.12
1.4 Response rates The table below shows response rates achieved overall and in the individual
countries. For Wave 4 overall, the response rate was 52.6% in England, 58.4%
in Wales, 57.8% in Northern Ireland.
Country
England Wales
Northern Ireland
Overall
Issued Addresses (n) 4575 975 1000 6550
Ineligible (n) 390 131 93 614
Eligible 4185 844 907 5936
Unproductive (n) 2077 351 383 2811
Fully productive Interview (n) 2105 492 521 3118 Partially productive interview (n)a 3 1 3 7
Response rate (%) 50.4 58.4 57.8 52.6 a
The seven partially productive individuals started but did not complete the interview. These
cases did not count towards the response rate and were not included in the analysis dataset.
1.5 Reports and publications Main findings from across England, Wales and Northern Ireland were published
in the combined report. In addition, individual reports have been produced for
Wales and Northern Ireland. The Northern Ireland report also includes a section
on healthy eating. Users might also be interested in the Technical and
Development report. All reports can be found here:
https://www.food.gov.uk/science/research-reports/ssresearch/foodandyou
11
The ‘Household Reference Person’ (HRP) was defined as the householder (a person in whose name the property is owned or rented) with the highest income. If there was more than one householder and they had equal income, then the eldest was selected as the HRP. 12
Questions were asked to ascertain whether the HRP was in paid work at the time of the interview and, if not, whether they had ever had a paid job. If the HRP had ever worked, there were further questions about their current or most recent job in order to classify HRPs into the National Statistics Socio-economic Classification (NS-SEC) groupings.

2 Using the data
2.1 Documentation The data file contains data from Wave 4 of the FSA Food and You Survey. The
documentation has been organised into the following sections:
Interview: the CAPI questionnaire and interviewer instructions
Data: contains a list of all variables as well as a list of derived variables
including their SPSS syntax specification
Other instructions: contains interviewer and coding and editing
instructions
Please note that in some instances, variables have a different name in the CAPI
programme (as shown in the Food and You Survey Wave 4_Questionnaire file)
and in the data file. In such instances, please use the variable labels provided in
the data file as guidance.
2.2 Variables on the data file The data file contains questionnaire variables (excluding personal/identifying
and administrative data) and derived variables. The variables included in the file
are detailed in the ‘Variable List’ document. As far as possible they are grouped
in the order they were asked in the interview. As such, following the
questionnaire design, they are grouped according to topic. This ‘Variable List’
document is the best place to look/search for variables when planning your
analysis.
Once you have decided which variables to include in your analysis, you should
look up details of the question wording using the questionnaire documentation,
or use the data documentation to find the syntax which produced the derived
variables. You cannot rely on the individual variable and value labels to always
capture the detail of the question asked, or the answer categories used, so
reading the interview documentation is essential.
For variables with answers following a scale, such as ‘Strongly agree’ to
‘Strongly disagree’ it must be noted that the order of the answer categories may
not systematically follow an ascending or descending scale throughout the list
of variables. Also the answers may equally refer to positive or negative
statements. The phrasing of the question and the list of answers provided on
the show cards – if any – shape the variables. The user must therefore take
these variations into account when creating derived variables.

2.3 Multi-coded questions Some questions in the survey enabled participants to give more than one
answer. In the final dataset each of the answer options has been converted into
a binary variable with the people who selected that option coded 1 and the rest
coded 0.
As an example, question Q2_7 is a ‘CODE ALL THAT APPLY’ question which
asks ‘Which, if any, of the following applies to you?’. The code frame consists of
5 values:
1. Completely vegetarian
2. Partly vegetarian
3. Vegan
4. Avoid certain foods for religious or cultural reasons
5. None
The five answer options have been converted into five separate binary variables
as follows:
Q2_71 – code 1: those who are completely vegetarian; code 0: those who are
not completely vegetarian.
Q2_72 – code 1: those who are partly vegetarian; code 0: those who are not
partly vegetarian.
Q2_73 – code 1: those who are vegan; code 0: those who are not vegan.
Q2_74 – code 1: those who avoid certain foods for religious or cultural reasons;
code 0: those who do not avoid certain foods for religious or cultural reasons.
Q2_75 – code 1: those of whom none of the answer options applied to; code 0:
everyone else.
Because a respondent could have replied with more than one answer, that
respondent could have a value 1 for a number of these variables (however, the
nature of the question dictates that having a code 1 at Q2_75 precludes having
a code 1 at any of the variables Q2_71 – Q2_74). The missing values are same
across all five variables.
2.4 Missing value conventions These missing value conventions have also been applied to most of the derived
variables as well as the original questionnaire variables. The derived variable
specifications should be consulted for details.
-1 Item not applicable: used to signify that a particular variable did not apply
to a given respondent usually because of internal routing. For example,

participants who said they were vegetarian or vegan would not be routed
into the question ‘How often do you eat cuts or portions of beef, lamb or
pork (e.g. joints steak, chops)?
-8 Don’t know/Can’t say.
-9 No answer/Refused.
2.5 Notes about particular variables
2.5.1 Food Security
This section explains how the variable Food Security was scored. Household
food security status is measured by the responses to a series of questions
about behaviours and experiences associated with difficulty in meeting food
needs. The ten questions used in Food and You are those used by the United
States Department of Agriculture Economic Research Service.13 Responses are
allocated a score and households are categorised as follows:
1. High food security (score = 0): households had no problems, or anxiety about, consistently accessing adequate food.
2. Marginal food security (score = 1 – 2): households had problems at times, or anxiety about, accessing adequate food, but the quality, variety and quantity of their food intake were not substantially reduced.
3. Low food security (score = 3 – 5): households reduced the quality, variety, and desirability of their diets, but the quantity of food intake and normal eating patterns were not substantially disrupted.
4. Very low food security (score 6 – 10): at times during the year, eating patterns of one or more household members were disrupted and food intake reduced because the household lacked money and other resources for food.
Examples of the questions asked are:
Was this statement often, sometimes, or never true for you in the last 12 months? “We worried whether our food would run out before we got money to buy more.”
Or
13
See www.ers.usda.gov/topics/food-nutrition-assistance/food-security-in-the-us/ measurement/ for further details. The United States Department of Agriculture (USDA) monitors the extent and severity of food insecurity in U.S. households through an annual, nationally representative survey sponsored and analysed by USDA’s Economic Research Service.

In the last 12 months, did you ever not eat for a whole day because there wasn’t enough money for food?
Responses of ‘yes’, ‘often’, sometimes’, ‘almost every month’ and ‘some months but not every month’ are coded as affirmative. The sum of affirmative responses to the 10 questions in the Adult Food Security Scale is the household’s raw score on the scale.
2.5.2 Index of Recommended Practice
Food and You asks respondents a series of questions about whether they
follow recommended practices in relation to five important elements or
‘domains’ of food safety: cleanliness, cooking, chilling, avoiding cross-
contamination and use by dates. To get an overall picture of people’s food
safety behaviour, however, it is useful to look across all five domains. The Index
of Recommended Practice (IRP) is a composite measure of food hygiene
knowledge and behaviours within the home, which includes 17 questions from
each of the five domains.14
Questions were selected for the IRP because they mapped onto practices that,
if not followed, were more likely to increase the risk of foodborne disease. Each
item scores 1 for response in line with recommended practice (RP) or 0 for
responses not in line with recommended practice (NRP). For example, within
the chilling domain, respondents were asked:
‘Do you ever check your fridge temperature?’
Respondents who answered ‘yes’, ‘someone else in the household does’ or ‘I
don’t need to as it has an alarm’ were coded as 1 (RP). Respondents who
answered ‘no’ or ‘don’t know’ were coded as 0 (NRP). See the Research Report
for the response coding of all 17 questions.14
The overall score of the 17 questions is then converted to a score out of 100. A
higher score indicates more reported behaviours that are in line with
recommended food safety practices. It is important to note that IRP gives an
overall indication of whether recommended practices are being followed and is
useful for comparing across subgroups but it does not inform about individual
behaviours.
14
https://www.food.gov.uk/science/research-reports/ssresearch/foodandyou/fs409012-2

3 Weighting
The weighting procedure for Wave 4 followed the same procedure applied in
the first three waves of the study, and included:
Calculation of selection (design) weights. These were applied to correct for
the lower selection probabilities of adults aged 16+ in multi-adult
households/dwellings, as well as for the selection of one dwelling
unit/household if two or more were found at the selected address. The design
weight also corrected for the over representation of Wales and Northern Ireland
relative to England (as a result of the boosted samples in those countries).
In order to ensure the results from each country were representative of that
country’s population, the achieved interviews were calibrated separately for
each country to known population distributions of:
In England: working status by gender, age by gender, and region
In Wales/Northern Ireland: working status by gender, and age group
This accounted for differential non-response on these variables. The calibration
results within each country were combined to create cweight – to be used for
the analysis within country.
The Wave 4 population totals for age, gender and region were obtained from
the ONS 2016 Mid-Year Population Estimates. The employment status data
was gathered from the latest available Labour Force Survey (LFS) data
released in November 2016.15 Employment data for individuals aged 16+ was
split into four categories as follows:
Female in employment
Female not in employment
Make in employment
Male not in employment16
Finally, the countries were scaled to their correct proportion and combined to
calculate a weight for analysis of the whole dataset (ukweight).
15
In the first three waves of Food&You the Annual Population Survey (APS) was used as the source of population totals of working status. As the Labour Force Survey (LFS) data was considered to be a more reliable source of population estimates, this was adopted for Wave 4. The 2016 working status numbers from LFS and APS are comparable, hence no bias is expected to be introduced as a result of this change. 16
In the first three waves Food&You, the following categories of employment status by gender were used: male full time, male not full time, women working, and women not working. For Wave 4, mean and women are treated similarly and are split into two groups: in employment and not in employment.
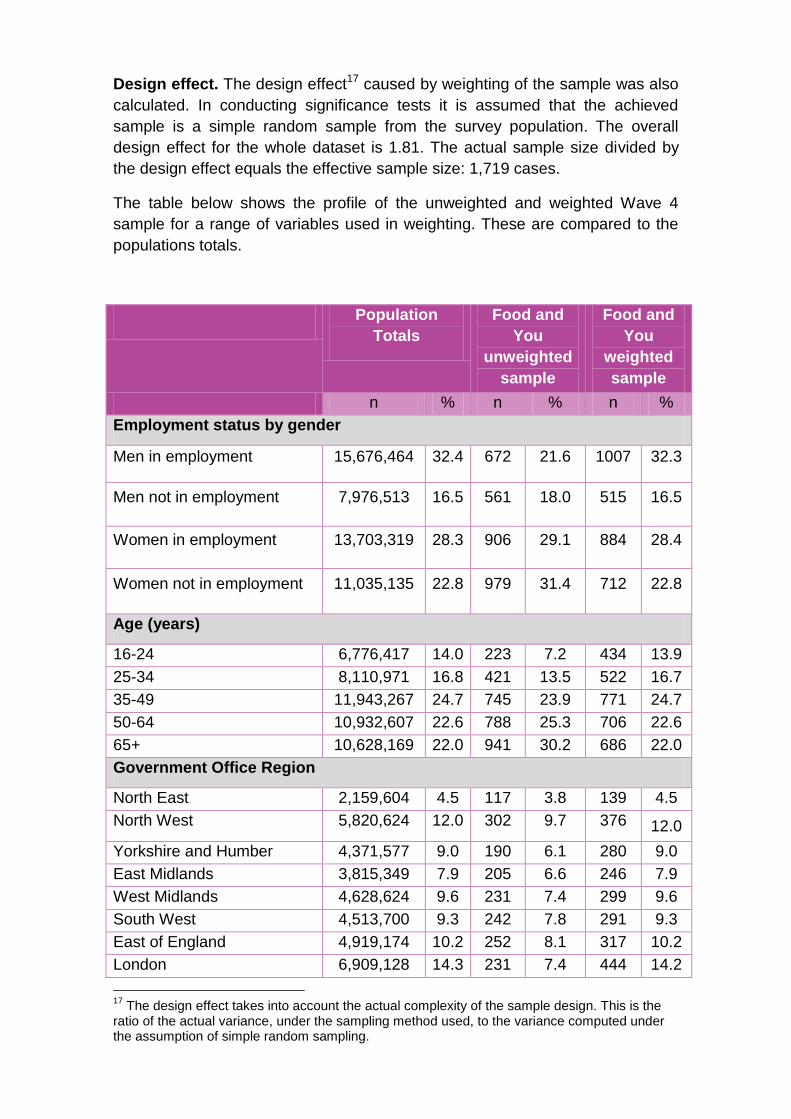
Design effect. The design effect17 caused by weighting of the sample was also
calculated. In conducting significance tests it is assumed that the achieved
sample is a simple random sample from the survey population. The overall
design effect for the whole dataset is 1.81. The actual sample size divided by
the design effect equals the effective sample size: 1,719 cases.
The table below shows the profile of the unweighted and weighted Wave 4
sample for a range of variables used in weighting. These are compared to the
populations totals.
Population
Totals
Food and
You
unweighted
sample
Food and
You
weighted
sample
n % n % n %
Employment status by gender
Men in employment 15,676,464 32.4 672 21.6 1007 32.3
Men not in employment 7,976,513 16.5 561 18.0 515 16.5
Women in employment 13,703,319 28.3 906 29.1 884 28.4
Women not in employment 11,035,135 22.8 979 31.4 712 22.8
Age (years)
16-24 6,776,417 14.0 223 7.2 434 13.9
25-34 8,110,971 16.8 421 13.5 522 16.7
35-49 11,943,267 24.7 745 23.9 771 24.7
50-64 10,932,607 22.6 788 25.3 706 22.6
65+ 10,628,169 22.0 941 30.2 686 22.0
Government Office Region
North East 2,159,604 4.5 117 3.8 139 4.5
North West 5,820,624 12.0 302 9.7 376 12.0
Yorkshire and Humber 4,371,577 9.0 190 6.1 280 9.0
East Midlands 3,815,349 7.9 205 6.6 246 7.9
West Midlands 4,628,624 9.6 231 7.4 299 9.6
South West 4,513,700 9.3 242 7.8 291 9.3
East of England 4,919,174 10.2 252 8.1 317 10.2
London 6,909,128 14.3 231 7.4 444 14.2
17
The design effect takes into account the actual complexity of the sample design. This is the ratio of the actual variance, under the sampling method used, to the variance computed under the assumption of simple random sampling.

South East 7,243,433 15.0 335 10.7 467 15.0
Wales 2,543,797 5.3 492 15.8 164 5.3
Northern Ireland 1,466,421 3.0 521 16.7 94 3.0


