Food choice • Foraging: the act of an animal searching for food • Animals seek out food sources that will give them the most energy reward for the least amount of energy expended • Today: examine foraging behaviors of birds in the quad
Transcript
Food choice
• Foraging: the act of an animal searching for food
• Animals seek out food sources that will give them the most energy reward for the least amount of energy expended
• Today: examine foraging behaviors of birds in the quad
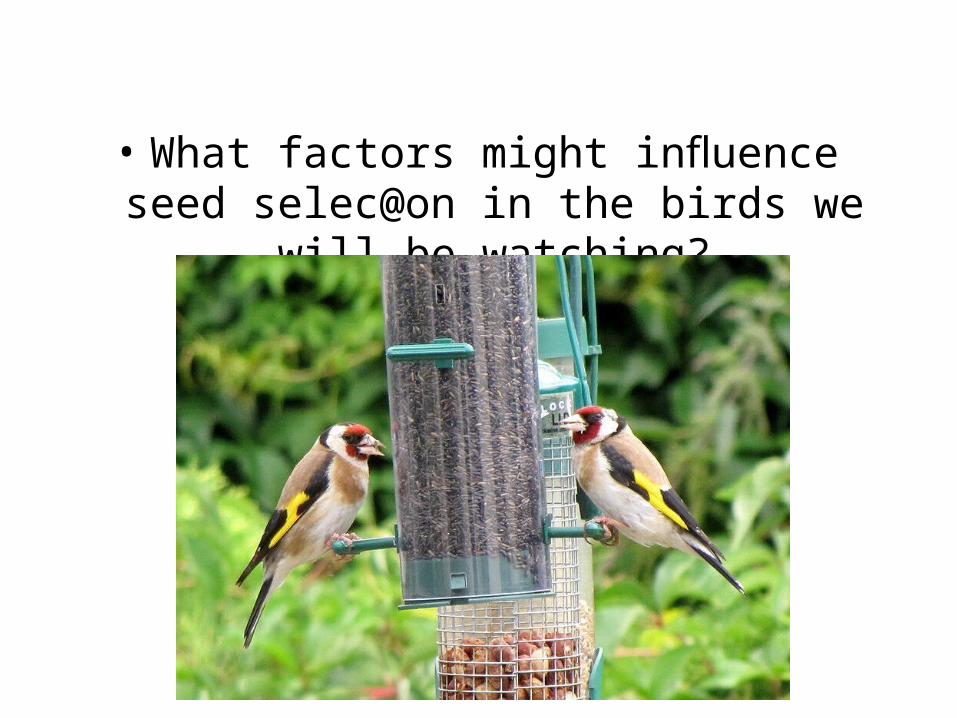
• What factors might influence seed selec@on in the birds we will be watching?
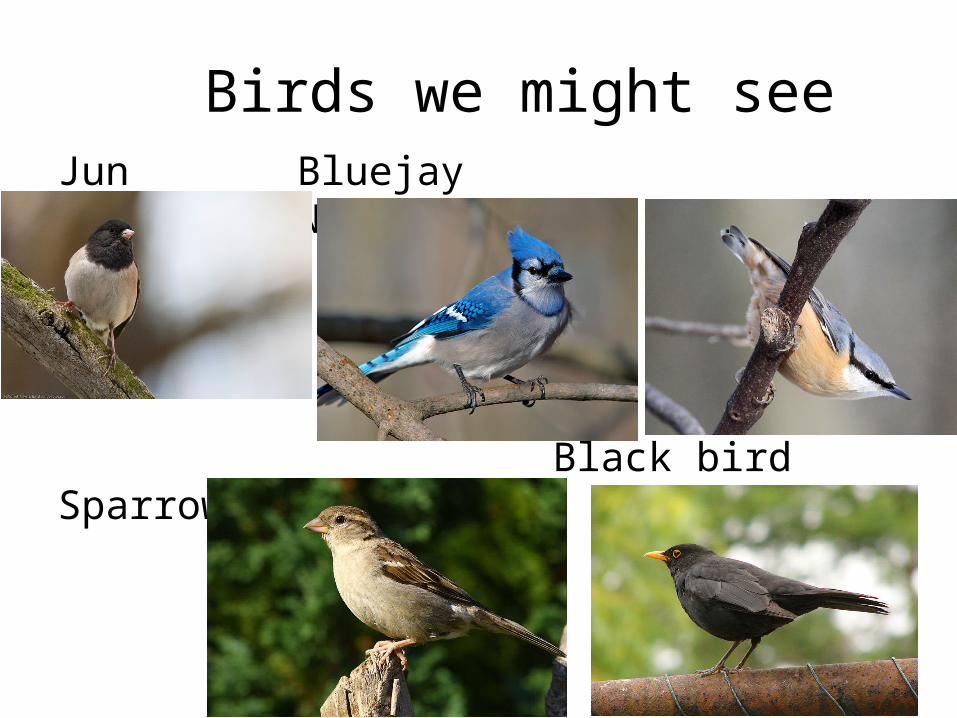
Birds we might seeJunco Bluejay NuthatcherHH H H
Black birdSparrow
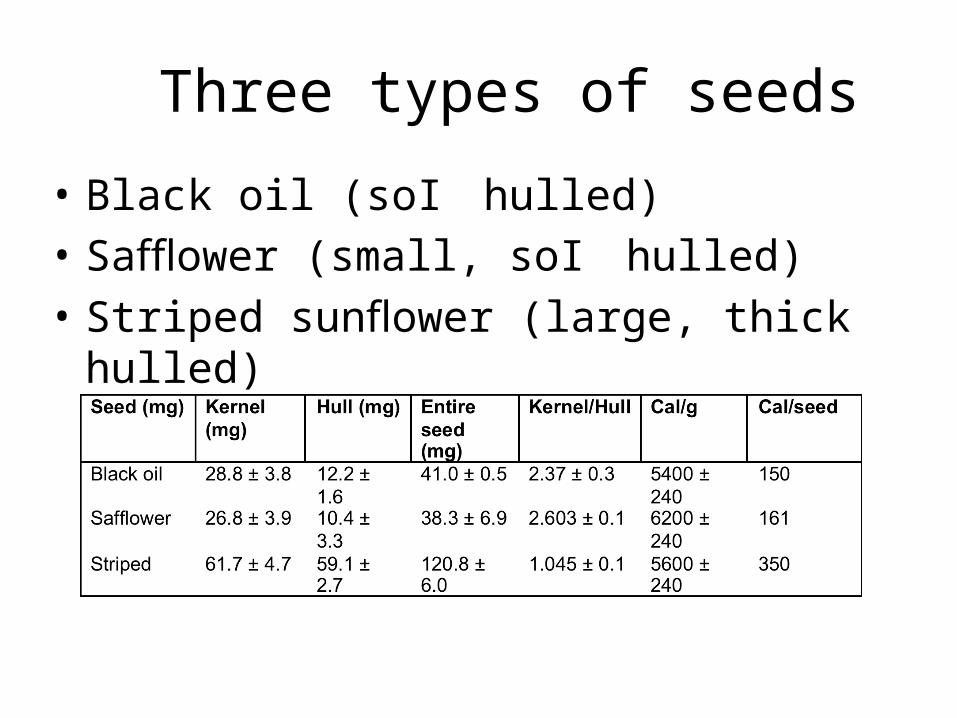
Three types of seeds
• Black oil (soI hulled)• Safflower (small, soI hulled)• Striped sunflower (large, thick hulled)
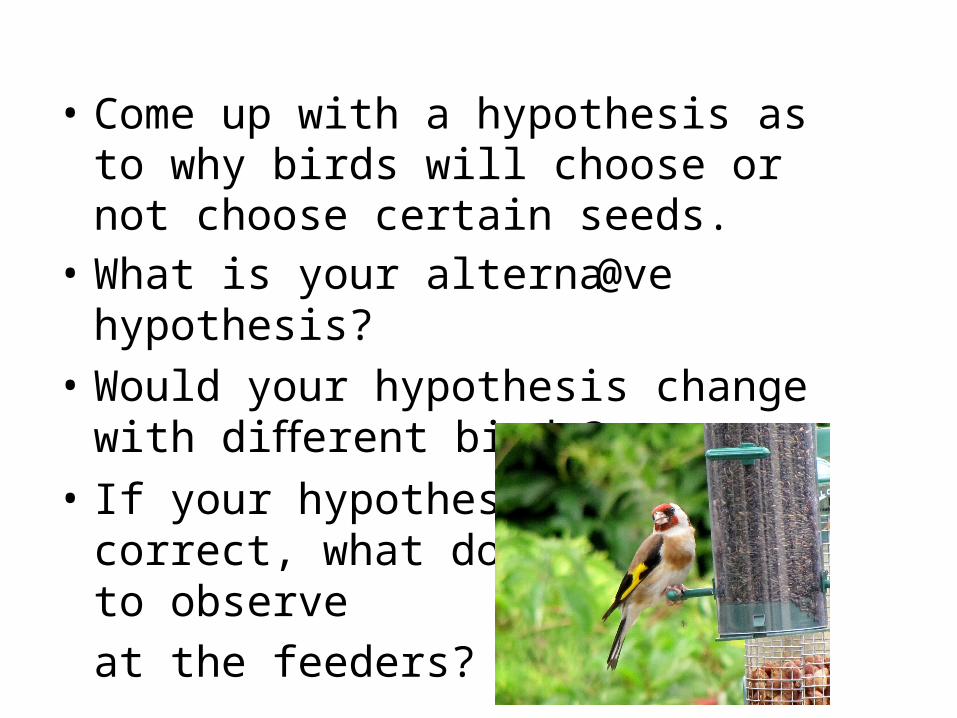
• Come up with a hypothesis as to why birds will choose or not choose certain seeds.
• What is your alterna@ve hypothesis?• Would your hypothesis change with different
birds?• If your hypothesis is correct, what do you
expect to observeat the feeders?
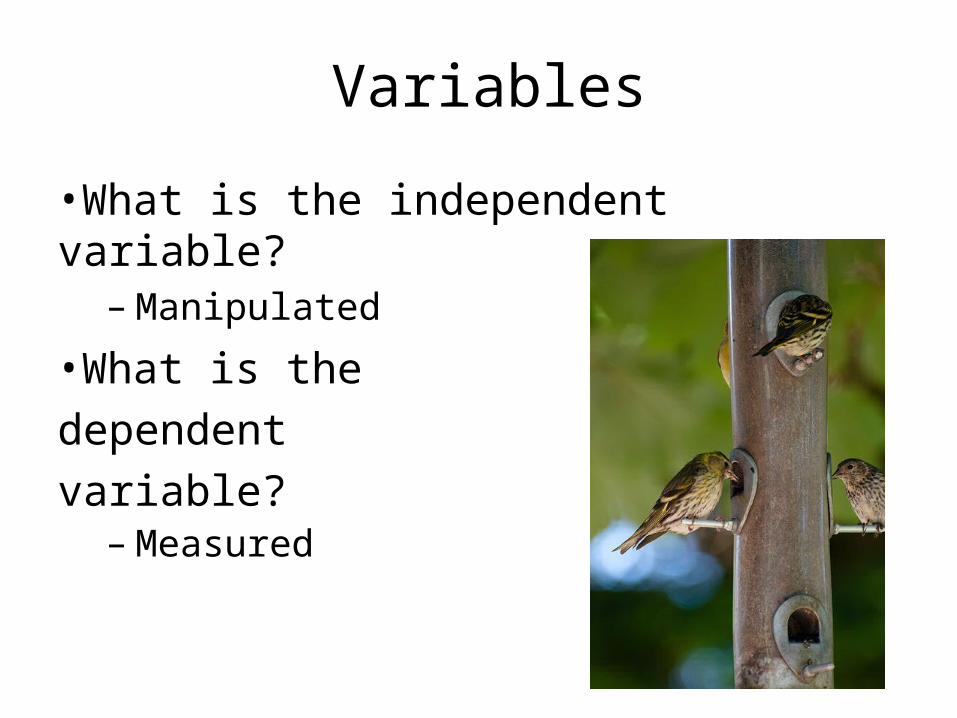
Variables
•What is the independent variable?– Manipulated
•What is the dependent variable?– Measured
Observa@ons: 20 minutes
• Try to be quiet and s@ll• What species of birds appear?• What types of seeds does each species eat?• How long does it take an individual bird to eat a
seed and return to the feeder?• Do different species of birds have different seed
handling techniques?• Record all of your data!
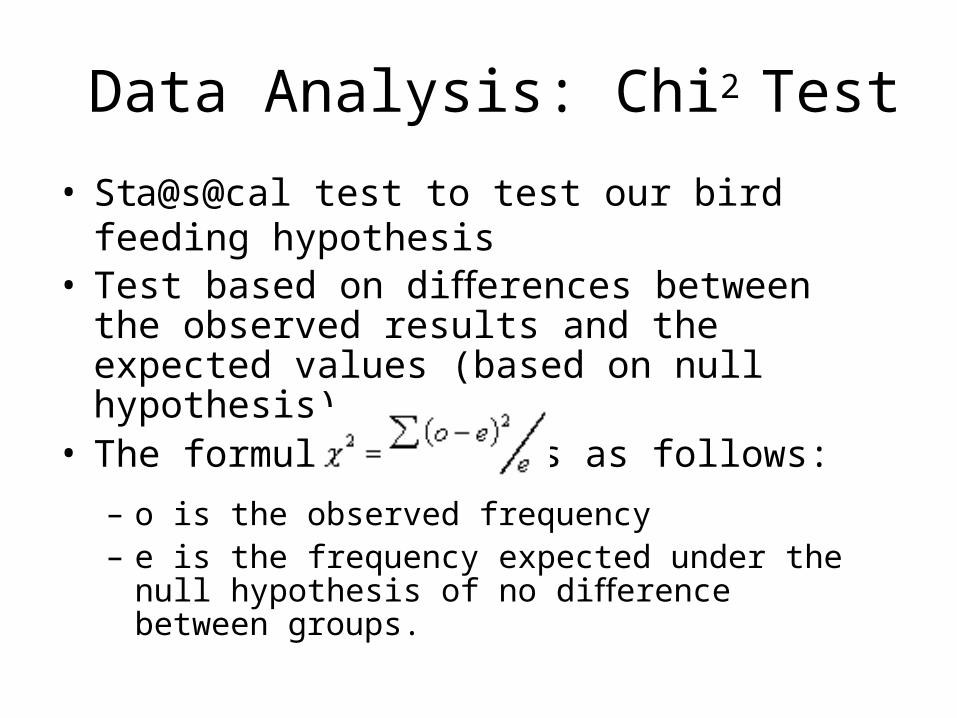
Data Analysis: Chi2 Test
• Sta@s@cal test to test our bird feeding hypothesis
• Test based on differences between the observed results and the expected values (based on null hypothesis)
• The formula for X2 is as follows:
– o is the observed frequency– e is the frequency expected under the null hypothesis of
no difference between groups.
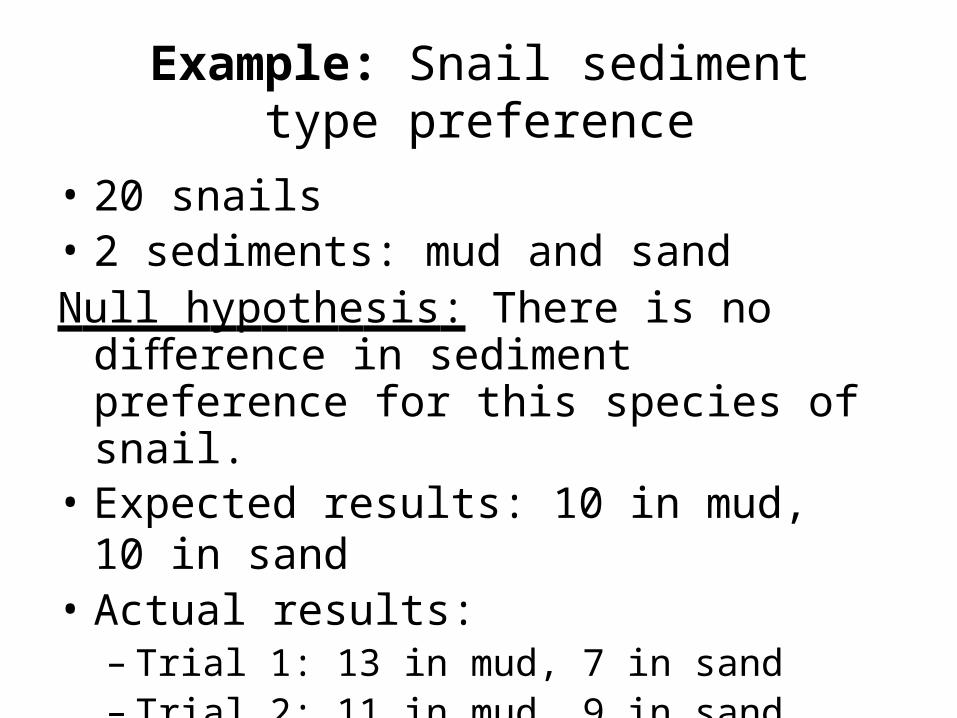
Example: Snail sediment type preference
• 20 snails• 2 sediments: mud and sandNull hypothesis: There is no difference in
sediment preference for this species of snail.• Expected results: 10 in mud, 10 in sand• Actual results:– Trial 1: 13 in mud, 7 in sand– Trial 2: 11 in mud, 9 in sand
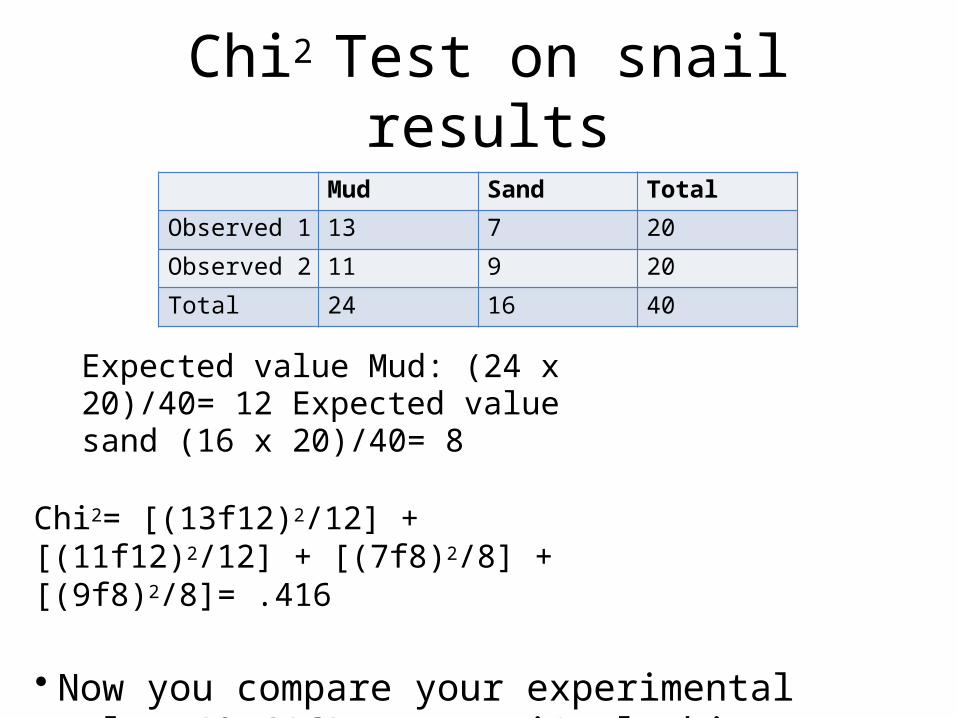
Chi2 Test on snail results
Expected value Mud: (24 x 20)/40= 12 Expected value sand (16 x 20)/40= 8