Food Consumption Trends in Urban China: Opportunities and Implications for Mekong Region Agriculture by James Seale, Jr., Junfei Bai, Tom Wahl, and Bryan Lohmar* Presentation at Workshop, Partnering for Smallholder Inclusive Market Opportunities in the Mekong, Hanoi, Vietnam *University of Florida, China Agricultural University, North Dakota State University, and U.S. Grains Council, China
Transcript
Food Consumption Trends in Urban China: Opportunities and Implications for
Mekong Region Agriculture
by James Seale, Jr., Junfei Bai, Tom Wahl, and Bryan Lohmar*
Presentation at Workshop, Partnering for Smallholder Inclusive Market Opportunities
in the Mekong, Hanoi, Vietnam
*University of Florida, China Agricultural University, North Dakota State University, and U.S. Grains Council, China
This project was jointly funded by U.S. Department of Agriculture (USDA) AFRI and Emerging Markets Program (EMP) grants, Chinese Academy of Sciences, and the National Foundation of Sciences, China
• Team includes: • Center for China Agricultural Policy (CCAP) • China Academy of Sciences • China Agricultural University • Economic Research Service, USDA • Foreign Agricultural Service, USDA • North Dakota State University • Washington State University • University of Florida
Geographic Distribution
Beijing
Chengdu
Xi’an
Xiamen
Nanjing
Shenyang
Harbin
Nanning
Taiyuan
Taizhou
Lanzhou
Data
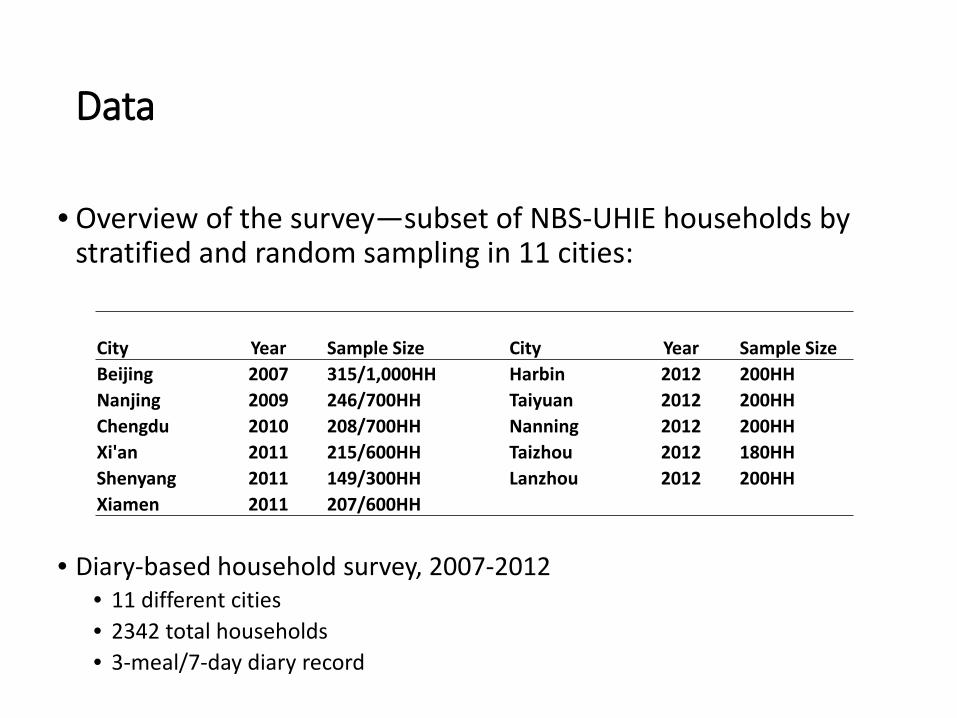
• Overview of the survey—subset of NBS-UHIE households by stratified and random sampling in 11 cities:
• Diary-based household survey, 2007-2012 • 11 different cities • 2342 total households • 3-meal/7-day diary record
Survey Coverage National Bureau of Statistics, China
Survey
Food At Home (FAH ): What was eaten (commodities) Yes 79 How much: Quantity & Exp.& Price E&Q – no prices Yes
When Monthly Meal Where (purchase venue) NO Yes Processed degree NO Yes Food Away From Home (FAFH ):
Dishes (commodities) No 79 How much: Quantity & Exp. Exp. only Q&E When Monthly Meal Where (food outlets) No Yes Who paid No Yes
National Bureau of Statistics,
China
Beijing 10 Other Cities
Demographics Etc.:
Demographics Yes Yes Yes
Preference for food safety No Yes Yes
WTP for traceability No No Yes
Knowledge of certification No No Yes
School meal & Children Health No Yes Yes
Food establishment census survey No No
No
Phase II food establishment survey No No No
Survey Coverage
Food quantity data were converted to nutritional elements for each kind of food consumed based on the China Food Composition Book from Institute of Nutrition and Food Safety China CDC, Beijing 2009
7
MAPPING DISHES INTO 79 COMMODITIES & NUTRIENTS
(BJ: 2,900+) (NJ: 2,000+) (CD: 2,000+)
Recipe Matrix (1) 32 different cook books, about
9000+ recipes (2) 50 chef survey for unknown
recipes & parameter estimation to adjust weight by type of food facility
We Know that Income Growth and Urbanization in China are Causing:
1) Demand growth for food grain to slow
=> Or reversing - urban residents consume about half the food grain of their rural counterparts
2) Demand for animal proteins to rise => Animal production is not only growing but consolidating into large,
modern operations
3) Demand for fruit and vegetables to rise => Along with animal proteins, demand for other non-grain foods is rising
4) Demand for other attributes to rise => Demand for variety, convenience, quality, and, above all, food safety is growing
8
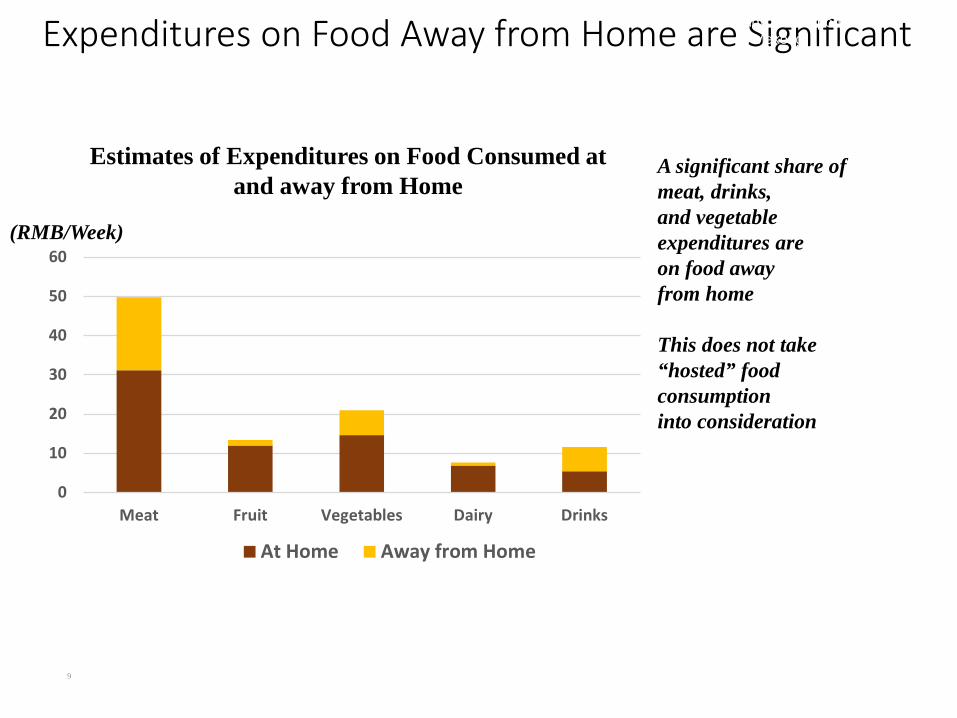
Expenditures on Food Away from Home are Significant
9
0
10
20
30
40
50
60
Meat Fruit Vegetables Dairy Drinks
At Home Away from Home
(RMB/Week)
Estimates of Expenditures on Food Consumed at and away from Home
A significant share of meat, drinks, and vegetable expenditures are on food away from home This does not take “hosted” food consumption into consideration
China Food Study and Opportunities for Mekong
Purchasing Venue Varies by Product
10
China Food Study and Opportunities for Mekong
Traditional “wet” markets still common for fresh goods Supermarkets popular for processed products
0
20
40
60
80
100
Meat Fruit Vegetables Dairy Beverages
Supermarket Traditional Market Convenience Store
Corner Store Other
Venue for Purchasing Various Food Products
Regional Variation in Consumer Purchasing Venues
11
0
20
40
60
80
100
North South North South North South North South North South
Meat Fruit Vegetbles Dairy Beverages
Supermarket Traditional Market Convenience Store
Corner Store Other
Traditional “wet” markets more common in the South Supermarkets more common in the North Particularly for meat!
North-South Difference in Purchasing Venues
China Food Study and Opportunities for Mekong
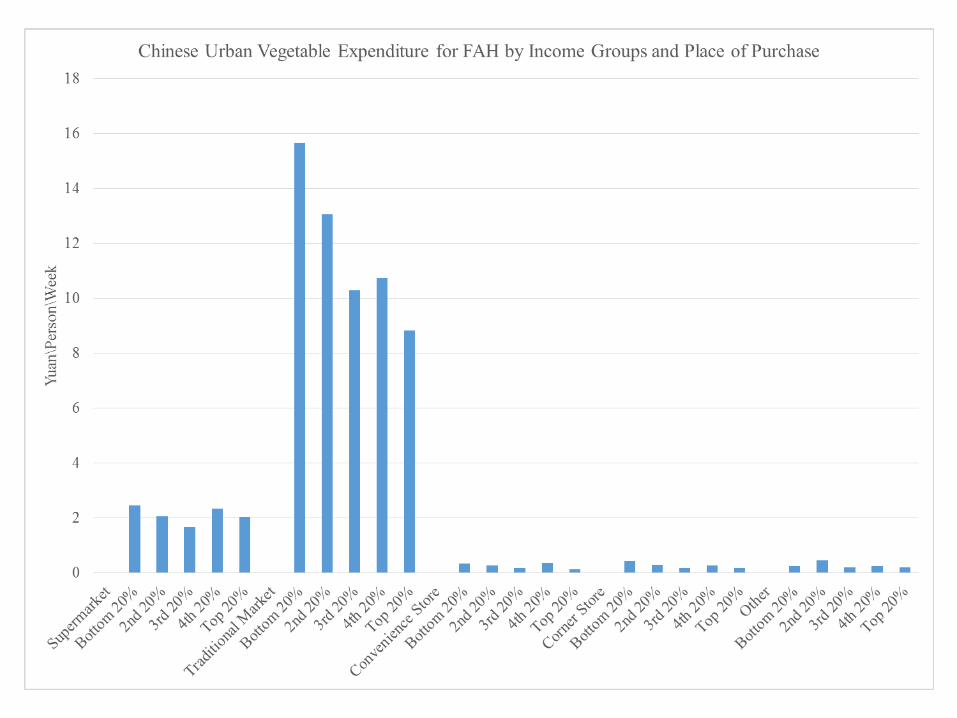
Income Variation in Food Purchasing Venue
12
0
20
40
60
80
100
Low High Low High Low High Low High Low High
Meat Fruit Vegetbles Dairy Beverages
Supermarket Traditional Market Convenience Store
Corner Store Other
High-Low Income Difference in Purchasing Venues
Supermarkets more common as Incomes go up Convenience stores go down as incomes go up
China Food Study and Opportunities for Mekong
0%
10%
20%
30%
40%
50%
60%
70%
80%
90%
100%
North South East West Combined
Chinese Urban Meat Expenditure by Region
FAFHFAH
Income Effect: Inverted-U shape for MAH
0.0
1.0
2.0
3.0
4.0
5.0
6.0
Pork Beef Mutton Poultry EdibleOffal
Others Total
kg/p
erso
n/m
onth
Low 1/3
Mid 1/3
High 1/3
Income Effect: Monotonously increasing for MAFH
0.0
0.5
1.0
1.5
2.0
2.5
Pork Beef Mutton Poultry EdibleOffal
Others Total
kg/p
erso
n/m
onth
Low 1/3
Mid 1/3
High 1/3
Income Effect: Increasing for MAH & MAFH
0.0
1.0
2.0
3.0
4.0
5.0
6.0
7.0
Pork Beef Mutton Poultry EdibleOffal
Others Total
kg/p
erso
n/m
onth
Low 1/3
Mid 1/3
High 1/3
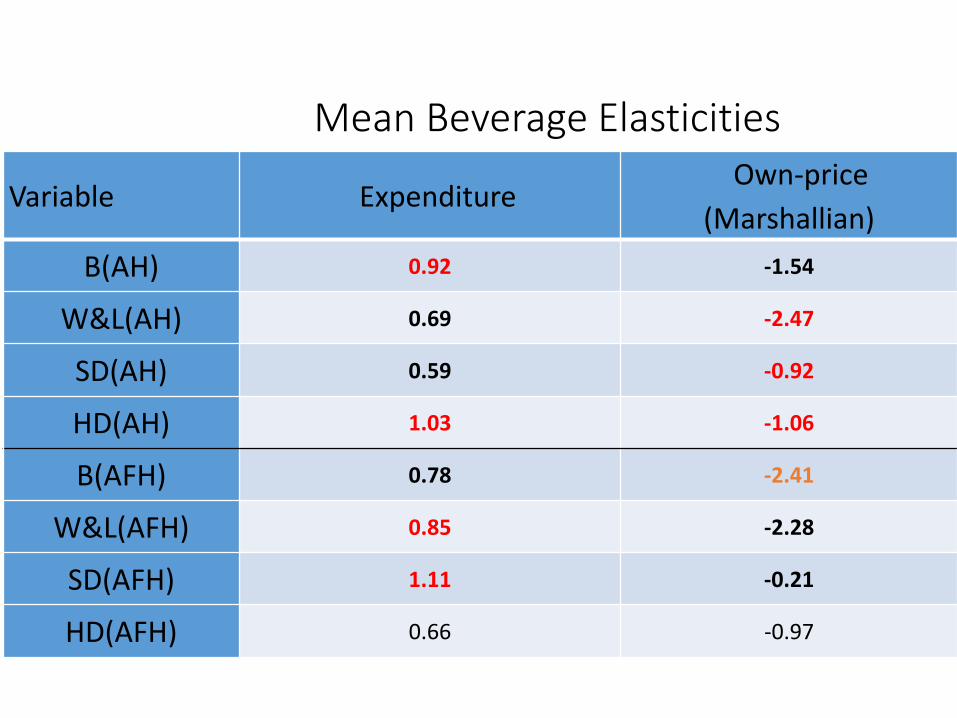
Estimated Exp. & Own-price Elasticities 8-equation system 4-equation system
• MAFH accounts for a significant proportion of meat consumption. Projection based on data excluding MAFH could mislead the understanding.
• MAFH have consistently higher expenditure elasticities and own-price elasticties, suggesting that with income and total meat expenditure increases, MAFH consumption will increase more than proportionately to total meat expenditure.
• Household expenditure on poultry, beef and mutton will increase more than proportionately to total meat expenditure with income increases.
• MAFH consumption is more price-responsive than MAH, especially for beef & mutton
Apparently, consumers lack knowledge about these certificates
0%
5%
10%
15%
20%
25%
30%
Green food China top brand Quality safe No harm Inspection Exemption
Organic food
Food Consumption and Food Safety
36
What is the most important thing you take into consideration when making purchasing decisions?
Safety is an important factor in consumers’ purchasing decisions So are “appearance” and “brand”
How Consumers Determine Safety
37
What is the most important thing you take into consideration to determine food safety?
Consumers use a variety of strategies to determine food safety With “appearance” and “brand” among them
China Food Study and Opportunities for Mekong
Obesity Study
• Average median BMI of the urban Chinese is 22.86 for men and 21.76 for women.
• 26.6% of the urban Chinese are overweight (24.0 ≤ 𝐵𝐵𝐵 < 28.0) and 5% are obese (B𝐵𝐵 ≥ 28.0).
• Food eating locations have significant effects on the BMI levels of urban Chinese. Conclusions
Summary
• Meals eaten at full service restaurants, fast food outlets, cafeterias have significant and positive effects on BMI, meals at other outlets have no significant effect BMI increase.
• Fast food has largest effect at the lower and upper tail of BMI distribution. • Fast food has the largest marginal effect on the likelihood of becoming
overweight.
Weight Grouping Criteria
Source: Ministry of Health of the People’s republic of China; Center for Disease Control and Prevention
Prevalence of Obesity
5.6
62.8
26.6
5
5.5
65.7
23.4
5.5
4.4
58.3
30.8
6.5
11.4
65.7
20
3
4.7
60
29
6.3
4.6
56.9
33.2
5.4
6.5
67.6
22.1
3.9
5.3
66.8
22.9
5
3.7
61.7
30.4
4.20
2040
6080
100
%
Average Xian Shenyang Xiamen Harbin Taiyuan Taizhou Nanning Lanzhou
Underweight NormalOverweight Obese
Take away Messages
1. FAFH consumption is significant in urban
households, suggesting any exclusion of FAFH may mislead the understanding of food security challenges in a nation.
2. FAFH shares in terms of both volume and value increase with income growth, suggesting a growing market for food catering industry.
Take away Messages, cont.
3. Food composition differs between FAFH and
FAH, suggesting that we cannot extrapolate one by weighting the other.
4. Per capita demand for many food commodities such as meat, aquatic products, eggs, and vegetables are still rising with income when one takes FAFH into consideration, but it shows an inverted U-shape for FAH alone.
Take away Messages, cont.
5. In addition to income, household
demographics and time opportunity cost are important factors influencing FAFH in both market participation and expenditure levels.
6. Food safety has become an important concern in urban China when people buy food. It is likely the case in many other developing countries, including Vietnam.
Thank You!
A Significant Share of Meat Consumption is Away from Home
45
Kg/
pers
on/y
ear
Urban Meat Consumption at and Away from Home by Income Quintile, Beijing, 2007
Source: Survey by Center for Chinese Agricultural Policy
Data on meat consumption at home shows little or no income effect Including consumption away from home captures income effect