EYE ON THE MARKET Food Fight: An update on private equity performance vs public equity markets MICHAEL CEMBALEST | JP MORGAN ASSET AND WEALTH MANAGEMENT Food Fight. Every two years, we take a close look at the performance of the private equity industry given its rising share of institutional and individual portfolios. Our findings this year: the private equity industry is still outperforming public equity, but this outperformance is narrrowing as all markets benefit from non-stop monetary and fiscal stimulus, and as private equity acquisition multiples rise. We examine manager dispersion, benchmarks, co-investing, GP-led secondary funds, the torrid pace of industry fundraising and manager fees in this year’s piece.
Transcript
EYE ON THE MARKET
Food Fight: An update on private equity performance vs public equity markets MICHAEL CEMBALEST | JP MORGAN ASSET AND WEALTH MANAGEMENT
Food Fight. Every two years, we take a close look at the performance of the private equity industry given its rising share of institutional and individual portfolios. Our findings this year: the private equity industry is still outperforming public equity, but this outperformance is narrrowing as all markets benefit from non-stop monetary and fiscal stimulus, and as private equity acquisition multiples rise. We examine manager dispersion, benchmarks, co-investing, GP-led secondary funds, the torrid pace of industry fundraising and manager fees in this year’s piece.
1
MICHAEL CEMBALEST Chairman of Market and Investment Strategy
J.P. Morgan Asset Management
Every two years, we examine the performance of the private equity industry given its rising share of institutional and individual portfolios. Our findings: private equity is still outperforming public equity, but outperformance narrowed as all markets benefit from non-stop stimulus, and as private equity acquisition multiples rise. We examine manager dispersion, benchmarks, co-investing, GP-led secondary funds, the torrid pace of industry fundraising and manager fees in this year’s piece.
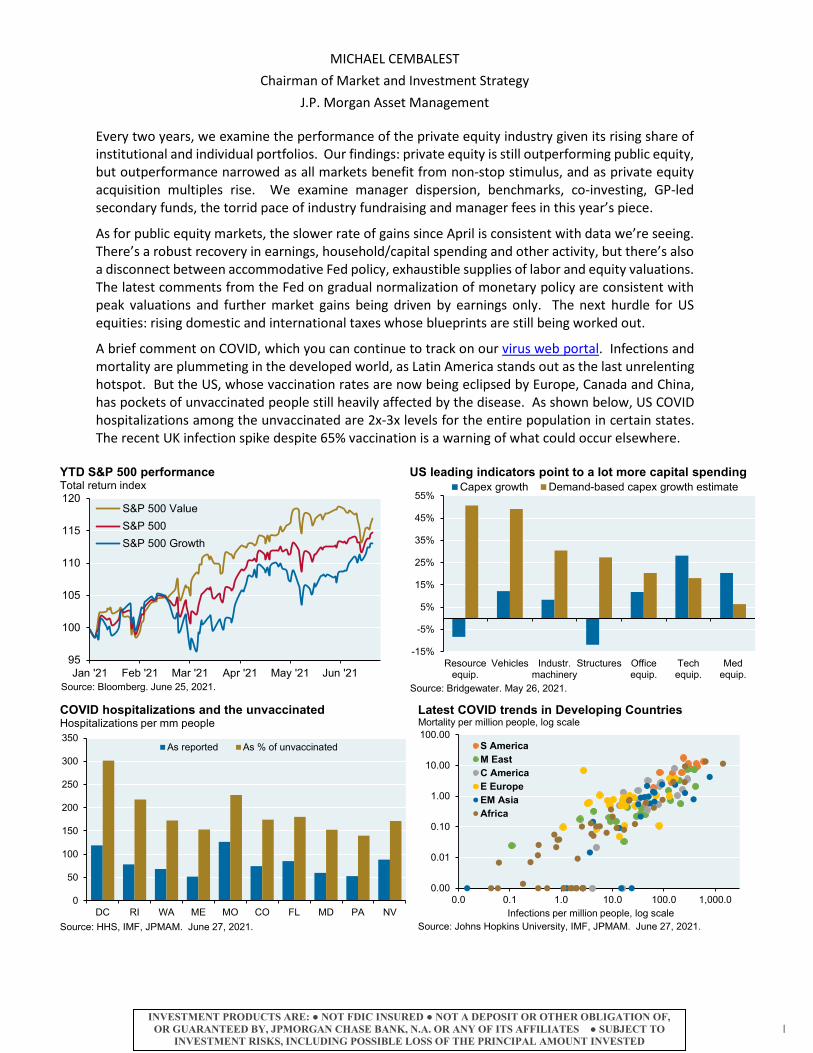
As for public equity markets, the slower rate of gains since April is consistent with data we’re seeing. There’s a robust recovery in earnings, household/capital spending and other activity, but there’s also a disconnect between accommodative Fed policy, exhaustible supplies of labor and equity valuations. The latest comments from the Fed on gradual normalization of monetary policy are consistent with peak valuations and further market gains being driven by earnings only. The next hurdle for US equities: rising domestic and international taxes whose blueprints are still being worked out.
A brief comment on COVID, which you can continue to track on our virus web portal. Infections and mortality are plummeting in the developed world, as Latin America stands out as the last unrelenting hotspot. But the US, whose vaccination rates are now being eclipsed by Europe, Canada and China, has pockets of unvaccinated people still heavily affected by the disease. As shown below, US COVID hospitalizations among the unvaccinated are 2x-3x levels for the entire population in certain states. The recent UK infection spike despite 65% vaccination is a warning of what could occur elsewhere.
95
100
105
110
115
120
Jan '21 Feb '21 Mar '21 Apr '21 May '21 Jun '21
S&P 500 ValueS&P 500S&P 500 Growth
YTD S&P 500 performanceTotal return index
Source: Bloomberg. June 25, 2021.
-15%
-5%
5%
15%
25%
35%
45%
55%
Resourceequip.
Vehicles Industr.machinery
Structures Officeequip.
Techequip.
Medequip.
Capex growth Demand-based capex growth estimateUS leading indicators point to a lot more capital spending
Source: Bridgewater. May 26, 2021.
0
50
100
150
200
250
300
350
DC RI WA ME MO CO FL MD PA NV
As reported As % of unvaccinated
COVID hospitalizations and the unvaccinatedHospitalizations per mm people
Source: HHS, IMF, JPMAM. June 27, 2021.
0.00
0.01
0.10
1.00
10.00
100.00
0.0 0.1 1.0 10.0 100.0 1,000.0
S AmericaM EastC AmericaE EuropeEM AsiaAfrica
Latest COVID trends in Developing Countries
Source: Johns Hopkins University, IMF, JPMAM. June 27, 2021.
Mortality per million people, log scale
Infections per million people, log scale
INVESTMENT PRODUCTS ARE: ● NOT FDIC INSURED ● NOT A DEPOSIT OR OTHER OBLIGATION OF, OR GUARANTEED BY, JPMORGAN CHASE BANK, N.A. OR ANY OF ITS AFFILIATES ● SUBJECT TO
INVESTMENT RISKS, INCLUDING POSSIBLE L OSS OF THE PRINCIPAL AMOUNT INVESTED
EYE ON THE M ARKET • M I CHAEL CEMB AL EST • J .P . MORG A N Acce s s o ur fu l l co ro nav ir u s a na ly s i s w e b port a l h er e Ju ne 28, 20 21
2
Food Fight: 2021 private equity update
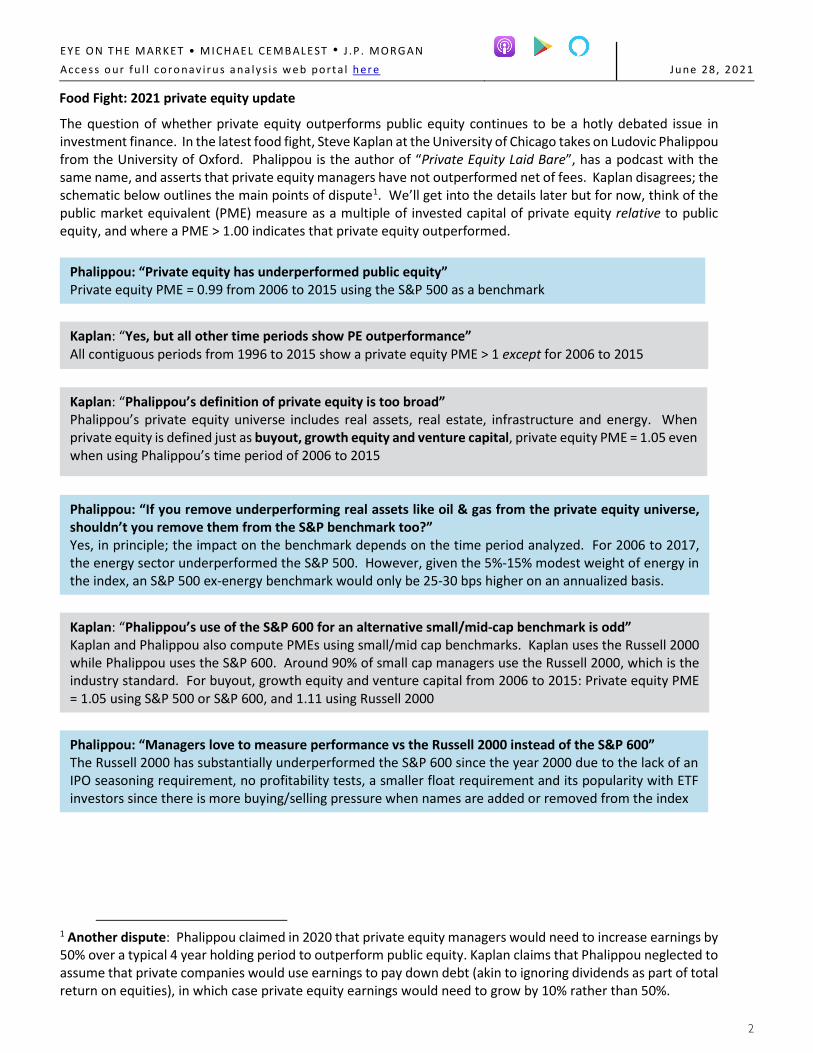
The question of whether private equity outperforms public equity continues to be a hotly debated issue in investment finance. In the latest food fight, Steve Kaplan at the University of Chicago takes on Ludovic Phalippou from the University of Oxford. Phalippou is the author of “Private Equity Laid Bare”, has a podcast with the same name, and asserts that private equity managers have not outperformed net of fees. Kaplan disagrees; the schematic below outlines the main points of dispute1. We’ll get into the details later but for now, think of the public market equivalent (PME) measure as a multiple of invested capital of private equity relative to public equity, and where a PME > 1.00 indicates that private equity outperformed.
Phalippou: “Private equity has underperformed public equity” Private equity PME = 0.99 from 2006 to 2015 using the S&P 500 as a benchmark
Kaplan: “Yes, but all other time periods show PE outperformance” All contiguous periods from 1996 to 2015 show a private equity PME > 1 except for 2006 to 2015
Kaplan: “Phalippou’s definition of private equity is too broad” Phalippou’s private equity universe includes real assets, real estate, infrastructure and energy. When private equity is defined just as buyout, growth equity and venture capital, private equity PME = 1.05 even when using Phalippou’s time period of 2006 to 2015
Phalippou: “If you remove underperforming real assets like oil & gas from the private equity universe, shouldn’t you remove them from the S&P benchmark too?” Yes, in principle; the impact on the benchmark depends on the time period analyzed. For 2006 to 2017, the energy sector underperformed the S&P 500. However, given the 5%-15% modest weight of energy in the index, an S&P 500 ex-energy benchmark would only be 25-30 bps higher on an annualized basis.
Kaplan: “Phalippou’s use of the S&P 600 for an alternative small/mid-cap benchmark is odd” Kaplan and Phalippou also compute PMEs using small/mid cap benchmarks. Kaplan uses the Russell 2000 while Phalippou uses the S&P 600. Around 90% of small cap managers use the Russell 2000, which is the industry standard. For buyout, growth equity and venture capital from 2006 to 2015: Private equity PME = 1.05 using S&P 500 or S&P 600, and 1.11 using Russell 2000
Phalippou: “Managers love to measure performance vs the Russell 2000 instead of the S&P 600” The Russell 2000 has substantially underperformed the S&P 600 since the year 2000 due to the lack of an IPO seasoning requirement, no profitability tests, a smaller float requirement and its popularity with ETF investors since there is more buying/selling pressure when names are added or removed from the index
1 Another dispute: Phalippou claimed in 2020 that private equity managers would need to increase earnings by 50% over a typical 4 year holding period to outperform public equity. Kaplan claims that Phalippou neglected to assume that private companies would use earnings to pay down debt (akin to ignoring dividends as part of total return on equities), in which case private equity earnings would need to grow by 10% rather than 50%.
EYE ON THE M ARKET • M I CHAEL CEMB AL EST • J .P . MORG A N Acce s s o ur fu l l coro nav ir u s a na ly s i s w e b port a l h er e Ju ne 28, 20 21
3
Such differences of opinion have existed for years and date back to debates around which data sources to use for measuring private equity performance in the first place. Most analyses of private equity now use data sourced from limited partners rather than relying on other databases that can have significant problems due to voluntary reporting by managers and stale data (see page 21).
For our biennial private equity reviews, I find Kaplan’s analyses and similar ones from finance professors at Vanderbilt, University of Virginia and Duke to be sensible and devoid of an agenda to either praise or excoriate the private equity industry. Their analyses once again form the basis of this year’s Eye on the Market private equity review, which gets into detail on performance of buyout and venture capital on an industry-wide basis.
A few things to keep in mind. First, the private equity performance measures in this piece cover vintage years through and including 2017. For vintage years since then, not enough time has passed to analyze distributions and valuations relative to invested capital. Second, buyout and venture performance is net of management, incentive and other fees. Third, average industry returns weight each fund by the size of its commitments and distributions (i.e., size-weighted rather than equal-weighted).
Buyout funds: what is the “right” buyout performance benchmark? 6
Buyout manager dispersion 7
Drivers of buyout performance 8
Secondary private equity funds 9
Absolute and relative venture capital performance 10
Venture capital: performance benchmarks and manager dispersion 11
How are gains on venture-backed companies split between VC investors and post-IPO investors? ...................... 12
Buyout vs venture capital 13
What about private equity co-investments? ....................................................................................................... 14
Fundraising and the pace of investment ............................................................................................................. 15
Private equity fundraising vs market capitalization ............................................................................................. 16
On private equity fees .......................................................................................................................................
EYE ON THE M ARKET • M I CHAEL CEMB AL EST • J .P . MORG A N Acce s s o ur fu l l coro nav ir u s a na ly s i s w e b port a l h er e Ju ne 28, 20 21
4
Absolute buyout performance
Let’s start with buyout funds. The charts below show average and median multiples of invested capital (MOIC) and internal rate of return (IRR) since the early 1990’s. MOIC is a simple measure of cash-in vs cash-out, while IRR is a time-weighted measure of return. Note how there’s only a small gap between average and median buyout manager results.
Before 2009, average MOICs and IRRs generally moved in tandem with each other. Since 2009, MOICs have been declining while IRRs have been rising. In theory, this could happen if managers generate smaller gains vs invested capital but deliver distributions to investors more quickly. In reality, the reason for rising IRRs despite falling MOIC is increased use of subscription lines: managers finance investments with bank loans and delay capital calls to LPs until later in the investment period. This practice increases the IRR of a fund at the expense of a small rise in MOIC, since LPs end up paying subscription line interest.
1.0
1.5
2.0
2.5
3.0
1991 1996 2001 2006 2011 2016
Average
Median
US buyout MOICs by vintage year
Source: Steve Kaplan (Chicago Booth) and Burgiss. 2020.
0%
5%
10%
15%
20%
25%
30%
35%
1991 1996 2001 2006 2011 2016
Median
Average
US buyout IRRs by vintage year
Source: Steve Kaplan (Chicago Booth) and Burgiss. 2020.
On subscription lines
• IRR impact. Estimates of the IRR impact of subscription lines vary. Cambridge Associates estimates that subscription lines could boost IRRs by 3% per year, while a Notre Dame study found that such lines would be less likely to materially impact IRR. In terms of actual data, Carnegie Mellon found a 2.6% increase in IRR while the Institutional Limited Partners Association points to a median IRR impact of no more than 0.45%2
• Impact drivers. The IRR impact depends on how long the lines are used for and what percentage of invested capital they are applied to. As an extreme example, assume that a manager used subscription lines for 100% of invested capital and held such lines outstanding until the end of the investment period. In this case, the IRR would rise by 7% from 15% to 22% (see Appendix III Base Case)
• Arms race. 87% of private equity poll respondents indicate that they are using or plan to use subscription lines. According to Mercer, the use of subscription lines of credit (SLCs) has grown 6x since 2010 with more than 90% of funds now using them3
2 “Should you avoid commitment (facilities)?”, Cambridge Associates, June 2018; “Private equity returns, cash flow timing, and investor choices”, Larocque (Notre Dame) et al, August 2019; “Private Equity Fund Debt: Capital Flows, Performance, and Agency Costs”, Albertus and Denes (Carnegie Mellon), May 2020; “Enhancing Transparency Around Subscription Lines of Credit”, Institutional Limited Partners Association, June 2020. 3 “Fund Finance: Utilizing Credit Lines/Subscription Lines of Credit at the Fund Level”, Haynes and Boone LLP, February 2018; “Dry powder meets low interest rates”, Mercer, March 2021.
EYE ON THE M ARKET • M I CHAEL CEMB AL EST • J .P . MORG A N Acce s s o ur fu l l coro nav ir u s a na ly s i s w e b port a l h er e Ju ne 28, 20 21
5
Relative buyout performance
MOIC is not time weighted and neither MOIC nor IRR measures performance vs public equity. Many analysts have converged on two concepts that address these shortfalls: the Public Market Equivalent ratio and Direct Alpha. PME compares private equity commitments and distributions to investments in public equity markets in the exact same time periods. The result is essentially an MOIC ratio of private equity performance vs the public equity benchmark used4. Direct Alpha converts the PME into annualized outperformance in percentage terms. Note how average and median results for buyout are similar, as they were for MOIC and IRR. Since subscription loans impact the timing of upfront cash flows, they can materially boost Direct Alpha as well as IRR.
Why have relative buyout returns declined? After the financial crisis in 2008-2009, the Fed and other central banks adopted “maximum accommodation” policies. These policies led to a sharp rise in public equity valuations. In addition, buyout acquisition multiples have increased as the food fight over private companies continues, propelled further by the SPAC boom (which we wrote about in detail earlier this year). So, higher buyout purchase prices and better-performing public equities have reduced buyout outperformance.
Are the recent annualized 1%-5% excess returns over public equity markets since 2009 enough given the illiquidity of private equity? Rather than apply an abstract derived cost of liquidity, most investors will judge for themselves whether these returns suffice based on their consistency and magnitude.
0.8
0.9
1.0
1.1
1.2
1.3
1.4
1.5
1.6
1991 1996 2001 2006 2011 2016
Average
Median
US buyout PMEs by vintage yearPME ratio vs S&P 500
Source: Steve Kaplan (Chicago Booth) and Burgiss. 2020.
-5%
0%
5%
10%
15%
20%
1991 1996 2001 2006 2011 2016
Median
Average
US buyout direct alpha by vintage year%, annualized vs S&P 500
Source: Steve Kaplan (Chicago Booth) and Burgiss. 2020.
S&P 500 price / earnings ratioPrice / forward 2 year earnings per share
Source: Bloomberg, J.P. Morgan. June 25, 2021.
0x
2x
4x
6x
8x
10x
12x
2003
2004
2005
2006
2007
2008
2009
2010
2011
2012
2013
2014
2015
2016
2017
2018
2019
2020
1Q20
1Q21
Other
Equity/EBITDA
Subordinateddebt/EBITDASeniorDebt/EBITDA
Source: S&P Global. 2021.
Buyout purchase price multiples Average EBITDA purchase price multiple for US LBO transactions
4 See “Private Equity Performance: Returns, Persistence and Capital Flows”, Kaplan and Schoar, University of Chicago, 2005 and “Benchmarking Private Equity: The Direct Alpha Method”, Gredil (UNC) et al, 2014.
EYE ON THE M ARKET • M I CHAEL CEMB AL EST • J .P . MORG A N Acce s s o ur fu l l coro nav ir u s a na ly s i s w e b port a l h er e Ju ne 28, 20 21
6
Buyout funds: what is the “right” buyout performance benchmark?
Some analysts are reluctant to use the S&P 500 as a benchmark for buyout managers that invest in smaller companies. While US buyout deal sizes have been rising (first chart), the average buyout is still much smaller than a typical large cap company. The median S&P 500 market cap is $21 billion, the average US buyout is $2.5 billion and the median Russell 2000 market cap is $1.1 billion. In any case, the second chart shows PMEs using the Russell 2000 instead. The results reflect the relative performance of the S&P 500 vs the Russell 2000 over time. The third chart shows rolling performance of the Russell 2000 vs the S&P 600.
EYE ON THE M ARKET • M I CHAEL CEMB AL EST • J .P . MORG A N Acce s s o ur fu l l coro nav ir u s a na ly s i s w e b port a l h er e Ju ne 28, 20 21
7
Buyout manager dispersion
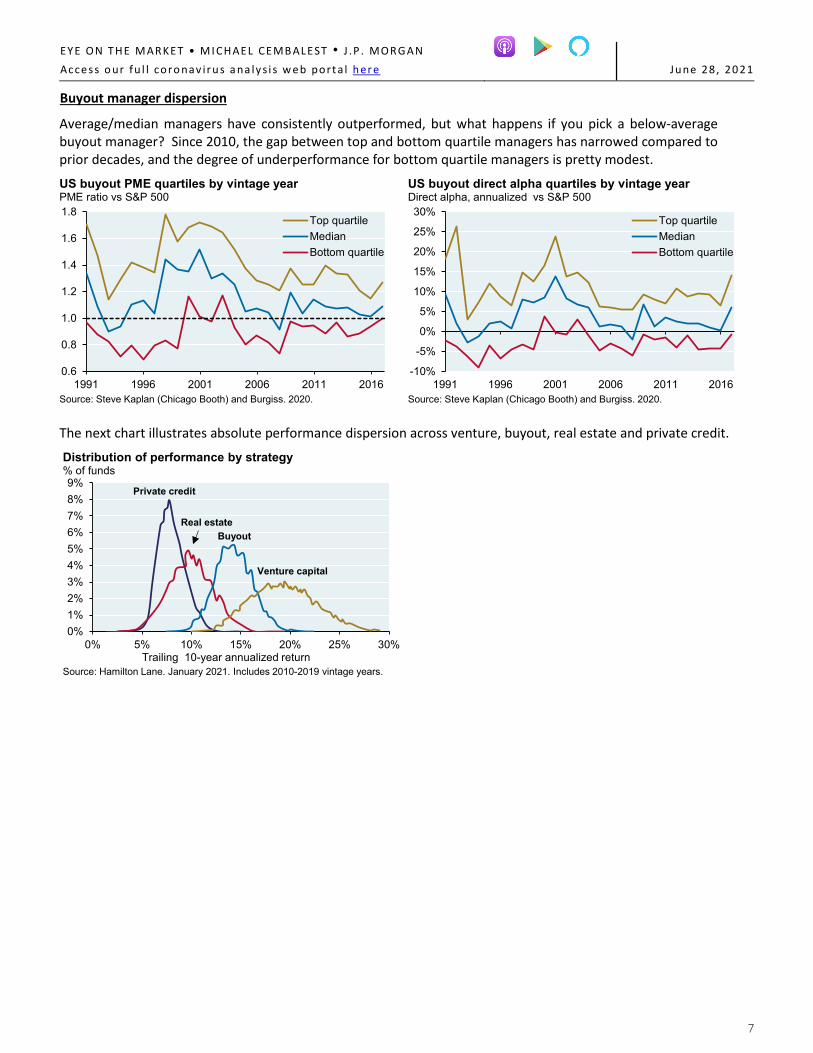
Average/median managers have consistently outperformed, but what happens if you pick a below-average buyout manager? Since 2010, the gap between top and bottom quartile managers has narrowed compared to prior decades, and the degree of underperformance for bottom quartile managers is pretty modest.
0.6
0.8
1.0
1.2
1.4
1.6
1.8
1991 1996 2001 2006 2011 2016
Top quartileMedianBottom quartile
US buyout PME quartiles by vintage yearPME ratio vs S&P 500
Source: Steve Kaplan (Chicago Booth) and Burgiss. 2020.
-10%
-5%
0%
5%
10%
15%
20%
25%
30%
1991 1996 2001 2006 2011 2016
Top quartileMedianBottom quartile
US buyout direct alpha quartiles by vintage yearDirect alpha, annualized vs S&P 500
Source: Steve Kaplan (Chicago Booth) and Burgiss. 2020.
The next chart illustrates absolute performance dispersion across venture, buyout, real estate and private credit.
0%1%2%3%4%5%6%7%8%9%
0% 5% 10% 15% 20% 25% 30%
Distribution of performance by strategy% of funds
Source: Hamilton Lane. January 2021. Includes 2010-2019 vintage years.Trailing 10-year annualized return
EYE ON THE M ARKET • M I CHAEL CEMB AL EST • J .P . MORG A N Acce s s o ur fu l l coro nav ir u s a na ly s i s w e b port a l h er e Ju ne 28, 20 21
8
Drivers of buyout performance
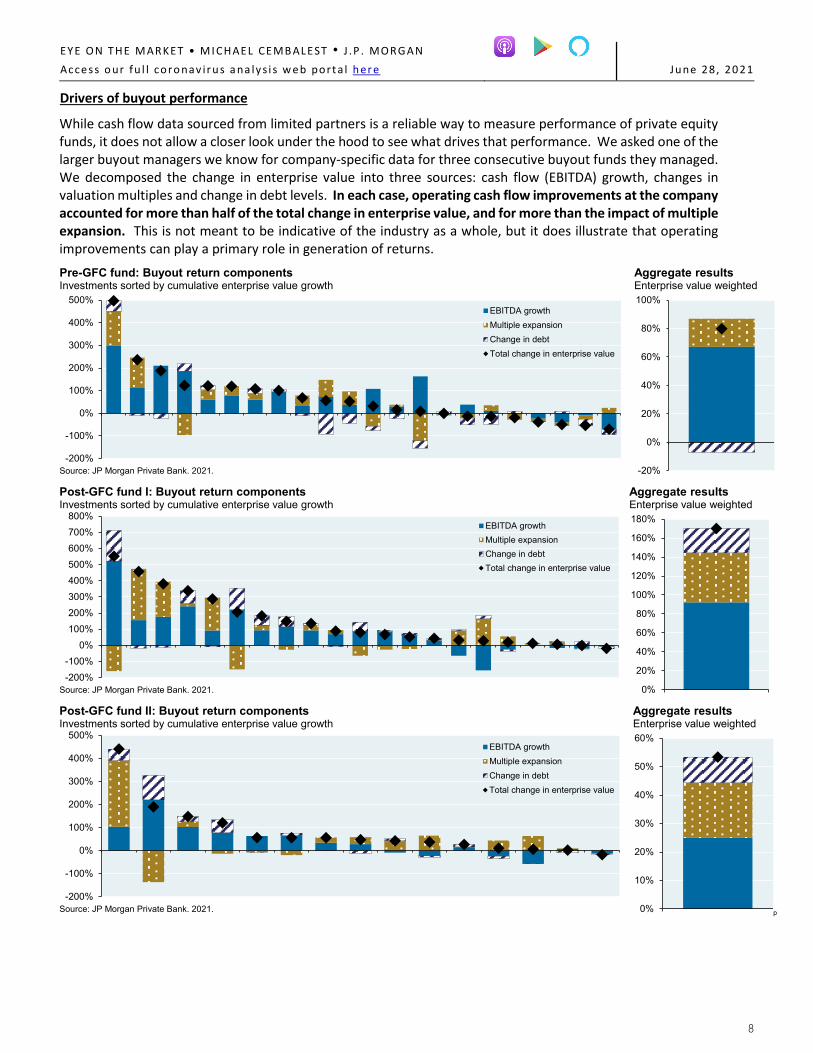
While cash flow data sourced from limited partners is a reliable way to measure performance of private equity funds, it does not allow a closer look under the hood to see what drives that performance. We asked one of the larger buyout managers we know for company-specific data for three consecutive buyout funds they managed. We decomposed the change in enterprise value into three sources: cash flow (EBITDA) growth, changes in valuation multiples and change in debt levels. In each case, operating cash flow improvements at the company accounted for more than half of the total change in enterprise value, and for more than the impact of multiple expansion. This is not meant to be indicative of the industry as a whole, but it does illustrate that operating improvements can play a primary role in generation of returns.
-200%
-100%
0%
100%
200%
300%
400%
500%EBITDA growthMultiple expansionChange in debtTotal change in enterprise value
Source: JP Morgan Private Bank. 2021.
Pre-GFC fund: Buyout return components Investments sorted by cumulative enterprise value growth
-20%
0%
20%
40%
60%
80%
100%
Aggregate resultsEnterprise value weighted
-200%-100%
0%100%200%300%400%500%600%700%800%
EBITDA growthMultiple expansionChange in debtTotal change in enterprise value
Source: JP Morgan Private Bank. 2021.
Post-GFC fund I: Buyout return components Investments sorted by cumulative enterprise value growth
0%
20%
40%
60%
80%
100%
120%
140%
160%
180%
Aggregate resultsEnterprise value weighted
-200%
-100%
0%
100%
200%
300%
400%
500%EBITDA growthMultiple expansionChange in debtTotal change in enterprise value
Source: JP Morgan Private Bank. 2021.
Post-GFC fund II: Buyout return components Investments sorted by cumulative enterprise value growth
EYE ON THE M ARKET • M I CHAEL CEMB ALEST • J .P . MORG AN
Acce s s o ur fu l l coro nav ir u s a na ly s i s w e b port a l h er e Ju ne 28 , 20 21
9
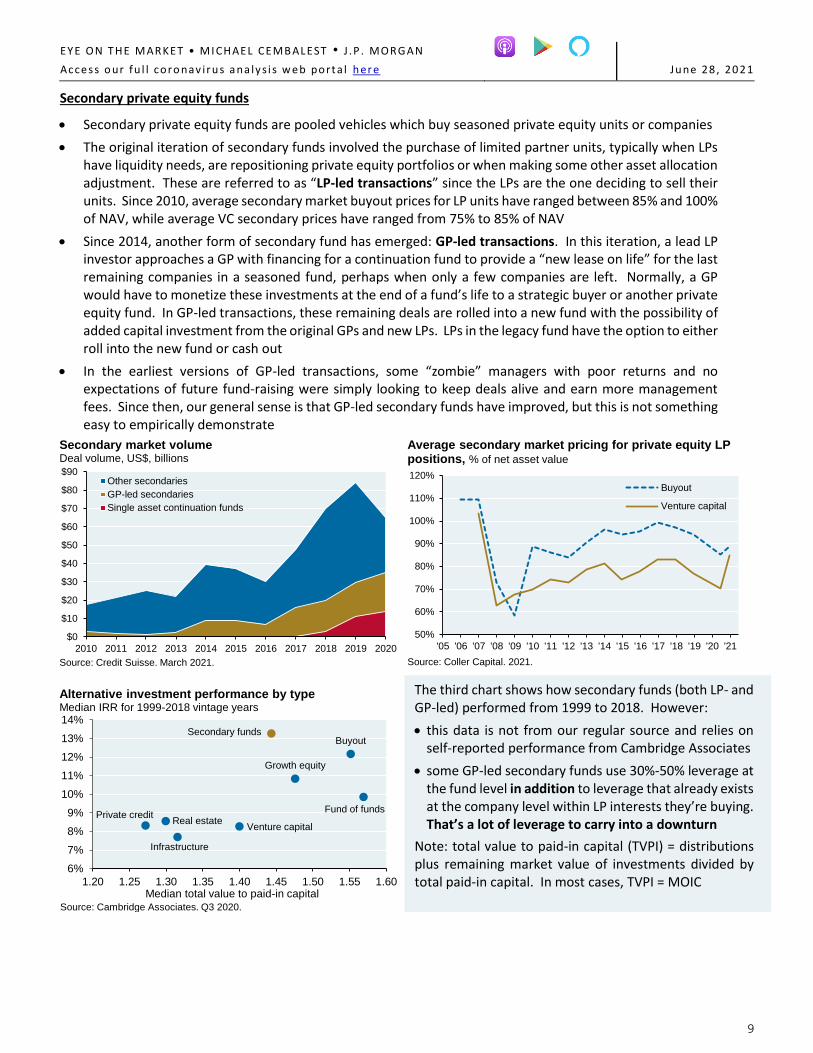
Secondary private equity funds
Secondary private equity funds are pooled vehicles which buy seasoned private equity units or companies
The original iteration of secondary funds involved the purchase of limited partner units, typically when LPs have liquidity needs, are repositioning private equity portfolios or when making some other asset allocation adjustment. These are referred to as “LP-led transactions” since the LPs are the one deciding to sell their units. Since 2010, average secondary market buyout prices for LP units have ranged between 85% and 100% of NAV, while average VC secondary prices have ranged from 75% to 85% of NAV
Since 2014, another form of secondary fund has emerged: GP-led transactions. In this iteration, a lead LP investor approaches a GP with financing for a continuation fund to provide a “new lease on life” for the last remaining companies in a seasoned fund, perhaps when only a few companies are left. Normally, a GP would have to monetize these investments at the end of a fund’s life to a strategic buyer or another private equity fund. In GP-led transactions, these remaining deals are rolled into a new fund with the possibility of added capital investment from the original GPs and new LPs. LPs in the legacy fund have the option to either roll into the new fund or cash out
In the earliest versions of GP-led transactions, some “zombie” managers with poor returns and no expectations of future fund-raising were simply looking to keep deals alive and earn more management fees. Since then, our general sense is that GP-led secondary funds have improved, but this is not something easy to empirically demonstrate
Average secondary market pricing for private equity LP positions, % of net asset value
Buyout
Private creditFund of funds
Growth equity
Infrastructure
Real estateVenture capital
Secondary funds
6%
7%
8%
9%
10%
11%
12%
13%
14%
1.20 1.25 1.30 1.35 1.40 1.45 1.50 1.55 1.60
Alternative investment performance by typeMedian IRR for 1999-2018 vintage years
Median total value to paid-in capital
Source: Cambridge Associates. Q3 2020.
The third chart shows how secondary funds (both LP- and GP-led) performed from 1999 to 2018. However:
this data is not from our regular source and relies on self-reported performance from Cambridge Associates
some GP-led secondary funds use 30%-50% leverage at the fund level in addition to leverage that already exists at the company level within LP interests they’re buying. That’s a lot of leverage to carry into a downturn
Note: total value to paid-in capital (TVPI) = distributions plus remaining market value of investments divided by total paid-in capital. In most cases, TVPI = MOIC
EYE ON THE M ARKET • M I CHAEL CEMB AL EST • J .P . MORG A N Acce s s o ur fu l l coro nav ir u s a na ly s i s w e b port a l h er e Ju ne 28, 20 21
10
Absolute and relative venture capital performance
We have performance data for venture capital starting in the mid-1990s, but the period is so distorted by the late 1990’s boom and bust that we start our VC performance discussion in 20045. In my view, the massive gains earned by VC managers in the mid-1990s are not relevant to a discussion of VC investing today.
As with buyout managers, VC manager MOIC and IRR also tracked each other until 2012 after which a combination of subscription lines and faster distributions led to rising IRRs despite falling MOICs. There’s a larger gap between average and median manager results than in buyout, indicating that there are a few VC managers with much higher returns and/or larger funds that pull up the average relative to the median.
1.0
1.5
2.0
2.5
3.0
3.5
4.0
2004 2006 2008 2010 2012 2014 2016
Average
Median
US venture capital MOICs by vintage year
Source: Steve Kaplan (Chicago Booth) and Burgiss. 2020.
0%
5%
10%
15%
20%
25%
30%
35%
40%
2004 2006 2008 2010 2012 2014 2016
AverageMedian
US venture capital IRRs by vintage year
Source: Steve Kaplan (Chicago Booth) and Burgiss. 2020.
VC managers have consistently outperformed public equity markets when looking at the “average” manager. But to reiterate, the gap between average and median results are substantial and indicate outsized returns posted by a small number of VC managers. For vintage years 2004 to 2008, the median VC manager actually underperformed the S&P 500 pretty substantially.
0.4
0.6
0.8
1.0
1.2
1.4
1.6
1.8
2.0
2004 2006 2008 2010 2012 2014 2016
Average
Median
US venture capital PMEs by vintage yearPME ratio vs S&P 500
Source: Steve Kaplan (Chicago Booth) and Burgiss. 2020.
-10%
-5%
0%
5%
10%
15%
20%
2004 2006 2008 2010 2012 2014 2016
Average
Median
US venture capital direct alphas by vintage year%, annualized vs S&P 500
Source: Steve Kaplan (Chicago Booth) and Burgiss. 2020.
5 The year of peak VC performance was the 1996 vintage whose MOIC was 7x and whose IRR reached 120%. The subsequent bust took a toll on returns: the 1999 vintage ended up with MOIC of 1x and an IRR of -1%.
EYE ON THE M ARKET • M I CHAEL CEMB AL EST • J .P . MORG A N Acce s s o ur fu l l coro nav ir u s a na ly s i s w e b port a l h er e Ju ne 28, 20 21
11
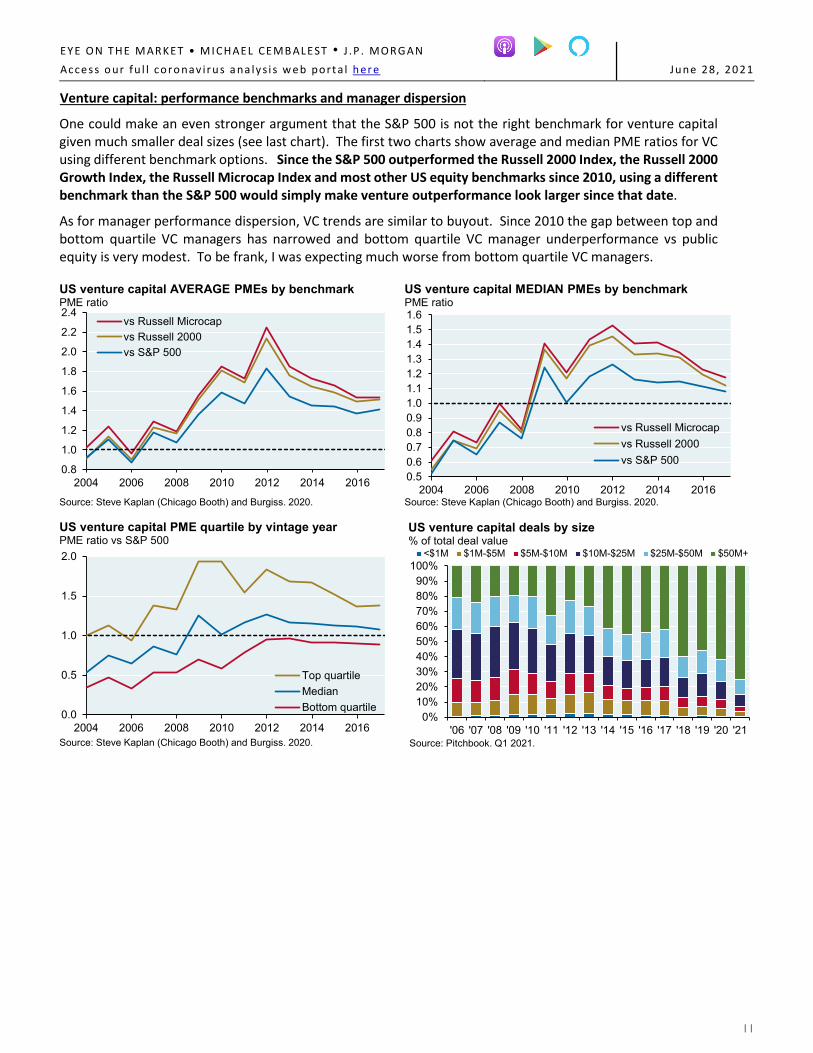
Venture capital: performance benchmarks and manager dispersion
One could make an even stronger argument that the S&P 500 is not the right benchmark for venture capital given much smaller deal sizes (see last chart). The first two charts show average and median PME ratios for VC using different benchmark options. Since the S&P 500 outperformed the Russell 2000 Index, the Russell 2000 Growth Index, the Russell Microcap Index and most other US equity benchmarks since 2010, using a different benchmark than the S&P 500 would simply make venture outperformance look larger since that date.
As for manager performance dispersion, VC trends are similar to buyout. Since 2010 the gap between top and bottom quartile VC managers has narrowed and bottom quartile VC manager underperformance vs public equity is very modest. To be frank, I was expecting much worse from bottom quartile VC managers.
0.8
1.0
1.2
1.4
1.6
1.8
2.0
2.2
2.4
2004 2006 2008 2010 2012 2014 2016
vs Russell Microcapvs Russell 2000vs S&P 500
US venture capital AVERAGE PMEs by benchmarkPME ratio
Source: Steve Kaplan (Chicago Booth) and Burgiss. 2020.
0.50.60.70.80.91.01.11.21.31.41.51.6
2004 2006 2008 2010 2012 2014 2016
vs Russell Microcapvs Russell 2000vs S&P 500
US venture capital MEDIAN PMEs by benchmarkPME ratio
Source: Steve Kaplan (Chicago Booth) and Burgiss. 2020.
0.0
0.5
1.0
1.5
2.0
2004 2006 2008 2010 2012 2014 2016
Top quartileMedianBottom quartile
US venture capital PME quartile by vintage yearPME ratio vs S&P 500
Source: Steve Kaplan (Chicago Booth) and Burgiss. 2020.
EYE ON THE M ARKET • M I CHAEL CEMB AL EST • J .P . MORG A N Acce s s o ur fu l l coro nav ir u s a na ly s i s w e b port a l h er e Ju ne 28, 20 21
12
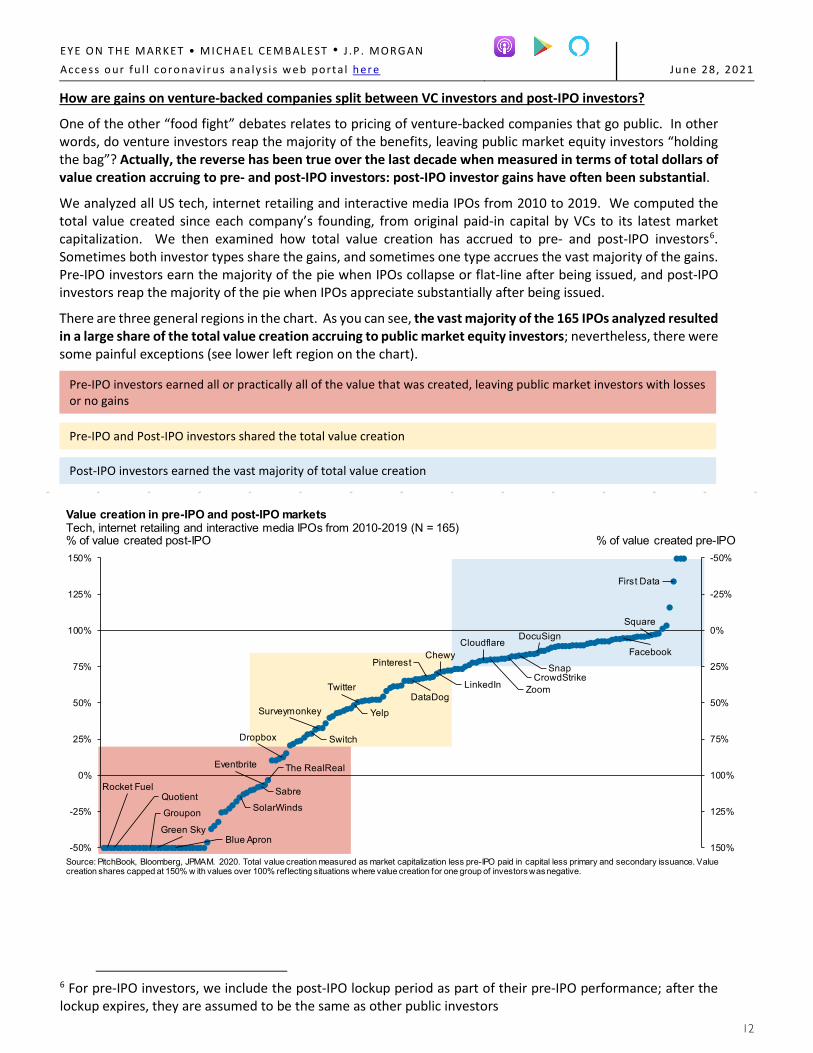
How are gains on venture-backed companies split between VC investors and post-IPO investors?
One of the other “food fight” debates relates to pricing of venture-backed companies that go public. In other words, do venture investors reap the majority of the benefits, leaving public market equity investors “holding the bag”? Actually, the reverse has been true over the last decade when measured in terms of total dollars of value creation accruing to pre- and post-IPO investors: post-IPO investor gains have often been substantial.
We analyzed all US tech, internet retailing and interactive media IPOs from 2010 to 2019. We computed the total value created since each company’s founding, from original paid-in capital by VCs to its latest market capitalization. We then examined how total value creation has accrued to pre- and post-IPO investors6. Sometimes both investor types share the gains, and sometimes one type accrues the vast majority of the gains. Pre-IPO investors earn the majority of the pie when IPOs collapse or flat-line after being issued, and post-IPO investors reap the majority of the pie when IPOs appreciate substantially after being issued.
There are three general regions in the chart. As you can see, the vast majority of the 165 IPOs analyzed resulted in a large share of the total value creation accruing to public market equity investors; nevertheless, there were some painful exceptions (see lower left region on the chart).
Pre-IPO investors earned all or practically all of the value that was created, leaving public market investors with losses or no gains
Pre-IPO and Post-IPO investors shared the total value creation
Post-IPO investors earned the vast majority of total value creation
Rocket FuelQuotient
Groupon
Green SkyBlue Apron
SolarWinds
Sabre
Eventbrite The RealReal
Dropbox Switch
Surveymonkey Yelp
TwitterDataDog
Pinterest
LinkedIn
ChewyCloudflare
ZoomCrowdStrike
Snap
DocuSign
Facebook
Square
First Data
-50%
-25%
0%
25%
50%
75%
100%
125%
150%-50%
-25%
0%
25%
50%
75%
100%
125%
150%
Value creation in pre-IPO and post-IPO marketsTech, internet retailing and interactive media IPOs from 2010-2019 (N = 165)% of value created post-IPO % of value created pre-IPO
Source: PitchBook, Bloomberg, JPMAM. 2020. Total value creation measured as market capitalization less pre-IPO paid in capital less primary and secondary issuance. Value creation shares capped at 150% w ith values over 100% reflecting situations where value creation for one group of investors was negative.
6 For pre-IPO investors, we include the post-IPO lockup period as part of their pre-IPO performance; after the lockup expires, they are assumed to be the same as other public investors
EYE ON THE M ARKET • M I CHAEL CEMB AL EST • J .P . MORG A N Acce s s o ur fu l l coro nav ir u s a na ly s i s w e b port a l h er e Ju ne 28, 20 21
13
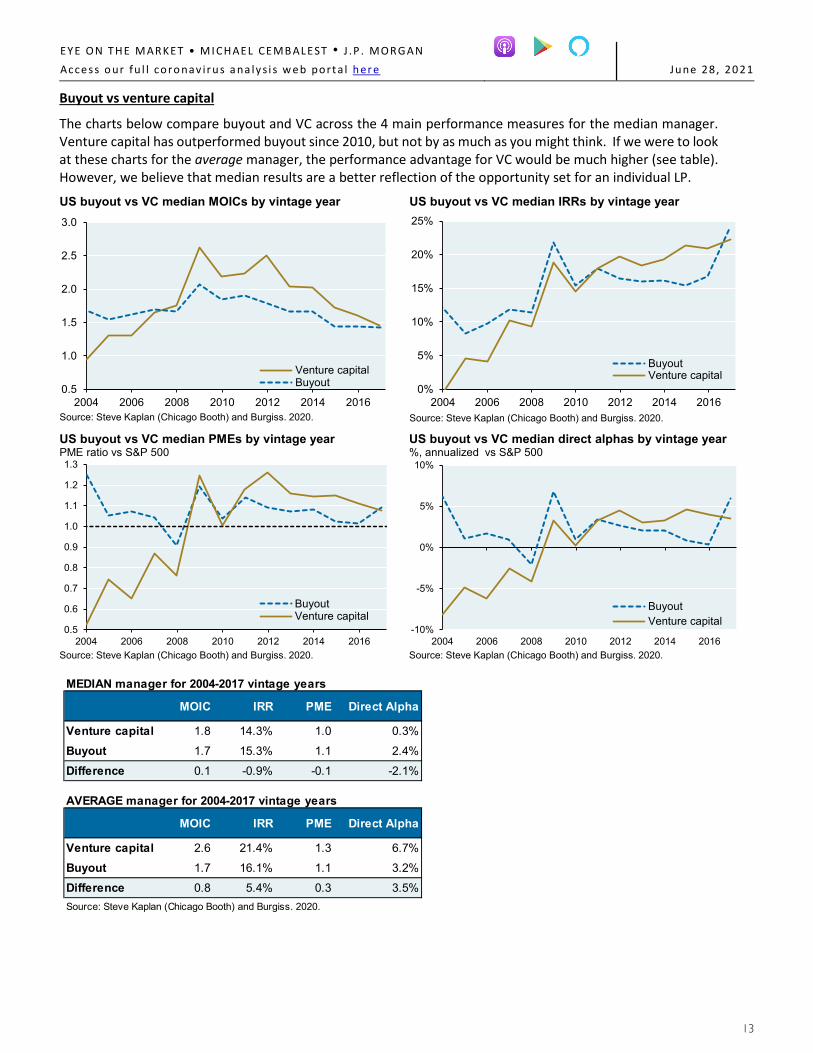
Buyout vs venture capital
The charts below compare buyout and VC across the 4 main performance measures for the median manager. Venture capital has outperformed buyout since 2010, but not by as much as you might think. If we were to look at these charts for the average manager, the performance advantage for VC would be much higher (see table). However, we believe that median results are a better reflection of the opportunity set for an individual LP.
0.5
1.0
1.5
2.0
2.5
3.0
2004 2006 2008 2010 2012 2014 2016
Venture capitalBuyout
US buyout vs VC median MOICs by vintage year
Source: Steve Kaplan (Chicago Booth) and Burgiss. 2020.
0%
5%
10%
15%
20%
25%
2004 2006 2008 2010 2012 2014 2016
BuyoutVenture capital
US buyout vs VC median IRRs by vintage year
Source: Steve Kaplan (Chicago Booth) and Burgiss. 2020.
0.5
0.6
0.7
0.8
0.9
1.0
1.1
1.2
1.3
2004 2006 2008 2010 2012 2014 2016
BuyoutVenture capital
US buyout vs VC median PMEs by vintage yearPME ratio vs S&P 500
Source: Steve Kaplan (Chicago Booth) and Burgiss. 2020.
-10%
-5%
0%
5%
10%
2004 2006 2008 2010 2012 2014 2016
BuyoutVenture capital
US buyout vs VC median direct alphas by vintage year%, annualized vs S&P 500
Source: Steve Kaplan (Chicago Booth) and Burgiss. 2020.
MEDIAN manager for 2004-2017 vintage years
MOIC IRR PME Direct Alpha
Venture capital 1.8 14.3% 1.0 0.3%
Buyout 1.7 15.3% 1.1 2.4%
Difference 0.1 -0.9% -0.1 -2.1%
AVERAGE manager for 2004-2017 vintage years
MOIC IRR PME Direct Alpha
Venture capital 2.6 21.4% 1.3 6.7%
Buyout 1.7 16.1% 1.1 3.2%
Difference 0.8 5.4% 0.3 3.5%Source: Steve Kaplan (Chicago Booth) and Burgiss. 2020.
EYE ON THE M ARKET • M I CHAEL CEMB AL EST • J .P . MORG A N Acce s s o ur fu l l coro nav ir u s a na ly s i s w e b port a l h er e Ju ne 28, 20 21
14
What about private equity co-investments?
• Co-investment opportunities typically arise when a target acquisition requires more capital than a sponsor wants to provide from their fund alone; as a result, co-investors join the sponsor to make up the shortfall
• The premise behind co-investment is that lower fees increase LP returns, and that security selection will be at least as good as in overall diversified private equity funds
• Our private equity performance universe excludes co-investments that LPs make into individual deals and only includes co-investment funds that invest in transactions led by multiple private equity managers. As a result, if co-investment returns exceed those on underlying funds, average and median returns we cited earlier would understate actual returns for LPs participating in individual deal co-investments
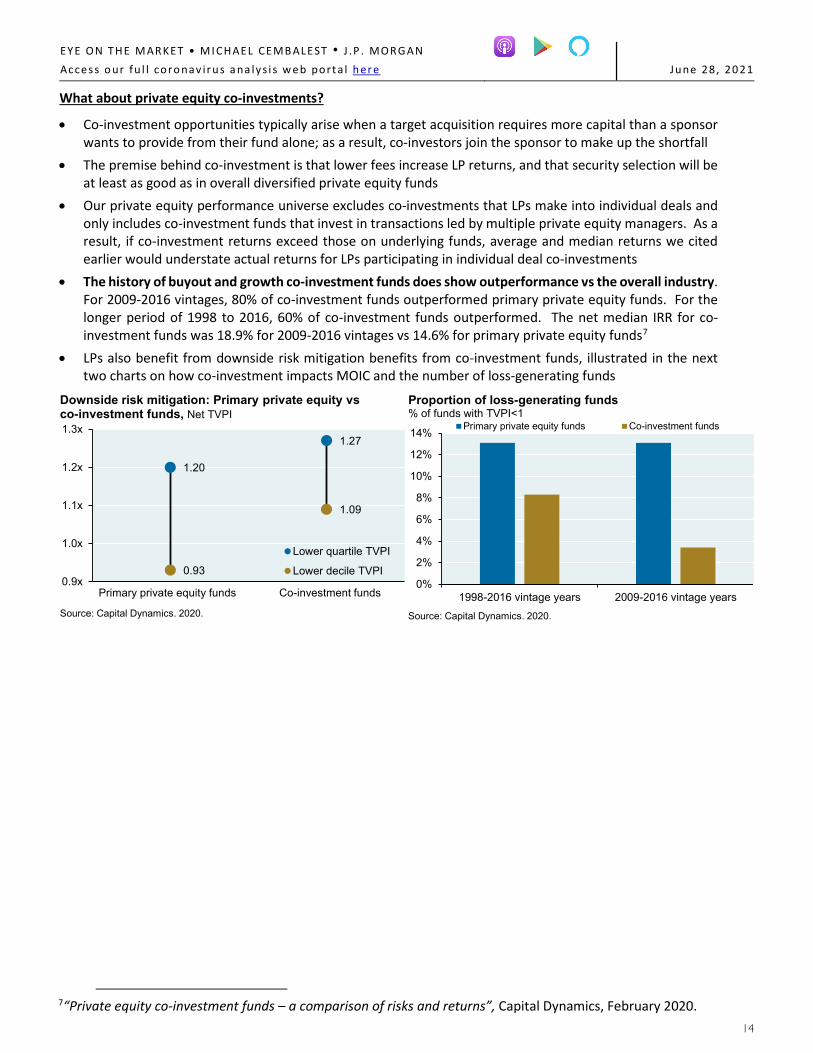
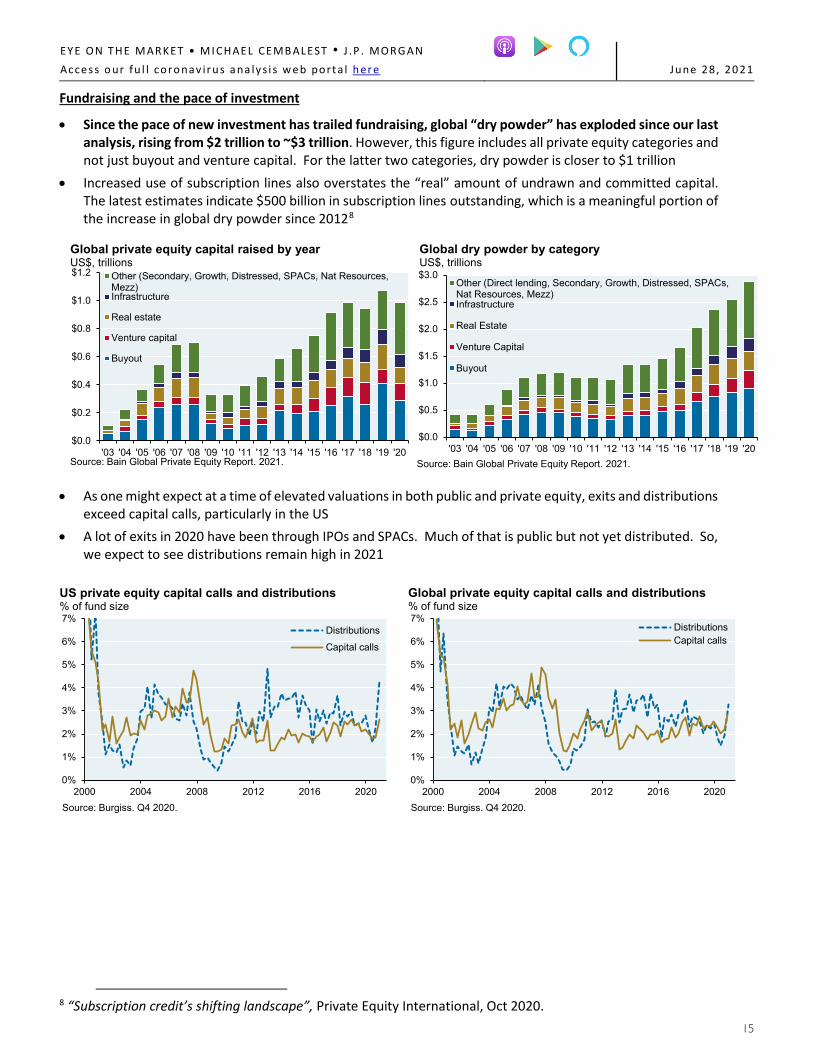
• The history of buyout and growth co-investment funds does show outperformance vs the overall industry. For 2009-2016 vintages, 80% of co-investment funds outperformed primary private equity funds. For the longer period of 1998 to 2016, 60% of co-investment funds outperformed. The net median IRR for co-investment funds was 18.9% for 2009-2016 vintages vs 14.6% for primary private equity funds7
• LPs also benefit from downside risk mitigation benefits from co-investment funds, illustrated in the next two charts on how co-investment impacts MOIC and the number of loss-generating funds
1.20
0.93
1.27
1.09
0.9x
1.0x
1.1x
1.2x
1.3x
Lower quartile TVPI
Lower decile TVPI
Downside risk mitigation: Primary private equity vs co-investment funds, Net TVPI
EYE ON THE M ARKET • M I CHAEL CEMB AL EST • J .P . MORG A N Acce s s o ur fu l l coro nav ir u s a na ly s i s w e b port a l h er e Ju ne 28, 20 21
15
Fundraising and the pace of investment
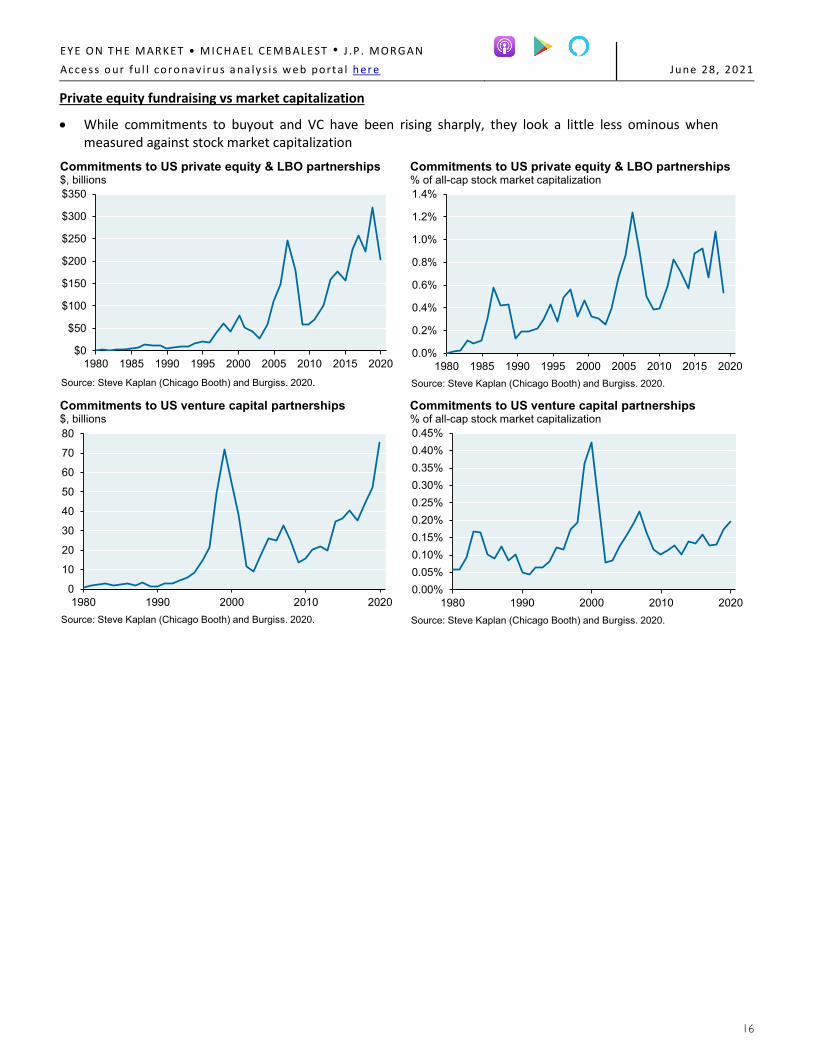
• Since the pace of new investment has trailed fundraising, global “dry powder” has exploded since our last analysis, rising from $2 trillion to ~$3 trillion. However, this figure includes all private equity categories and not just buyout and venture capital. For the latter two categories, dry powder is closer to $1 trillion
• Increased use of subscription lines also overstates the “real” amount of undrawn and committed capital. The latest estimates indicate $500 billion in subscription lines outstanding, which is a meaningful portion of the increase in global dry powder since 20128
Other (Direct lending, Secondary, Growth, Distressed, SPACs,Nat Resources, Mezz)Infrastructure
Real Estate
Venture Capital
Buyout
Source: Bain Global Private Equity Report. 2021.
Global dry powder by categoryUS$, trillions
• As one might expect at a time of elevated valuations in both public and private equity, exits and distributions exceed capital calls, particularly in the US
• A lot of exits in 2020 have been through IPOs and SPACs. Much of that is public but not yet distributed. So, we expect to see distributions remain high in 2021
0%
1%
2%
3%
4%
5%
6%
7%
2000 2004 2008 2012 2016 2020
Distributions
Capital calls
Source: Burgiss. Q4 2020.
US private equity capital calls and distributions % of fund size
0%
1%
2%
3%
4%
5%
6%
7%
2000 2004 2008 2012 2016 2020
DistributionsCapital calls
Source: Burgiss. Q4 2020.
Global private equity capital calls and distributions % of fund size
8 “Subscription credit’s shifting landscape”, Private Equity International, Oct 2020.
EYE ON THE M ARKET • M I CHAEL CEMB AL EST • J .P . MORG A N Acce s s o ur fu l l coro nav ir u s a na ly s i s w e b port a l h er e Ju ne 28, 20 21
17
On private equity fees
Private equity fees fall into three categories. They are described below, with estimates of fees earned from 2008 to 2020 by private equity companies with public filings (Carlyle, KKR, Blackstone, Apollo)9:
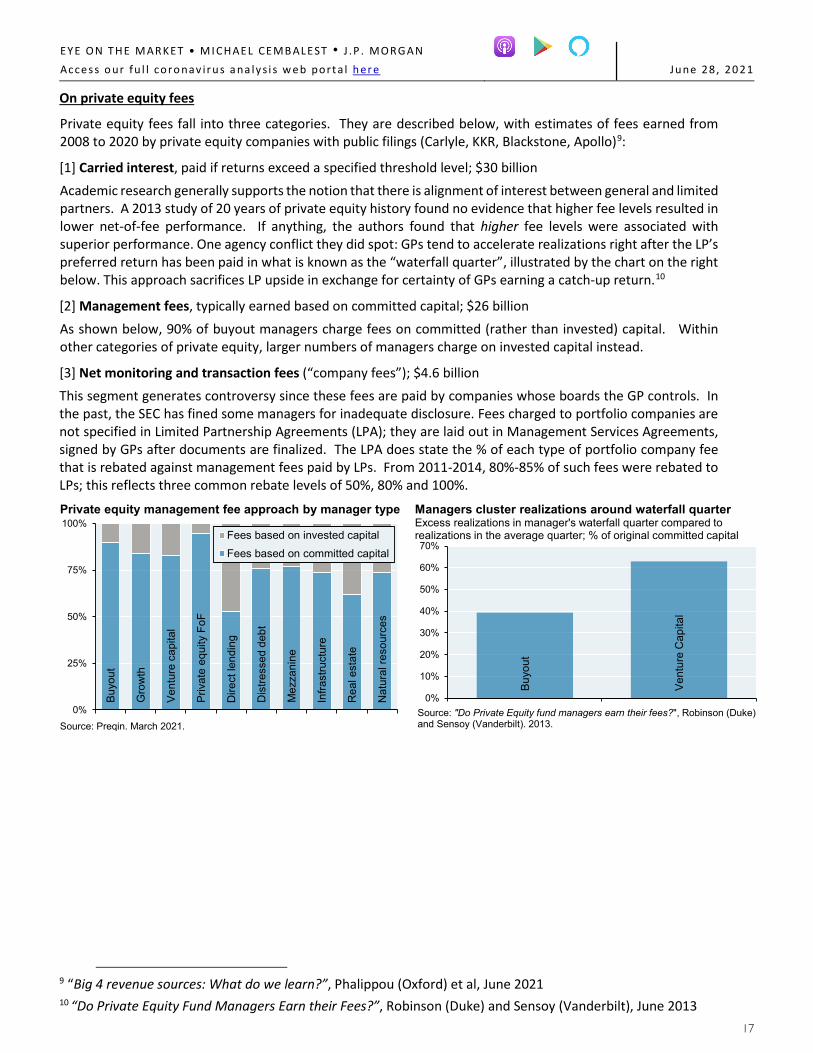
[1] Carried interest, paid if returns exceed a specified threshold level; $30 billion Academic research generally supports the notion that there is alignment of interest between general and limited partners. A 2013 study of 20 years of private equity history found no evidence that higher fee levels resulted in lower net-of-fee performance. If anything, the authors found that higher fee levels were associated with superior performance. One agency conflict they did spot: GPs tend to accelerate realizations right after the LP’s preferred return has been paid in what is known as the “waterfall quarter”, illustrated by the chart on the right below. This approach sacrifices LP upside in exchange for certainty of GPs earning a catch-up return.10
[2] Management fees, typically earned based on committed capital; $26 billion As shown below, 90% of buyout managers charge fees on committed (rather than invested) capital. Within other categories of private equity, larger numbers of managers charge on invested capital instead.
[3] Net monitoring and transaction fees (“company fees”); $4.6 billion This segment generates controversy since these fees are paid by companies whose boards the GP controls. In the past, the SEC has fined some managers for inadequate disclosure. Fees charged to portfolio companies are not specified in Limited Partnership Agreements (LPA); they are laid out in Management Services Agreements, signed by GPs after documents are finalized. The LPA does state the % of each type of portfolio company fee that is rebated against management fees paid by LPs. From 2011-2014, 80%-85% of such fees were rebated to LPs; this reflects three common rebate levels of 50%, 80% and 100%.
Buy
out
Gro
wth
Ven
ture
cap
ital
Priv
ate
equi
ty F
oF
Dire
ct le
ndin
g
Dis
tress
ed d
ebt
Mez
zani
ne
Infra
stru
ctur
e
Rea
l est
ate
Nat
ural
reso
urce
s
0%
25%
50%
75%
100%Fees based on invested capitalFees based on committed capital
Source: Preqin. March 2021.
Private equity management fee approach by manager typeBu
yout
Vent
ure
Cap
ital
0%
10%
20%
30%
40%
50%
60%
70%
Source: "Do Private Equity fund managers earn their fees?", Robinson (Duke) and Sensoy (Vanderbilt). 2013.
Managers cluster realizations around waterfall quarterExcess realizations in manager's waterfall quarter compared to realizations in the average quarter; % of original committed capital
9 “Big 4 revenue sources: What do we learn?”, Phalippou (Oxford) et al, June 2021 10 “Do Private Equity Fund Managers Earn their Fees?”, Robinson (Duke) and Sensoy (Vanderbilt), June 2013
EYE ON THE M ARKET • M I CHAEL CEMB ALEST • J .P . MORG AN
Acce s s o ur fu l l coro nav ir u s a na ly s i s w e b port a l h er e Ju ne 28 , 20 21
18
Recent academic papers on private equity
• Top performer persistence11. The performance of top quartile VC and buyout funds is likely to persist in subsequent funds. However, final performance is typically unavailable to LPs at the time of fundraising. For buyout, interim performance of prior funds is not an accurate indicator of future fund performance. In contrast, the average PME for VC funds with top quartile interim performance was 0.8x higher than those with bottom quartile performance. In other words, partial performance information could be useful to VC LPs at the time of fundraise, but less useful to buyout investors
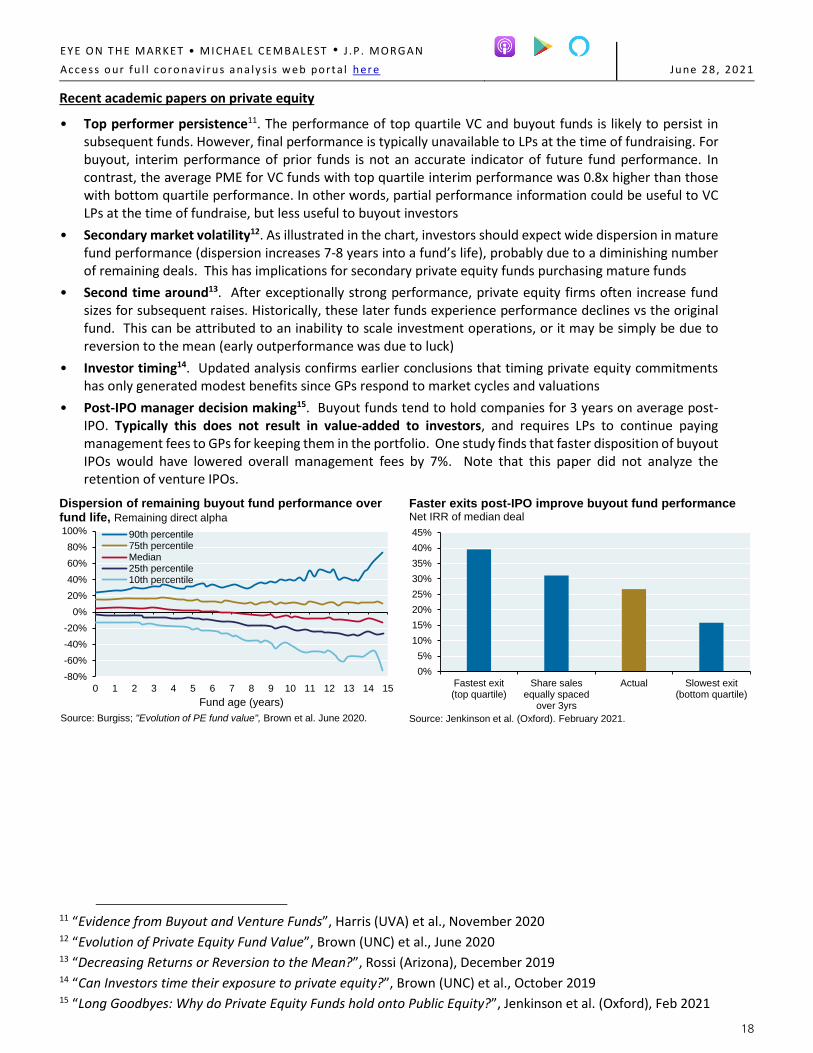
• Secondary market volatility12. As illustrated in the chart, investors should expect wide dispersion in mature fund performance (dispersion increases 7-8 years into a fund’s life), probably due to a diminishing number of remaining deals. This has implications for secondary private equity funds purchasing mature funds
• Second time around13. After exceptionally strong performance, private equity firms often increase fund sizes for subsequent raises. Historically, these later funds experience performance declines vs the original fund. This can be attributed to an inability to scale investment operations, or it may be simply be due to reversion to the mean (early outperformance was due to luck)
• Investor timing14. Updated analysis confirms earlier conclusions that timing private equity commitments has only generated modest benefits since GPs respond to market cycles and valuations
• Post-IPO manager decision making15. Buyout funds tend to hold companies for 3 years on average post-IPO. Typically this does not result in value-added to investors, and requires LPs to continue paying management fees to GPs for keeping them in the portfolio. One study finds that faster disposition of buyout IPOs would have lowered overall management fees by 7%. Note that this paper did not analyze the retention of venture IPOs.
11 “Evidence from Buyout and Venture Funds”, Harris (UVA) et al., November 2020 12 “Evolution of Private Equity Fund Value”, Brown (UNC) et al., June 2020 13 “Decreasing Returns or Reversion to the Mean?”, Rossi (Arizona), December 2019 14 “Can Investors time their exposure to private equity?”, Brown (UNC) et al., October 2019 15 “Long Goodbyes: Why do Private Equity Funds hold onto Public Equity?”, Jenkinson et al. (Oxford), Feb 2021
EYE ON THE M ARKET • M I CHAEL CEMB AL EST • J .P . MORG A N Acce s s o ur fu l l coro nav ir u s a na ly s i s w e b port a l h er e Ju ne 28, 20 21
19
Appendix I: Other industry data
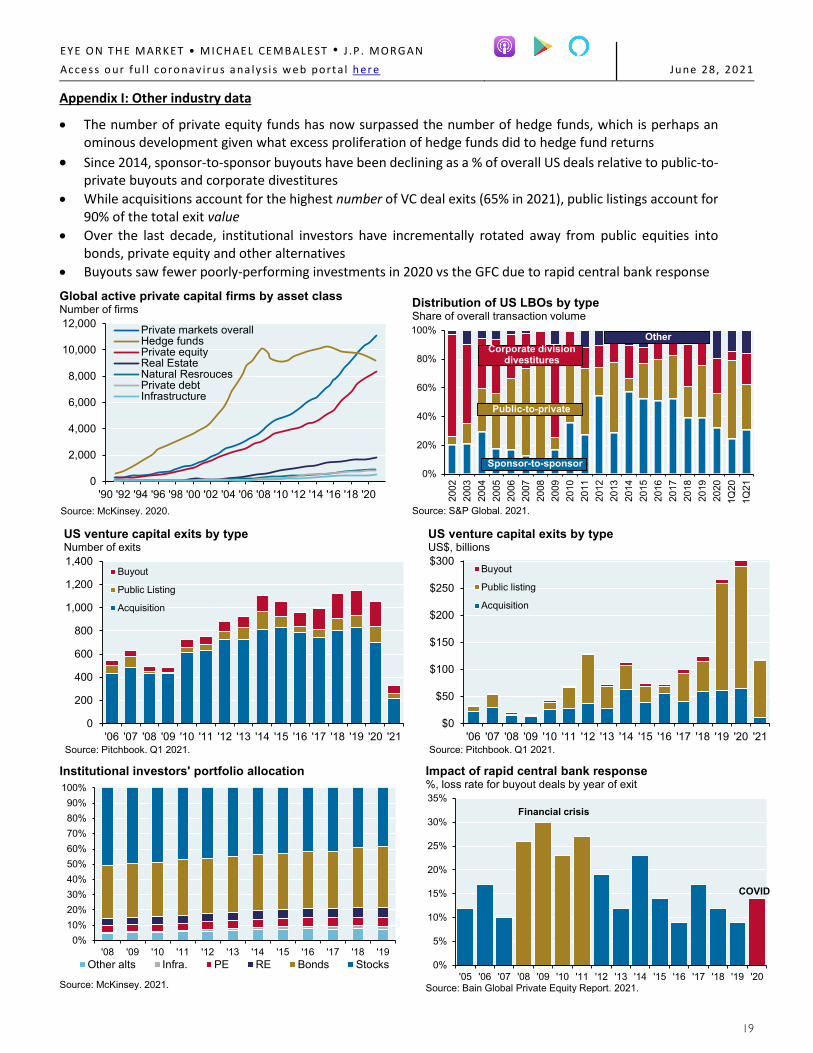
• The number of private equity funds has now surpassed the number of hedge funds, which is perhaps an ominous development given what excess proliferation of hedge funds did to hedge fund returns
• Since 2014, sponsor-to-sponsor buyouts have been declining as a % of overall US deals relative to public-to-private buyouts and corporate divestitures
• While acquisitions account for the highest number of VC deal exits (65% in 2021), public listings account for 90% of the total exit value
• Over the last decade, institutional investors have incrementally rotated away from public equities into bonds, private equity and other alternatives
• Buyouts saw fewer poorly-performing investments in 2020 vs the GFC due to rapid central bank response
EYE ON THE M ARKET • M I CHAEL CEMB AL EST • J .P . MORG A N Acce s s o ur fu l l coro nav ir u s a na ly s i s w e b port a l h er e Ju ne 28, 20 21
20
Appendix II: Return dispersion on buyout and venture transactions within commingled funds
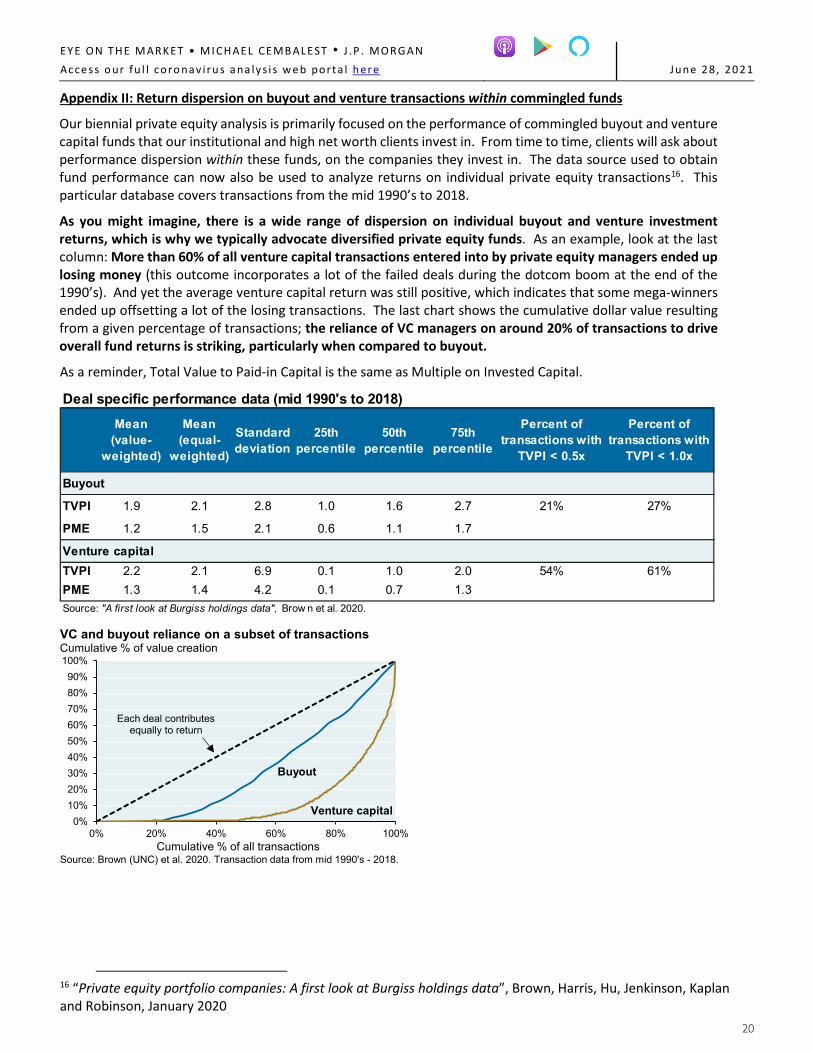
Our biennial private equity analysis is primarily focused on the performance of commingled buyout and venture capital funds that our institutional and high net worth clients invest in. From time to time, clients will ask about performance dispersion within these funds, on the companies they invest in. The data source used to obtain fund performance can now also be used to analyze returns on individual private equity transactions16. This particular database covers transactions from the mid 1990’s to 2018.
As you might imagine, there is a wide range of dispersion on individual buyout and venture investment returns, which is why we typically advocate diversified private equity funds. As an example, look at the last column: More than 60% of all venture capital transactions entered into by private equity managers ended up losing money (this outcome incorporates a lot of the failed deals during the dotcom boom at the end of the 1990’s). And yet the average venture capital return was still positive, which indicates that some mega-winners ended up offsetting a lot of the losing transactions. The last chart shows the cumulative dollar value resulting from a given percentage of transactions; the reliance of VC managers on around 20% of transactions to drive overall fund returns is striking, particularly when compared to buyout.
As a reminder, Total Value to Paid-in Capital is the same as Multiple on Invested Capital.
Deal specific performance data (mid 1990's to 2018)Mean
(value-weighted)
Mean (equal-
weighted)
Standard deviation
25th percentile
50th percentile
75th percentile
Percent of transactions with
TVPI < 0.5x
Percent of transactions with
TVPI < 1.0x
Buyout
TVPI 1.9 2.1 2.8 1.0 1.6 2.7 21% 27%
PME 1.2 1.5 2.1 0.6 1.1 1.7
Venture capitalTVPI 2.2 2.1 6.9 0.1 1.0 2.0 54% 61%PME 1.3 1.4 4.2 0.1 0.7 1.3Source: "A first look at Burgiss holdings data", Brow n et al. 2020.
0%10%20%30%40%50%60%70%80%90%
100%
0% 20% 40% 60% 80% 100%
VC and buyout reliance on a subset of transactionsCumulative % of value creation
Source: Brown (UNC) et al. 2020. Transaction data from mid 1990's - 2018. Cumulative % of all transactions
Each deal contributes equally to return
Buyout
Venture capital
16 “Private equity portfolio companies: A first look at Burgiss holdings data”, Brown, Harris, Hu, Jenkinson, Kaplan and Robinson, January 2020
EYE ON THE M ARKET • M I CHAEL CEMB AL EST • J .P . MORG A N Acce s s o ur fu l l coro nav ir u s a na ly s i s w e b port a l h er e Ju ne 28, 20 21
21
Appendix III: Sources for private equity manager performance
For many years, data aggregators such as Venture Economics were the primary sources for academics, analysts, asset allocators and others trying to figure out how diversified private equity portfolios were performing vs the public equity market. However, as explained in a 2013 paper from the University of Oxford, Venture Economics databases had substantial problems such as survivorship bias (selective reporting by funds) and incomplete data: “A detailed analysis of its aggregate and individual numbers, however, reveals severe anomalies. Over 40% of the funds in the database stopped being updated during their active lifetime. Incomplete funds are missing over 60% of their cash distributions. The result is a significant downward bias of the whole benchmark with major implications for a large fraction of the established literature on private equity”…and
“Reengineering the findings of some earlier studies turns the previously estimated underperformance of 3-6% against the S&P 500 into an outperformance by 4% per annum.”17
To compound the problem, some analysts assumed that constant residual values were in effect “living dead investments” and that they were worthless for purposes of computing fund returns.
The Burgiss database. A few years ago, a new approach was devised that sources private equity cash flow data directly from limited partners via Burgiss, a global provider of analytics to investors in private equity. The Burgiss investor universe includes 300 state and corporate pension fund, endowment and foundation limited partner investors in 1,400 private equity funds, and contains net-of-fee cash flow data. Burgiss believes its universe represents at least 70% of all private equity funds ever raised18. As a result, I have not looked at any self-reported performance data in years.
17 “Updating History”, Rudiger Stucke, Oxford, 2013. 18 "Private Equity, Buyouts and Venture Capital: Past, Present and Future", Steve Kaplan (Chicago Booth), June 2018.
EYE ON THE M ARKET • M I CHAEL CEMB AL EST • J .P . MORG A N Acce s s o ur fu l l coro nav ir u s a na ly s i s w e b port a l h er e Ju ne 28, 20 21
22
Appendix IV: On IRR, Direct Alpha, cash flow timing and subscription lines
Scenario analyses can be useful in understanding the drivers of IRR and Direct Alpha. We assume a Base Case for commitments and distributions, and also assume more front-loaded and back-loaded outcomes. We use an extreme case for subscription lines: every dollar called is funded by the line and is not paid back until the end of the investment period. We assume a hypothetical 2010 fund with a 4 year investment period and a 7 year harvesting period that distributes 2x committed capital. Relative performance metrics are benchmarked to the S&P 500 Index.
-40%
-30%
-20%
-10%
0%
10%
20%
30%
40%
50%
2010 2012 2014 2016 2018 2020
Base CaseFront LoadedBack Loaded
Illustrative net cash flows % of committed capital
Source: JPMAM. 2021.
End of investment period
The tables illustrate the sensitivity of IRR and Direct Alpha to changes in cash flow timing, and to the use of a subscription line as described above. For example, subscription lines have a much bigger impact when distributions are front-loaded vs when they are back-loaded.
Base Case Front Loaded Back Loaded
Base Case 15% 13% 18%
Front Loaded 20% 16% 26%
Back Loaded 10% 9% 12%
Source: JPMAM. 2021.
Commitment schedule
IRR based on commitment and distribution timing (without subscription line)
Distribution schedule Base Case Front Loaded Back Loaded
Base Case 2% -1% 4%
Front Loaded 6% 2% 10%
Back Loaded -2% -4% -2%
Source: JPMAM. 2021.
Direct Alpha based on commitment and distribution timing (without subscription line)
Distribution schedule
Commitment schedule
Base Case Front Loaded Back Loaded
Base Case 22% 21% 24%
Front Loaded 40% 37% 43%
Back Loaded 12% 11% 13%
Source: JPMAM. 2021.
Commitment scheduleDistribution schedule
IRR based on commitment and distribution timing (with subscription line)
Base Case Front Loaded Back Loaded
Base Case 11% 10% 13%
Front Loaded 29% 26% 32%
Back Loaded 1% 0% 1%
Source: JPMAM. 2021.
Direct Alpha based on commitment and distribution timing (with subscription line)
EYE ON THE M ARKET • M I CHAEL CEMB AL EST • J .P . MORG A N Acce s s o ur fu l l coro nav ir u s a na ly s i s w e b port a l h er e Ju ne 28, 20 21
23
IMPORTANT INFORMATION This report uses rigorous security protocols for selected data sourced from Chase credit and debit card transactions to ensure all information is kept confidential and secure. All selected data is highly aggregated and all unique identifiable information, including names, account numbers, addresses, dates of birth, and Social Security Numbers, is removed from the data before the report’s author receives it. The data in this report is not representative of Chase’s overall credit and debit cardholder population. The views, opinions and estimates expressed herein constitute Michael Cembalest’s judgment based on current market conditions and are subject to change without notice. Information herein may differ from those expressed by other areas of J.P. Morgan. This information in no way constitutes J.P. Morgan Research and should not be treated as such.
The views contained herein are not to be taken as advice or a recommendation to buy or sell any investment in any jurisdiction, nor is it a commitment from J.P. Morgan or any of its subsidiaries to participate in any of the transactions mentioned herein. Any forecasts, figures, opinions or investment techniques and strategies set out are for information purposes only, based on certain assumptions and current market conditions and are subject to change without prior notice. All information presented herein is considered to be accurate at the time of production. This material does not contain sufficient information to support an investment decision and it should not be relied upon by you in evaluating the merits of investing in any securities or products. In addition, users should make an independent assessment of the legal, regulatory, tax, credit and accounting implications and determine, together with their own professional advisers, if any investment mentioned herein is believed to be suitable to their personal goals. Investors should ensure that they obtain all available relevant information before making any investment. It should be noted that investment involves risks, the value of investments and the income from them may fluctuate in accordance with market conditions and taxation agreements and investors may not get back the full amount invested. Both past performance and yields are not reliable indicators of current and future results.
Non-affiliated entities mentioned are for informational purposes only and should not be construed as an endorsement or sponsorship of J.P. Morgan Chase & Co. or its affiliates.
For J.P. Morgan Asset Management Clients: J.P. Morgan Asset Management is the brand for the asset management business of JPMorgan Chase & Co. and its affiliates worldwide. To the extent permitted by applicable law, we may record telephone calls and monitor electronic communications to comply with our legal and regulatory obligations and internal policies. Personal data will be collected, stored and processed by J.P. Morgan Asset Management in accordance with our privacy policies at https://am.jpmorgan.com/global/privacy. ACCESSIBILITY For U.S. only: If you are a person with a disability and need additional support in viewing the material, please call us at 1-800-343-1113 for assistance. This communication is issued by the following entities: In the United States, by J.P. Morgan Investment Management Inc. or J.P. Morgan Alternative Asset Management, Inc., both regulated by the Securities and Exchange Commission; in Latin America, for intended recipients’ use only, by local J.P. Morgan entities, as the case may be.; in Canada, for institutional clients’ use only, by JPMorgan Asset Management (Canada) Inc., which is a registered Portfolio Manager and Exempt Market Dealer in all Canadian provinces and territories except the Yukon and is also registered as an Investment Fund Manager in British Columbia, Ontario, Quebec and Newfoundland and Labrador. In the United Kingdom, by JPMorgan Asset Management (UK) Limited, which is authorized and regulated by the Financial Conduct Authority; in other European jurisdictions, by JPMorgan Asset Management (Europe) S.à r.l. In Asia Pacific (“APAC”), by the following issuing entities and in the respective jurisdictions in which they are primarily regulated: JPMorgan Asset Management (Asia Pacific) Limited, or JPMorgan Funds (Asia) Limited, or JPMorgan Asset Management Real Assets (Asia) Limited, each of which is regulated by the Securities and Futures Commission of Hong Kong; JPMorgan Asset Management (Singapore) Limited (Co. Reg. No. 197601586K), which this advertisement or publication has not been reviewed by the Monetary Authority of Singapore; JPMorgan Asset Management (Taiwan) Limited; JPMorgan Asset Management (Japan) Limited, which is a member of the Investment Trusts Association, Japan, the Japan Investment Advisers Association, Type II Financial Instruments Firms Association and the Japan Securities Dealers Association and is regulated by the Financial Services Agency (registration number “Kanto Local Finance Bureau (Financial Instruments Firm) No. 330”); in Australia, to wholesale clients only as defined in section 761A and 761G of the Corporations Act 2001 (Commonwealth), by JPMorgan Asset Management (Australia) Limited (ABN 55143832080) (AFSL 376919). For all other markets in APAC, to intended recipients only. For J.P. Morgan Private Bank Clients: ACCESSIBILITY J.P. Morgan is committed to making our products and services accessible to meet the financial services needs of all our clients. Please direct any accessibility issues to the Private Bank Client Service Center at 1-866-265-1727. LEGAL ENTITY, BRAND & REGULATORY INFORMATION In the United States, bank deposit accounts and related services, such as checking, savings and bank lending, are offered by JPMorgan Chase Bank, N.A. Member FDIC. JPMorgan Chase Bank, N.A. and its affiliates (collectively “JPMCB”) offer investment products, which may include bank-managed investment accounts and custody, as part of its trust and fiduciary services. Other investment products and services, such as brokerage and advisory accounts, are offered through J.P. Morgan Securities LLC (“JPMS”), a member of FINRA and SIPC. Annuities are made available through Chase Insurance Agency, Inc. (CIA), a licensed insurance agency, doing business as Chase Insurance Agency Services, Inc. in Florida. JPMCB, JPMS and CIA are affiliated companies under the common control of JPM. Products not available in all states. In Luxembourg, this material is issued by J.P. Morgan Bank Luxembourg S.A. (JPMBL), with registered office at European Bank and Business Centre, 6 route de Treves, L-2633, Senningerberg, Luxembourg. R.C.S Luxembourg B10.958. Authorized and regulated by Commission de Surveillance du Secteur Financier (CSSF) and jointly supervised by the European Central Bank (ECB) and the CSSF. J.P. Morgan Bank Luxembourg S.A. is authorized as a credit institution in accordance with the Law of 5th April 1993. In the United Kingdom, this material is issued by J.P. Morgan Bank Luxembourg S.A., London Branch, registered office at 25 Bank Street, Canary Wharf, London E14 5JP. Authorised and regulated by Commission de Surveillance du Secteur Financier (CSSF) and jointly supervised by the European Central Bank (ECB) and the CSSF. Deemed authorised by the Prudential Regulation Authority. Subject to regulation by the Financial Conduct Authority and limited regulation by the Prudential Regulation Authority. Details of the Temporary Permissions Regime, which allows EEA-based firms to operate in the UK for a limited period while seeking full authorisation, are available on the Financial Conduct Authority’s website. In Spain, this material is distributed by J.P. Morgan Bank Luxembourg S.A., Sucursal en España, with registered office at Paseo de la Castellana, 31, 28046 Madrid, Spain. J.P. Morgan Bank Luxembourg S.A., Sucursal en
EYE ON THE M ARKET • M I CHAEL CEMB AL EST • J .P . MORG A N Acce s s o ur fu l l coro nav ir u s a na ly s i s w e b port a l h er e Ju ne 28, 20 21
24
España is registered under number 1516 within the administrative registry of the Bank of Spain and supervised by the Spanish Securities Market Commission (CNMV). In Germany, this material is distributed by J.P. Morgan Bank Luxembourg S.A., Frankfurt Branch, registered office at Taunustor 1 (TaunusTurm), 60310 Frankfurt, Germany, jointly supervised by the Commission de Surveillance du Secteur Financier (CSSF) and the European Central Bank (ECB), and in certain areas also supervised by the Bundesanstalt für Finanzdienstleistungsaufsicht (BaFin). In Italy, this material is distributed by J.P. Morgan Bank Luxembourg S.A– Milan Branch, registered office at Via Cordusio 3, 20123 Milano, Italy and regulated by Bank of Italy and the Commissione Nazionale per le Società e la Borsa (CONSOB). In the Netherlands, this material is distributed by J.P. Morgan Bank Luxembourg S.A., Amsterdam Branch, with registered office at World Trade Centre, Tower B, Strawinskylaan 1135, 1077 XX, Amsterdam, The Netherlands. J.P. Morgan Bank Luxembourg S.A., Amsterdam Branch is authorized and regulated by the Commission de Surveillance du Secteur Financier (CSSF) and jointly supervised by the European Central Bank (ECB) and the CSSF in Luxembourg; J.P. Morgan Bank Luxembourg S.A., Amsterdam Branch is also authorized and supervised by De Nederlandsche Bank (DNB) and the Autoriteit Financiële Markten (AFM) in the Netherlands. Registered with the Kamer van Koophandel as a branch of J.P. Morgan Bank Luxembourg S.A. under registration number 71651845. In Denmark, this material is distributed by J.P. Morgan Bank Luxembourg, Copenhagen Br, filial af J.P. Morgan Bank Luxembourg S.A. with registered office at Kalvebod Brygge 39-41, 1560 København V, Denmark. J.P. Morgan Bank Luxembourg, Copenhagen Br, filial af J.P. Morgan Bank Luxembourg S.A. is authorized and regulated by Commission de Surveillance du Secteur Financier (CSSF) and jointly supervised by the European Central Bank (ECB) and the CSSF. J.P. Morgan Bank Luxembourg, Copenhagen Br, filial af J.P. Morgan Bank Luxembourg S.A. is also subject to the supervision of Finanstilsynet (Danish FSA) and registered with Finanstilsynet as a branch of J.P. Morgan Bank Luxembourg S.A. under code 29009. In Sweden, this material is distributed by J.P. Morgan Bank Luxembourg S.A., Stockholm Bankfilial, with registered office at Hamngatan 15, Stockholm, 11147, Sweden. J.P. Morgan Bank Luxembourg S.A., Stockholm Bankfilial is authorized and regulated by Commission de Surveillance du Secteur Financier (CSSF) and jointly supervised by the European Central Bank (ECB) and the CSSF. J.P. Morgan Bank Luxembourg S.A., Stockholm Bankfilial is also subject to the supervision of Finansinspektionen (Swedish FSA). Registered with Finansinspektionen as a branch of J.P. Morgan Bank Luxembourg S.A. In France, this material is distributed by JPMorgan Chase Bank, N.A. (“JPMCB”), Paris branch, which is regulated by the French banking authorities Autorité de Contrôle Prudentiel et de Résolution and Autorité des Marchés Financiers. In Switzerland, this material is distributed by J.P. Morgan (Suisse) SA, which is regulated in Switzerland by the Swiss Financial Market Supervisory Authority (FINMA). In Hong Kong, this material is distributed by JPMCB, Hong Kong branch. JPMCB, Hong Kong branch is regulated by the Hong Kong Monetary Authority and the Securities and Futures Commission of Hong Kong. In Hong Kong, we will cease to use your personal data for our marketing purposes without charge if you so request. In Singapore, this material is distributed by JPMCB, Singapore branch. JPMCB, Singapore branch is regulated by the Monetary Authority of Singapore. Dealing and advisory services and discretionary investment management services are provided to you by JPMCB, Hong Kong/Singapore branch (as notified to you). Banking and custody services are provided to you by JPMCB Singapore Branch. The contents of this document have not been reviewed by any regulatory authority in Hong Kong, Singapore or any other jurisdictions. You are advised to exercise caution in relation to this document. If you are in any doubt about any of the contents of this document, you should obtain independent professional advice. For materials which constitute product advertisement under the Securities and Futures Act and the Financial Advisers Act, this advertisement has not been reviewed by the Monetary Authority of Singapore. JPMorgan Chase Bank, N.A. is a national banking association chartered under the laws of the United States, and as a body corporate, its shareholder’s liability is limited. With respect to countries in Latin America, the distribution of this material may be restricted in certain jurisdictions. We may offer and/or sell to you securities or other financial instruments which may not be registered under, and are not the subject of a public offering under, the securities or other financial regulatory laws of your home country. Such securities or instruments are offered and/or sold to you on a private basis only. Any communication by us to you regarding such securities or instruments, including without limitation the delivery of a prospectus, term sheet or other offering document, is not intended by us as an offer to sell or a solicitation of an offer to buy any securities or instruments in any jurisdiction in which such an offer or a solicitation is unlawful. Furthermore, such securities or instruments may be subject to certain regulatory and/or contractual restrictions on subsequent transfer by you, and you are solely responsible for ascertaining and complying with such restrictions. To the extent this content makes reference to a fund, the Fund may not be publicly offered in any Latin American country, without previous registration of such fund’s securities in compliance with the laws of the corresponding jurisdiction. Public offering of any security, including the shares of the Fund, without previous registration at Brazilian Securities and Exchange Commission— CVM is completely prohibited. Some products or services contained in the materials might not be currently provided by the Brazilian and Mexican platforms. JPMorgan Chase Bank, N.A. (JPMCBNA) (ABN 43 074 112 011/AFS Licence No: 238367) is regulated by the Australian Securities and Investment Commission and the Australian Prudential Regulation Authority. Material provided by JPMCBNA in Australia is to “wholesale clients” only. For the purposes of this paragraph the term “wholesale client” has the meaning given in section 761G of the Corporations Act 2001 (Cth). Please inform us if you are not a Wholesale Client now or if you cease to be a Wholesale Client at any time in the future. JPMorgan Chase Bank, N.A. (JPMCBNA) (ABN 43 074 112 011/AFS Licence No: 238367) is regulated by the Australian Securities and Investment Commission and the Australian Prudential Regulation Authority. Material provided by JPMCBNA in Australia is to “wholesale clients” only. For the purposes of this paragraph the term “wholesale client” has the meaning given in section 761G of the Corporations Act 2001 (Cth). Please inform us if you are not a Wholesale Client now or if you cease to be a Wholesale Client at any time in the future. JPMS is a registered foreign company (overseas) (ARBN 109293610) incorporated in Delaware, U.S.A. Under Australian financial services licensing requirements, carrying on a financial services business in Australia requires a financial service provider, such as J.P. Morgan Securities LLC (JPMS), to hold an Australian Financial Services Licence (AFSL), unless an exemption applies. JPMS is exempt from the requirement to hold an AFSL under the Corporations Act 2001 (Cth) (Act) in respect of financial services it provides to you, and is regulated by the SEC, FINRA and CFTC under U.S. laws, which differ from Australian laws. Material provided by JPMS in Australia is to “wholesale clients” only. The information provided in this material is not intended to be, and must not be, distributed or passed on, directly or indirectly, to any other class of persons in Australia. For the purposes of this paragraph the term “wholesale client” has the meaning given in section 761G of the Act. Please inform us immediately if you are not a Wholesale Client now or if you cease to be a Wholesale Client at any time in the future. This material has not been prepared specifically for Australian investors. It:
• May contain references to dollar amounts which are not Australian dollars; • May contain financial information which is not prepared in accordance with Australian law or practices; • May not address risks associated with investment in foreign currency denominated investments; and • Does not address Australian tax issues.