FOOD INDUSTRY COLOR CONTROL THE COLOR OF QUALITY SENSING AMERICAS, INC. APPLICATION NOTES Color & Appearance THE STANDARD IN MEASURING C O L O R When it comes to foods, color and appear- ance are the most important first impressions, even before one’s olfactory sense is tickled with a pleasing aroma. That is the point Dr. Seuss makes in his famous book, “Green Eggs and Ham,” loved by children and adults alike. His lesson for everyone is “Don’t reject things just because they look different.” In fact, for the grumpy character whom “Sam-I-am” pursues up hill and down dale to try his dish, even the normally appealing smell of cooked ham and eggs couldn’t overcome the “off-color” of the foods. In today’s retail world of behind glass, chilled, frozen, boxed, dried, vacuum-packed and plastic wrapped foods, eye-appeal is far more important than nose-appeal. Both fresh and processed food producers know this well, and are increasingly adopting instrumental color measurement technologies and practices to control color better across a wide range of applica- tions. Two Principal Color Measurement Techniques In current food industries’ practice, two principal color measurement techniques are used: Colorimetry and Spectrophotometry. Colorimetry is the technique which quantifies color by measuring three primary color components of light which are seen by the human eye, specifically, red, green and blue (also referred to as “RGB”). This “tristimulus” color mea- surement provides data on how much of these three components are present in the light reflected (solids) or transmitted (typically liquids) by a food product. Such data may be used, for example, to adjust the color components in a prepared food or beverage recipe to improve “eye-appeal,” to gauge “doneness” in a baked product, and, in fresh foods, to determine fac- tors such as degrees of ripeness and spoilage in relation to shipping, storage, shelf-life, palatability and disposal cycles. Although there is no strict demarcation line where the benefits of colorimetry in foods ends, it should be recognized that it measures color much the same as the human eye. That is, secondary and tertiary colors such as orange, yellow, violet, tans, browns, etc. are not individually quanti- fiable. This leaves a variability factor which can hamper the consistent repro- ducibility of a desired color in prepared food products which are formulated for a specific, consistently produced look. Spectrophotometry, a sci- entific “step up” so to speak, is presently the most precise and accurate technique for the measure- ment, formulation and quality control of desired colors in prepared food products. Spectrophotometer instruments measure the spectral reflectance or transmittance of an object across the full spectrum of human visible light wavelengths, 400 nm to 700 nm (nanome- ters), enabling precise specification of any desired color. Spectro- photometers offer greater specificity, making them the instruments of choice for food product color formulation, specifi- cation of standards and tolerances, inter-plant color communication and color quality control in processing operations. Over the last decade, spectrophotometers have been increasingly adopted in the food industries for color standardization and QC inspection of ingredients prior to use, for specification of final product color (partic- ularly in jams, jellies, preserves, beverages, etc.), in research and development of new food and beverage products, and in potential food screening and sorting techniques for factors ranging from carcass’s natural No, No, Sam-I-am! I do not like green eggs and ham! · From the Dr. Seuss children’s book, Green Eggs and Ham “ ” GREEN EGGS AND HAM BY DR. SEUSS; TRADEMARK AND COPYRIGHT RENEWED 1988 BY DR. SEUSS ENTERPRISES, L.P.. ALL RIGHTS RESERVED. PUBLISHED IN THE UNITED STATES BY RANDOM HOUSE, INC., NEW YORK, AND SIMULTANEOUSLY IN CANADA BY RANDOM HOUSE OF CANADA LIMITED, TORONTO. ISBN:0-394-80016-8 (TRADE); 0-394-90016-2 (LIB. BDG.). THIS WONDERFUL BOOK IS AVAILABLE JUST ABOUT ANYWHERE IN BOOKSTORES AND CHILDREN STORES AROUNDTHE WORLD. CR-400 Series Colorimeter CM-3500d Spectrophotometer
Transcript
FOOD INDUSTRY COLOR CONTROLTHE COLOR OF QUALITY
SENS ING AMER ICAS, INC.
APPLICATION NOTESColor & Appearance
THE STANDARD IN MEASURING COLOR
When it comes to foods, color and appear-ance are the most important first impressions,
even before one’s olfactory sense is tickled with a pleasing aroma.
That is the point Dr. Seuss makes in his famous book, “Green Eggs and Ham,” loved by children and adults alike. His lesson for everyone is “Don’t reject things just because they look different.” In fact, for the grumpy character whom “Sam-I-am” pursues up hill and down dale to try his dish, even the normally appealing smell of cooked ham and eggs couldn’t overcome the “off-color” of the foods.
In today’s retail world of behind glass, chilled, frozen, boxed, dried, vacuum-packed and plastic wrapped foods, eye-appeal is far more important than nose-appeal.
Both fresh and processed food producers know this well, and are increasingly adopting instrumental color measurement technologies and practices to control color better across a wide range of applica-tions.
Two Principal Color Measurement TechniquesIn current food industries’ practice, two principal color measurement techniques are used: Colorimetry and Spectrophotometry.
Colorimetry is the technique which quantifies color by measuring three primary color components of light which are seen by the human eye, specifically, red, green and blue (also referred to as “RGB”). This “tristimulus” color mea-surement provides data on how much of these three components are present in the light reflected (solids) or transmitted (typically liquids) by a food product. Such
data may be used, for example, to adjust the color components in a prepared food or beverage recipe to improve “eye-appeal,” to gauge “doneness” in a baked product, and, in fresh foods, to determine fac-tors such as degrees of ripeness and spoilage in relation to shipping, storage, shelf-life, palatability and disposal cycles. Although there is no strict demarcation line where the benefits of colorimetry in foods ends, it should be recognized that it measures color much the same as the human eye. That is, secondary and tertiary colors such as orange, yellow, violet, tans, browns, etc. are not individually quanti-fiable. This leaves a variability factor which can hamper the consistent repro-ducibility of a desired color in prepared food products which are formulated for a specific, consistently produced look.
Spectrophotometry, a sci-entific “step up” so to speak, is presently the most precise and accurate technique for the measure-ment, formulation and quality control of desired colors in prepared food products. Spectrophotometer instruments measure the spectral reflectance or transmittance of an object across the full spectrum of human visible light wavelengths, 400 nm to 700 nm (nanome-ters), enabling precise specification of any desired color. Spectro-photometers offer greater specificity, making them the instruments
of choice for food product color formulation, specifi-cation of standards and tolerances, inter-plant color communication and color quality control in processing operations.
Over the last decade, spectrophotometers have been increasingly adopted in the food industries for color standardization and QC inspection of ingredients prior to use, for specification of final product color (partic-ularly in jams, jellies, preserves, beverages, etc.), in research and development of new food and beverage products, and in potential food screening and sorting techniques for factors ranging from carcass’s natural
No, No, Sam-I-am! I do not like green eggs and ham!
· From the Dr. Seuss children’s book, Green Eggs and Ham
“”
GREEN EGGS AND HAM BY DR. SEUSS; TRADEMARK AND COPYRIGHT RENEWED 1988 BY DR. SEUSS ENTERPRISES, L.P.. ALL RIGHTS RESERVED. PUBLISHED IN THE UNITED STATES BY RANDOM HOUSE, INC., NEW YORK, AND SIMULTANEOUSLY IN CANADA BY RANDOM HOUSE OF CANADA LIMITED, TORONTO. ISBN:0-394-80016-8 (TRADE); 0-394-90016-2 (LIB. BDG.). THIS WONDERFUL BOOK IS AVAILABLE JUST ABOUT ANYWHERE IN BOOKSTORES AND CHILDREN STORES AROUNDTHE WORLD.
CR-400 Series Colorimeter
CM-3500d Spectrophotometer
FOOD INDUSTRY COLOR CONTROLTHE COLOR OF QUALITY
APPL
ICAT
ION
NOTE
SCo
lor &
App
eara
nce
KONICA MINOLTA SENSING AMERICAS, INC.
fat content to quality grading of meats, poultry and fish.
Software and MethodologiesOne indispensable, key factor in the food industries’ growing use of both colorimetry and spectrophotometry is the availability of easy to understand and easy to adapt Color Data Software for color mea-surement, color matching, color formulation and color quality control. When correlated with all other food laboratory and quality control data, color itself can become an integral clinical data component of factors ranging from product appeal to shelf-life to possible spoilage and/or contamination risks.
Color formulation software and color matching software packages are available with portable and bench-top spectrophotometers for use in laboratory color control systems. Color quality control software with sample pass/fail comparison testing and database up-date functions is a standard component of those systems, and is also an integral onboard QC inspection function of our Konica Minolta portable colorimeters and spectro-photometers.
The art in the science of integrating color as a food quality component lies in the methodology developed and used by food producers and the food processors. In
the food sciences, technologies are devel-oped in response to needs enunciated and defined by
food industry scientists and technologists. At Konica Mi-
nolta Sensing, we view our role as being technologi-cally responsive: that is, the food industries’ sci-entists and technologists foresee their color mea-surement and method-ology goals and, in turn, we attempt to create and
apply technologies to ful-fill their needs. Over the
last 20 years, we have moved through nearly four generations of tech-nologies. The following examples give a view of the continuing advance of food color measure-
ment, as well as hints of where it may go in the 21st Century.
Baking “Goodies” at Pepperidge Farm®
Judging baked goods by eye is not as easy as many home bakers might think, accord-ing to Mike Davis, Bakery Technologist, at Pepperidge Farm. Until Pepperidge Farm installed BC-10 Baking Con-trast Meters, Mr. Davis said judging the acceptable color of finished baked goods on plant floors was a real challenge. Previously, “accept-
able color” was established by comparing a production sam-ple against a color photograph of how the product should
look when it exits the baking oven. Despite photos taken in a special room with carefully controlled lighting con-ditions, Mr. Davis said that judging the color on the line was problematic.
Visual color judgment was simply too subjective. At Pep-peridge Farm it was recognized that consistent color and
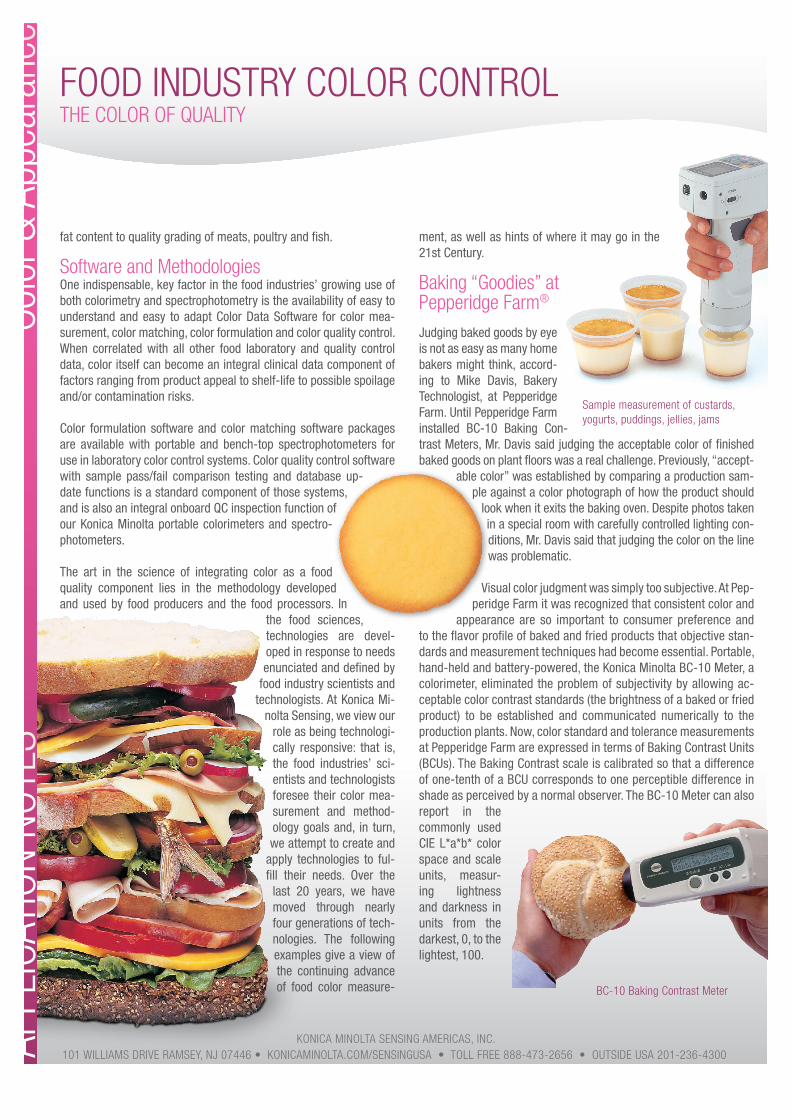
appearance are so important to consumer preference and to the flavor profile of baked and fried products that objective stan-dards and measurement techniques had become essential. Portable, hand-held and battery-powered, the Konica Minolta BC-10 Meter, a colorimeter, eliminated the problem of subjectivity by allowing ac-ceptable color contrast standards (the brightness of a baked or fried product) to be established and communicated numerically to the production plants. Now, color standard and tolerance measurements at Pepperidge Farm are expressed in terms of Baking Contrast Units (BCUs). The Baking Contrast scale is calibrated so that a difference of one-tenth of a BCU corresponds to one perceptible difference in shade as perceived by a normal observer. The BC-10 Meter can also report in the commonly used CIE L*a*b* color space and scale units, measur-ing lightness and darkness in units from the darkest, 0, to the lightest, 100.
Sample measurement of custards,yogurts, puddings, jellies, jams
BC-10 Baking Contrast Meter
FOOD INDUSTRY COLOR CONTROLTHE COLOR OF QUALITY
KONICA MINOLTA SENSING AMERICAS, INC.
“Preserving” the Right Color at Welch’s®
A few years ago, Welch Foods, Inc., the famous co-operative of some 1400 grape growers, was seeking a more empirical way of formulat-ing color in recipes for their many bottled and canned juices, jellies, jams and frozen products. The challenge, their laboratory explained, was the annual seasonal and regional variability of the natural grapes used, Concord Grapes and Niagra Grapes. Grown in five states and a Canadian province, and processed in six plants, the grapes can vary in a number of factors. Color, of course, is important since many Welch’s products are in clear glass and plastic bottles. Testing samples of each season’s harvest against nutritional and recipe standards, an on-going process at the laboratory, was very precise, qualitative and quantita-tive, except for color. That was still somewhat subjective. Working with Konica Minolta application engineers, Welch’s food technologists de-termined the optimum color measurement and evaluation methodol-ogy for them was spectrophotometry.Experimenting with portable and bench top spectrophotometers, the laboratory found that it could work backward from the ideal final product and establish specifications and tolerances for color at each stage of the product manufacturing process. Color variations from standard could then be adjusted to better assure color consistency in final products. Welch’s also found spectrophotometry highly useful in new product development.
A Flour by Any Other Name is Still?One would think that in manufacturing regular white pasta flour, color wouldn’t be much of an issue. Well, with every kitchen becoming a home gourmet’s retreat, the surge in specialty flours and the home-grown sprouting of epicurean eyes and palates, which claim almost preternatural abilities to discern food ingredients, it’s now an issue - and one to be avoided.
This challenge was presented by a semolina flour manufacturer who wished to determine the best method for standardizing the color of the company’s semolina products, not just for consumer lines, but for commercial products, too. The problem was natural: semolina wheat grains vary in color. The manufacturer was already combining both grain and flour lots to average the color mixtures, but felt numerical standards and tolerances were needed to assist operations in aver-aging the ingredients.
The solution was first standardizing an ideal semolina flour using a Konica Minolta Colorimeter System, and then measuring individual flour lots for their color characteristics. By sample averaging, col-or variability within each lot was reduced, and then computer color matching of lots for successful color mixture potential in a final flour blend became possible.
Fresh Mangos in Frozen MaineIn the 1990’s, TransFRESH Corporation, a leader in the development of modified and controlled atmosphere systems for the transport of perishable foods, initiated an advanced program to gauge the matura-tion and spoilage rates of specific fresh produce items. Creating a con-trolled atmosphere to keep produce fresh during shipment requires extensive testing. Since there is a direct correlation between the ripe-ness of various fruits and their color, TransFRESH initiated a program using a Konica Minolta colorimeter to chart the ripening process under various controlled atmospheric conditions over typical durations of shipment. For example, the measured color of an avocado rind pro-vided data about its point of ripeness. Similarly, the rate of discolor-ation of the rind allowed plotting of the maturation process. Today, TransFRESH can determine precisely the right atmosphere needed for a particular product shipment to arrive fresh at its retailer.
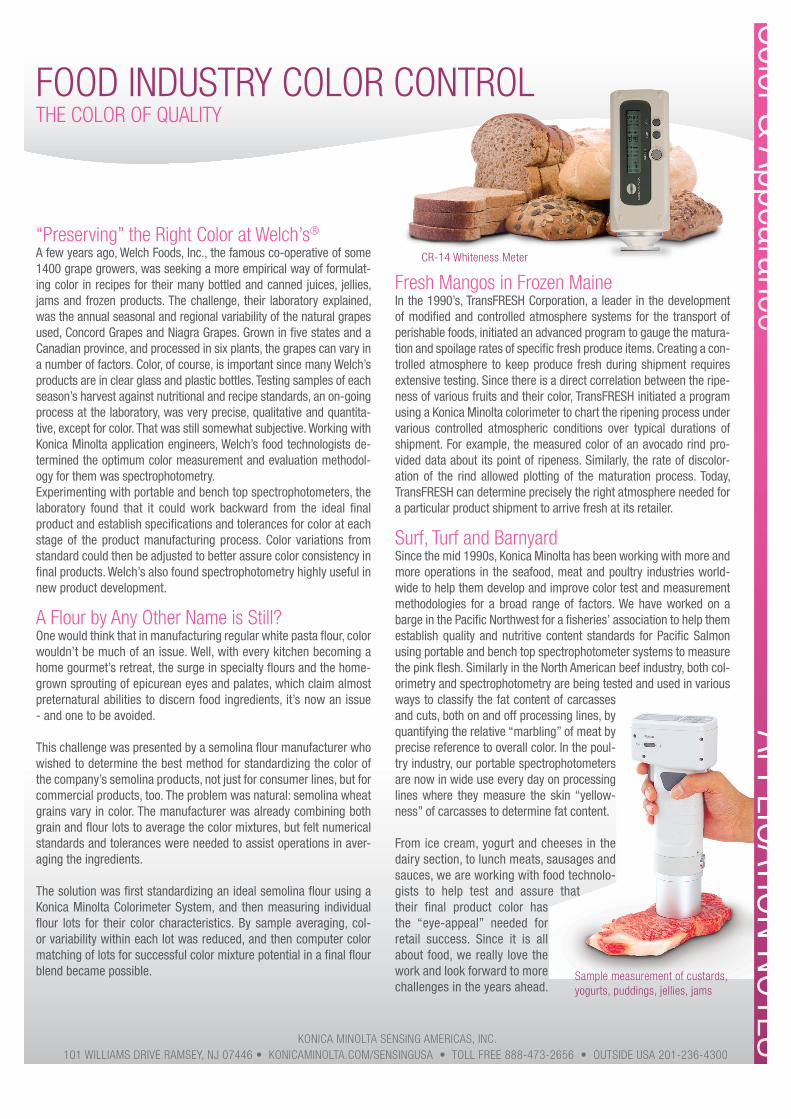
Surf, Turf and BarnyardSince the mid 1990s, Konica Minolta has been working with more and more operations in the seafood, meat and poultry industries world-wide to help them develop and improve color test and measurement methodologies for a broad range of factors. We have worked on a barge in the Pacific Northwest for a fisheries’ association to help them establish quality and nutritive content standards for Pacific Salmon using portable and bench top spectrophotometer systems to measure the pink flesh. Similarly in the North American beef industry, both col-orimetry and spectrophotometry are being tested and used in various ways to classify the fat content of carcasses and cuts, both on and off processing lines, by quantifying the relative “marbling” of meat by precise reference to overall color. In the poul-try industry, our portable spectrophotometers are now in wide use every day on processing lines where they measure the skin “yellow-ness” of carcasses to determine fat content.
From ice cream, yogurt and cheeses in the dairy section, to lunch meats, sausages and sauces, we are working with food technolo-gists to help test and assure that their final product color has the “eye-appeal” needed for retail success. Since it is all about food, we really love the work and look forward to more challenges in the years ahead.
Sample measurement of custards,yogurts, puddings, jellies, jams