Page 1
THIS REPORT CONTAINS ASSESSMENTS OF COMMODITY AND TRADE ISSUES MADE BY
USDA STAFF AND NOT NECESSARILY STATEMENTS OF OFFICIAL U.S. GOVERNMENT
POLICY
Date:
GAIN Report Number:
Approved By:
Prepared By:
Report Highlights:
The food processing industry is a key player within Ecuador’s manufacturing sector. It alone accounts
for 42 percent of the manufacturing sector’s contribution to Ecuador’s gross domestic product. The
food processing sector in 2014 (latest full year data) accounted for 16 percent of Ecuador’s estimated
$12.5 billion in non-oil export earnings. An effective market entry strategy includes targeting
Ecuador’s technically-sophisticated food manufacturers. These firms are better positioned to import
U.S. artificial flavorings, colorants, preservatives, and spices. U.S. food ingredients, especially
seasonings used in the manufacture of pre-cooked and easy-to-prepare meals, are in high demand.
SECTION I. MARKET SUMMARY
Andres Barahona and Mariano J. Beillard
Mariano J. Beillard, Regional Agricultural Attaché
Ecuador’s Food Processers Salivating over U.S. Food
Processing Ingredients
Food Processing Ingredients 2015 Annual
Ecuador
12/11/2015
Required Report - public distribution
Page 2
Ecuador’s economic growth in 2016 is forecast to slow to around 0.8 percent, an improvement from -0.7
percent in 2015. Despite slower economic growth, Ecuador nonetheless continues to offer U.S. food
and agricultural product exporters a number of good possibilities.
Younger and lower- to middle-income consumers’ purchasing power and appetite for imports is healthy.
Ecuador counts with a population of about 15.8 million (Central Intelligence Agency, July 2015
estimate) with a median age of 26 that is growing at 1.4 percent annually. Although unemployment in
2015 is estimated at a low of 4.8-5 percent, underemployment however hovers at a high of 50 percent.
High underemployment in a workforce that numbers about 7.2 million is a key factor limiting further
food product consumption. The government aims to improve consumption through private and public-
sector salary increases and cash transfer programs. Reportedly the economy will remain dollarized in
the near- to medium-term.
Government spending remains the main driver of the economy, but it is constrained by the oil sector’s
output capabilities and lower international petroleum prices. Sources comment that the combination of
these factors could divert revenues away from public work projects in the near- to medium-term. The
government is increasingly reliant on China, its main creditor, to finance disproportionately high levels
of public spending. Ecuador continues to service its Chinese debt through the future sale of oil
shipments.
Ecuador’s food processing industry is a key player within the country’s manufacturing sector. The food
processing sector reportedly accounts for about 42 percent of the manufacturing sector’s contribution to
the country’s gross domestic product (GDP). The food processing sector in 2014 (latest full year data)
contributed 16 percent to Ecuador’s $12.5 billion non-oil export earnings. The country is the world’s
largest exporter of bananas, as well as a major supplier of cut flowers, fruits, cocoa, coffee, tuna, and
shrimp.
Table 1: Ecuador, Retail Sales and Consumer Expenditure, ($ billions), 2012-16
2012 2013 2014
2015
(estimate)
2016
(forecast)
Retail Food Sales
($ billion) $19.4 $20.4 $21.9 $23.1 $25.3
Food, Beverage and Tobacco (consumer
expenditure; $ billion) $13.7 $14.5 $15.7 $17.0 $18.4
Source: Economist Intelligence Unit.
Ecuador’s food processing industry’s main food and beverage sub-sectors include:
Meat, meat products and sub-products
Processed shrimp
Fish and other processed aquatic products
Crude and refined animal and vegetable oils
Processed dairy products
Milling and bakery products, noodles and pasta
Sugar and sugar cane products
Page 3
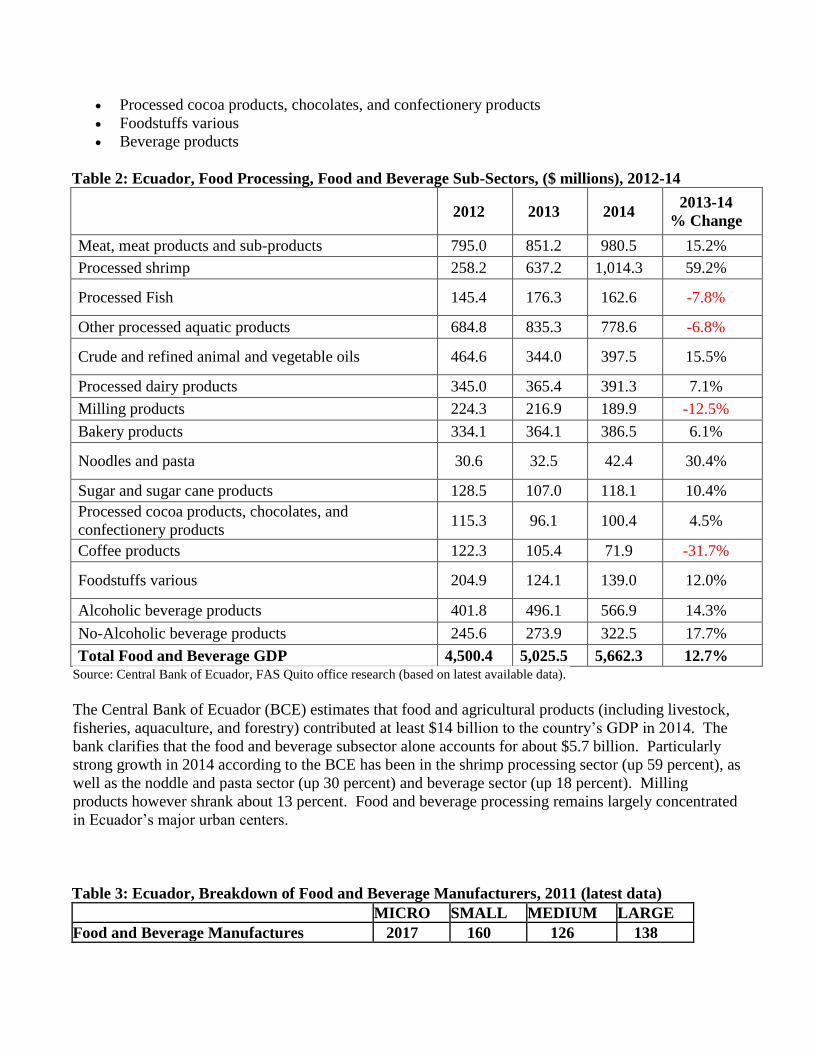
Processed cocoa products, chocolates, and confectionery products
Foodstuffs various
Beverage products
Table 2: Ecuador, Food Processing, Food and Beverage Sub-Sectors, ($ millions), 2012-14
2012 2013 2014 2013-14
% Change
Meat, meat products and sub-products 795.0 851.2 980.5 15.2%
Processed shrimp 258.2 637.2 1,014.3 59.2%
Processed Fish 145.4 176.3 162.6 -7.8%
Other processed aquatic products 684.8 835.3 778.6 -6.8%
Crude and refined animal and vegetable oils 464.6 344.0 397.5 15.5%
Processed dairy products 345.0 365.4 391.3 7.1%
Milling products 224.3 216.9 189.9 -12.5%
Bakery products 334.1 364.1 386.5 6.1%
Noodles and pasta 30.6 32.5 42.4 30.4%
Sugar and sugar cane products 128.5 107.0 118.1 10.4%
Processed cocoa products, chocolates, and
confectionery products 115.3 96.1 100.4 4.5%
Coffee products 122.3 105.4 71.9 -31.7%
Foodstuffs various 204.9 124.1 139.0 12.0%
Alcoholic beverage products 401.8 496.1 566.9 14.3%
No-Alcoholic beverage products 245.6 273.9 322.5 17.7%
Total Food and Beverage GDP 4,500.4 5,025.5 5,662.3 12.7% Source: Central Bank of Ecuador, FAS Quito office research (based on latest available data).
The Central Bank of Ecuador (BCE) estimates that food and agricultural products (including livestock,
fisheries, aquaculture, and forestry) contributed at least $14 billion to the country’s GDP in 2014. The
bank clarifies that the food and beverage subsector alone accounts for about $5.7 billion. Particularly
strong growth in 2014 according to the BCE has been in the shrimp processing sector (up 59 percent), as
well as the noddle and pasta sector (up 30 percent) and beverage sector (up 18 percent). Milling
products however shrank about 13 percent. Food and beverage processing remains largely concentrated
in Ecuador’s major urban centers.
Table 3: Ecuador, Breakdown of Food and Beverage Manufacturers, 2011 (latest data)
MICRO SMALL MEDIUM LARGE
Food and Beverage Manufactures 2017 160 126 138
Page 4
Meat, meat products and sub products 16 11 20 10
Fish and other processed aquatic products 19 12 15 24
Fruits and vegetables products 23 17 10 10
Animal and vegetable oils 3 2 5 19
Dairy products 36 17 12 13
Milling products, starch and starch products 16 9 10 13
Foodstuffs various 60 64 38 31
Beverages 44 28 16 18 Source: Superintendencia de Compañías – CIIU.
Table 4: U.S. Supplier Advantages and Challenges in Ecuador
Advantages Challenges Ecuador’s economy continues to grow, albeit at a
somewhat slower pace than in recent years.
With a number of processed food products facing now
import restrictions, new opportunities are potentially
developing for exporters of unprocessed raw materials
and food ingredients.
The United States remains Ecuador’s main agricultural
trade partner despite a cooling relationship.
U.S.-origin products are well regarded for their high
quality and value.
Local food processing industry is challenged to offer
competitive market prices.
U.S. food and agricultural products (including
food ingredients) are disadvantaged by the
absence of a free trade agreement with
Ecuador.
Ecuador’s import procedures are
cumbersome.
U.S. foodstuffs exporters are less aggressive
than other regional trade partners (e.g., Chile)
in tracking Ecuadorian sales.
A quarter of the population is below the
poverty line; ; lacking the financial means to
afford imported products
U.S.-origin products tend not to be as price
competitive as those from neighboring
countries.
SECTION II. ROAD MAP FOR MARKET ENTRY
A. Entry Strategy
U.S. food ingredient producers and exporters seeking to enter the Ecuadorian market should
contact local food processors directly or work with representatives, agents or distributors to
define the application and product type best suited to meet end user needs. Large companies
usually import directly from foreign suppliers. Small- and medium-sized enterprises, lacking the
ability to purchase large volumes, deal primarily with a representative or distributor. In the case
of large volumes, the establishment of a local subsidiary to guarantee services and quality to
clients is often advisable.
U.S. food processing ingredients are well regarded for their high quality and value. To compete
with local competitors’ own improving quality and pricing, U.S. exporters need to offer a
combination of quality, competitive pricing, and additional services (i.e., warranties and
packaging suited to the local market’s standards).
Page 5
U.S. exporters should build relationships with importers and distributors through personal visits.
Constant monitoring, support, and ongoing communications with the importer can help offset
freight and tariff advantages of neighboring country exporters.
Creditworthiness is always a concern. U.S. exporters are advised to avoid offering direct credit
lines until their client’s creditworthiness is well established. If letters-of-credit are utilized, it is
advisable that these be confirmed and that they are irrevocable letters-of-credit.
FAS Quito can provide U.S. exporters with valuable market information, key import contacts,
and local legal and business information. Exporters contemplating sales to Ecuador should
contact FAS Quito (Section V).
B. Market Strategy
One way for new market entrants to build sales in Ecuador is by offering a combination of competitive
pricing along with profit sharing, promotion cost support, as well as by engaging in joint product
promotions. If it is not possible to penetrate existing distribution channels, exporters can attempt to
establish their own distribution channels. Distribution channels in Ecuador will vary between those for
domestic and imported products.
FAS Quito finds that raw material and food ingredients represent a significant portion of the final
purchase price of locally manufactured food products. To maximize returns, local food processors will
often seek out more affordable, locally sourced food ingredients. Local food processors tend to
purchase directly from foreign suppliers, forgoing the use of brokers. We find that local companies
with low sales volumes often face higher import related costs. To compensate for these expenses, many
of these companies source imported food ingredients from wholesalers who act as importers.
C. Company Profiles
Ecuador’s food and beverage processing companies are ramping up production output in response to
increased product demand driven by population and income growth. Local processing companies are
attempting to capitalize on this growth often by lobbying the government for support at the expense of
imported products.
Page 6
Table 5: Ecuador, Food and Beverage Manufacturing Subsectors, ($ millions)
Economic Activity Total
Companies (2011)
Net Sales
2011
($ millions)
Market
Share
Meat, meat products and sub products 57 1,086.7 16.5%
Fish and other processed aquatic products 70 938.5 14.2%
Fruits and vegetables products 60 239.6 3.6%
Animal and vegetable oils 29 925.9 14.0%
Dairy products 78 490.7 7.4%
Milling products Starch and starch products 48 229.6 3.5%
Foodstuffs various 193 1,522.3 23.1%
Beverages 106 1,158.8 17.6%
TOTAL 641 6,592.02 100.0% Source: Superintendencia de Compañías.
Ecuador’s food processing sector is one of the most successful components of the national economy.
The sector is benefitting from stable, consistent demand for its products.
Table 6: Profiles of Major Food Processing Companies ($ millions)
Company Imports
2014
Sales
($
millions)
End-Use
Channels
Production
Location
Procurement
Channels
CORPORACIÓN
FAVORITA (Meat, bakery goods)
Specialized food
ingredients and
processed food
1,868.9
(total retail
sales)
Retail and
HRI
Pichincha (33)
Guayas (23)
Azuay (4)
Loja (1)
Tungurahua
(3)
Imbabura (3)
Manabí (7)
Esmeraldas (4)
Sto. Domingo
(2)
Cotopaxi (3)
Los Ríos (2)
Chimborazo
(2)
Cañar (1)
El Oro (5)
Direct
PRONACA (Meats and poultry, prepared
fruit and vegetables, prepared
animal food, dry goods,
prepared meals)
Grains, live
animals, soybean
meal,
condiments
940.9 Retail and
HRI
Ecuador (3)
Brazil (1)
Colombia (1)
Direct
NESTLE ECUADOR (Dairy products, baked goods,
confectionary, snack food, dry
Specialized food
ingredients
513.67 Retail and
HRI
Ecuador (1)
Chile (6)
Colombia (3)
Direct
Page 7
goods, prepared meals) Venezuela (2)
LA FABRIL (Oilseed
products)
Bean raw oil,
sunflower oil,
fragrances,
Flavors and
antioxidants
455.8 Retail and
HRI
Ecuador (1) Wholesaler;
Direct
ARCA Ecuador (Beverages) Syrup 504.4 Retail and
HRI
Ecuador (2) Direct
COMPAÑIA DE
CERVEZAS NACIONALES (Beer)
Starch, Barley,
glucose syrup
489.4 Retail and
HRI
Ecuador (2) Importers; Direct
NEGOCIOS
INDUSTRIALES REAL
NIRSA (Fish, prepared meals, dry
goods)
Specialized food
ingredients
405.7 Retail Ecuador (1) Direct, Broker
THE TESALIA SPRING
COMPANY (Beverages)
Specialized food
ingredients
255.5 Retail and
HRI
Ecuador (1) Direct
DANEC (Oilseed products)
Animal fat,
vegetable oil,
corn oil, catalyst
248.5 Retail Ecuador (1) Direct
INDUSTRIAS ALES (Oilseed products)
Specialized food
ingredients
205.40 Retail Ecuador (1) Wholesaler;
Direct
UNILEVER ANDINA
ECUADOR (Oilseed products, ice creams)
Animal fat,
vegetable oil,
corn oil,
Specialized food
ingredients
297.7 Retail and
HRI
Ecuador (1) Direct
SOCIEDAD AGRICOLA E
INDUSTRIAL SAN
CARLOS (Sugar)
Specialized food
ingredients
133.6 Retail Ecuador (1) Wholesaler;
Direct
COMPANIA AZUCARERA
VALDEZ (Sugar)
Specialized food
ingredients
142.1 Retail Ecuador (1) Wholesaler;
Direct
ECUDOS (Sugar)
Specialized food
ingredients
76.1 Retail Ecuador (1) Direct
ECUAJUGOS (Non-alcoholic
beverages)
Specialized food
ingredients
121.1 Retail and
HRI
Ecuador (1) Direct
INDUSTRIAS LACTEAS
TONI (dairy products)
Specialized food
ingredients
167 Retail Ecuador (1) Wholesaler;
Direct
MODERNA ALIMENTOS (Baked goods)
Wheat,
Specialized food
ingredients, Oats
138.1 Retail and
HRI
Ecuador (4) Wholesaler;
Direct
CORPORACION
SUPERIOR
(Baked goods)
Wheat,
Specialized food
ingredients, Oats
110.8 Retail and
HRI
Ecuador (3) Wholesaler;
Direct
INDUSTRIAL SURINDU (Baked goods, confectionary)
Molasses 74.54 Retail and
HRI
Ecuador (1) Direct
INDUSTRIAL MOLINERA (Dry goods: powdered wheat,
oats)
Wheat, Oats 79.3 Retail Ecuador (2) Direct
QUALA ECUADOR Specialized food 73.5 Retail and Ecuador (1) Direct
Page 8
(Beverages, dairy, snacks and
cereals, grocery)
ingredients and
food
commodities
HRI Colombia (1)
CONFITECA (Confectionary
products)
(Sugar, gums,
essence)
64.2 Retail Ecuador (1)
Colombia (1)
Peru (1)
Direct, broker
MONDELIZE -KRAFT
FOODS ECUADOR (Beverages, cheese and dairy,
convenient meals, snacks and
cereals, grocery)
Specialized food
ingredients and
food
commodities
90.4 Retail and
HRI
Ecuador (1)
Peru (1)
Colombia (1)
Venezuela (2)
Direct
PASTEURIZADORA
QUITO
(dairy products)
Specialized food
ingredients
68.5 Retail Ecuador (1) Wholesaler;
Direct
TIOSA (Baked goods) Specialized food
ingredients and
food
commodities
66.1 Retail and
HRI
Ecuador (1) Direct
Source: FAS Quito office research.
SUPERMARKET CHAINS: Supermarket chains sell imported food products targeting middle- and
high-income consumers. FAS Quito recommends that exporters of U.S. food ingredients contact large
importers, wholesalers/distributors or supermarkets directly. Based on store sales, the main supermarket
chains in Ecuador, representing approximately 60 percent of the sector, are La Favorita (SuperMaxi),
and El Rosado (Mi Comisariato). Tiendas Industriales Asociadas, Mega Santa Maria, and
Supermercados Coral are fast growing medium-sized supermarket chains.
Major food importers/distributors supply all major supermarket chains and provincial retailers. Major
supermarket chains will usually request product exclusivity from new-to-market suppliers. Suppliers to
major supermarkets have a wide range of distribution channels. The negotiating power of major
supermarkets towards food suppliers is disproportionate. The major supermarket chains prefer to
import expensive high-end products directly in order to earn higher profit margins.
D. Sector Trends
Ecuador’s food and beverage sector has achieved a high degree of industrialization and technical
sophistication among the larger processors. However, small processors’ operations rely primarily on
less efficient traditional production methods. Spurring the sector’s growth is increased acceptance and
consumption of processed food products, which are now a well establish part of the national food
culture.
Exchange rate fluctuations between the U.S. dollar and neighboring Latin American currencies often
results in food processing ingredients being sourced by Ecuadorian importers from more affordable
origins such as Colombia, Chile, and Mexico. Best product prospects include processed sugar,
concentrated ingredients flavors, juice concentrates and mixtures, colorants, cereals, meats, flours, and
food extracts.
FAS Quito recommends an Ecuador sales strategy that includes targeting food manufacturers with
diversified product lines. One leading food manufacturer alone maintains a portfolio of over 800
Page 9
products and 26 brands. We understand that the main processed food products in the Ecuadorian market
are pre-cooked or easy to prepare meals; these utilize a high proportion of imported food ingredients and
seasonings.
SECTION III. COMPETITION
U.S. food ingredients face competition from Latin American producers. Exports from neighboring
countries, benefitting from a closer proximity, are often more competitive due to lower shipping costs.
Import tariffs levied on U.S. food ingredients are higher than those charged against neighboring
countries’ products that benefit from free trade agreements.
Table 7: Competitive Situation Facing U.S. Suppliers
Product Category Major Import
Supply Sources
in 2014
Strengths of Key
Supply Countries
Advantages and
Disadvantages of Local
Suppliers
Seafood
Kiribati: 5%
Micronesia: 3%
Peru: 3.5%
Peru is the major supplier
of sea products in South
America.
Ecuador is a major Latin American
tuna fish producer.
Non-alcoholic beverages
Mexico: 25%
Colombia: 21%
Germany: 18%
Colombian products are
more price competitive.
Growing product diversification.
Beer
Colombia: 31%
Mexico: 25%
Netherlands: 16%
Mexico offers a wide
variety of beer products at
competitive prices.
There is a growing trend to buy
local brands.
Oil seed products
United States: 36%
Netherlands: 9%
Brazil: 8%
Suppliers are benefitting
from high international
commodity prices.
National production is low.
Sugars and sugar
confectionery
Colombia: 63%
China: 9%
Peru: 7%
Colombian sugar meets
quality certifications and
is tariff exempt.
Domestic production is less
competitive than imported product.
Dairy products
Chile: 54%
Peru: 13%
Brazil: 12%
Suppliers offer a number
of products not produced
within Ecuador.
Domestic production is protected
by the government.
Baked goods
Colombia: 44%
Peru: 41%
United States: 8%
Main suppliers offer
competitive prices.
International product
manufacturers are ready present in
the market.
Milling products
Argentina: 45%
Chile: 23%
Colombia: 11%
Andean Community
member, Colombia is
tariff exempt.
A local oligopoly controls pricing.
Meat
Chile: 38%
United States: 34%
Canada: 21%
Main suppliers provide
advance sanitary
certifications.
Quality concerns with informal
sector production.
Prepared fruit and vegetables
Chile: 45%
Peru: 12%
United States: 8%
Chilean products are high
price competitive.
Year round domestic production is
limited by lack of technology.
Page 10
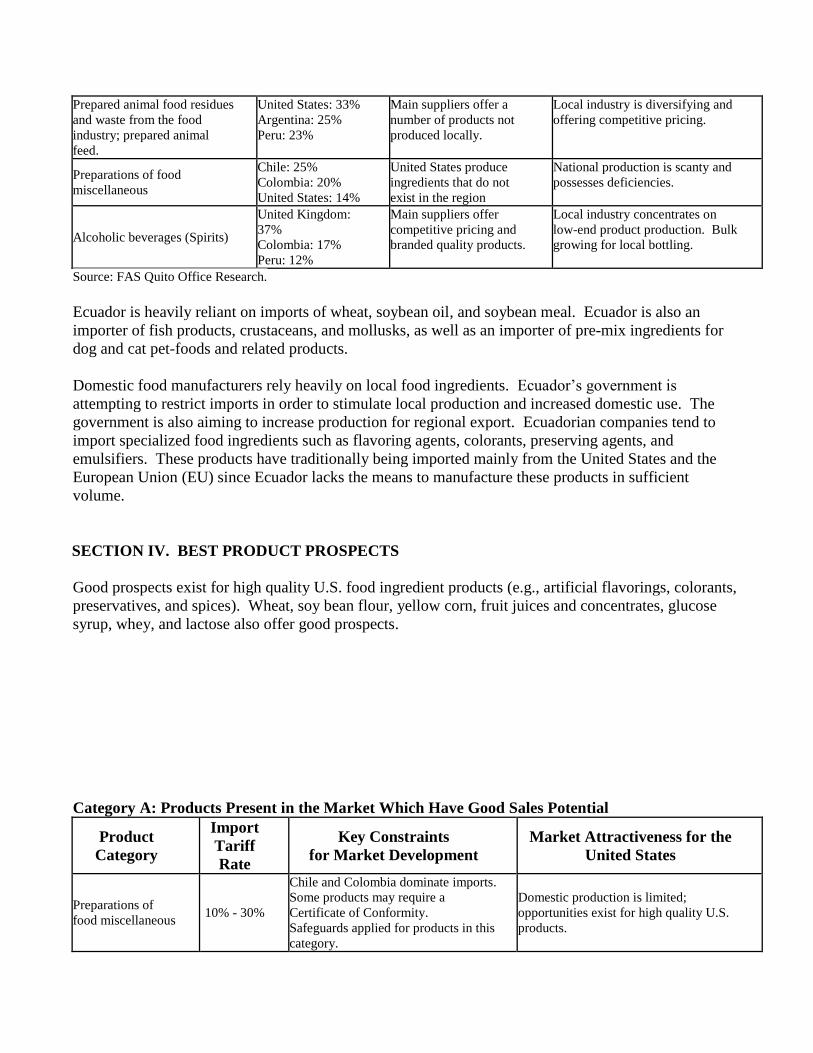
Prepared animal food residues
and waste from the food
industry; prepared animal
feed.
United States: 33%
Argentina: 25%
Peru: 23%
Main suppliers offer a
number of products not
produced locally.
Local industry is diversifying and
offering competitive pricing.
Preparations of food
miscellaneous
Chile: 25%
Colombia: 20%
United States: 14%
United States produce
ingredients that do not
exist in the region
National production is scanty and
possesses deficiencies.
Alcoholic beverages (Spirits)
United Kingdom:
37%
Colombia: 17%
Peru: 12%
Main suppliers offer
competitive pricing and
branded quality products.
Local industry concentrates on
low-end product production. Bulk
growing for local bottling.
Source: FAS Quito Office Research.
Ecuador is heavily reliant on imports of wheat, soybean oil, and soybean meal. Ecuador is also an
importer of fish products, crustaceans, and mollusks, as well as an importer of pre-mix ingredients for
dog and cat pet-foods and related products.
Domestic food manufacturers rely heavily on local food ingredients. Ecuador’s government is
attempting to restrict imports in order to stimulate local production and increased domestic use. The
government is also aiming to increase production for regional export. Ecuadorian companies tend to
import specialized food ingredients such as flavoring agents, colorants, preserving agents, and
emulsifiers. These products have traditionally being imported mainly from the United States and the
European Union (EU) since Ecuador lacks the means to manufacture these products in sufficient
volume.
SECTION IV. BEST PRODUCT PROSPECTS
Good prospects exist for high quality U.S. food ingredient products (e.g., artificial flavorings, colorants,
preservatives, and spices). Wheat, soy bean flour, yellow corn, fruit juices and concentrates, glucose
syrup, whey, and lactose also offer good prospects.
Category A: Products Present in the Market Which Have Good Sales Potential
Product
Category
Import
Tariff
Rate
Key Constraints
for Market Development
Market Attractiveness for the
United States
Preparations of
food miscellaneous 10% - 30%
Chile and Colombia dominate imports.
Some products may require a
Certificate of Conformity.
Safeguards applied for products in this
category.
Domestic production is limited;
opportunities exist for high quality U.S.
products.
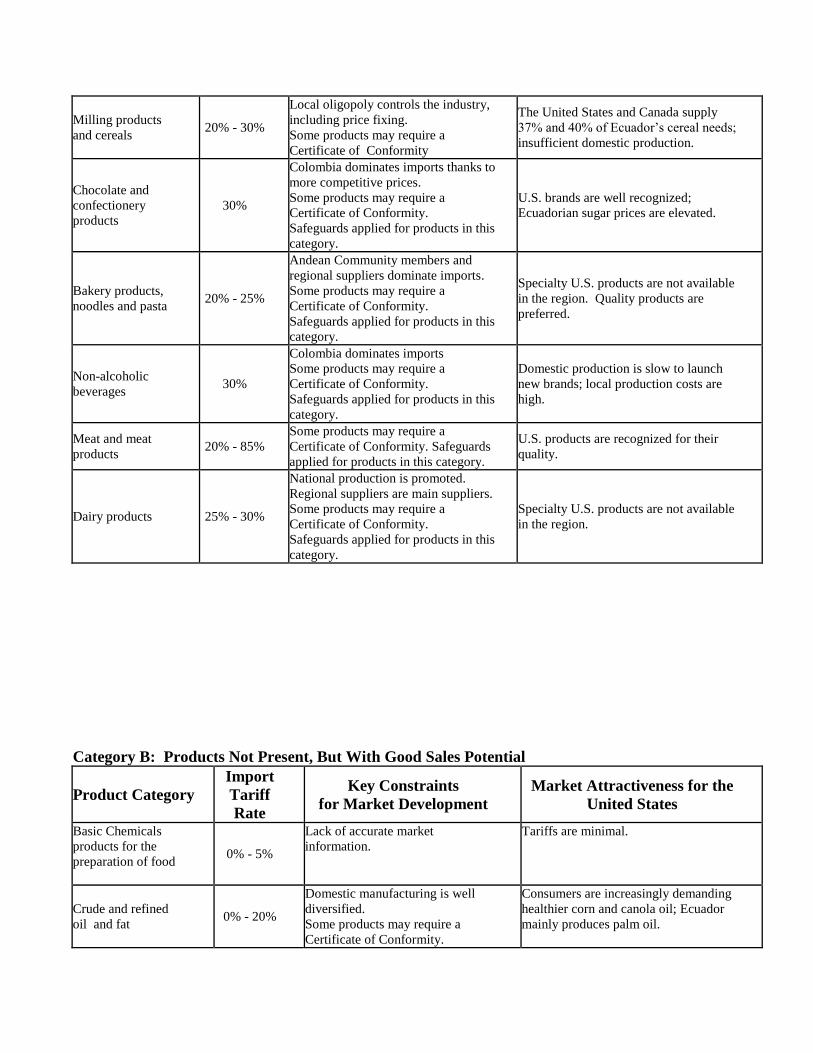
Page 11
Milling products
and cereals 20% - 30%
Local oligopoly controls the industry,
including price fixing.
Some products may require a
Certificate of Conformity
The United States and Canada supply
37% and 40% of Ecuador’s cereal needs;
insufficient domestic production.
Chocolate and
confectionery
products
30%
Colombia dominates imports thanks to
more competitive prices.
Some products may require a
Certificate of Conformity.
Safeguards applied for products in this
category.
U.S. brands are well recognized;
Ecuadorian sugar prices are elevated.
Bakery products,
noodles and pasta 20% - 25%
Andean Community members and
regional suppliers dominate imports.
Some products may require a
Certificate of Conformity.
Safeguards applied for products in this
category.
Specialty U.S. products are not available
in the region. Quality products are
preferred.
Non-alcoholic
beverages 30%
Colombia dominates imports
Some products may require a
Certificate of Conformity.
Safeguards applied for products in this
category.
Domestic production is slow to launch
new brands; local production costs are
high.
Meat and meat
products 20% - 85%
Some products may require a
Certificate of Conformity. Safeguards
applied for products in this category.
U.S. products are recognized for their
quality.
Dairy products 25% - 30%
National production is promoted.
Regional suppliers are main suppliers.
Some products may require a
Certificate of Conformity.
Safeguards applied for products in this
category.
Specialty U.S. products are not available
in the region.
Category B: Products Not Present, But With Good Sales Potential
Product Category
Import
Tariff
Rate
Key Constraints
for Market Development
Market Attractiveness for the
United States
Basic Chemicals
products for the
preparation of food
0% - 5%
Lack of accurate market
information.
Tariffs are minimal.
Crude and refined
oil and fat 0% - 20%
Domestic manufacturing is well
diversified.
Some products may require a
Certificate of Conformity.
Consumers are increasingly demanding
healthier corn and canola oil; Ecuador
mainly produces palm oil.
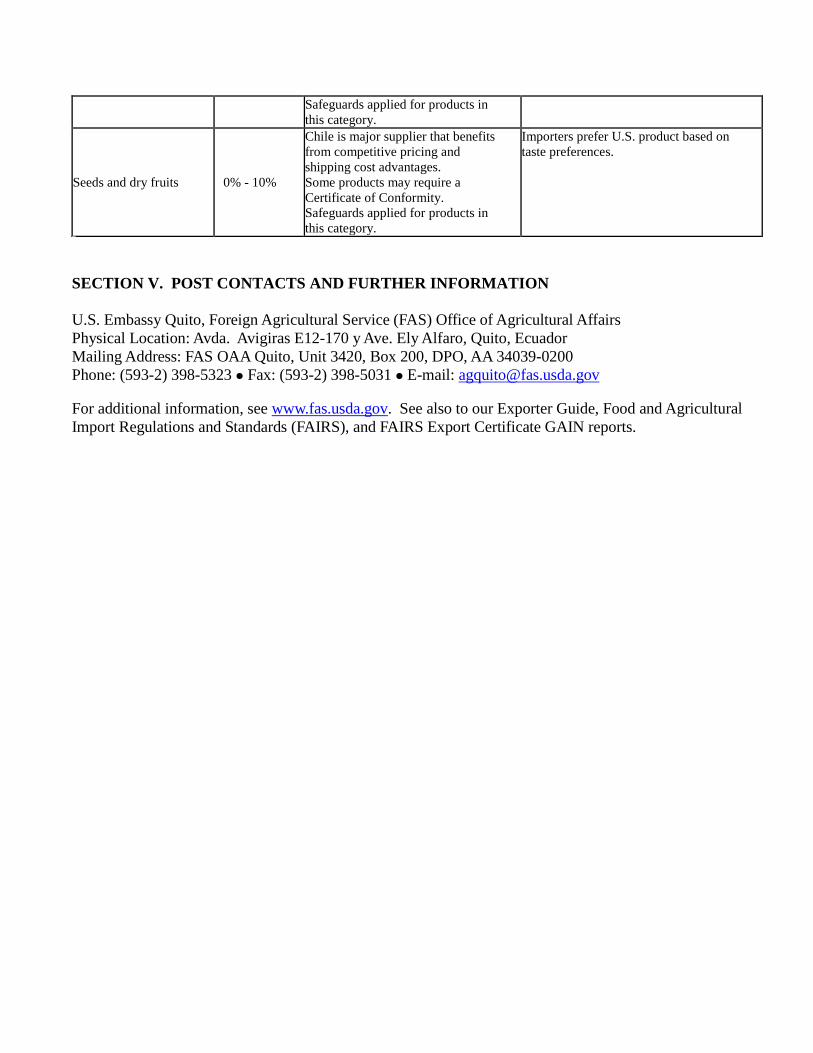
Page 12
Safeguards applied for products in
this category.
Seeds and dry fruits 0% - 10%
Chile is major supplier that benefits
from competitive pricing and
shipping cost advantages.
Some products may require a
Certificate of Conformity.
Safeguards applied for products in
this category.
Importers prefer U.S. product based on
taste preferences.
SECTION V. POST CONTACTS AND FURTHER INFORMATION
U.S. Embassy Quito, Foreign Agricultural Service (FAS) Office of Agricultural Affairs
Physical Location: Avda. Avigiras E12-170 y Ave. Ely Alfaro, Quito, Ecuador
Mailing Address: FAS OAA Quito, Unit 3420, Box 200, DPO, AA 34039-0200
Phone: (593-2) 398-5323 Fax: (593-2) 398-5031 E-mail: [email protected]
For additional information, see www.fas.usda.gov. See also to our Exporter Guide, Food and Agricultural
Import Regulations and Standards (FAIRS), and FAIRS Export Certificate GAIN reports.