24
CORN ANNUAL 2003 FOOD SAFETY IN THE UNITED STATES
CORN ANNUAL 2003
CORN REFINERS ASSOCIATION, INC.1 7 0 1 P E N N S Y L V A N I A A V E N U E , N . W . , S U I T E 9 5 0 W A S H I N G T O N , D C 2 0 0 0 6 - 5 8 0 5
T E L : 2 0 2 3 3 1 - 1 6 3 4 F A X : 2 0 2 3 3 1 - 2 0 5 4 E - M A I L : D E T A I L S @ C O R N . O R G W E B S I T E : H T T P : / / W W W . C O R N . O R G
F O O D S A F E T Y I N T H E U N I T E D S T A T E S

CORN ANNUAL 2003C O N T E N T S
Foreword ..............................................................................................1
Introduction..........................................................................................2
Safety of the U.S. Food Supply a Top Priority for Administration......................................................7
Food Processing: A Critical Element in the Safety of the US Food Supply ............................................11
Ensuring the Integrity of Corn Refined Products ......................15
C O R N I N D U S T R Y S T A T I S T I C S
Shipments of Products of the Corn Refining Industry - 2002 ..........................................................3
Exports of Refined Products From Corn ........................................5
Corn for Grain: Yield and Production..............................................6
Member Company Products ..........................................................10
Corn: Food and Industrial Uses ....................................................13
Corn: Supply and Disappearance ................................................14
World Corn Production, Consumption and Stocks ..................18
US Per Capita Sweetener Deliveries for Food and Beverage Use............................................................................19
Member Companies Domestic and International Plant Locations ................................................20
J. Patrick Mohan, ChairmanTate & Lyle North America, Inc.
Martin L. Andreas, Vice ChairmanArcher Daniels Midland Company
John RiceArcher Daniels Midland Company
Patrick E. BoweCargill, Incorporated
R. Creager SimpsonCargill, Incorporated
Eugene NorthackerCorn Products International, Inc.
Richard M. VandervoortCorn Products International, Inc.
Peter A. SalisNational Starch and Chemical Company
James P. ZallieNational Starch and Chemical Company
Gregory R. KeeleyPenford Products Co.
Michael W. JorgensonRoquette America, Inc.
Katherine G. HolsingerRoquette America, Inc.
D. Lynn GriderA. E. Staley Manufacturing Company
Fred M. AshCerestar USA, Inc.
C. G. CaldwellNational Starch and Chemical Company
Paul E. GrunderCPC International Inc.
Patric J. McLaughlinCerestar USA, Inc.
E. S. MicekCargill, Incorporated
G. M. MitchellCargill Trustees
Donald E. NordlundA. E. Staley Manufacturing Company
William H. PowellNational Starch and Chemical Company
Robert M. PowersA. E. Staley Manufacturing Company
Paul E. RamstadAmerican MaizeProducts Company
H. T. ReedPenford Products Co.
John G. Reed, Jr.Archer Daniels Midland Company
Samuel C. ScottCorn Products International, Inc.
Michael A. UrbanicCargill, Incorporated
Board of Directors
Honorary Directors
CRA StaffAudrae Erickson
President
Jennifer Snyder Senior Director of Regulatory
& Technical Affairs
Curt Mercadante Director of Communications
Sherri Lehman Director of Congressional Affairs
Melanie O’Donnell Manager of Technical Affairs
Lea Ann Elliott,Office Manager
Jo Ann Hoggard,Executive Assistant
Shannon ShoesmithCorn Annual Editor
Design: Xanthus Design
Photography: Gregory Thorp

1C O R N A N N U A L 2 0 0 3
From the development of enhanced safety procedures to the discovery of new foodthreats, these issues have been a major focus of the Corn Refiners Association, Inc.(CRA) and the entire food supply chain. In this edition of the Corn Annual, we look at thesafety of the US food supply from several different points of view including regulators, food processors and corn refiners.
CRA is honored to feature an insightful overview by Secretary of Agriculture AnnVeneman that highlights the resources available to assure a dependable food safetysystem, and how they translate into market opportunities abroad. Thanks to thecoordinated efforts of the Bush Administration and industry, the US has a strong abilityto detect and determine the risk of contamination, regardless of whether it is intentionalor unintentional.
Cooperation between the food industry and government to enhance the safety of theU.S. food supply is critical. National Food Processors Association President and CEOJohn R. Cady discusses the importance of this relationship and the role of the foodprocessing industry in ensuring the safety of the foods we consume. An interesting, andvaluable, component of this piece is how the industry approaches food security as thenation’s awareness of potential terrorist threats has increased.
Corn refiners have had many safety features in place for a number of years to ensurethe integrity of industry products. CRA member companies responded to customer andconsumer food safety concerns by developing a series of white papers detailingmeasures the industry has taken to secure the safety of refined corn products. A review of these papers demonstrates the care with which corn refiners approach theissue of food safety.
I would like to take this opportunity to thank all the contributors to the 2003 Corn Annualfor helping us create an informative and interesting publication. Special appreciation isextended to CRA Chairman Pat Mohan for his perceptive observations of the past yearand adept management of the challenges that face the refining industry.
I hope you will find the 2003 Corn Annual a useful source of information about our industry.
Over the past couple of years, food safety has gained
considerable attention.
F O R E W O R D
Audrae EricksonPresident

C O R N A N N U A L 2 0 0 32
All Americans take this for granted and rarely stop to think what is involved or what it would be like to have to worry about the safety of the foods we consume. When considering the vast system that encompasses all aspects of food production, our levelof comfort is an amazing accomplishment.
Bringing corn-based sweeteners and starches to market–just some of the thousands ofingredients used in the US food supply–involves more than 226,000 individuals and eachone has a role in the safety and integrity of the final product. A large portion of those individuals is attributed to corn production. US corn farmers are the most productive andefficient in the world and they are a key component to the integrity of corn refined products. Corn refiners rely on the quality and quantity of US corn to economically produce ingredients that meet strict quality standards. Corn refiners used over 15 percent of the 9 billion bushels of corn produced by US farmers last year and the USDepartment of Agriculture (USDA) predicts the industry will use approximately 1.577 billion bushels of corn in the year ending September 2003, with ethanol accounting fornearly all of the increased bushels.
Overall shipments of corn-based products reported by the industry last year were on parwith 2001. Total exports of products from corn in 2002 were slightly higher than 2001 figures. There was an interesting shift in products being exported including a significantdecline in 55 percent high fructose corn syrup (HFCS 55) exports, due to the trade impassewith Mexico, and exports of partially refined corn oil. These declines were countered byincreases in crude corn oil (suggesting that more importing countries are further refiningthe oil at domestic facilities), corn meal and co-products. Nearly 6.5 million metric tons ofproducts produced from corn, worth $1.2 billion, were exported in 2002.
CONSOLIDATIONThe industry experienced some consolidation during 2002. Cargill, Incorporated acquiredCerestar and Archer Daniels Midland acquired Minnesota Corn Processors, leaving theindustry with eight competitors.
INTERNATIONAL TRADEThe corn wet milling industry supports the current round of global talks in agriculturaltrade and the vigor with which the Bush Administration is pursuing bilateral and regionaltrade agreements. Increased market access of US agricultural products into foreign markets throughout the world will improve the bottom lines of every aspect of our sector.However, resolution of the sweetener dispute with Mexico remains our top trade priority.
Despite the North American Free Trade Agreement’s (NAFTA) promise of unfetteredaccess for HFCS into Mexico, the dispute over that access to the Mexican sweetenermarket has been a trade restricting factor since 1997. The impact of Mexico’s protec-tionist actions became more severe in 2002 with the imposition of a tax on soft drinkssweetened with HFCS. US exports of HFCS to Mexico have been shut down sinceJanuary 2002. No other major US agricultural or non-agricultural exporting industry has
The United States has one of the safest food supplies in the world.
I N T R O D U C T I O N
J. Patrick MohanChairman
President, Support Services Tate & Lyle North America, Inc.
3C O R N A N N U A L 2 0 0 3
Starch Products (includes corn starch, modified starch and dextrins) 5,991,349,000
Refinery Products (includes glucose syrup, high fructose syrup, dextrose, corn syrup solids, maltodextrins) 33,074,166,000
High fructose corn syrup – 42% 10,203,802,000
High fructose corn syrup – 55%+ 14,015,675,000
Total HFCS 24,219,477,000
Total - Domestic Basic Products 39,065,515,000
Total - Export Basic Products 1,226,629,000
Corn Oil (crude and refined) 1,210,582,000
Corn Gluten Feed and Corn Oil Meal 10,066,242,000
Corn Gluten Meal 2,700,664,000
Steepwater 1,244,488,000
TOTAL SHIPMENTS 55,514,120,000
Compiled for the Corn Refiners Association, Inc., by VERIS Consulting, LLC. Statistics represent shipments by members of theassociation. Shipments are in pounds, commercial weights, and do not include co-products derived from ethanol production.
had its top export market closed for this period of time. Our industry has idled capac-ity, lost jobs and experienced significant losses in profitability. The impact of thesweetener dispute filters through all industries associated with corn refining. Withan estimated market potential of 2.0 million metric tons of HFCS exports to Mexico,US corn producers have lost market opportunities for more than 133 million bushelsof corn, or more than 945 thousand acres of corn production annually. Sweetenerconsuming industries have been significantly harmed due to a loss of price compe-tition in the marketplace. The coordinated efforts of the Corn Refiners Association,Inc. (CRA), National Corn Growers Association (NCGA), US Grains Council (USGC)and other organizations that represent apples, dry edible beans, pork, poultry andrice brought the sweetener dispute to the attention of many US lawmakers. Whilesignificant congressional support has been developed for reaching an agreementthat will open the Mexican market to US HFCS exports, a negotiated solution to thedispute does not appear to be close at hand.
Despite the closure of the Mexican market to our HFCS exports, CRA continues tosupport trade negotiations, in particular the on-going negotiations on agriculture inthe World Trade Organization (WTO). With numerous processing plants in all regionsof the world, our industry faces trade barriers on a global level. The outcome of thenegotiations will impact the competitiveness and profitability of US investment bothdomestically and internationally. CRA strongly supports the US WTO agriculturenegotiating proposal calling for significant increases in market access, elimination ofexport subsidies and reductions in global domestic support programs. CRA continuesto lead the efforts of the AgTrade Coalition in supporting the US proposal designed tolevel the playing field for US agrcultural producers and agribusiness.
BIOTECHNOLOGYUS farmers have expressed their vote of confidence in the science behind cropbiotechnology by planting increased acreage of biotech varieties over the past several years. USDA reported that 34 percent of the 2002 corn crop was planted tobiotech varieties. CRA recognizes the value of crop biotechnology and participates inthe Alliance for Better Foods to disseminate factual information about its benefits.
SHIPMENTS OF PRODUCTS OF THE CORN REFINING INDUSTRY – 2002
I N T R O D U C T I O N

C O R N A N N U A L 2 0 0 34
At the same time, the corn refining industry must respect the regulations and controlsunder which our international customers must operate and provide our customers theproducts they need and want.
The EU has been working on new regulations since July 2001 on traceability and labeling of foods derived from biotechnology, which could be completed by early 2004.CRA opposes the EU biotech proposals and organized a unified food and agriculturecoalition effort to inform European and US government officials of their negative impacton trade if implemented. CRA participates in the AgBiotech Planning Committee and theCSC (corn, soybean, cotton) Biotechnology Committee to monitor and comment ondevelopment of rules on a national and international level.
BIOTERRORISM The corn refining industry has always taken a proactive approach to plant security and product integrity, but these practices have become increasingly important since theterrorist attacks of 2001 and more recent threats against the nation. A safe food supplyis an integral part of the nation’s security system. Last summer, President Bush signedlegislation aimed at both prevention of and preparedness for bioterrorism attacks thatrequires promulgation of regulations on the registration of food and animal feed facilitiesand prior notice of imported food shipments by the end of this year, as well as regulationsfor the establishment and maintenance of records and product detention. CRA participates in the Alliance for Food Security as part of our efforts to maintain a safe foodsupply and comply with government guidance and regulations.
OBESITYSweeteners and starch products in the American diet are gaining attention in the fightagainst obesity as fat is no longer the target in the “good food, bad food” debate. CRAsupports science-based solutions that address the fundamental need to improve thenutritional intake in our diets, encourage a balanced diet and moderate consumption ofall foods and beverages and support increased physical activity. CRA opposes any banon foods in schools or other public places. Learning balance and moderation in eatinghabits is not accomplished through elimination of choices, but through education.Through the American Council for Fitness and Nutrition (AFCN), CRA is working with ournation’s leaders, school officials and concerned parents to derive the best possible solu-tions for addressing this important health issue. CRA is also working with the NationalSoft Drink Association (NSDA) and NCGA to ensure that soft drinks are not specificallytargeted in the reauthorization of the school lunch program now under discussion.
ENVIRONMENTCorn refiners have been long-time proponents of environmental responsibility throughdevelopment of environmentally sound products, energy efficient technologies and compliance with environmental regulations. Our industry has long led the developmentof renewable fuels to help mitigate our nation’s energy dependency during times of global conflict and provide a cleaner, and abundantly renewable, source of energy for our nation’s future.
As part of the industry’s efforts to improve energy performance, CRA is participating inEnergy Star®. Energy Star is a voluntary program sponsored by the EnvironmentalProtection Agency (EPA) and the Department of Energy (DOE) that enables organizationsof all types to achieve their best energy performance and reduce emissions of carbondioxide and other pollutants from fossil fuel combustion. CRA is actively engaged withEPA to develop regulations that maintain environmental responsibility while promoting
I N T R O D U C T I O N

PRODUCT 2002 UNITS VALUE
Corn Meal 159,427,448 Kilograms $41,482,516
Corn Starch 104,104,615 Kilograms $39,848,007
Corn Oil, Crude 309,609,674 Kilograms $155,932,293
Corn Oil, Once Refined 2,341,261 Kilograms $2,286,129
Corn Oil, Fully Refined 221,316,442 Kilograms $127,163,880
Glucose (Dextrose) 75,093,624 Kilograms $32,019,051
Glucose Syrup not containing fructose or containing in the dry state less than 20% Fructose 148,404,923 Kilograms $49,376,500
Glucose Syrup with 20-50% Fructose 22,393,791 Kilograms $6,611,605
Chemically Pure Fructose 41,713,806 Kilograms $28,013,563
Fructose Syrup with 50%+ Fructose 79,186,429 Kilograms $28,050,643
Fructose Solids containing more than 50% Fructose 16,464,664 Kilograms $28,003,082
Bran, Sharps and other Residues 123,573 Metric Tons $11,156,515
Corn Gluten Feed 4,209,700 Metric Tons $314,219,703
Corn Gluten Meal 810,994 Metric Tons $240,459,590
Other Residues of Starch Manufacturing 13,739 Metric Tons $1,947,455
Corn Oil Cake 8,480,505 Kilograms $781,314
Dextrins 14,149,146 Kilograms $10,515,940
Modified Starches Derived from Corn Starch 85,321,988 Kilograms $59,781,954
Source: US Department of Commerce
E X P O R T S O F R E F I N E D P R O D U C T S F R O M C O R N
5C O R N A N N U A L 2 0 0 3
I N T R O D U C T I O N
sound economic and industrial growth. Last year, these effortsfocused on New Source Performance Standards, Commercialand Industrial Solid Waste Incinerators, Total Maximum DailyLoad provisions of the Clean Water Act, the Agency’s HighProduction Volume (HPV) Chemical Challenge Program and thedioxin reassessment.
CORN UTILIZATION AND TECHNOLOGY CONFERENCE Last summer, CRA and NCGA jointly sponsored the third CornUtilization & Technology Conference (CUTC), which focused onsustaining the environment through research, production andrefinement. Researchers and industry professionals from 12nations joined nearly 500 attendees to discuss developments inbiotechnology, supply management, resource conservation,operations technologies and new and developing uses for corn.
THE ASSOCIATIONLast year, CRA gained an important asset toward ensuring thesuccess of the industry’s future when Audrae Erickson becamethe Association’s new president. The Association has alreadyfelt the benefits of Audrae’s expertise in agricultural tradeissues and proven leadership abilities. She takes the reins during a time when our industry faces several difficult challenges. We look forward to her leadership in guiding theAssociation toward an even more productive future. CR A

C O R N A N N U A L 2 0 0 36
2000 2001 2002 2000 2001 2002 2000 2001 2002
AL 165 150 180 65.0 107.0 88.0 10,725 16,050 15,840
AZ 33 28 28 196.0 208.0 185.0 6,468 5,824 5,180
AR 175 185 260 130.0 145.0 134.0 22,750 26,825 34,840
CA 205 160 150 170.0 170.0 170.0 34,850 27,200 25,500
CO 1,150 1,070 720 126.0 140.0 156.0 144,900 149,800 112,320
DE 155 162 167 162.0 146.0 83.0 25,110 23,652 13,861
FL 25 26 34 75.0 87.0 96.0 1,875 2,262 3,264
GA 240 220 290 107.0 134.0 115.0 25,680 29,480 33,350
ID 57 45 50 160.0 150.0 160.0 9,120 6,750 8,000
IL 11,050 10,850 11,000 151.0 152.0 136.0 1,668,550 1,649,200 1,496,000
IN 5,550 5,670 5,220 146.0 156.0 121.0 810,300 884,520 631,620
IA 12,000 11,400 11,900 144.0 146.0 165.0 1,728,000 1,664,400 1,963,500
KS 3,170 3,050 2,500 130.0 127.0 116.0 412,100 387,350 290,000
KY 1,230 1,100 1,040 130.0 142.0 102.0 159,900 156,200 106,080
LA 370 307 560 116.0 148.0 122.0 42,920 45,436 68,320
MD 405 410 425 155.0 136.0 76.0 62,775 55,760 32,300
MI 1,950 1,900 2,020 124.0 105.0 115.0 241,800 199,500 232,300
MN 6,650 6,200 6,700 145.0 130.0 157.0 964,250 806,000 1,051,900
MS 365 385 530 100.0 130.0 125.0 36,500 50,050 66,250
MO 2,770 2,600 2,700 143.0 133.0 105.0 396,110 345,800 283,500
MT 16 13 13 140.0 148.0 140.0 2,240 1,924 1,820
NE 8,050 7,750 7,350 126.0 147.0 128.0 1,014,300 1,139,250 940,800
NJ 75 66 70 134.0 112.0 58.0 10,050 7,392 4,060
NM 66 46 49 160.0 180.0 180.0 10,560 8,280 8,820
NY 450 540 450 98.0 105.0 97.0 44,100 56,700 43,650
NC 640 625 700 116.0 125.0 83.0 74,240 78,125 58,100
ND 930 705 995 112.0 115.0 115.0 104,160 81,075 114,425
OH 3,300 3,170 2,870 147.0 138.0 88.0 485,100 437,460 252,560
OK 240 210 190 140.0 125.0 130.0 33,600 26,250 24,700
OR 27 18 27 180.0 140.0 115.0 4,860 2,520 3,105
PA 1,080 990 870 127.0 98.0 68.0 137,160 97,020 59,160
SC 280 240 260 65.0 108.0 46.0 18,200 25,920 11,960
SD 3,800 3,400 3,200 112.0 109.0 95.0 425,600 370,600 304,000
TN 580 620 620 114.0 132.0 107.0 66,120 81,840 66,340
TX 1,900 1,420 1,820 124.0 118.0 113.0 235,600 167,560 205,660
UT 18 15 14 144.0 142.0 145.0 2,592 2,130 2,030
VA 330 330 305 146.0 123.0 66.0 48,180 40,590 20,130
WA 100 55 70 185.0 190.0 190.0 18,500 10,450 13,300
WV 35 26 30 130.0 120.0 105.0 4,550 3,120 3,150
WI 2,750 2,600 2,900 132.0 127.0 135.0 363,000 330,200 391,500
WY 58 51 36 132.0 125.0 124.0 7,656 6,375 4,464
US 72,440 68,808 69,313 136.9 138.2 130.0 9,915,051 9,506,840 9,007,659
CT, ME, MA, NV, NH, RI, VT Not estimated. Source: USDA – National Agricultural Statistics Service
C O R N F O R G R A I N : Y I E L D A N D P R O D U C T I O N
STATE AREA HARVESTED [Thousand Acres] YIELD [Bushel Per Acres] PRODUCTION [Thousand Bushels]
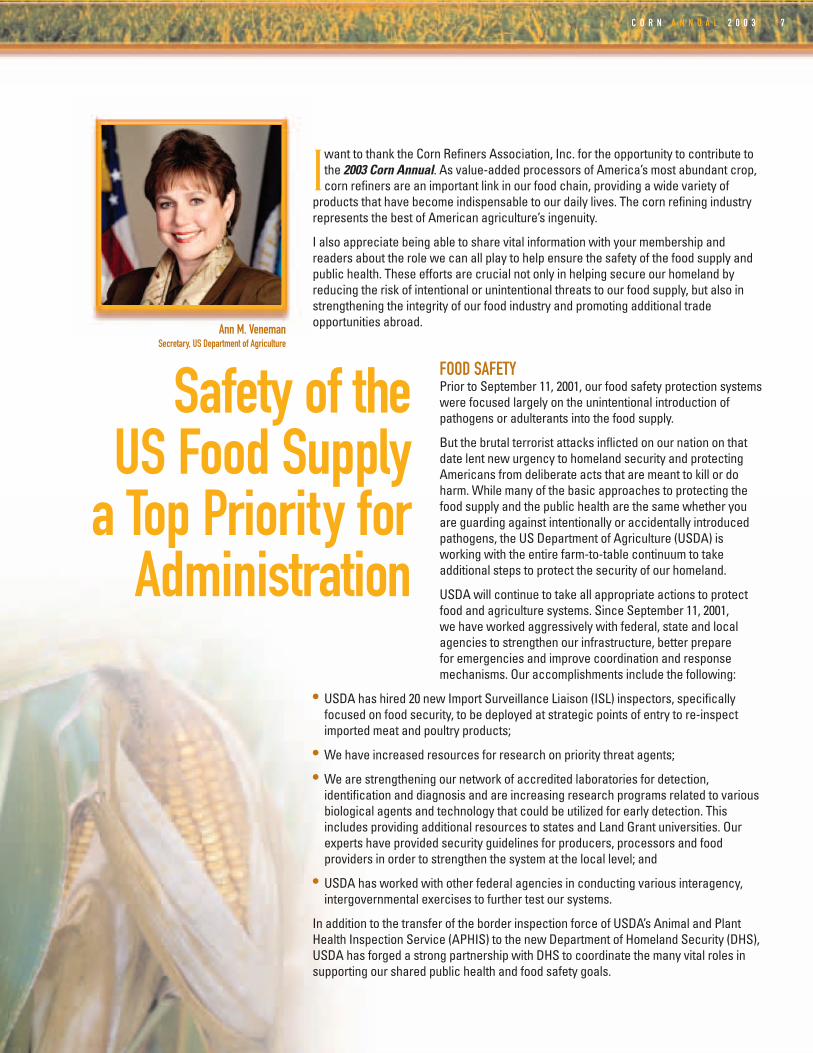
Iwant to thank the Corn Refiners Association, Inc. for the opportunity to contribute tothe 2003 Corn Annual. As value-added processors of America’s most abundant crop,corn refiners are an important link in our food chain, providing a wide variety of
products that have become indispensable to our daily lives. The corn refining industryrepresents the best of American agriculture’s ingenuity.
I also appreciate being able to share vital information with your membership andreaders about the role we can all play to help ensure the safety of the food supply andpublic health. These efforts are crucial not only in helping secure our homeland byreducing the risk of intentional or unintentional threats to our food supply, but also instrengthening the integrity of our food industry and promoting additional tradeopportunities abroad.
FOOD SAFETYPrior to September 11, 2001, our food safety protection systemswere focused largely on the unintentional introduction ofpathogens or adulterants into the food supply.
But the brutal terrorist attacks inflicted on our nation on thatdate lent new urgency to homeland security and protectingAmericans from deliberate acts that are meant to kill or doharm. While many of the basic approaches to protecting thefood supply and the public health are the same whether youare guarding against intentionally or accidentally introducedpathogens, the US Department of Agriculture (USDA) isworking with the entire farm-to-table continuum to takeadditional steps to protect the security of our homeland.
USDA will continue to take all appropriate actions to protectfood and agriculture systems. Since September 11, 2001, we have worked aggressively with federal, state and localagencies to strengthen our infrastructure, better prepare for emergencies and improve coordination and responsemechanisms. Our accomplishments include the following:
• USDA has hired 20 new Import Surveillance Liaison (ISL) inspectors, specificallyfocused on food security, to be deployed at strategic points of entry to re-inspectimported meat and poultry products;
• We have increased resources for research on priority threat agents;
• We are strengthening our network of accredited laboratories for detection,identification and diagnosis and are increasing research programs related to variousbiological agents and technology that could be utilized for early detection. Thisincludes providing additional resources to states and Land Grant universities. Ourexperts have provided security guidelines for producers, processors and foodproviders in order to strengthen the system at the local level; and
• USDA has worked with other federal agencies in conducting various interagency,intergovernmental exercises to further test our systems.
In addition to the transfer of the border inspection force of USDA’s Animal and PlantHealth Inspection Service (APHIS) to the new Department of Homeland Security (DHS),USDA has forged a strong partnership with DHS to coordinate the many vital roles insupporting our shared public health and food safety goals.
Safety of the US Food Supply
a Top Priority forAdministration
7C O R N A N N U A L 2 0 0 3
Ann M. VenemanSecretary, US Department of Agriculture
C O R N A N N U A L 2 0 0 38
SAFETY OF THE US FOOD SUPPLY A TOP PR IOR ITY FOR ADMIN ISTRAT ION
At various times of increased threat of terrorism DHS, in consultation with theHomeland Security Council, has raised the nation’s threat-advisory status to a higherstate of alert. During such times, USDA has taken aggressive steps to assure thatemployees and representatives throughout the food and agriculture chain are alertedand aware of the need for extra precautions.
We have alerted industry and producer organizations of the threat status and urgedthem to implement additional security measures, and have informed producers aboutbest practices guidelines that they can help implement in their own operations.
Many of the steps industry can take during periods of heightened alert are commonsense, but they bear repeating:
• Be alert and aware of suspicious activities, and report them to law enforcement;
• Update your local emergency telephone numbers, and keep them handy;
• Inspect all vehicles entering your facilities and operations, and increase surveillancearound facilities; and
• Consider restricting public access, such as tours and lectures.
USDA also has taken numerous precautions within our own department and agenciesduring periods of higher threat, such as alerting employees to additional securitymeasures; placing USDA law enforcement officers and agents on alert status;coordinating with law enforcement agencies, military and Coast Guard to protect ourfacilities; and increasing security perimeters and restricting access at our facilities.
While our food supply is the safest, most abundant and most reliable in the world, USDA continually assesses the need for additional steps and remains committed tousing all available resources necessary to protect the food supply.
Thanks to a range of efforts from farm to table, the incidence of all bacterial foodborneillnesses has dropped 23 percent between 1996 and 2002, and those trends continuedownward. But there is more that we all can do.
USDA is working to modernize our inspection systems through our existing authorities,regulations and programs – and exploring the need for new enforcement authoritiesand incentives. We are enhancing our food safety research, developing more risk-based programs, improving accessibility to technology and strengthening ourtraining and education programs.
This Administration has made food safety a top priority. President Bush has proposedand achieved record funding for food safety programs in his first two years in office,with record budget requests again for 2004.
His budget would support a strong inspection workforce of 7,680 inspectors. It wouldenhance research and provide specialized training and education for the inspectionworkforce. And it would increase microbiological testing and sampling, and strengthen foreign surveillance programs.
INTERNATIONAL TRADEConfidence in the integrity of America’s food supply is vital not only to public health,but also to the economic health of our agricultural and food industries domesticallyand in markets abroad.
We must always do all we can to protect our homeland security and public health, butneither the United States nor other countries should take advantage of these mandatesto establish trade barriers under the guise of ensuring the safety of our populations.
Some nations, including those of the European Union, havepursued policies, especially in the area of biotechnology, thatare designed more to protect their domestic markets than tomeet their public health obligations.
USDA continues its efforts to ensure that the health and safety regulations of our trading partners are science-based,transparent and predictable. As we seek to expand andmaintain markets and the confidence of consumersworldwide, we must be constantly attentive to the need toaddress legitimate food safety concerns without erectingunnecessary barriers to trade.
New market opportunities are essential to the future ofagriculture. Consider that our farm sector capacity to producegrows an average 2 percent per year, while aggregate foodconsumption in the United States grows only 0.8 percent peryear. We are expanding capacity much more quickly than ourdomestic use, and we clearly need foreign markets to utilizethat capacity.
Agriculture is a global enterprise, as our overall exportshave grown from 10 percent of all agriculture sales 50 yearsago to 25 percent today. Total agricultural exports for theyear 2003 are forecast to be $57 billion, up from $53 billionthe previous year.
INNOVATIONCorn farmers and refiners have been in the vanguard of innovation and technologies that help create new demandand new markets for their products, while also ensuring theirown competitiveness. For instance, just five years ago wewere using about 500 million bushels of corn for ethanol. Thisyear that number is projected to double to one billion bushels,almost 10 percent of our total corn use.
The Administration continues to strongly support a renewablefuels standard that will create additional opportunities forenvironmentally friendly biofuels. Such a standard will helpreduce our dependence on foreign oil, thereby increasing ournational security, while also improving the environment andthe farm economy.
Last year I visited a biorefinery in Nebraska that uses dextroseto produce textile fibers and plastics. This amazing fabric isnow being commercially produced from corn and has betterdye-holding properties and other characteristics thantraditional synthetic fibers.
New technologies will be central to the agenda at theMinisterial Conference and Expo on Agricultural Science and Technology, which USDA will host June 23 to 25, 2003, in Sacramento.
We are facing enormous challenges of growth in the worldpopulation, along with issues of the sustainability of ourresource base. In the next 50 years, it is projected that the worldpopulation could number as many as 11 billion people, with thefastest growth occurring in the least developed countries.
Technology will play a major role in improving productivity,while also mitigating environmental impacts as we make useof our natural resources.
This Administration’s ongoing efforts to encourage newtechnologies, and to promote homeland security and foodsafety have far-reaching effects that benefit consumers andthe entire food chain. These efforts represent a continuingprocess, not a destination.
I want to commend the Corn Refiners Association for theirsupport of these missions, and for the valuable contributionsthey make every day to American farmers, our economy and our nation as a whole. USDA
9C O R N A N N U A L 2 0 0 3
SAFETY OF THE US FOOD SUPPLY A TOP PR IOR ITY FOR ADMIN ISTRAT ION
C O R N A N N U A L 2 0 0 310
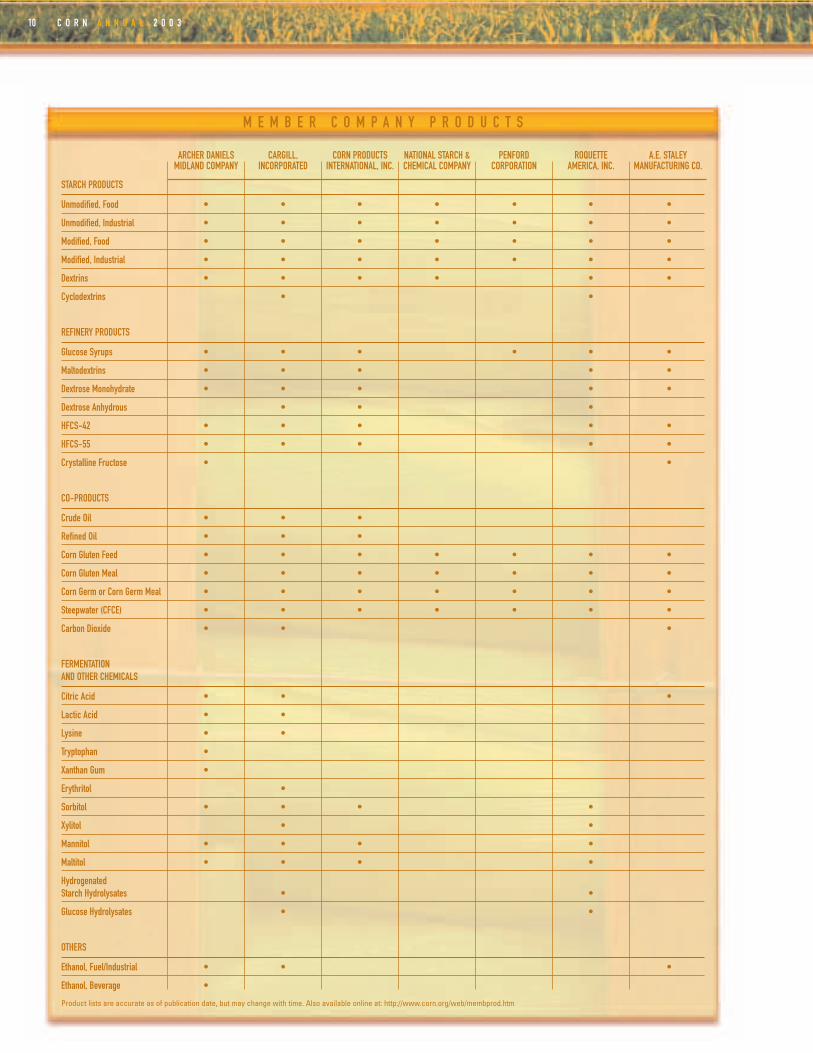
STARCH PRODUCTS
Unmodified, Food • • • • • • •
Unmodified, Industrial • • • • • • •
Modified, Food • • • • • • •
Modified, Industrial • • • • • • •
Dextrins • • • • • •
Cyclodextrins • •
REFINERY PRODUCTS
Glucose Syrups • • • • • •
Maltodextrins • • • • •
Dextrose Monohydrate • • • • •
Dextrose Anhydrous • • •
HFCS-42 • • • • •
HFCS-55 • • • • •
Crystalline Fructose • •
CO-PRODUCTS
Crude Oil • • •
Refined Oil • • •
Corn Gluten Feed • • • • • • •
Corn Gluten Meal • • • • • • •
Corn Germ or Corn Germ Meal • • • • • • •
Steepwater (CFCE) • • • • • • •
Carbon Dioxide • • •
FERMENTATION AND OTHER CHEMICALS
Citric Acid • • •
Lactic Acid • •
Lysine • •
Tryptophan •
Xanthan Gum •
Erythritol •
Sorbitol • • • •
Xylitol • •
Mannitol • • • •
Maltitol • • • •
Hydrogenated Starch Hydrolysates • •
Glucose Hydrolysates • •
OTHERS
Ethanol, Fuel/Industrial • • •
Ethanol, Beverage •
Product lists are accurate as of publication date, but may change with time. Also available online at: http://www.corn.org/web/membprod.htm
ARCHER DANIELSMIDLAND COMPANY
CARGILL,INCORPORATED
CORN PRODUCTSINTERNATIONAL, INC.
NATIONAL STARCH &CHEMICAL COMPANY
PENFORDCORPORATION
ROQUETTE AMERICA, INC.
A.E. STALEYMANUFACTURING CO.
M E M B E R C O M P A N Y P R O D U C T S

11C O R N A N N U A L 2 0 0 3
Food safety is “job one” for the food processing industry – this year and every year.It bears repeating that the first and foremost reason that foods are processed is to enhance their safety. Of course,processed foods offer consumers an enormous variety of food choices, and a range of attributes from better taste toconvenience of preparation. But whether they are frozen,canned, dried, bottled or irradiated, food processing makesand helps keep foods safe. Food processors know that theyare not just in the business of providing appealing, nutritious
and affordable foods to consumers – they also are in the business of providing their customers with safe products.
The results of the food processing industry’s commitment to food safety are clear.American consumers, and consumers of US food products exported around the world, have an extremely high level of confidence in the safety of foods produced in this country.
This outstanding record of food safety didn’t just happen; it reflects the strong cooperative efforts among all stakeholders – growers, suppliers, processors, retailersand government regulatory agencies – to take those measures needed to enhance the safety of the food supply.
THE US FOOD SAFETY SYSTEM: EVOLVING TO MEET THE CHALLENGESOur current food safety system not only works, but works well. This system has evolved successfully to meet new challenges and growing responsibilities. It is noaccident that our nation’s food safety regulatory system has evolved from a single food safety agency in 1907 – the Bureau of Chemistry within the Department of Agriculture – into the system we have today.
There continues to be strong evidence that America’s food safety regulatory system,and the food safety programs utilized by food processors, ensure that the food products that consumers purchase in their neighborhood grocery stores or that aredelivered to their local restaurants are safe. This year, the Centers for Disease Controland Prevention (CDC) reported a decreasing trend across the United States in illnessdue to several common food pathogens.
Industry spends many millions of dollars to ensure the safety of food products, and we continue to look for ways to improve safety where needed. Increasingly, risk assessment is used to better target our food safety resources. Industry is taking a more proactive approach to preventing food safety problems before they occur,through the use of Hazard Analysis Critical Control Point (HACCP) and other food safety systems. Our industry also conducts cutting-edge food safety research and supports consumer education efforts.
Encouragingly, research findings indicate that there have been significant improvements in recent years in food safety-related consumer behaviors. For example, fewer people are eating risky raw foods and more people are washing hands and cutting boards to prevent dangerous cross-contamination between foods.Certainly, stronger food industry efforts to get across science-based information toconsumers on safe food handling, preparation and storage have helped consumers to better understand their role in keeping foods safe.
Food Processing:A Critical Element
in the Safety of theUS Food Supply
John R. CadyPresident and CEO, National Food Processors Association
C O R N A N N U A L 2 0 0 312
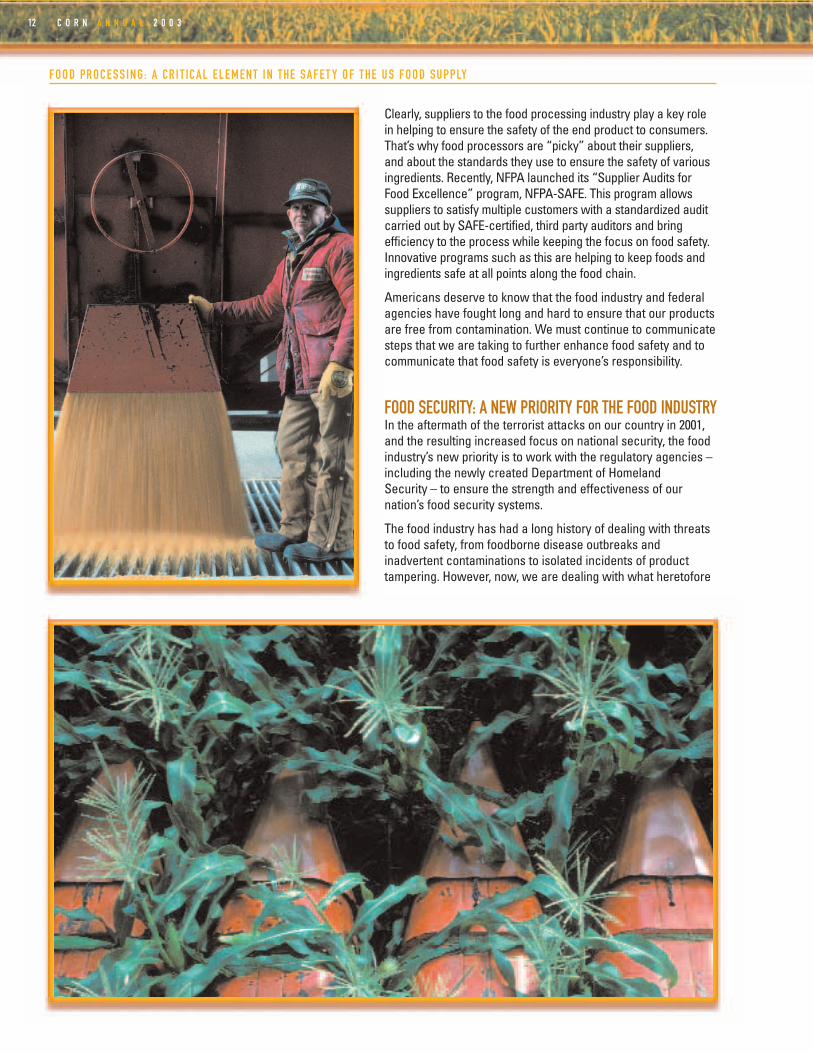
Clearly, suppliers to the food processing industry play a key rolein helping to ensure the safety of the end product to consumers.That’s why food processors are “picky” about their suppliers, and about the standards they use to ensure the safety of variousingredients. Recently, NFPA launched its “Supplier Audits forFood Excellence” program, NFPA-SAFE. This program allowssuppliers to satisfy multiple customers with a standardized auditcarried out by SAFE-certified, third party auditors and bring efficiency to the process while keeping the focus on food safety.Innovative programs such as this are helping to keep foods andingredients safe at all points along the food chain.
Americans deserve to know that the food industry and federalagencies have fought long and hard to ensure that our productsare free from contamination. We must continue to communicatesteps that we are taking to further enhance food safety and tocommunicate that food safety is everyone’s responsibility.
FOOD SECURITY: A NEW PRIORITY FOR THE FOOD INDUSTRYIn the aftermath of the terrorist attacks on our country in 2001,and the resulting increased focus on national security, the foodindustry’s new priority is to work with the regulatory agencies –including the newly created Department of Homeland Security – to ensure the strength and effectiveness of ournation’s food security systems.
The food industry has had a long history of dealing with threatsto food safety, from foodborne disease outbreaks and inadvertent contaminations to isolated incidents of product tampering. However, now, we are dealing with what heretofore
FOOD PROCESS ING : A CR I T ICAL ELEMENT IN THE SAFET Y OF THE US FOOD SUPPLY
13C O R N A N N U A L 2 0 0 3
was unthinkable: the intentional, widespread contamination of the food supply. Hope and complacency are not an option and, in fact, the food industry has stepped up to the plate to address this critical issue.
It is important to note that food security and food safety are not the same thing. Thebasic distinction is that food safety deals with accidents, such as cross contaminationand process failure during production. Food security, on the other hand, is a broaderissue dealing with intentional threats. These are immensely important distinctions to thefood processing industry, particularly as they relate to our management and preventionpractices. However, both food safety and food security activities have a common goal,which is to prevent problems to protect the safety of the end product to consumers.
The food industry has been extraordinarily active in reviewing existing food securityprograms and implementing, as appropriate, new preventive practices and effectivecontrols. We are redoubling our commitment and increasing our vigilance to ensurethat systems are in place to minimize and, to the extent possible, eliminate the threat of intentional contamination of the food supply.
Throughout this process, we have tried to keep one underlying principle in sight:although security is critical to our business, ensuring security cannot be allowed toresult in business paralysis. So, any changes to either industry security activities or tothe regulations governing food security must be both realistic and workable.
Within days after the attacks on the World Trade Center and the Pentagon, NFPA helpedlaunch the Alliance for Food Security, of which the Corn Refiners Association, Inc. is amember and active participant. This government/industry alliance – which now has morethan 130 participating organizations – helps to facilitate coordination and communicationamong all stakeholders, to minimize all threats to our nation’s food security.
NFPA is the largest US food trade
association, representing the $500
billion food processing industry on
scientific and public policy issues
involving food safety, food security,
nutrition, technical and regulatory
matters and consumer affairs.
NFPA’s three scientific centers,
its scientists, government affairs
experts and professional staff
represent food industry interests
on government and regulatory
affairs and provide research,
technical services, education,
communications and crisis
management support for
the association’s US
and international members.
YEAR HFCS GLUCOSE & DEXTROSE STARCH FUEL ALCOHOL BEVERAGE ALCOHOL CEREALS & OTHER PRODUCTS TOTAL
1987 358 173 226 279 77 113 1,226
1988 361 182 223 287 107 114 1,274
1989 368 193 230 321 109 115 1,336
1990 379 200 232 349 80 114 1,354
1991 392 210 237 398 81 116 1,434
1992 414 214 238 426 83 117 1,493
1993 442 223 244 458 83 118 1,568
1994 465 231 226 533 100 118 1,672
1995 482 237 219 396 125 133 1,592
1996 504 246 229 429 130 135 1,672
1997 513 229 246 481 133 182 1,784
1998 531 219 240 526 127 184 1,827
1999 540 222 251 566 130 185 1,894
2000 530 218 247 628 130 185 1,938
2001 541 217 246 714 131 186 2,034
2002 545 212 250 920 131 187 2,245
In Million Bushels
Source: USDA – Economic Research Service. Year beginning September 1.
C O R N : F O O D A N D I N D U S T R I A L U S E S
FOOD PROCESS ING : A CR I T ICAL ELEMENT IN THE SAFET Y OF THE US FOOD SUPPLY
C O R N A N N U A L 2 0 0 314
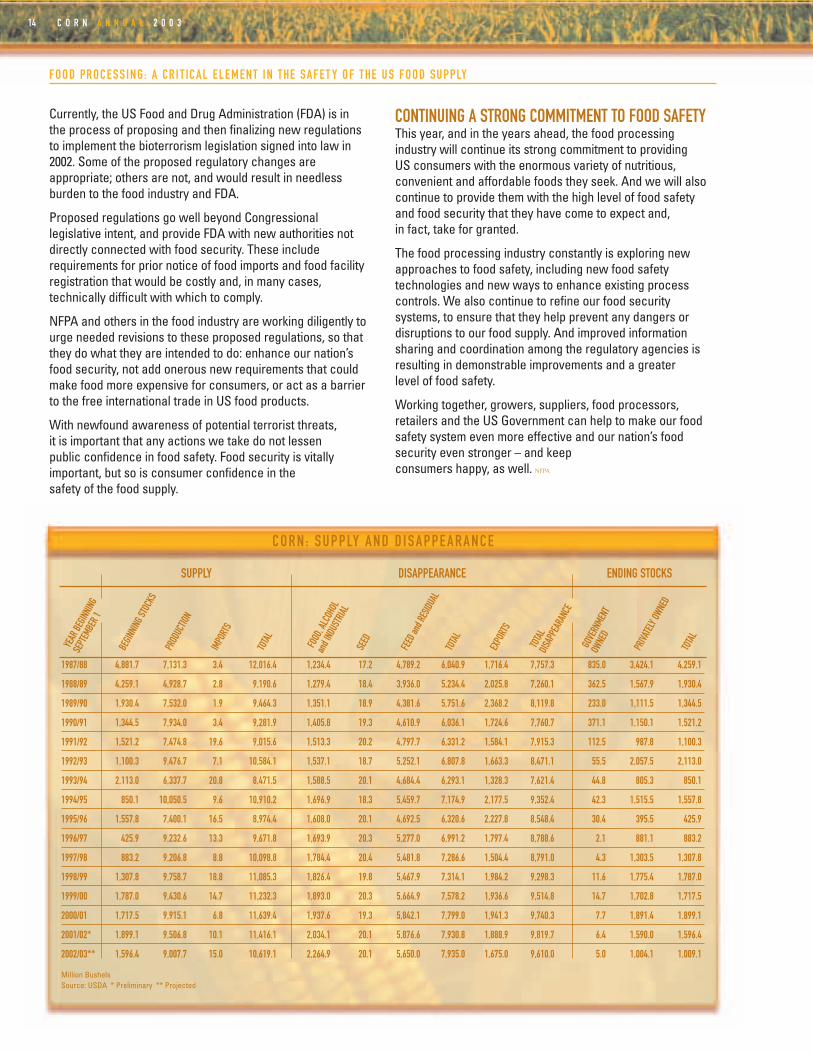
1987/88 4,881.7 7,131.3 3.4 12,016.4 1,234.4 17.2 4,789.2 6,040.9 1,716.4 7,757.3 835.0 3,424.1 4,259.1
1988/89 4,259.1 4,928.7 2.8 9,190.6 1,279.4 18.4 3,936.0 5,234.4 2,025.8 7,260.1 362.5 1,567.9 1,930.4
1989/90 1,930.4 7,532.0 1.9 9,464.3 1,351.1 18.9 4,381.6 5,751.6 2,368.2 8,119.8 233.0 1,111.5 1,344.5
1990/91 1,344.5 7,934.0 3.4 9,281.9 1,405.8 19.3 4,610.9 6,036.1 1,724.6 7,760.7 371.1 1,150.1 1,521.2
1991/92 1,521.2 7,474.8 19.6 9,015.6 1,513.3 20.2 4,797.7 6,331.2 1,584.1 7,915.3 112.5 987.8 1,100.3
1992/93 1,100.3 9,476.7 7.1 10,584.1 1,537.1 18.7 5,252.1 6,807.8 1,663.3 8,471.1 55.5 2,057.5 2,113.0
1993/94 2,113.0 6,337.7 20.8 8,471.5 1,588.5 20.1 4,684.4 6,293.1 1,328.3 7,621.4 44.8 805.3 850.1
1994/95 850.1 10,050.5 9.6 10,910.2 1,696.9 18.3 5,459.7 7,174.9 2,177.5 9,352.4 42.3 1,515.5 1,557.8
1995/96 1,557.8 7,400.1 16.5 8,974.4 1,608.0 20.1 4,692.5 6,320.6 2,227.8 8,548.4 30.4 395.5 425.9
1996/97 425.9 9,232.6 13.3 9,671.8 1,693.9 20.3 5,277.0 6,991.2 1,797.4 8,788.6 2.1 881.1 883.2
1997/98 883.2 9,206.8 8.8 10,098.8 1,784.4 20.4 5,481.8 7,286.6 1,504.4 8,791.0 4.3 1,303.5 1,307.8
1998/99 1,307.8 9,758.7 18.8 11,085.3 1,826.4 19.8 5,467.9 7,314.1 1,984.2 9,298.3 11.6 1,775.4 1,787.0
1999/00 1,787.0 9,430.6 14.7 11,232.3 1,893.0 20.3 5,664.9 7,578.2 1,936.6 9,514.8 14.7 1,702.8 1,717.5
2000/01 1,717.5 9,915.1 6.8 11,639.4 1,937.6 19.3 5,842.1 7,799.0 1,941.3 9,740.3 7.7 1,891.4 1,899.1
2001/02* 1,899.1 9,506.8 10.1 11,416.1 2,034.1 20.1 5,876.6 7,930.8 1,888.9 9,819.7 6.4 1,590.0 1,596.4
2002/03** 1,596.4 9,007.7 15.0 10,619.1 2,264.9 20.1 5,650.0 7,935.0 1,675.0 9,610.0 5.0 1,004.1 1,009.1
Million BushelsSource: USDA * Preliminary ** Projected
SUPPLY DISAPPEARANCE ENDING STOCKS
YEAR
BEGIN
NING
SEPT
EMBE
R 1
BEGIN
NING S
TOCK
S
PROD
UCTIO
N
IMPO
RTS
TOTAL FOOD
, ALC
OHOL
and I
NDUS
TRIAL
SEED
FEED
and RE
SIDUA
LTO
TAL
EXPO
RTS
TOTAL
DISAP
PEAR
ANCE
GOVE
RNME
NTOW
NED
PRIVA
TELY
OWNE
D
TOTAL
CORN : SUPPLY AND D ISAPPEARANCE
Currently, the US Food and Drug Administration (FDA) is in the process of proposing and then finalizing new regulationsto implement the bioterrorism legislation signed into law in2002. Some of the proposed regulatory changes are appropriate; others are not, and would result in needless burden to the food industry and FDA.
Proposed regulations go well beyond Congressional legislative intent, and provide FDA with new authorities notdirectly connected with food security. These include requirements for prior notice of food imports and food facilityregistration that would be costly and, in many cases, technically difficult with which to comply.
NFPA and others in the food industry are working diligently tourge needed revisions to these proposed regulations, so thatthey do what they are intended to do: enhance our nation’sfood security, not add onerous new requirements that couldmake food more expensive for consumers, or act as a barrierto the free international trade in US food products.
With newfound awareness of potential terrorist threats, it is important that any actions we take do not lessen public confidence in food safety. Food security is vitally important, but so is consumer confidence in the safety of the food supply.
CONTINUING A STRONG COMMITMENT TO FOOD SAFETYThis year, and in the years ahead, the food processing industry will continue its strong commitment to providing US consumers with the enormous variety of nutritious, convenient and affordable foods they seek. And we will alsocontinue to provide them with the high level of food safetyand food security that they have come to expect and, in fact, take for granted.
The food processing industry constantly is exploring newapproaches to food safety, including new food safety technologies and new ways to enhance existing process controls. We also continue to refine our food security systems, to ensure that they help prevent any dangers or disruptions to our food supply. And improved informationsharing and coordination among the regulatory agencies isresulting in demonstrable improvements and a greater level of food safety.
Working together, growers, suppliers, food processors, retailers and the US Government can help to make our foodsafety system even more effective and our nation’s food security even stronger – and keep consumers happy, as well. NFPA
FOOD PROCESS ING : A CR I T ICAL ELEMENT IN THE SAFET Y OF THE US FOOD SUPPLY
15C O R N A N N U A L 2 0 0 3
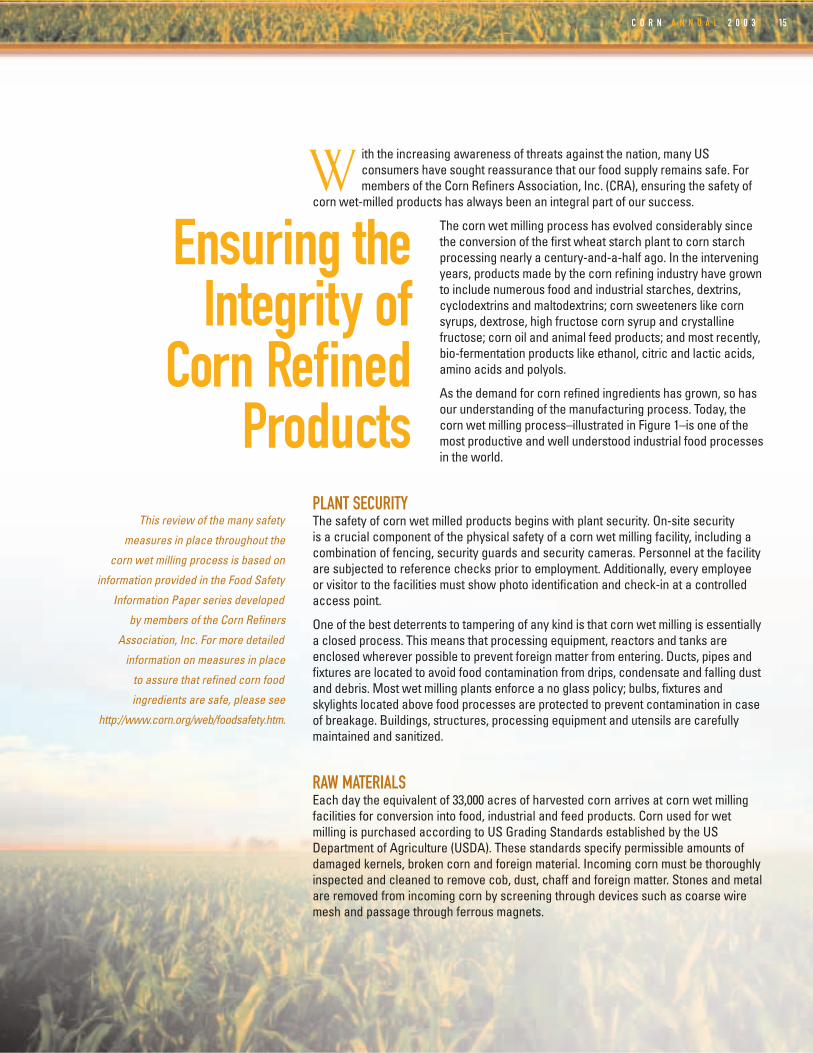
W ith the increasing awareness of threats against the nation, many USconsumers have sought reassurance that our food supply remains safe. Formembers of the Corn Refiners Association, Inc. (CRA), ensuring the safety of
corn wet-milled products has always been an integral part of our success.
The corn wet milling process has evolved considerably sincethe conversion of the first wheat starch plant to corn starchprocessing nearly a century-and-a-half ago. In the interveningyears, products made by the corn refining industry have grownto include numerous food and industrial starches, dextrins,cyclodextrins and maltodextrins; corn sweeteners like cornsyrups, dextrose, high fructose corn syrup and crystallinefructose; corn oil and animal feed products; and most recently,bio-fermentation products like ethanol, citric and lactic acids,amino acids and polyols.
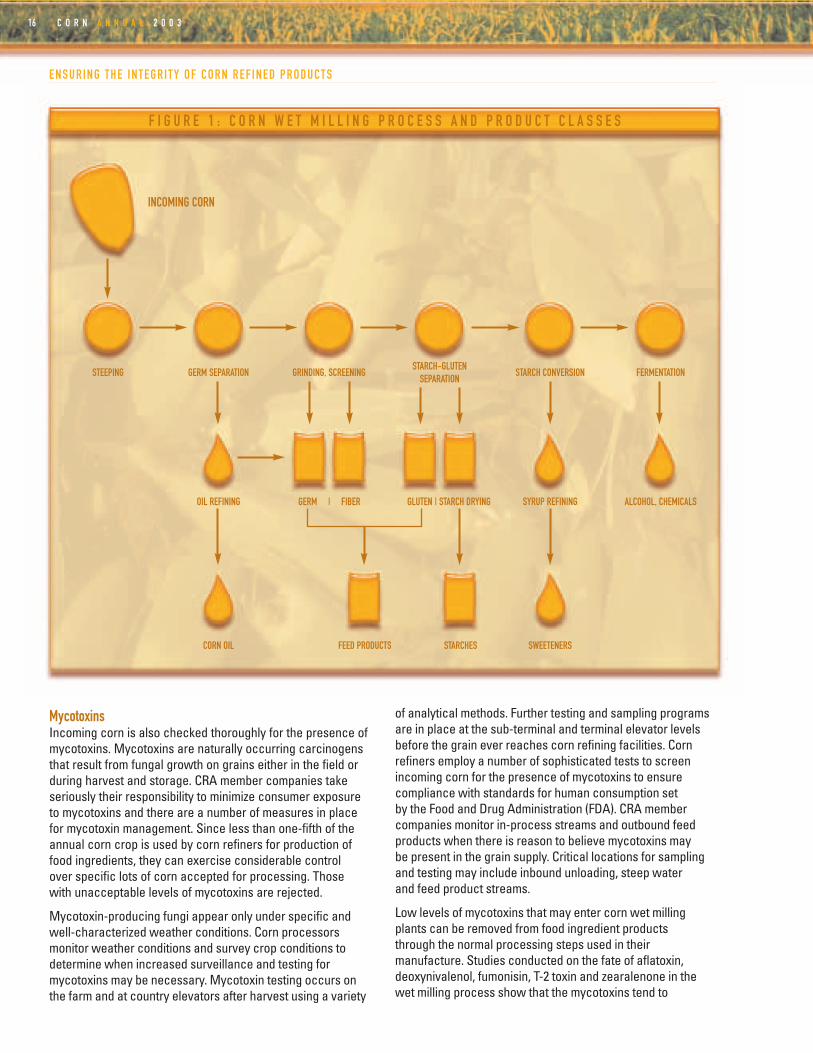
As the demand for corn refined ingredients has grown, so hasour understanding of the manufacturing process. Today, thecorn wet milling process–illustrated in Figure 1–is one of themost productive and well understood industrial food processesin the world.
PLANT SECURITYThe safety of corn wet milled products begins with plant security. On-site security is a crucial component of the physical safety of a corn wet milling facility, including acombination of fencing, security guards and security cameras. Personnel at the facilityare subjected to reference checks prior to employment. Additionally, every employeeor visitor to the facilities must show photo identification and check-in at a controlledaccess point.
One of the best deterrents to tampering of any kind is that corn wet milling is essentiallya closed process. This means that processing equipment, reactors and tanks areenclosed wherever possible to prevent foreign matter from entering. Ducts, pipes andfixtures are located to avoid food contamination from drips, condensate and falling dustand debris. Most wet milling plants enforce a no glass policy; bulbs, fixtures andskylights located above food processes are protected to prevent contamination in caseof breakage. Buildings, structures, processing equipment and utensils are carefullymaintained and sanitized.
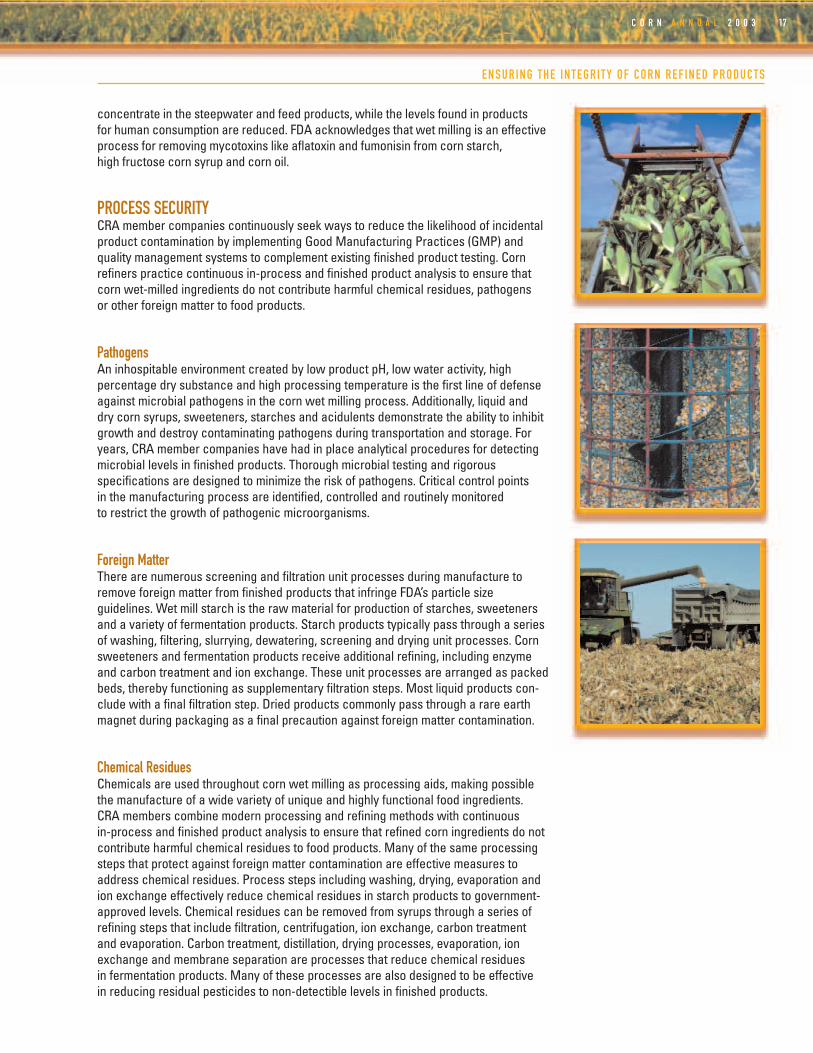
RAW MATERIALSEach day the equivalent of 33,000 acres of harvested corn arrives at corn wet millingfacilities for conversion into food, industrial and feed products. Corn used for wetmilling is purchased according to US Grading Standards established by the USDepartment of Agriculture (USDA). These standards specify permissible amounts ofdamaged kernels, broken corn and foreign material. Incoming corn must be thoroughlyinspected and cleaned to remove cob, dust, chaff and foreign matter. Stones and metalare removed from incoming corn by screening through devices such as coarse wiremesh and passage through ferrous magnets.
Ensuring theIntegrity of
Corn RefinedProducts
This review of the many safety
measures in place throughout the
corn wet milling process is based on
information provided in the Food Safety
Information Paper series developed
by members of the Corn Refiners
Association, Inc. For more detailed
information on measures in place
to assure that refined corn food
ingredients are safe, please see
http://www.corn.org/web/foodsafety.htm.
C O R N A N N U A L 2 0 0 316
MycotoxinsIncoming corn is also checked thoroughly for the presence ofmycotoxins. Mycotoxins are naturally occurring carcinogensthat result from fungal growth on grains either in the field orduring harvest and storage. CRA member companies takeseriously their responsibility to minimize consumer exposureto mycotoxins and there are a number of measures in placefor mycotoxin management. Since less than one-fifth of theannual corn crop is used by corn refiners for production offood ingredients, they can exercise considerable control over specific lots of corn accepted for processing. Those with unacceptable levels of mycotoxins are rejected.
Mycotoxin-producing fungi appear only under specific andwell-characterized weather conditions. Corn processorsmonitor weather conditions and survey crop conditions todetermine when increased surveillance and testing formycotoxins may be necessary. Mycotoxin testing occurs onthe farm and at country elevators after harvest using a variety
of analytical methods. Further testing and sampling programsare in place at the sub-terminal and terminal elevator levelsbefore the grain ever reaches corn refining facilities. Cornrefiners employ a number of sophisticated tests to screenincoming corn for the presence of mycotoxins to ensurecompliance with standards for human consumption set by the Food and Drug Administration (FDA). CRA membercompanies monitor in-process streams and outbound feedproducts when there is reason to believe mycotoxins may be present in the grain supply. Critical locations for samplingand testing may include inbound unloading, steep water and feed product streams.
Low levels of mycotoxins that may enter corn wet millingplants can be removed from food ingredient products through the normal processing steps used in theirmanufacture. Studies conducted on the fate of aflatoxin,deoxynivalenol, fumonisin, T-2 toxin and zearalenone in thewet milling process show that the mycotoxins tend to
ENSURING THE INTEGR ITY OF CORN REF INED PRODUCTS
F I G U R E 1 : C O R N W E T M I L L I N G P R O C E S S A N D P R O D U C T C L A S S E S
INCOMING CORN
STEEPING GERM SEPARATION GRINDING, SCREENINGSTARCH-GLUTEN
SEPARATIONSTARCH CONVERSION FERMENTATION
OIL REFINING GERM | FIBER GLUTEN | STARCH DRYING SYRUP REFINING
CORN OIL FEED PRODUCTS STARCHES SWEETENERS
ALCOHOL, CHEMICALS
17C O R N A N N U A L 2 0 0 3
concentrate in the steepwater and feed products, while the levels found in products for human consumption are reduced. FDA acknowledges that wet milling is an effectiveprocess for removing mycotoxins like aflatoxin and fumonisin from corn starch, high fructose corn syrup and corn oil.
PROCESS SECURITYCRA member companies continuously seek ways to reduce the likelihood of incidentalproduct contamination by implementing Good Manufacturing Practices (GMP) andquality management systems to complement existing finished product testing. Cornrefiners practice continuous in-process and finished product analysis to ensure thatcorn wet-milled ingredients do not contribute harmful chemical residues, pathogens or other foreign matter to food products.
PathogensAn inhospitable environment created by low product pH, low water activity, high percentage dry substance and high processing temperature is the first line of defenseagainst microbial pathogens in the corn wet milling process. Additionally, liquid and dry corn syrups, sweeteners, starches and acidulents demonstrate the ability to inhibitgrowth and destroy contaminating pathogens during transportation and storage. Foryears, CRA member companies have had in place analytical procedures for detectingmicrobial levels in finished products. Thorough microbial testing and rigorous specifications are designed to minimize the risk of pathogens. Critical control points in the manufacturing process are identified, controlled and routinely monitored to restrict the growth of pathogenic microorganisms.
Foreign MatterThere are numerous screening and filtration unit processes during manufacture toremove foreign matter from finished products that infringe FDA’s particle size guidelines. Wet mill starch is the raw material for production of starches, sweetenersand a variety of fermentation products. Starch products typically pass through a seriesof washing, filtering, slurrying, dewatering, screening and drying unit processes. Cornsweeteners and fermentation products receive additional refining, including enzymeand carbon treatment and ion exchange. These unit processes are arranged as packedbeds, thereby functioning as supplementary filtration steps. Most liquid products con-clude with a final filtration step. Dried products commonly pass through a rare earthmagnet during packaging as a final precaution against foreign matter contamination.
Chemical ResiduesChemicals are used throughout corn wet milling as processing aids, making possiblethe manufacture of a wide variety of unique and highly functional food ingredients. CRA members combine modern processing and refining methods with continuous in-process and finished product analysis to ensure that refined corn ingredients do notcontribute harmful chemical residues to food products. Many of the same processingsteps that protect against foreign matter contamination are effective measures toaddress chemical residues. Process steps including washing, drying, evaporation andion exchange effectively reduce chemical residues in starch products to government-approved levels. Chemical residues can be removed from syrups through a series ofrefining steps that include filtration, centrifugation, ion exchange, carbon treatment and evaporation. Carbon treatment, distillation, drying processes, evaporation, ionexchange and membrane separation are processes that reduce chemical residues in fermentation products. Many of these processes are also designed to be effective in reducing residual pesticides to non-detectible levels in finished products.
ENSURING THE INTEGR ITY OF CORN REF INED PRODUCTS
C O R N A N N U A L 2 0 0 318
TRANSPORTATIONConcern over the safety of finished products does not end with manufacturing. Many years ago, CRA member companiesdeveloped stringent product transportation guidelines, designedto ensure that refined corn products reach food and beveragemanufacturers safely, unadulterated and with clear evidence of any attempt at tampering in transit.
Since many corn ingredients readily absorb residual flavors andodors, they are transported only in committed food containers.Each container’s interior is visually inspected to confirm that noabnormal conditions exist. After the interior surface is sanitizedby continuous washing with 180°F water for 15 minutes, thecontainer is allowed to cool for final visual confirmation that thetanker is clean and drained. Tamper evident seals are properlyapplied to access points immediately after washing andinspecting and prior to moving if the container is outside thecontrol of the manufacturer. If washed containers are not loaded within 24 hours of washing, the container is re-inspectedand rewashed if necessary before loading. Once containers areloaded, they are closed and sealed immediately. In addition, allbulk ingredients and full loads are transported with numberedseals, which can be verified upon receipt to ascertain that noproduct tampering has occurred. Any full shipments with broken seals are rejected.
EMERGENCY RESPONSEDespite these extensive measures, the corn wet milling industry has a number of contingency plans in place in theunlikely event of tampering, or other emergencies. Productrecall and retrieval systems are in place to facilitate the rapidremoval of potentially contaminated products from the marketplace, which rely on lot traceability. Many companiestrain on-site with emergency management teams, fire and rescue, police and other security firms.
CONCLUSIONWhile existing security measures ensure that the corn wetmilling process is one of the safest in world, the industry isalways finding safer and more efficient ways to protect theintegrity of its product lines. Food safety is of the utmost importance to the corn refining industry. CR A
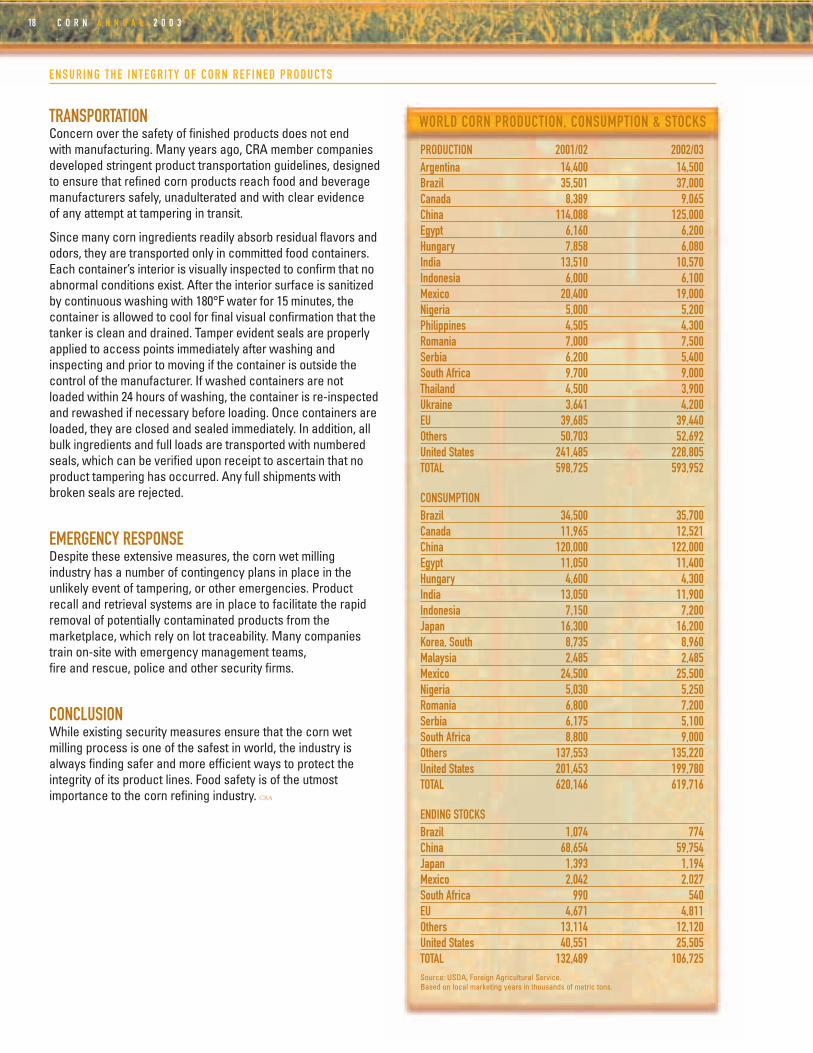
WORLD CORN PRODUCTION, CONSUMPTION & STOCKS
PRODUCTION 2001/02 2002/03Argentina 14,400 14,500Brazil 35,501 37,000Canada 8,389 9,065China 114,088 125,000Egypt 6,160 6,200Hungary 7,858 6,080India 13,510 10,570Indonesia 6,000 6,100Mexico 20,400 19,000Nigeria 5,000 5,200Philippines 4,505 4,300Romania 7,000 7,500Serbia 6,200 5,400South Africa 9,700 9,000Thailand 4,500 3,900Ukraine 3,641 4,200EU 39,685 39,440Others 50,703 52,692United States 241,485 228,805TOTAL 598,725 593,952
CONSUMPTIONBrazil 34,500 35,700Canada 11,965 12,521China 120,000 122,000Egypt 11,050 11,400Hungary 4,600 4,300India 13,050 11,900Indonesia 7,150 7,200Japan 16,300 16,200Korea, South 8,735 8,960Malaysia 2,485 2,485Mexico 24,500 25,500Nigeria 5,030 5,250Romania 6,800 7,200Serbia 6,175 5,100South Africa 8,800 9,000Others 137,553 135,220United States 201,453 199,780TOTAL 620,146 619,716
ENDING STOCKSBrazil 1,074 774China 68,654 59,754Japan 1,393 1,194Mexico 2,042 2,027South Africa 990 540EU 4,671 4,811Others 13,114 12,120United States 40,551 25,505TOTAL 132,489 106,725Source: USDA, Foreign Agricultural Service. Based on local marketing years in thousands of metric tons.
ENSURING THE INTEGR ITY OF CORN REF INED PRODUCTS

19C O R N A N N U A L 2 0 0 3
YEAR REFINED HFCS GLUCOSE DEXTROSE TOTAL HONEY and TOTAL CALORICSUGARS EDIBLE SYRUPS SWEETENERS
1986 60.0 45.7 13.6 3.6 62.8 1.4 124.3
1987 62.4 47.7 13.8 3.6 65.2 1.3 128.8
1988 62.1 49.0 14.3 3.7 66.9 1.2 130.2
1989 62.8 48.2 12.8 3.5 64.6 1.2 128.5
1990 64.4 49.6 13.6 3.6 66.8 1.2 132.4
1991 63.6 50.3 14.0 3.7 68.0 1.3 132.9
1992 64.2 51.8 15.1 3.6 70.5 1.4 136.1
1993 63.8 54.5 15.8 3.7 73.9 1.4 139.1
1994 64.3 56.2 15.9 3.8 75.9 1.3 141.5
1995 64.7 57.6 16.3 4.0 77.9 1.3 143.8
1996 65.5 57.8 16.4 4.0 78.2 1.3 145.0
1997 65.3 60.4 17.3 3.7 81.5 1.3 148.1
1998 65.1 61.9 17.1 3.6 82.7 1.3 149.1
1999 66.3 63.7 16.3 3.5 83.5 1.4 151.3
2000 65.6 62.7 15.8 3.4 81.9 1.5 148.9
2001 64.6 62.6 15.7 3.3 81.6 1.3 147.4
Units Measured in Pounds.Source: USDA – Economic Research ServiceNote: 2002 data not available at time of publication.
* Per capita deliveries of sweeteners by U.S. processors and refiners and direct-consumption imports to food manufacturers, retailers, and other end users represent the per capita supplyof caloric sweeteners. Actual human intake of caloric sweeteners is lower because of uneaten food, spoilage, and other losses. Figures do not include deliveries to alcohol manufacturers.
C O R N S W E E T E N E R S – D R Y B A S I S
U S P E R C A P I T A S W E E T E N E R D E L I V E R I E S * F O R F O O D A N D B E V E R A G E U S E
C O R N A N N U A L 2 0 0 320
Archer Daniels Midland CompanyP.O. Box 1470 Decatur, Illinois 62525
Domestic PlantsCedar Rapids, Iowa 52404
Clinton, Iowa 52732
Columbus, Nebraska 68601
Decatur, Illinois 62525
Marshall, Minnesota 56258-2744
International PlantGuadalajara, Jalisco, Mexico
Cargill, IncorporatedP.O. Box 5662/MS62 Minneapolis, Minnesota 55440-5662
Domestic PlantsBlair, Nebraska 68008-2649
Cedar Rapids, Iowa 52406-2638
Dayton, Ohio 45413-8001
Decatur, Alabama 35601
Dimmitt, Texas 79027
Eddyville, Iowa 52553-5000
Hammond, Indiana 46320-1094
Memphis, Tennessee 38113-0368
Wahpeton, North Dakota 58075
International PlantsUberlandia, Minas Gerais, Brazil
Shanghai, China
Song Yuan, China
Langholt, Nordjylland, Denmark
Haubourdin, Pas-de-Calais, France
Krefeld, Nordrhein-Westfalen, Germany
Magdeburg, Sachsen-Anhalt, Germany
Castelmassa, Veneto, Italy
Wroclaw, Dolnoslaskie, Poland
Martorell, Barcelona, Spain
Santo Domingo, Spain
Wadenswil, Zurich, Switzerland
Efremov, Tula, Russia
Bergen Op Zoom, Noord-Brabant, The Netherlands
Sas van Gent, Zeeland, The Netherlands
Istanbul, Turkey
Orhangasi, Bursa, Turkey
Vanikoy, Istanbul, Turkey
Manchester, England, United Kingdom
Tilbury, England, United Kingdom
Corn Products International, Inc.5 Westbrook Corporate CenterWestchester, Illinois 60154
Domestic PlantsBedford Park, Illinois 60501-1933
Stockton, California 95206-0129
Winston-Salem, North Carolina 27107
International PlantsCardinal, Ontario, Canada
London, Ontario, Canada
Port Colborne, Ontario, Canada
Guadalajara, Jalisco, Mexico (2 plants)
San Juan del Rio, Queretaro, Mexico
Tlalnepantla, Mexico State, Mexico
Baradero, Buenos Aires, Argentina
Chacabuco, Buenos Aires, Argentina
Balsa Nova, Parana, Brazil
Cabo, Pernambuco, Brazil
Mogi-Guacu, Sao Paulo, Brazil
Llay-Llay, Valparaiso, Chile
Cali, Valle del Cauca, Colombia
Medellin, Antioquia, Columbia
Eldoret, Rift Valley, Kenya
Icheon, Chungcheongbuk, South Korea
Ichon, Kyeonggi, South Korea
Faisalabad, Punjab, Pakistan
National Starch and Chemical Company10 Finderne Avenue Bridgewater, New Jersey 08807-0500
Domestic PlantsIndianapolis, Indiana 46221
North Kansas City, Missouri 64116
International PlantsCollingwood, Ontario, Canada
Trombudo Central, Brazil
Hamburg, Germany
Penford Products Co.(A company of Penford Corporation)
P.O. Box 428 Cedar Rapids, Iowa 52406-0428
Domestic PlantsCedar Rapids, Iowa 52404-2175
International PlantsLane Cove, Sydney, Australia
Onehunga, Auckland, New Zealand
Roquette America, Inc.1417 Exchange StreetP.O. Box 6647 Keokuk, Iowa 52632-6647
Domestic PlantsKeokuk, Iowa 52632-6647
International PlantsLestrem, Pas-de-Calais, France
Beinheim, Bas-Rhin, France
Cassano Spinola, Alessandria, Italy
Benifayo, Valencia, Spain
Calafat, Dolj, Romania
A.E. Staley Manufacturing Company(A subsidiary of Tate & Lyle, PLC)
P.O. Box 151 Decatur, Illinois 62525
Domestic PlantsDecatur, Illinois 62521
Lafayette, Indiana 47902
Lafayette, Indiana 47905
Loudon, Tennessee 37774
International PlantsGuadalajara, Jalisco, Mexico
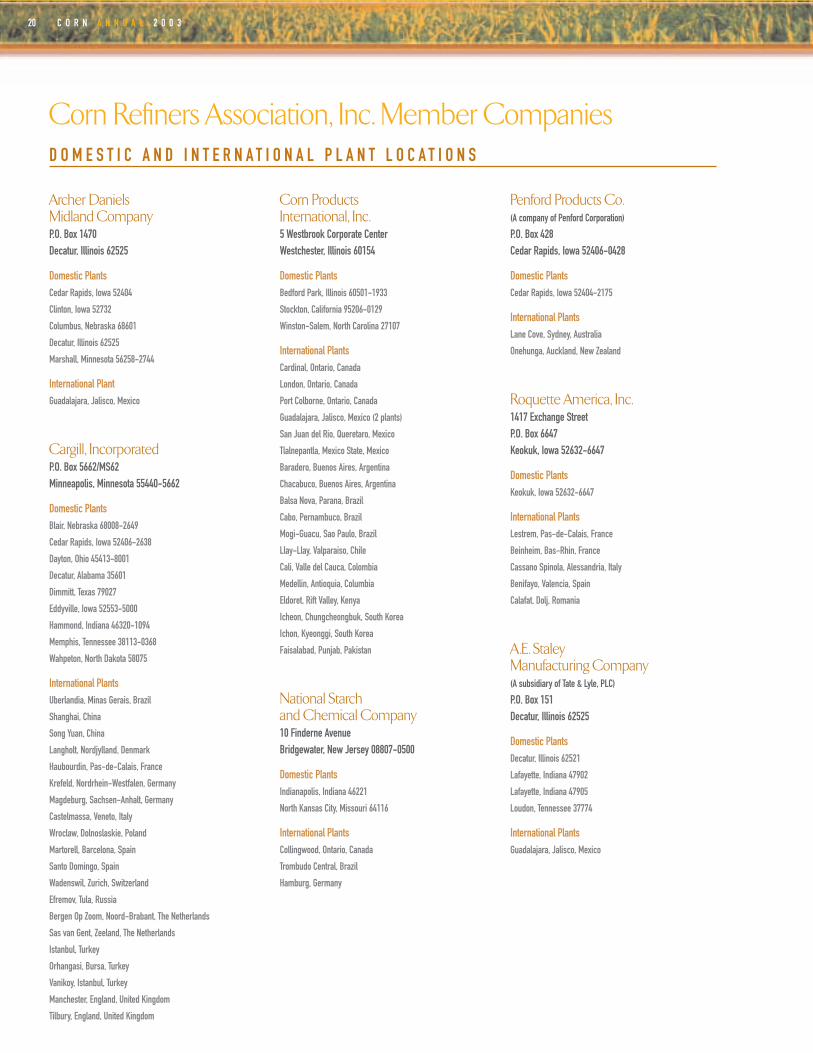
Corn Refiners Association, Inc. Member CompaniesD O M E S T I C A N D I N T E R N A T I O N A L P L A N T L O C A T I O N S

CORN ANNUAL 2003C O N T E N T S
Foreword ..............................................................................................1
Introduction..........................................................................................2
Safety of the U.S. Food Supply a Top Priority for Administration......................................................7
Food Processing: A Critical Element in the Safety of the US Food Supply ............................................11
Ensuring the Integrity of Corn Refined Products ......................15
C O R N I N D U S T R Y S T A T I S T I C S
Shipments of Products of the Corn Refining Industry - 2002 ..........................................................3
Exports of Refined Products From Corn ........................................5
Corn for Grain: Yield and Production..............................................6
Member Company Products ..........................................................10
Corn: Food and Industrial Uses ....................................................13
Corn: Supply and Disappearance ................................................14
World Corn Production, Consumption and Stocks ..................18
US Per Capita Sweetener Deliveries for Food and Beverage Use............................................................................19
Member Companies Domestic and International Plant Locations ................................................20
J. Patrick Mohan, ChairmanTate & Lyle North America, Inc.
Martin L. Andreas, Vice ChairmanArcher Daniels Midland Company
John RiceArcher Daniels Midland Company
Patrick E. BoweCargill, Incorporated
R. Creager SimpsonCargill, Incorporated
Eugene NorthackerCorn Products International, Inc.
Richard M. VandervoortCorn Products International, Inc.
Peter A. SalisNational Starch and Chemical Company
James P. ZallieNational Starch and Chemical Company
Gregory R. KeeleyPenford Products Co.
Michael W. JorgensonRoquette America, Inc.
Katherine G. HolsingerRoquette America, Inc.
D. Lynn GriderA. E. Staley Manufacturing Company
Fred M. AshCerestar USA, Inc.
C. G. CaldwellNational Starch and Chemical Company
Paul E. GrunderCPC International Inc.
Patric J. McLaughlinCerestar USA, Inc.
E. S. MicekCargill, Incorporated
G. M. MitchellCargill Trustees
Donald E. NordlundA. E. Staley Manufacturing Company
William H. PowellNational Starch and Chemical Company
Robert M. PowersA. E. Staley Manufacturing Company
Paul E. RamstadAmerican MaizeProducts Company
H. T. ReedPenford Products Co.
John G. Reed, Jr.Archer Daniels Midland Company
Samuel C. ScottCorn Products International, Inc.
Michael A. UrbanicCargill, Incorporated
Board of Directors
Honorary Directors
CRA StaffAudrae Erickson
President
Jennifer Snyder Senior Director of Regulatory
& Technical Affairs
Curt Mercadante Director of Communications
Sherri Lehman Director of Congressional Affairs
Melanie O’Donnell Manager of Technical Affairs
Lea Ann Elliott,Office Manager
Jo Ann Hoggard,Executive Assistant
Shannon ShoesmithCorn Annual Editor
Design: Xanthus Design
Photography: Gregory Thorp

CORN ANNUAL 2003
CORN REFINERS ASSOCIATION, INC.1 7 0 1 P E N N S Y L V A N I A A V E N U E , N . W . , S U I T E 9 5 0 W A S H I N G T O N , D C 2 0 0 0 6 - 5 8 0 5
T E L : 2 0 2 3 3 1 - 1 6 3 4 F A X : 2 0 2 3 3 1 - 2 0 5 4 E - M A I L : D E T A I L S @ C O R N . O R G W E B S I T E : H T T P : / / W W W . C O R N . O R G
F O O D S A F E T Y I N T H E U N I T E D S T A T E S


