Foodborne Illness Source Attribution Estimates for Salmonella, Escherichia coli O157 (E. coli O157), Listeria monocytogenes (Lm), and Campylobacter using Outbreak Surveillance Data Report Interagency Food Safety Analytics Collaboration (IFSAC) Project February 2015 1
Transcript
Foodborne Illness Source Attribution Estimates for Salmonella, Escherichia coli O157 (E. coli O157), Listeria monocytogenes (Lm), and Campylobacter using Outbreak
Acknowledgments This report was written by members of the Interagency Food Safety Analytics Collaboration (IFSAC) and includes contributions from others in the Centers for Disease Control and Prevention (CDC), the U.S. Food and Drug Administration (FDA), and the U.S. Department of Agriculture’s Food Safety and Inspection Service (USDA/FSIS).
IFSAC Project Team
CDC FDA FSIS Dana Cole (project lead) Michael Batz (scientific consultant) Neal Golden Weidong Gu Michael Bazaco Chuanfa Guo Mike Hoekstra Marc Boyer Curtis Travis Shacara Johnson Cary Chen Parker Joanna Zablotsky Kufel LaTonia Richardson Stuart Chirtel Antonio Vieira Babgaleh Timbo
Iris Valentin‐Bon Beverly Wolpert
IFSAC Steering Committee Christopher Alvares (FSIS) Christopher Braden (CDC) Kathleen Gensheimer (FDA) David Goldman (FSIS) Patricia M. Griffin (CDC) Sherri McGarry (FDA) Kara Morgan (former FDA) Debra Street (former FDA)
2
Introduction Each year in the United States (U.S.), an estimated 9 million people get sick, 55,000 are hospitalized,
and 1,000 die of foodborne disease caused by known pathogens (Scallan et al., 2011). Having these estimates help us understand the scope of the public health problem. However, to develop effective prevention measures, we need to better understand the types of foods contributing to the problem.
Estimating the percentage of foodborne illnesses associated with specific foods is called foodborne illness source attribution. Determining the types of food that cause foodborne illnesses will not only guide efforts to improve food safety, but will also help identify opportunities to influence food safety policy. Regulatory agencies can use source attribution estimates to inform agency priorities, support development of regulations and performance standards and measures, and conduct risk assessments, among other activities.
With the creation of the Interagency Food Safety Analytics Collaboration (IFSAC) in 2011, the U.S. Food and Drug Administration (FDA), the U.S. Department of Agriculture’s Food Safety and Inspection Service (USDA/FSIS), and Centers for Disease Control and Prevention (CDC) agreed to pursue shared food safety goals: to improve data and methods used to estimate foodborne illness source attribution, and to provide timely estimates of source attribution for 4 key foodborne pathogens, Salmonella, Escherichia coli O157 (E. coli O157), Listeria monocytogenes (Lm), and Campylobacter. These pathogens are considered a high priority to IFSAC because of the frequency and severity of illness they cause, and, most importantly, their susceptibility to targeted interventions. To accomplish these goals, IFSAC developed a suite of complementary projects to address different aspects of these goals and to support the overall IFSAC strategic vision. This report documents the culmination of the goal to provide harmonized foodborne illness source attribution estimates by developing, for the first time, a single, robust method to produce estimates that all 3 agencies may use in their food safety activities.
Similar to a recently published study (Painter et al., 2013), we used outbreak surveillance data to estimate the percentages of domestically acquired, foodborne illnesses (both outbreak and sporadic) associated with consumption of foods assigned to predefined food categories (attribution percentages). However, our approach differs in several ways from the method used by Painter et al., and the approach and methods used to conduct this analysis rely on the findings and outputs from several IFSAC projects.*
For example, we include the most recent outbreak data available (1998–2012) and attribute illnesses to food categories recently updated to align with those used by food safety regulatory agencies (Cole et al., 2013). In addition, our statistical model uses methods to smooth variation in outbreak size and decrease the influence of outliers. Our model also gives less weight to data from 1998 through 2007 than to the most recent 5‐years of data (2008–2012). To minimize uncertainty, we only use data from outbreaks in which the implicated food could be assigned to a single food category.
This report provides a brief summary of our methods and results. It describes how we estimated attribution percentages for Salmonella, E. coli O157, Lm, and Campylobacter for each food category. Estimated attribution percentages also include a calculation of the 90% credibility interval. These improved estimates of foodborne illness source attribution derived from outbreak data can inform efforts to prioritize food safety initiatives, interventions, and policies for reducing foodborne illnesses. Additional details describing our methods will be discussed at the February 24, 2015 IFSAC public meeting.
* For more information on completed and ongoing IFSAC projects, please visit the IFSAC webpage at http://www.cdc.gov/foodsafety/ifsac/index.html.
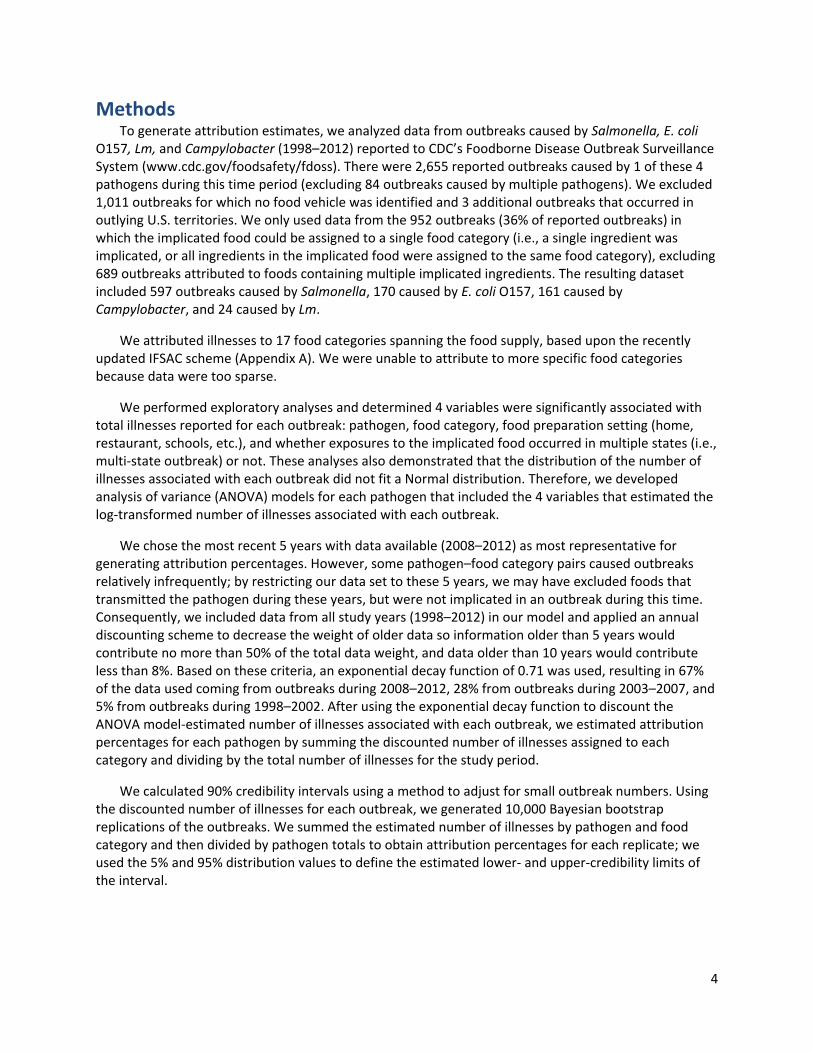
Methods To generate attribution estimates, we analyzed data from outbreaks caused by Salmonella, E. coli
O157, Lm, and Campylobacter (1998–2012) reported to CDC’s Foodborne Disease Outbreak Surveillance System (www.cdc.gov/foodsafety/fdoss). There were 2,655 reported outbreaks caused by 1 of these 4 pathogens during this time period (excluding 84 outbreaks caused by multiple pathogens). We excluded 1,011 outbreaks for which no food vehicle was identified and 3 additional outbreaks that occurred in outlying U.S. territories. We only used data from the 952 outbreaks (36% of reported outbreaks) in which the implicated food could be assigned to a single food category (i.e., a single ingredient was implicated, or all ingredients in the implicated food were assigned to the same food category), excluding 689 outbreaks attributed to foods containing multiple implicated ingredients. The resulting dataset included 597 outbreaks caused by Salmonella, 170 caused by E. coli O157, 161 caused by Campylobacter, and 24 caused by Lm.
We attributed illnesses to 17 food categories spanning the food supply, based upon the recently updated IFSAC scheme (Appendix A). We were unable to attribute to more specific food categories because data were too sparse.
We performed exploratory analyses and determined 4 variables were significantly associated with total illnesses reported for each outbreak: pathogen, food category, food preparation setting (home, restaurant, schools, etc.), and whether exposures to the implicated food occurred in multiple states (i.e., multi‐state outbreak) or not. These analyses also demonstrated that the distribution of the number of illnesses associated with each outbreak did not fit a Normal distribution. Therefore, we developed analysis of variance (ANOVA) models for each pathogen that included the 4 variables that estimated the log‐transformed number of illnesses associated with each outbreak.
We chose the most recent 5 years with data available (2008–2012) as most representative for generating attribution percentages. However, some pathogen–food category pairs caused outbreaks relatively infrequently; by restricting our data set to these 5 years, we may have excluded foods that transmitted the pathogen during these years, but were not implicated in an outbreak during this time. Consequently, we included data from all study years (1998–2012) in our model and applied an annual discounting scheme to decrease the weight of older data so information older than 5 years would contribute no more than 50% of the total data weight, and data older than 10 years would contribute less than 8%. Based on these criteria, an exponential decay function of 0.71 was used, resulting in 67% of the data used coming from outbreaks during 2008–2012, 28% from outbreaks during 2003–2007, and 5% from outbreaks during 1998–2002. After using the exponential decay function to discount the ANOVA model‐estimated number of illnesses associated with each outbreak, we estimated attribution percentages for each pathogen by summing the discounted number of illnesses assigned to each category and dividing by the total number of illnesses for the study period.
We calculated 90% credibility intervals using a method to adjust for small outbreak numbers. Using the discounted number of illnesses for each outbreak, we generated 10,000 Bayesian bootstrap replications of the outbreaks. We summed the estimated number of illnesses by pathogen and food category and then divided by pathogen totals to obtain attribution percentages for each replicate; we used the 5% and 95% distribution values to define the estimated lower‐ and upper‐credibility limits of the interval.
Results For Salmonella, 30% of outbreaks and 45% of associated illnesses occurred in the most recent five
years (2008–2012). The proportions for other pathogens were: for E. coli O157, 30% of outbreaks and 24% of illnesses; for Campylobacter, 33% of outbreaks and 17% of illnesses; and for Lm, 50% of outbreaks and 60% of illnesses. The number of outbreaks and illnesses associated with each pathogen and food category are summarized in Appendix B, Table 1.
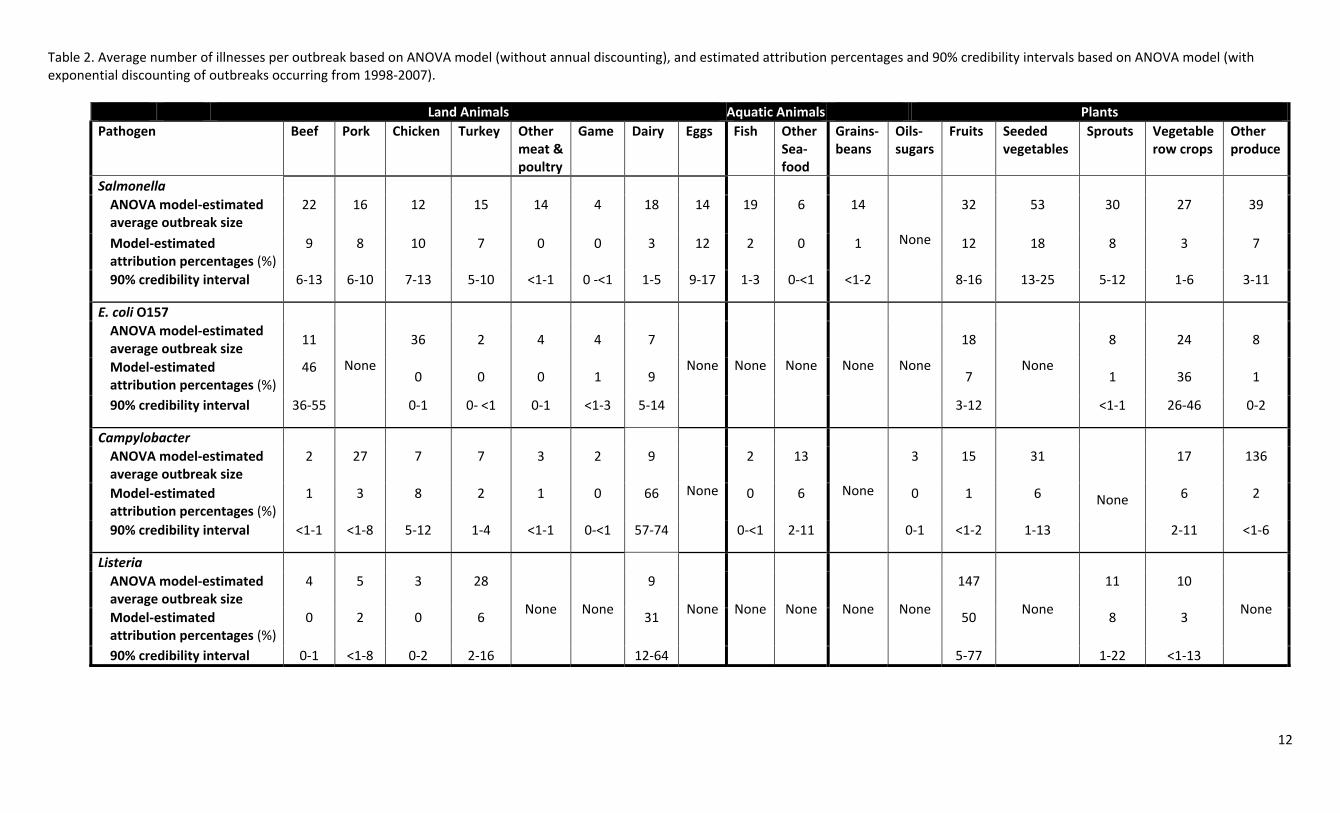
Figure 1 provides the point estimates for each attribution percentage and associated 90% credibility intervals. These attribution percentages, as well as total illnesses attributed to each food category, and average outbreak size estimated by the ANOVA model, are provided in Appendix B, Table 2.
There are distinct differences in the distributions of attribution point estimates across the 4 pathogens, as evidenced by the number of food categories responsible for roughly 75% of illnesses. Only 2 food categories accounted for the majority of estimated illnesses caused by Campylobacter, E. coli O157, and Lm, but 7 food categories accounted for a similar percentage of Salmonella illnesses. Seventy four percent of Campylobacter illnesses were attributed to Dairy (66%) and Chicken (8%), 82% of E. coli O157 illnesses were attributed to Beef (46%) and Vegetable Row Crops (36%), and 81% of Lm illnesses were attributed to Fruits (50%) and Dairy (31%). In contrast, Salmonella was more broadly attributed, as 77% of model‐estimated illnesses were attributed to; Seeded vegetables (18%), Eggs (12%), Fruits (12%), Chicken (10%), Sprouts (8%), Beef (9%), and Pork (8%).
Figure 1 also shows much variation and overlap in the 90% credibility intervals, resulting from variations in the numbers of outbreaks and the numbers of reported illnesses among those outbreaks for each pathogen‐food category pair. Wider intervals indicate relatively higher levels of statistical uncertainty around the attribution point estimates of those pathogen‐food category pairs compared with those with more narrow intervals. For example, the point estimates for the Lm attribution percentages were widest, largely a result of the small number of Lm outbreaks in the study period (n=24); the interval for Lm‐Fruits ranged from 5% to 77%, and Lm‐Dairy ranged from 12% to 64%. Likewise, the point estimates for the food categories explaining many of the E. coli O157 and Campylobacter illnesses also had a relatively large amount of uncertainty. Campylobacter estimates ranged from 57% to 74% for Dairy, while estimates for E. coli O157 ranged from 36% to 55% for Beef and 26% to 46% for Vegetable Row Crops. In contrast, the 90% credibility intervals for the 7 Salmonella attribution percentages accounting for 77% of Salmonella illnesses were fairly narrow, ranging from 6% to 10% for Pork, 7% to 13% for Chicken, and 13% to 25% for Seeded vegetables.
Discussion Outbreak investigations often link illnesses to a specific food. For this reason, data from foodborne
outbreaks are often used to estimate the number of domestically‐acquired foodborne illnesses in the U.S. population attributable to specific foods. We developed a novel method to generate attribution percentage estimates, and accompanying estimates of statistical uncertainty, using the most recent foodborne disease outbreak data available and a new scheme to classify foods that IFSAC developed to better align with what the U.S. food regulatory agencies use (Cole et al., 2013). In addition, we used new methods that accounted for sources of uncertainty when using outbreaks to attribute illnesses to food categories (e.g., variables associated with outbreak size and temporal relevance of outbreak data to current sources of foodborne illness).
We used regression modeling techniques to normalize the distribution of outbreak size and minimize bias in our estimated attribution percentages associated with large outbreaks. Likewise, we
6
limited the uncertainty associated with the foods causing outbreak illnesses by including only outbreaks attributed to foods assigned to a single food category. We also included outbreaks from 1998 through 2012 in the analysis so that bias would not be introduced by excluding foods infrequently associated with outbreaks. However, we recognized that the foods most recently implicated in outbreaks were likely most relevant to estimating current attribution percentages, so we exponentially discounted outbreaks older than 5 years. We did not account for possible changes in pathogen incidence, outbreak surveillance, or illness attribution over time. In addition, foods identified in outbreaks reflect exposures at the point of consumption; our analysis did not address the point in the farm to fork continuum where contamination occurred or was amplified. Our analysis involved aggregating foods implicated in outbreaks into categories. Our estimates, therefore, should not be interpreted as suggesting that all foods within a category are equally likely to cause disease.
The results of our analysis using outbreak data point to important signals in foodborne illness source attribution for these pathogens, and the source attribution estimates for the 4 pathogens pose a spectrum of challenges to the goal of reducing foodborne illnesses. While the credibility intervals for Salmonella attribution percentages were uniformly narrow, thus increasing confidence in their respective point estimates, Salmonella illnesses were broadly attributed across multiple food categories. This suggests interventions designed to reduce foodborne salmonellosis need to include a variety of approaches. Although Campylobacter infections spanned a broad array of categories as well, the Dairy category was notable for having a high estimated attribution percentage and credibility intervals distinctly wider than other categories. The high estimated attribution percentage of Campylobacter associated with the Dairy category is largely, although not entirely, due to outbreaks associated with raw fluid milk or cheese produced from raw milk (e.g., unpasteurized queso fresco).
In contrast, E. coli O157 and Lm illnesses were attributed to fewer food categories, and for each of these pathogens, two categories accounted for the largest point estimates: Beef and Vegetable row crops for E. coli O157, and Dairy and Fruits for Lm. This suggests that interventions for E. coli O157 focusing on these two food categories may be most effective in reducing illnesses. For Lm, the limited number of outbreaks and wide credibility intervals dictate caution in interpreting the attribution percentages for the two food categories. Nonetheless, Lm outbreaks have been frequently linked to the Dairy category, specifically with the consumption of soft cheeses by pregnant women and persons with weakened immune systems. Although the wide credibility interval for the Fruit category substantially limits interpretation, the analysis does suggest vigilance in seeking unrecognized sources of outbreaks and illnesses in this food category.
There are several limitations associated with the data and analyses. For example, using outbreak data to estimate the number of domestically‐acquired foodborne illnesses in the U.S. population attributable to specific food categories depends on the assumption that the risk factors identified for the 4 pathogens from foodborne disease outbreak surveillance data are generalizable to overall foodborne illness, including both outbreaks and sporadic (i.e., non‐outbreak) illnesses. There are a number of uncertainties with this assumption. First, small numbers of outbreaks contribute to greater uncertainty about the estimated attribution percentages. As highlighted by the estimate for Lm‐Fruits, when data are sparse, a single large outbreak (the 2011 cantaloupe outbreak) can have a great influence on the attribution point estimate. Secondly, foods identified in outbreak investigations may not well represent foods responsible for sporadic disease. Although a separate IFSAC study found that outbreak and
7
sporadic infections caused by the 4 priority pathogens were demographically similar (Ebel et al., 2014)†, a number of published studies have noted that food sources for some pathogens, such as Campylobacter, can vary substantially, depending on the study (Painter et al., 2013; Pires, 2013; Hoffmann et al., 2007; Friedman et al., 2004). While studies of sporadic campylobacteriosis find low attribution to dairy products, 60% of the 161 Campylobacter outbreaks in this analysis attributed to a single food category were associated with unpasteurized milk or cheese made from unpasteurized milk. These foods are not regularly consumed by the general population, so extrapolation to the general population is problematic. In addition, we analyzed only 36% of reported outbreaks caused by the 4 priority pathogens (952 outbreaks), and these may not be representative of other outbreaks. Finally, nearly 10% of illnesses in our analysis occurred within institutionalized populations, such as people in prisons, hospitals, and schools, and these populations and sources of food contamination may not be representative of the general population.
Conclusions This collaborative project among FDA, USDA/FSIS, and CDC represents a major step forward in the
development of robust, harmonized foodborne illness source attribution percentages based on outbreak data. The attribution percentages described in this report represent generalized estimates of foodborne illness source attribution for Salmonella, E. coli O157, Lm, and Campylobacter, and are based on the most recent data available.
Our novel approach produces better estimated attribution percentages than those based solely on the observed numbers of outbreaks and outbreak illnesses, and can be used to produce new estimates when outbreak data are updated. Our improved method for estimating attribution percentages, calculating credibility intervals, and using new food categories that better align with those used to regulate food products can improve the utility of the attribution percentages. Furthermore, having consensus on a single analytic approach for determining attribution percentages from outbreak surveillance data may provide greater harmony and consistency in interpretation of estimates across agencies. These estimates could enhance efforts to inform and engage stakeholders, including industry and consumers, about food safety strategies.
We acknowledge that the data have many limitations. Our analysis is based only on outbreak data (and on only a subset of those data). Our results reflect surveillance biases as well as uncertainties due to sparse data. Consequently, we urge caution in interpreting certain findings, such as our estimates for Campylobacter in Dairy and Listeria in Fruits. We suggest that our results be used with other scientific data for risk‐based decision making.
As more data sources for analyses become available and methods evolve, attribution estimates will continue to improve. IFSAC intends to pursue new projects to address some of the limitations recognized in this effort, including further exploration of Campylobacter illnesses and inclusion of foods with ingredients assigned to more than one food category into attribution estimates.
†This study compared outbreak‐related and non‐outbreak‐related illnesses from FoodNet surveillance, and found that sporadic Salmonella illnesses occur more frequently in young children.
8
References Cole D, Bazaco M, Duvernoy T, Golden N, Herman K, Klontz K, Parker C, Richardson L, Travis C, Zablotsky Kufel J. “Improving the Categories Used to Classify Foods Implicated in Outbreaks” IFSAC Webinar Series, White Oak MD. June 18, 2013. Available at: http://www.cdc.gov/foodborneburden/PDFs/ifsac‐webinar‐06‐18‐2013‐slides‐508c.pdf
Ebel E, Williams M, Cole D, Golden N, Guo C, Hoekstra R, Johnson S, Klontz K, Lanier W, Richardson L., Timbo B, Travis C. “Are Outbreak Illnesses Representative of Sporadic Illnesses?” IFSAC Webinar Series, White Oak MD. January 10, 2014. Available at: http://www.cdc.gov/foodborneburden/PDFs/ifsac‐webinar‐jan‐2014‐slides‐508c.pdf
Friedman CR, Hoekstra RM, Samuel M, Marcus R, Bender J, Shiferaw B, et al. Risk factors for sporadic Campylobacter infection in the United States: A case‐control study in FoodNet sites. Clin Infect Dis 2004; 38 Suppl 3:S285–96.
Hoffmann SA, Fischbeck P, Krupnick A, McWilliams M. Using expert elicitation to link foodborne illnesses in the United States to foods. J Food Prot 2007;70(5):1220–9.
Langer AJ, Ayers T, Grass J, Lynch M, Angulo FJ, Mahon BE. Nonpasteurized dairy products, disease outbreaks, and state laws—United States, 1993–2006. Emerg Infect Dis 2012;18(3):385–91.
Painter JA, Hoekstra RM, Ayers T, Tauxe RV, Braden CR, Angulo FJ, Griffin PM. Attribution of foodborne illnesses, hospitalizations, and deaths to food commodities by using outbreak data, United States, 1998– 2008. Emerg Infect Dis 2013;19(3):407–15.
Pires SM. Assessing the applicability of currently available methods for attributing foodborne disease to sources, including food and food commodities. Foodborne Pathog Dis 2013;10(3): 206‐213.
Scallan E, Hoekstra RM, Angulo FJ, Tauxe RV, Widdowson M‐A, Roy SL, et al. Foodborne illness acquired in the United States—major pathogens. Emerg Infect Dis 2011;17(1):7‐15.
Appendix A: Scheme used to categorize foods implicated in foodborne disease outbreaksa
a The food categories used in the analysis (grey boxes) were adapted from those in the comprehensive IFSAC food categorization scheme, which includes further partitioning of categories. Some categories were subsequently aggregated, as noted in the following footnotes. For more information on the food categorization scheme and the IFSAC project to improve it, visit http://www.cdc.gov/foodsafety/ifsac/projects/completed.html.
b Categories aggregated into Other meat and poultry c Categories aggregated into Other seafood d Categories aggregated into Other produce
Appendix B: Outbreaks and estimated total illnesses attributed to each food category during 1998‐2012 (Table 1) and ANOVA model‐estimated average outbreak size and percentages of illnesses attributed to each food category (Table 2).
Table 1. The number of outbreaks and estimated total outbreak‐associated illnesses* attributed to each food category during 1998‐2012 Land Animals Aquatic
Animals Plants
Beef Pork Chicken Turkey Other meat & poultry
Game Dairy Eggs Fish Other Sea‐food
Grains‐beans
Oils‐sugars
Fruits Seeded vegetables
Sprouts Vegetable row crops
Other produce
Salmonella Outbreaks Illnesses
47 1473
51 1098
114 2648
49 1308
6 84
2 8
24 793
140 5245
12 286
4 36
7 268
None 46 2510
34 4001
33 1266
10 412
18 1923
E. coli O157 Outbreaks Illnesses
97 1813
None 1 36
1 2
2 9
4 18
18 399
None None None None None 11 893
None 6 55
29 1029
1 8
Campylobacter Outbreaks Illnesses
2 5
1 27
24 230
5 44
2 6
1 2
106 3395
None 1 3
5 344
None 1 3
2 29
3 136
None 7 372
1 136
Listeria Outbreaks Illnesses
1 4
2 11
1 3
4 124
None None 12 124
None None None None None 1 147
None 2 26
1 10
None
*Includes outbreaks (and their estimated total illnesses) caused by a single confirmed and suspected etiology and attributed to a food that can be assigned to a single food category.
11
Table 2. Average number of illnesses per outbreak based on ANOVA model (without annual discounting), and estimated attribution percentages and 90% credibility intervals based on ANOVA model (with exponential discounting of outbreaks occurring from 1998‐2007).
Land Animals Aquatic Animals Plants Pathogen Beef Pork Chicken Turkey Other