42
Food Sectoral Overview Galway City and County Economic and Industrial Baseline Study

Food Sectoral Overview
Galway City and County Economic and Industrial Baseline Study

FOOD SECTORAL OVERVIEW
James Cunningham Brendan Dolan
David Kelly Chris Young
03/04/2015

Table of Contents
Executive Summary Overview of the Food Sector .............................................. 6
Global Overview of the Food Sector ................................................................ 9
1 Global Analysis .............................................................................................. 9 1.1 Market Size ..................................................................................................... 9
1.2 Household Spending ..................................................................................... 11
1.3 Global Organic Market .................................................................................. 11
1.4 Consumer Trends .......................................................................................... 13
1.5 Key Markets .................................................................................................. 14
1.6 Global Food Wastage .................................................................................... 14
1.7 Global Food Manufacturers ........................................................................... 14
1.8 EU Policy Objectives ..................................................................................... 15
1.8.1 Food Safety ................................................................................................... 15
1.8.2 Food Sustainability ........................................................................................ 15
National Overview of the Food Sector ........................................................... 17
2 National Analysis .......................................................................................... 17 2.1 Exports .......................................................................................................... 17
2.2 Key Markets .................................................................................................. 19
2.3 Household Spending ..................................................................................... 19
2.4 Artisan Food .................................................................................................. 22
2.5 National Organic Market ................................................................................ 22
2.6 National Food Trends .................................................................................... 22
2.7 National Food Wastage ................................................................................. 23
2.8 National Policy Objectives ............................................................................. 23
2.8.1 Food Safety ................................................................................................... 23
2.8.2 Food Sustainability ........................................................................................ 23
Regional and Local Overview of the Food Sector ........................................ 25
3 Regional Analysis ......................................................................................... 25 3.1 Galway Producers and Buyers Survey .......................................................... 25
3.2 Growing Galway Food ................................................................................... 26

3.3 Supporting Enterprise .................................................................................... 26
3.4 Artisan Food .................................................................................................. 27
3.5 Organic Food, Galway ................................................................................... 27
3.6 Galway Brand ................................................................................................ 32
3.7 Food Wastage ............................................................................................... 33
3.8 The Future of Galway’s Food Sector ............................................................. 33
4 References ................................................................................................... 34

THE WHITAKER INSTITUTE
FOOD SECTORAL OVERVIEW 5
Acknowledgements We wish to acknowledge the support of Liam Hanrahan Patricia Philbin, Sharon Carroll, Niamh
Farrell of Galway City Council and Alan Farrell and Brian Barrett of Galway County Council in
preparing this sectoral review.
Our Approach1 Our approach in undertaking this overview of the food sector was to take a global and national
perspective before focusing on the regional and local level. One of the main limitations we faced
preparing this sector review is the lack of quality and reliable data at the local level. The framing
of the global and national level overviews against publicly available local data provides a basis
and context to consider the future of the in Galway City and County.
1 The information contained in this overview has been compiled from many sources that are not all controlled by the Whitaker Institute. While all reasonable care has been taken in the compilation and publication of the contents of this resource, Whitaker Institute makes no representations or warranties, whether express or implied, as to the accuracy or suitability of the information or materials contained in this resource.

THE WHITAKER INSTITUTE
FOOD SECTORAL OVERVIEW 6
Executive Summary Overview of the Food Sector
Global Overview • Global food retail sales are approximately $4 trillion annually and are expected to reach
$5.3 trillion by 2017.
• Supermarkets and hypermarkets account for half of all annual food sales.
• Food retailing accounts for nearly 40% of all global retail sales.
• The top 15 global supermarket companies account for over 30% of world supermarket sales.
• Fresh food and agriculture produce accounts for 52.6% of the $4 trillion and packaged foods accounts for 47.4%.
• Milk and rice are the most important food commodities with their productivity value in international dollars being $187bn and $186bn respectively, followed by meats, beef, pork and chicken.
• The top 10 food and drink manufacturers in the world have a combined revenue of $438.7 billion and employ almost 1.3 million people.
• 13% of household spending in the US was on food, compared to 23% for households in Asia, 11.5% in Britain and 16 % in Ireland.
• The global market for organic produce in 2012 was nearly €64 billion with a total of 1.9 million organic producers with approximately 80% of these producers being located in developing countries.
• The global organic market in North America is expected to grow at a compound annual growth rate (CAGR) of 12% up to 2015 while Europe is also expected to grow at 12% owning the largest market share, valued at $28 billion.
• There is a combined total of 37.5 million hectares of organic farmland as of 2012, which is an increase of 200,000 hectares from 2011.
• The traceability and ingredient origin of products influence the purchasing decision making of today’s consumers.
• Although health and welfare are driving consumer spending habits, the global fast food industry is valued at $551 billion with an annual growth rate of 3.5%, employing 12,880.
• China is on track to becoming the largest food and grocery market in the world by 2018, with 32% of the global share of food and grocery retailing.
• An estimated 1.3 billion tonnes of food is wasted annually or 30% of global food production which is enough food to feed 2 billion people.

THE WHITAKER INSTITUTE
FOOD SECTORAL OVERVIEW 7
• The top three key changes in the business structure of global food manufacturers are
the addition of new products and services, improving operational efficiency of manufacturers and expansion into emerging markets.
National Overview • The food and drink industry of Ireland generates a turnover of almost €24 billion,
contributing to 230,000 jobs.
• The speciality food sector was valued at approximately €615 million in 2012 with about 350 producers employing more than 3,000 people.
• The value of food and drink exports in Ireland is valued at approximately €10 billion, representing a 40% increase since 2009 with revenues €3 billion higher.
• Ireland’s most valuable food exports are meat and meat preparations valued at €1.6 billion and €901 million in dairy products and bird’s eggs.
• For the Irish food sector, 42% of food and drink exports, worth €4.1 billion, go to the UK.
• Exports to other EU markets increased by 11% in 2013 valued at €3.2 billion with Germany, France and the Netherlands recording double digit growth.
• Irish households are spending €6,812 annually on food, accounting for 16% of their spending.
• The production of artisan food in Ireland accounts for approximately €500 million per year, by 300 producers.
• Some 1.3% of Irish land is farmed organically while the E.U. average is 5.4%.
• €2.38 billion is spent annually on fast food which is 38% of the Irish ‘eating out’ budget. In contrast only €687 million is spent in full service restaurants annually accounting for 11% of Irish people’s ‘eating out’ budget.
• Surplus food or ‘food waste’ costs the Irish economy €4 billion annually.
Regional and Local Overview • The City and County have a variety of Farmers markets, food festivals, and other food
promotion activities to benefit companies working in the food sector in Galway.
• There are 30 market locations in Galway City and County where food is being sold.
• The Growing Galway Food project identified 320 small food producers and 332 small food buyers.

THE WHITAKER INSTITUTE
FOOD SECTORAL OVERVIEW 8
• 53% of food producers employ between 1 and 2 people including the founder/owner.
• 40% of food producers ran their production from home.
• 70% of Galway food buyers surveyed by Growing Galway Food actively source local produce.
• There are 3,762 food and drink processing jobs based in the western region.
• Growing Galway Food a new initiative aimed at developing the food sector in Galway.
• First state backed organic farm is located in Athenry – 110 hectares.
• 19 Galway County farmers markets and 4 in Galway City.
• 356 restaurants are located in Galway city, the third highest concentration after Dublin and Cork.
• Galway has Failte Ireland nominated food ambassadors.
• 16 food festivals are held in Galway City and County annually.
• In conjunction with Bord Bia, training programmes, grants and the development of a
strong infrastructure and food culture within Galway supports the development and success of new food producers.
• 12 nominations for Ireland’s best artisan food and greengrocers came from Galway in 2014
THE WHITAKER INSTITUTE
FOOD SECTORAL OVERVIEW 9
Global Overview of the Food Sector
Global Overview
Introduction The global food and beverage sector comprises of farming, food production, distribution, retail
and catering. Accelerated economic growth and a rise in the global population have influenced
the increase in global food consumption (Pegasus, 2013). Global food retail sales are
approximately $4 trillion annually and are expected to reach $5.3 trillion by 2017. Supermarkets
and hypermarkets account for half of all food annual sales. Food retailing accounts for nearly
40% of all global retail sales (FAO, 2009). The top 15 global supermarket companies account
for over 30% of world supermarket sales (USDA, 2012).
1 Global Analysis 1.1 Market Size
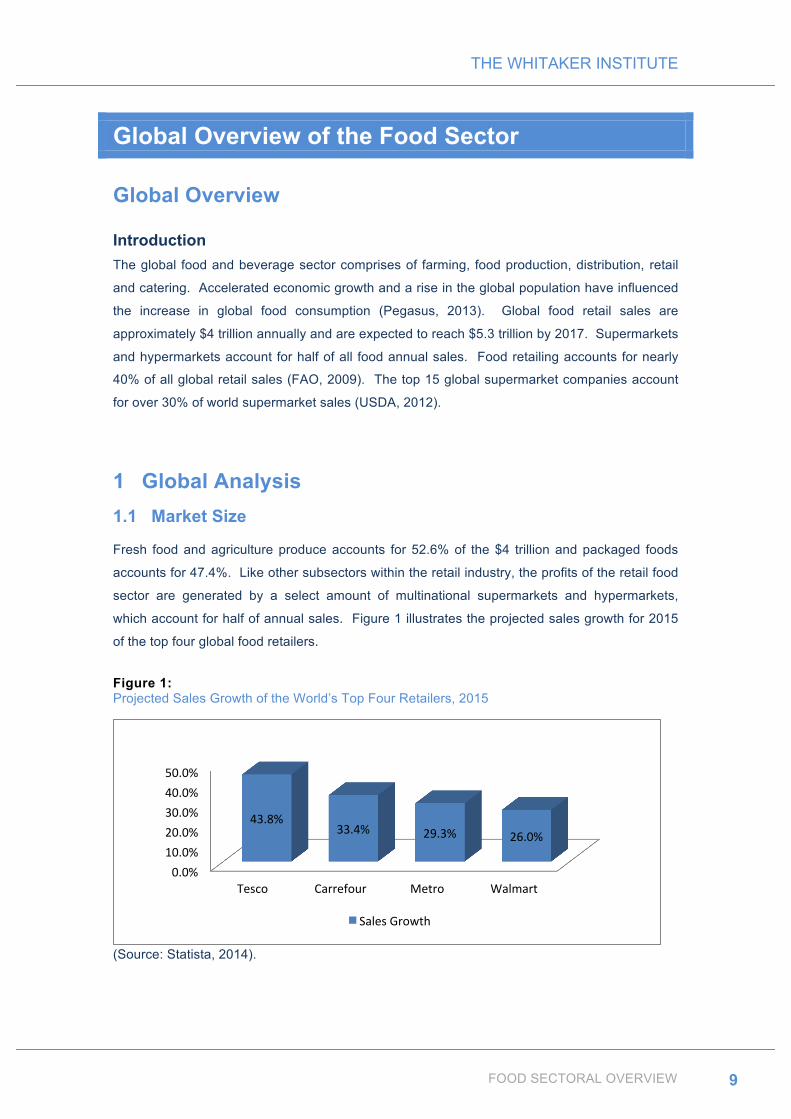
Fresh food and agriculture produce accounts for 52.6% of the $4 trillion and packaged foods
accounts for 47.4%. Like other subsectors within the retail industry, the profits of the retail food
sector are generated by a select amount of multinational supermarkets and hypermarkets,
which account for half of annual sales. Figure 1 illustrates the projected sales growth for 2015
of the top four global food retailers.
Figure 1: Projected Sales Growth of the World’s Top Four Retailers, 2015
(Source: Statista, 2014).
0.0% 10.0% 20.0% 30.0% 40.0% 50.0%
Tesco Carrefour Metro Walmart
43.8% 33.4% 29.3% 26.0%
Sales Growth

THE WHITAKER INSTITUTE
FOOD SECTORAL OVERVIEW 10
Figure 2 represents the 20 most important food commodities and their productivity value in
international dollars. Milk and rice are of the highest value, followed by the three meats, beef,
pork and chicken (FAO, 2012).
Figure 2: Top Production – World, 2012
(Adapted from FAO, 2012)
The top 10 food and drink manufacturers in the world have a combined revenue of $438.7
billion and employ almost 1.3 million people (Marketwatch, 2014). These corporations’ product
offerings and distributions channels influence diets and eating habits (see Table 1).
187 186
169 167
132
79
61 59 58 55 54 49 46 38 38 37 32 28 26 25
ProducCon (Int $ billion)

THE WHITAKER INSTITUTE
FOOD SECTORAL OVERVIEW 11
Table 1: Top 10 Global food manufacturers
Revenue Profits Employees
Nestlé S.A $103.5bn $11.2bn 333,000
Unilever Group $68.5bn $6.7bn 174,381
PepsiCo Inc. $66.4bn $6.7bn 274,000
The Coca-Cola Co. $46.9bn $8.6bn 130,600
Mondelez International Inc. $35.3bn $3.9bn 107,000
Mars Inc. $33bn N/A 60,000
Group Danone $29.3bn $2bn 104,642
Associated British Foods plc $21.1bn $837m 112,652
General Mills $19.9bn $1.8bn 43,000
Kellog Co. $14.8bn $1.8bn 30,277 (Adapted from Marketwatch, 2014)
1.2 Household Spending
In 2012 in the United States, households spent $6,599 on food, which is 2.2% more than 2011.
Some $3,921 was spent on food for the home while $2,678 was spent on dining out. This figure
accounted for 13% of a households spending, ranking third behind housing and transportation.
Households in Asia, in comparison, rank food first accounting for 23% of a households
spending, followed by education and housing (Plunkett Research, 2014). The average British
household spends £2953 on food a year which is 11.5% of their total spending ranking third
after housing, fuel and power, transport and recreation and culture (Office of National Statistics
UK, 2012).
1.3 Global Organic Market
The global market for organic produce in 2012 was nearly €64 billion with a total of 1.9 million
organic producers. Approximately 80% of these producers are located in developing countries.
Figure 3 illustrates the four biggest organic food producing countries (FIBL, 2014). There is a
huge demand in particular in Germany for organic produce (Department of Agriculture, Food
and the Marine, 2013). The global organic market is expected to grow to US$104.7 billion in
2015. North America is expected to grow at a compound annual growth rate (CAGR) of 12% up
to 2015 while Europe is also expected to grow at 12% owning the largest market share, valued
at $28 billion (Transparency, 2014). This growing market is driven by increasing health

THE WHITAKER INSTITUTE
FOOD SECTORAL OVERVIEW 12
concerns, increasing awareness of organic benefits, increased organic farming and the wider
variety of organic products (Transparency, 2014).
Figure 3: Countries with the Most Organic Producers
(Adapted from FIBL, 2014)
There is a combined total of 37.5 million hectares of organic farmland as of 2012, which is an
increase of 200,000 hectares from 2011. India has the largest number of organic producers.
Table 2 illustrates which continents have the most organic producers. The Oceania continent
has the most organic farmland with 32%, followed by Europe with 30% of the farmland. The
countries with the most organic farmland are Australia with 12 million hectares, Argentina with
3.6 million and then the United States with 2.2 million hectares (FIBL, 2014).
India Uganda Mexico Tanzania
600,000
189,610 169,707
148,610
Number of Organic Producers

THE WHITAKER INSTITUTE
FOOD SECTORAL OVERVIEW 13
Table 2: Regions with Organic Farmland
Region Agricultural Land (ha m) Other Areas * (ha m)
Africa 1.1 9.6
Asia 3.2 6.9
Europe 11.2 10.7
Latin America 6.8 2.9
Northern America 3.0 0.05
Oceania 12.2
(FIBL, 2014).
* (Wild collection, bee keeping, aquaculture, forests, grazed and non-agricultural land)
1.4 Consumer Trends
Consumers today, due to an era of mass communication through the internet and social media,
can more efficiently communicate, lobby and share information (foodnews, 2014). The
traceability and ingredient origin of products influence the purchasing decision making of today’s
consumers. Companies launching new products featuring the word ‘origin’ have increased 45%
from 2012 to 2013 in order to market their food product. Due to numerous negative headlines
across the world, quality is a growing consumer trend and there is a need to regain consumer
trust. Similar to ‘origin’; ‘natural’ terminology remains a strong marketable keyword alongside
‘healthy’. Three quarters of Europeans associate ‘natural’ with ‘healthy’ (Food Marketing &
Technology, 2014). It is estimated in the US that a fifth of all meal occasions are snacks, with
the healthy snacks market experiencing a 6.4% annual sales growth. It is predicted that this
trend will continue to grow.
Health and welfare continue to drive consumer spending habits. As the consumer becomes
more insightful they are increasingly searching for niche products that appeal to their individual
needs. Whether it is balanced nutrition for the elderly or sports solutions for the sports
enthusiast it creates opportunity for food innovators to pitch new ideas (Food Marketing &
Technology, 2014). There is a particular consumer response to products that enhance
immunity and give energy such as energy drinks and slow energy release foods.
Although health and welfare are driving consumer spending habits, the global fast food industry
is valued at $551 billion with an annual growth rate of 3.5%, employing 12,880 (IBISworld,
2014). The growth is due to low barriers to entry, response to consumer preferences,
improvement of the global economy and the rising international expansion of US-based fast

THE WHITAKER INSTITUTE
FOOD SECTORAL OVERVIEW 14
food chains. Although the industry is approaching saturation in some developed countries there
is still a substantial growth potential in emerging economies including Asia, Russia, South
America and India (Angelis, 2013).
1.5 Key Markets
The emerging Chinese market has changed from being a predominant manufacturer to a
substantial consumer (foodnews, 2014). China is on track to becoming the largest food and
grocery market in the world by 2018, with 32% of the global share of food and grocery retailing
(freshplaza, 2014). The Gulf region import 80%-90% of their food with projected imports of
US$53.1 billion by 2020 (Bord Bia, 2013). The Indian food industry was valued at US$135
billion in 2012 with a compound growth rate of 10%, predicting the value of the industry to reach
US$200 billion by 2015 (IBEF, 2014).
1.6 Global Food Wastage
An estimated 1.3 billion tonnes of food is wasted annually or 30% of global food production.
This is enough food to feed 2 billion people (eco-Business, 2014). There are also financial and
environmental impacts due to the wastage of food. In developing countries food wastage
occurs at the early stages of the food chain due to financial, managerial and technical
constraints. In developed countries the food is wasted at a later stage in the food chain mostly
due to customer behaviour (UNEP, 2014). Among wasted food, fruits and vegetables account
for 45%, cereals account for 30%, fish and seafood for 30% and dairy products at 20%
(Watrous, 2014). Innovative packaging solutions are key to waste reduction, in order to deal
with the increase in single households. Single-serve packages can cater for single households,
allowing for minimal waste.
1.7 Global Food Manufacturers
The top three key changes in the business structure of global food manufacturers are the
addition of new products and services, the improving operational efficiency of manufacturers
and expansion into emerging markets. In 2013, 35% of food manufacturers worldwide expected
to increase their workforce by 2%. The countries offering the highest growth potential for food
manufacturers are the U.S, Singapore, Taiwan and Hong Kong (Culrav, 2013).

THE WHITAKER INSTITUTE
FOOD SECTORAL OVERVIEW 15
1.8 EU Policy Objectives
1.8.1 Food Safety The EU integrated approach to food safety aims to insure a high level of food safety, animal
health, animal welfare and plant health within the European Union through coherent farm-to-
table measures and adequate monitoring, while ensuring the effective functioning of the internal
market.
To implement this approach, the following actions have been identified:
• Assure effective control systems and evaluate compliance with EU standards.
• Manage international relations with third world countries and international organisations.
• Manage relations with the European Food Safety Authority (EFSA) and ensure science-
based risk management.
EU food safety policy establishes clear control standards as regards food and food product
hygiene, animal health and welfare, plant health and preventing the risk of contamination from
external substances, with specific rules on appropriate labelling for these foodstuffs and food
products. EU food safety principles, in line with the integrated approach 'From the Farm to the
Fork,' specifically include transparency, risk analysis and prevention, the protection of consumer
interests and the free circulation of safe and high-quality products within the internal market and
with third countries. The European Food Safety Authority (EFSA) gives independent scientific
advice to the European Commission on all matters directly or indirectly related to food safety.
1.8.2 Food Sustainability
The Europe 2020 Strategy - A resource-efficient Europe calls for an increase in resource
efficiency, to: "…find new ways to reduce inputs, minimise waste, improve management of
resource stocks, change consumption patterns, optimise production processes, management
and business methods, and improve logistics."
The areas of action that the European Commission have identified, through public consultation
in 2013, around the issue of sustainable food are the following:
• Better technical knowledge on the environmental impacts of food
• Stimulating sustainable food production
• Promoting sustainable food consumption
• Reducing food waste and losses

THE WHITAKER INSTITUTE
FOOD SECTORAL OVERVIEW 16
• Improving food policy coherence
(European Commission, 2013)
In April 2014, representatives from across Europe’s food chain and the NGO community
published the declaration ‘Actions towards a more sustainable European food chain’,
encouraging EU policy makers to support a more cohesive approach to safeguarding the
sustainability of food systems for future generations (Stakeholder Dialogue Group on Food
Sustainability, 2014).

THE WHITAKER INSTITUTE
FOOD SECTORAL OVERVIEW 17
National Overview of the Food Sector
National Overview
Introduction The food and drink industry of Ireland generates a turnover of almost €24 billion. This sector
contributes to 230,000 jobs (IBEC, 2014). The food industry of Ireland has begun to grow after
the economic downturn, with a 5% increase in the number food businesses being established
within the last five years, accounting for 46,000 businesses (FSAI, 2014).
The speciality food sector was valued at approximately €615 million in 2012 with about 350
producers employing more than 3,000 people (CEDRA, 2014). CEDRA (Commission for the
Economic Development of Rural Areas) suggests that increasing the share of the national food
grocery and foodservice markets accounted for by speciality food from 3% to 6% would result in
the circulation of over €2 billion in the local economy. Growth prospects for this sector are
positive, driven by increased consumer interest in the provenance of food, environmental
concerns, health and a desire to support the local economy.
2 National Analysis 2.1 Exports
The value of food and drink exports in Ireland is valued at approximately €10 billion,
representing a 40% increase since 2009 with revenues €3 billion higher (Bord Bia, 2014). An
export target of €12 billion has been set for 2020. Two thirds of Ireland’s exports are by
domestic companies. The UK accounts for 42% of these exports, 32% to the rest of Europe
and 26% to third world countries (IBEC, 2014). Figure 4 illustrates the Irish food exports
between January to June 2013 and January to June 2014. Ireland’s most valuable food exports
are meat and meat preparations valued at €1.6 billion and €901 million in dairy products and
bird’s eggs (CSO, 2014). This accounts for 80% of dairy and beef production. Over 70 retail
chains across Europe stock Irish beef with Ireland being the UK’s largest supplier (IBEC, 2014).
An estimated 80%-90% of food consumed in the Middle East is imported. The Irish food and
drink industry is set to double its exports to the Middle East by 2020, exceeding €500 million
(Bord Bia, 2013).

THE WHITAKER INSTITUTE
FOOD SECTORAL OVERVIEW 18
Figure 4: Irish Foods Exports, 2013-2014
(Adapted from CSO, 2014)
With respect to key imports figure 5 in comparison shows the Irish food imports between
January to June 2013 and January to June 2014. As can be seen from the graph, fruit and veg,
cereals and animal food are the largest imports into Ireland (CSO, 2014). The biggest increase
between the first six months of 2013 and 2014 were dairy products and eggs, while the largest
decrease in food imports was in animal food, followed by cereals and preparation.
0 200 400 600 800 1000 1200 1400 1600
Beverages
Animal Food
Coffee, Tea, Cocoa, Spices
Sugars, Honey & PreparaCon
Fruit & Veg
Cereals & PreparaCon
Fish, Crustaceans, Mollucs
Dairy Products & Eggs
Meat & Meat PreparaCon
Live Animals
475
130
200
63
121
146
260
866
1427
109
451
119
190
54
125
166
275
901
1587
134
Jan-‐Jun 2013 (€mil) Jan-‐Jun 2014 (€mil)

THE WHITAKER INSTITUTE
FOOD SECTORAL OVERVIEW 19
Figure 5: Irish Food Imports, 2013-2014
(Adapted from CSO, 2014).
2.2 Key Markets
For the Irish food sector, 42% of food and drink exports, worth €4.1 billion, go to the UK.
Exports to other EU markets increased by 11% in 2013 valued at €3.2 billion with Germany,
France and the Netherlands recording double digit growth. Trade to international markets
exceeded €2.6 billion with China growing by more than 40%, with values reaching €390 million
in 2013 making it Ireland’s sixth largest market, driven by pork and dairy exports (Bord Bia,
2014).
2.3 Household Spending
In 2010 Irish households were spending €6,826 annually on food, accounting for 16.2% of their
spending. This accounts for 1.9% reduction in food spending from 2005 (CSO, 2010). Figure 6
illustrates the average Irish household spending, compared to Asia, U.S. and the U.K.
52
386 301
108
515 528
200 193
516
310
66
416 406
115
485 537
179 201
393 324
Irish Food Imports
Jan-‐Jun 2013 (€mil) Jan-‐Jun 2014 (€mil)

THE WHITAKER INSTITUTE
FOOD SECTORAL OVERVIEW 20
Figure 6: The Percentage of Spending on Food
(Adapted from CSO, 2010; U.S. Bureau of Labor Statistics, 2012; Statistics South Africa, 2011;
Plunkett Research, 2014)
From the CSO’s Household Budget Survey 2009/10 (the most recent data available), it was
found that the west region’s household expenditure on food was in line with the state average.
Dublin and the mid-east regions spent the most on food, with the south east region spending by
far the least amount on food on average (See Figure 7 and Table 3).
Figure 7: Household Budget Survey 2009/2010
(CSO Household Budget Survey, 2010)
0.0%
5.0%
10.0%
15.0%
20.0%
25.0%
United States
Ireland South Africa Asia UK
12.7% 16.2%
12.8%
23%
11.5%
Percentage of Income Spent on Food
0.00%
5.00%
10.00%
15.00%
20.00%
Border Dublin Mid East
Mid West
Midland South East
South West
West State
16.67% 18.22% 18.61%
17.05% 17.18% 15.51%
18.18% 17.48% 17.56%
% Of Household Expenditure on Food

THE WHITAKER INSTITUTE
FOOD SECTORAL OVERVIEW 21
Table 3: Breakdown of Household Expenditure by Region 2009/2010
Item Description Border Dublin Mid East Mid West Midland South East South West
West State
Total food 124.61 136.21 139.16 127.48 128.43 115.94 135.95 130.70 131.28 Total drink & tobacco 37.66 45.60 35.14 42.13 33.72 31.18 41.19 36.31 39.48 Total clothing & footwear
34.61 46.28 43.24 40.26 33.94 29.72 42.22 37.69 40.11
Total fuel & light 38.62 33.45 36.15 34.35 36.31 35.62 34.96 36.47 35.35 Total housing (incl. rent & mortgage)
126.96 192.61 169.86 117.64 122.17 113.79 130.05 125.99 147.73
Total household non-durable goods
15.14 16.77 17.53 17.29 16.68 15.51 16.25 17.18 16.49
Total household durable goods
25.56 33.47 33.65 29.77 26.64 28.25 28.75 29.00 30.06
Total transport 121.49 114.30 134.80 107.81 109.68 100.55 121.31 116.43 116.31 Total miscellaneous goods, services and other expenditure
223.02 302.94 282.08 244.27 197.12 211.57 254.44 209.15 253.81
Total household expenditure
747.67 921.63 891.60 761.01 704.69 682.13 805.11 738.91 810.61
(CSO Household Budget Survey, 2010)

THE WHITAKER INSTITUTE
FOOD SECTORAL OVERVIEW 22
2.4 Artisan Food
The production of artisan food in Ireland accounts for approximately €500 million per year, by
300 producers. Some 50 of these producers are farmhouse cheese producers. Holland, in
comparison, has over 100 cheese producers identifying the potential growth within the market
(Teagasc, 2014). The growth and development of the farmer’s markets in Ireland generates an
annual turnover in excess of €10 million. Seven out of ten Irish consumers are consciously
buying food in order to support the local economy. 69% of customers stated that the use of the
words ‘Irish’ and ‘local’ are influencing factors when purchasing food (Bord Bia: Just ask 2013
campaign survey).
2.5 National Organic Market
Some 1.3% of Irish land is farmed organically while the E.U. average is 5.4%. The government
has set a target of 5%. Over 58,000 hectares is farmed organically in Ireland by 1,721
registered farmers. The organic market in Ireland is valued at €98 million which is up from €63
million in 2004, while the E.U. market has quadrupled since then to a value of €20 billion
(Organic Farming, 2014). Ireland imports up to 70% of its organic commodities, signifying the
scope for expanding the domestic organic market (WDC, 2014).
2.6 National Food Trends
A new wave of restaurants branding themselves as Irish restaurants are opening nationwide,
emphasising a culinary confidence within Ireland. Craft and farmhouse butters are becoming a
popular trend as well as craft beers. The popularity of ‘nose-to-tail cooking’ is increasing within
restaurants, driven by the demand for more economical and less wasteful cooking methods
(Fáilte Ireland, 2014). Seaweed sales in Ireland are becoming more popular with Ireland’s
seaweed sector generating €18 million annually (BIM, 2014).
Fast food is still a growing trend in Ireland. According to a recent Bord Bia study, some €2.38
billion is spent annually which is 38% of the Irish ‘eating out’ budget. In contrast only €687
million is spent in full service restaurants annually accounting for 11% of Irish people’s ‘eating
out’ budget. This is driven by the expansion of foreign chains as well as the use of mobile
technology used for ordering online (Murphy, 2014).

THE WHITAKER INSTITUTE
FOOD SECTORAL OVERVIEW 23
2.7 National Food Wastage
Surplus food or ‘food waste’ costs the Irish economy €4 billion annually. This occurs at all
levels of the food chain, from farmers to households to restaurants to retailers. A quarter of a
million tonnes of this wastage come directly from manufacturers and groceries. Food banks in
Ireland are too small to deal with this surplus of food making for a serious gap in the
infrastructure (Bia Food Initiative, 2014). Irish restaurants waste nearly 64,000 tonnes of food a
year accounting for losses of €125 million, with an average waste per restaurant at 4.5 tonnes,
costing €8,840 per year (McGuire, 2011).
2.8 National Policy Objectives
2.8.1 Food Safety
The Department of Agriculture, Food and the Marine employs over 2,000 people in the areas of
food safety and quality control. The Food Safety Authority of Ireland (FSAI) looks to ensure the
highest standards of food safety, consumer protection and animal and plant health, with the
FSAI’s primary focus to assist the food industry to achieve good hygiene standards and comply
with the law, and ensuring that companies’ production does not impact on greenhouse gas
emissions, water quality, biodiversity or fish stocks. The Minister for the DAFM recently
announced increases in the expenditure budget for food safety and animal health and welfare
with a provision of some €82 million overall, including €35 million for TB & Brucellosis
eradication, to meet standards to maintain and enhance Ireland’s international reputation for the
quality of its products (Department of Agriculture, Food and the Marine, 2015).
2.8.2 Food Sustainability
Food Sustainability is a priority area for the Government, as it is at an EU and global level. The
focus is on sustainable, competitive and efficient agri- & marine food production and processing
which includes: land-use optimisation, forestry and non-food crops; wild fish harvesting and
aquaculture; and the manufacture of safe, value added and innovative foods. The Department
for Agriculture, Food and the Marine launched in November 2011, two Industry led strategic
research agenda’s in relation to food sustainability: Stimulating Sustainable Agricultural
Production through Research and Innovation (SSAPRI) and Food Research Ireland (FRI). The
department is looking to develop stronger linkages and collaborations between research
institutes and industry organisations, such as Food for Health Ireland, so that the activities of
research institutions are grounded in the downstream requirements of a competitive food

THE WHITAKER INSTITUTE
FOOD SECTORAL OVERVIEW 24
industry. An example of this is the recently announced Teagasc - UCC Strategic Alliance in
Food Research.
The Origin Green Sustainability Charter developed by Bord Bia is an ongoing voluntary
programme that seeks to demonstrate the commitment of Irish food and drink manufacturers,
both large and small, to operate in the most sustainable manner possible. This initiative offers a
structure that allows individual companies to communicate key sustainability issues, set targets
and regularly report progress in achieving short, medium and long term goals. In 2013, 60% of
food and drink exports were supplied by companies who are verified members of Origin Green
(Department of Agriculture, Food and the Marine, 2014).

THE WHITAKER INSTITUTE
FOOD SECTORAL OVERVIEW 25
Regional and Local Overview of the Food Sector
Regional and Local Overview
Introduction
The food sector of Galway is a thriving industry. The City and County have a variety of
Farmers’ markets, food festivals, and other food promotion activities to benefit companies
working in the food sector in Galway. There are 30 market locations in Galway City and County
where food is being sold. The Growing Galway Food project identified 320 small food
producers and 332 small food buyers. The results of the online survey undertaken by the
Growing Galway Food project show that almost 70% of the buyers surveyed, actively source
local produce. There are 3,762 food and drink processing jobs based in the western region
(Galway, Mayo and Roscommon).
3 Regional and Local Analysis 3.1 Galway Producers and Buyers Survey
In January 2014, Growing Galway Food invited small food producers as well as retail and
hospitality food buyers to participate in an online survey of food producers and buyers in
Galway as part of its aims to develop a county wide strategy for food in Galway. Some of the
main findings of this survey are presented below.
Findings from Growing Galway Food Survey of Food Producers:
• Of the 215 food producers contacted, the survey received a response rate of 38.6% (n=83),
with the respondents spread widely throughout the county.
• 53% employ between 1 and 2 people (including themselves), with a further 34% employing
between 3 and 10 people.
• Almost half of the companies that responded were in business for more than 5 years (48.8%)
• 43.2% produced their product in their own purpose built premise, and 40.7% ran their
production from home.
• 32.5% of respondents sell their product to customers in Galway only, with only 25% selling
nationwide and 11.3% having an international customer base.
• 48.1% are registered with Slow Food Galway, 38.9% with Bord Bia, 37% with Galway CEB
Food Network, and 54.9% registered on ‘Made In Galway’ directory.

THE WHITAKER INSTITUTE
FOOD SECTORAL OVERVIEW 26
Findings from Growing Galway Food Survey of Food Buyers:
• Of the 210 food buyers contacted, the survey received a response rate of 21% (n=44), with
half of the respondents situated in the city. Food buyer respondents include hospitality,
catering, restaurants, specialty retailers, local Supervalus, but not large retail chains.
• 59.5% of respondents worked in the hospitality sector, 19% were food providers and 14.3%
retailers.
• 81.3% buy direct from local food producers, but this accounts for only 10.9% of their food
spend
• 68.2% actively source food producers based in Galway
3.2 Growing Galway Food
Growing Galway Food is a new initiative aimed at developing the food sector of Galway. It
proposes to foster cooperation and cohesion amongst food producers and to develop the
relationship with food producers and retailers (IHF, 2014). The initiative is funded by Galway
Rural Development Company, Forum Connemara, Comhair na nOileán and Galway County
Council and is the first county and city wide initiative for the small food production sector. In
October 2014, Growing Galway Food released an Information Pack, a user friendly up to date
point of reference for new and existing food producers. It includes information and contacts in
the areas of the support agencies, legislative agencies, new product development, packaging
and equipment suppliers, routes to market, food safety training providers, as well as kitchen
facilities available for rent. It includes a list of Farmers’ Markets that take place in County
Galway and a listing of Annual Festivals and food related events.
3.3 Supporting Enterprise
Due to the high density of multinationals in Galway, the potential for new start-up businesses is
substantial. The LEO in collaboration with Enterprise Ireland has been providing exposure and
opportunities for start-up food producers through the promotion of showcase events such as
Galway Food Festival. In conjunction with Bord Bia, training programmes, grants and the
development of a strong infrastructure and food culture within Galway supports the
development and success of new food producers (Galway Food Festival, 2015). Guidance was
provided with regards to the registering of a new food business, food product development, food
safety, labelling regulations, traceability, the food recall process and dealing with inspections
(FSAI, 2014).

THE WHITAKER INSTITUTE
FOOD SECTORAL OVERVIEW 27
3.4 Artisan Food
Several nominations for Ireland’s best artisan food and greengrocers come from Galway. Table
4 shows the Galway nominations, highlighting the popularity of this niche market in Galway.
Table 4: Galway’s Nominations for Best Artisan Food and Greengrocers, 2014
Best Artisan Food & Greengrocer Town
Centra Dublin Road Tuam
Colleran’s Galway Galway City
Deacy’s Galway City
Decobake Galway Eglington Street
Ernie’s (fruit, veg and fish shop) Galway City
McCambridge’s of Galway Galway City
Molloy’s Pantry Galway City
Mortons of Galway Salthill
Seamus Kelly Butchers Clifden
Sheridans Cheesemongers Galway Galway
Standun Spiddal
The Connemara Hamper Clifden
(Adpated from Select Stores, 2014).
3.5 Organic Food, Galway
The Galway market trades in organic food, Saturdays, Sundays and Bank holidays. Table 5
offers a list of farmers markets in Galway, and table 5 displays some of the organic food
producers that trade at this market.

THE WHITAKER INSTITUTE
FOOD SECTORAL OVERVIEW 28
Table 5: Organic Food Producers Galway Market
Food Stall Description
Coolfin Organic Bakery Organic Irish Breads
The Gourmet Offensive Organic Falafel
The Happy Loaf, Moyglass Bakery Organic sourdough, rye & spelt
Yummy Crepes Organic crepes
Sheridans Cheesemongers Organic fruit & veg (Adapted from galwaymarket, 2014).
The first State-backed organic farm in Athenry, Co. Galway is 110 hectares and demonstrates
that organic farming can succeed across all farm enterprises, including beef, sheep, dairying,
poultry and tillage. Beef production at the organic farm has been most profitable, delivery
incomes 50% higher than traditional farming due to the lower levels of production costs. The
farm is currently being modified into a research facility for organic farming (Department of
Agriculture, Food and the Marin, 2015; High Beam, 2015).
3.6 Galway County and City Food Markets
There are 19 food markets in operation in Galway County (see Table 6). Three of these have
successfully met the criteria for the Code of Good Practice for Farmers’ Markets. They include
the Kinvara Farmers Market, the Moycullen Market and the Roundstone Country Market (Bord
Bia, 2014) (see Table 6).
THE WHITAKER INSTITUTE
FOOD SECTORAL OVERVIEW 29
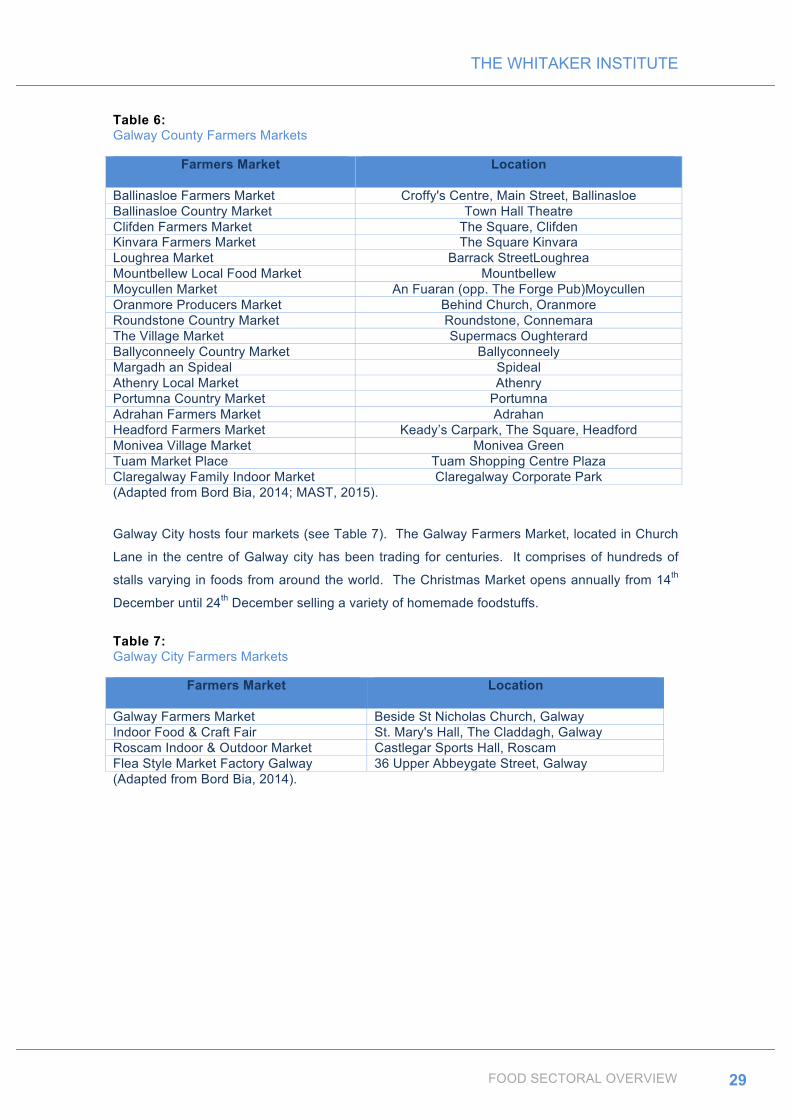
Table 6: Galway County Farmers Markets
Farmers Market Location
Ballinasloe Farmers Market Croffy's Centre, Main Street, Ballinasloe Ballinasloe Country Market Town Hall Theatre Clifden Farmers Market The Square, Clifden Kinvara Farmers Market The Square Kinvara Loughrea Market Barrack StreetLoughrea Mountbellew Local Food Market Mountbellew Moycullen Market An Fuaran (opp. The Forge Pub)Moycullen Oranmore Producers Market Behind Church, Oranmore Roundstone Country Market Roundstone, Connemara The Village Market Supermacs Oughterard Ballyconneely Country Market Ballyconneely Margadh an Spideal Spideal Athenry Local Market Athenry Portumna Country Market Portumna Adrahan Farmers Market Adrahan Headford Farmers Market Keady’s Carpark, The Square, Headford Monivea Village Market Monivea Green Tuam Market Place Tuam Shopping Centre Plaza Claregalway Family Indoor Market Claregalway Corporate Park (Adapted from Bord Bia, 2014; MAST, 2015).
Galway City hosts four markets (see Table 7). The Galway Farmers Market, located in Church
Lane in the centre of Galway city has been trading for centuries. It comprises of hundreds of
stalls varying in foods from around the world. The Christmas Market opens annually from 14th
December until 24th December selling a variety of homemade foodstuffs.
Table 7: Galway City Farmers Markets
Farmers Market Location
Galway Farmers Market Beside St Nicholas Church, Galway Indoor Food & Craft Fair St. Mary's Hall, The Claddagh, Galway Roscam Indoor & Outdoor Market Castlegar Sports Hall, Roscam Flea Style Market Factory Galway 36 Upper Abbeygate Street, Galway (Adapted from Bord Bia, 2014).

THE WHITAKER INSTITUTE
FOOD SECTORAL OVERVIEW 30
3.7 Galway Restaurants
Galway city has a huge choice of restaurants. According to recent data there are approximately
356 restaurants in Galway city (see Figure 8). Kilkenny, in comparison has 134 while Sligo has
93. It is possible to eat a wide variety of cuisines including Spanish, French, Italian, Mexican,
Asian and vegetarian. Some of the most popular restaurants include ‘Aniar Restaurant’ which is
Galway’s only Michelin starred restaurant, ‘Kai Café and Restaurant’ which supplies organic
food sourced from local producers, ‘White Cables’ serving traditional Irish dishes and ‘Park
House Restaurant’ centrally located in Galway’s Eyre Square (Galway Tourism, 2015).
Figure 8: Household Budget Survey 2009/2010
(Adapted from Tripadvisor, 2015).
3.8 Galway Food Trails and Tours
The Connemara Food Trail promotes Connemara Hill lamb, Galway Bay oysters, Connemara
salmon, freshly baked scones as well as popularising Connemara’s scenery. The trail promotes
signature dishes such as Connemara Lamb Stew and Renvyle House Connemara Mussel Pie
(Discover Ireland, 2011).
During the Galway Food Festival a Food Trail is offered which promotes taste offerings in select
restaurants and bars at very competitive prices (Galway Food Festival, 2015b). Food Tours
including seaside foraging at Silverstrand Beach, food tours to Inishmore, a food tour of South
0 200 400 600 800
1000 1200 1400 1600 1800 2000
Sligo Dublin Galway Cork Kilkeny Limerick Waterford
93
1,814
356 442
134 197 124
Number of Restaurants
THE WHITAKER INSTITUTE
FOOD SECTORAL OVERVIEW 31
Galway as well as the Galway Hooker Brewery tour prove to be popular events during the
festival.
3.9 Galway’s Food Ambassadors
Food Ambassadors are selected for their resounding passion and belief in Irish food and for
actively influencing and shaping the future of Irish cuisine and food tourism in their region. They
represent a diverse group from food service businesses and are members of the wider food
tourism community. They demonstrate commitment to implement change and have a strong
interest in developing food tourism agenda locally. They must have a food business operation
in business for a minimum of two years, a capacity to lead and make decision, a membership of
food and tourism organisations and have received accolades and awards.
Fáilte Ireland has nominated many Food Ambassadors from the Galway area. JP McMahon,
the proprietor of the Michelin star rated ‘Aniar’; Jacinta Dalton, a lecturer at the College of
Tourism and Arts at the Galway Mayo Institute of Technology and Fergus O’Halloran, General
Manager of Galway hotel ‘The Twelve’ are among some of Galways’ Food Ambassadors (Fáilte
Ireland, 2014).
3.10 Local Enterprise Office, Galway
In order to enhance Galway’s food sector the Local Enterprise Office (LEO) supports, promotes
and networks with small food businesses in Galway. The LEO by establishing and maintaining
networking opportunities for food businesses has presented a mechanism to help entrepreneurs
and start-up businesses with peer to peer learning and sharing their experiences. The
Networks enable individuals and enterprises to communicate issues of common concern,
redress isolation issues and provide a forum for advice and on-going support. The Networks
are intended to foster entrepreneurship and to develop the capability of start-up and small
businesses in Galway city and county. Such networking sessions have included:
Communicating on a Shoestring - for the Small food Business, Bord Bia and Supports,
Discussion around opportunities in the sector and Distribution - challenges and opportunities
(Local Enterprise Office, 2014).
The LEO is also involved in the establishment of other networking events that have a
participation fee. ‘Meetwest’ for example was a two-day national business networking forum
designed to connect people, create opportunities and promote business in the West. It caters
for companies across all sectors including agri-food and beverage industry of micro-enterprises,

THE WHITAKER INSTITUTE
FOOD SECTORAL OVERVIEW 32
small and medium-sized companies as well as large companies and multinationals (Meetwest,
2015).
The LEO also holds free Small Food Business Start-Up Seminars in Galway. These seminars
are designed to inform small food businesses and start-ups details of legislation regarding food
hygiene and safety, available resources from FSAI, labelling requirements, product recall
handling and setting up a food management system (Local Enterprise Office, 2014b).
The LEO, in order to promote online trading has launched an initiative to incentivise SMEs to
start investing in online trading. The vision is to reduce the number of online purchases being
made in overseas markets. The initiative come in the form of a grant of €2,500 or up to 50% of
the cost to spent on developing an online presence (In-tuition, 2014)
3.11 Galway Brand
Galway County Council in collaboration with Galway Rural Development, Teagasc, Bord Bia,
the Irish Organic Growers Association and Udaras na Gaeltachta are working to boost Galway’s
food sector. One such initiative is the development and promotion of the Galway brand.
Galway is already becoming marked as a good-food destination with its range of indigenous
artisan food producers and restaurants as well as its numerous food related festivals (Galway
2040, 2015). The development of an extensive database of local food producers will further
help with the development of Galway’s food sector by reducing entry barriers for small
producers and enhancing development plans. Table 8 displays a list of some of the food
festivals organised in the county.
Table 8: Galway Food Festivals
Food Festival Month Website
Galway Food Festival April http://galwayfoodfestival.com/ Connemara Muscle Festival
May https://www.facebook.com/bia.bofinne
Galway Sea Festival May/June www.galwayseafestival.com Galway County Show June Galway County Show Athenry Festival of Food – BiaLover
June www.Bialover.ie
Galway Garden Festival at Claregalway Castle
July http://www.galwaygardenfestival.com/
Athenry Agricultural Show and Home Industries
www.athenryagrishow.com
Traidphicnic July An Spideal

THE WHITAKER INSTITUTE
FOOD SECTORAL OVERVIEW 33
Claregalway Agricultural Show
August www.claregalwayagriculturalshow.ie
Leenane Autumnal Festival
September www.leenane-festival.com
Clarenbridge Oyster Festival
September www.clarenbridge.com
Galway International Oyster Festival
September www.galwayoysterfest.com
Bia Bo finne, Inis Boffin October www.biaboffine.ie https://www.facebook.com/bia.bofinne
Ballinasloe International October Fair and Festival
October www.ballinasloe.com
Annual Food & Craft Fair at the Black Box
December Contact the Local Enterprise Office www.localenterprise.ie/Galway
Galway Christmas Market
Dec http://galwaychristmasmarket.ie/
(Adapted from GRD, 2013).
3.12 Food Wastage
Galway and the Connaught region are considered the worst offenders regarding out-of-home
food waste (McGuire, 2011). A reduction in the amount of food wastage, however, was
implemented in University Hospital Galway, through the use of new food containers, improved
staff collaboration, recording of unserved meals and the reduction of automatically provided
condiments. This has provided the hospital with 4.9 tonnes less food wastage which is a 6%
food wastage reduction (Greenhealthcare, 2013). A recent pilot programme with participating
families from North Galway have succeeded in reducing their food wastage by 60%, giving a
projected annual saving of 1.3 tonnes of food valued at €3,500 (LAPN, 2014).
3.13 The Future of Galway’s Food Sector
Large-scale farms are predicted to produce food for direct selling to supermarkets in the most
efficient and environmentally friendly way. The development of the ‘Galway brand’ will allow
sales to international niche markets. Small-scale farms on the other hand are forecasted to
produce high value added niche products, engaging in small-scale processing of milk, meat,
cereals, fruit and vegetables marketed directly to consumers via farmers markets, hotels,
restaurants, B&Bs and local stores. Energy crops and wind farms are predicated to increase as
well as an increase in collaboration between tourism and farming (Galway 2040, 2014).
THE WHITAKER INSTITUTE
FOOD SECTORAL OVERVIEW 34
4 References Angelis, A.D. (2013) ‘Global fast food restaurant industry to increase by 4.2% per year through
2018’. In: ukfinance.yahoo. Available from https://uk.finance.yahoo.com/news/global-fast-food-
restaurant-industry-000000514.html [accessed 5 October 2014].
Bia Food Initiative (2014) ‘Matching surplus with scarcity’. In: Biafoodbank. Available from
http://www.biafoodbank.ie/index.php?option=com_content&view=article&id=104:irish-times-
24th-oct-2014-delivering-food-industry-excess-to-where-it-s-most-needed&catid=33:latest-
news&Itemid=101 [accessed 19 March 2015].
BIM (2014) ‘Developing seaweed farming to produce a high-value product’. In: bim. Available
from http://www.bim.ie/our-work/projects/developingirishseaweedfarmingforhighvalueproducts/
[accessed 5 October 2014].
Bord Bia (2013) ‘Ireland to double food exports to Middle East by 2020, Bord Bia’. In: bordbia.
Available from
http://www.bordbia.ie/corporate/press/2013/pages/IrelandtoDoubleFoodExportstoMiddleEastby2
020.aspx [accessed 4 October 2014].
Bord Bia (2014) ‘Irish food and drink exports approach €10 billion for the first time’. In: bordbia.
Available from
http://www.bordbia.ie/corporate/press/pages/ExportPerformanceProspects2014.aspx [accessed
Bord Bia (2014) ‘Farmers Markets Listing’. In: Bord Bia. Available from
http://www.bordbia.ie/consumer/aboutfood/farmersmarkets/pages/default.aspx [accessed 19
March 2015].
Commission for the Economic Development of Rural Areas (2014) ‘Energising Ireland’s Rural
Economy’ Available from http://www.agresearch.teagasc.ie/rerc/CEDRA/CEDRA_Report.pdf
[accessed 30 January 2015].
CSO (2010) ‘Household Budget Survey 2009-2010’. In: cso. Available from
http://www.cso.ie/en/media/csoie/releasespublications/documents/housing/2010/0910first.pdf
[accessed 19 March 2015].
CSO (2014) ‘Goods Exports and Imports’. In: cso. Available from
http://www.cso.ie/en/releasesandpublications/er/gei/goodsexportsandimportsjune2014/#.VFIgi8t
ya00 [accessed 30 October 2014].

THE WHITAKER INSTITUTE
FOOD SECTORAL OVERVIEW 35
Culrav (2013) ‘Global Food Industry : Market Analysis, Size, Share, Growth Drivers and
Forecast Report 2013-2014’. In: culrav. Available from http://www.culrav.org/pr/global-food-
industry-market-analysis-size-share-growth-drivers-and-forecast-report-2013-2014-available-at-
researchmoz-us.php [accessed 5 October 2014].
Department of Agriculture, Food and the Marine (2013) ‘Organic farming action plan’. In:
bordbia. Available from
http://www.bordbia.ie/consumer/aboutfood/organicfood/ActionPlan/Organic%20Farming%20Acti
on%20Plan.pdf [accessed 19 March 2015].
Department of Agriculture, Food and the Marine (2014) ‘Coveney Announces Increased Budget
Expenditure of €1.251 Billion in 2015’ Press Release. Available from
http://www.agriculture.gov.ie/media/migration/press/pressreleases/2014/october/PR147amende
d.pdf [Accessed 30 January 2015]
Department of Agriculture, Food and the Marine (2014) ‘Annual Report 2013’ Available from
http://www.agriculture.gov.ie/media/migration/publications/2014/AnnualReport2013121114.pdf
[Accessed 30 January 2015]
Department of Agriculture, Food and the Marine (2015) ‘Organic Farming Research at
Teagasc’. In: agriculture. Available from
http://www.agriculture.gov.ie/farmingsectors/organicfarming/research/teagasc/ [accessed 19
March 2015].
Discover Ireland (2011) ‘Connemara Food Trail’. In. discoverireland. Available from
http://www.discoverireland.ie/DI/media/DiscoverIreland/Places%20to%20Go/Connemara/PDFs/
Connemara-Food-Trail-2011.pdf [accessed 20 March 2015].
Eco-Business (2014) ‘Thirty per cent of world’s food wasted, new online platform seeks
savings’. In: ecobusiness. Available from http://www.eco-business.com/news/thirty-cent-worlds-
food-wasted-new-online-platform-seeks-savings/ [accessed 4 October 2014].
European Commission (2013) ‘Public consultation on the 'sustainability of the food system’’ In:
ec.europa. Available from http://ec.europa.eu/environment/eussd/pdf/food_results.pdf
[accessed 29 January 2015]
European Commission (2011) ‘Europe 2020 Strategy - A resource-efficient Europe’ In:
ec.europa. Available from http://ec.europa.eu/resource-efficient-
europe/pdf/resource_efficient_europe_en.pdf [accessed on 29 January 2015]

THE WHITAKER INSTITUTE
FOOD SECTORAL OVERVIEW 36
Fáilte Ireland (2014) ‘food trends’. In: Fáilte Ireland. Available from http://www.failteireland.ie/In-
Your-Sector/Food-Tourism-in-Ireland/Food-trends-in-Ireland.aspx [accessed 5 October 2014].
FAO (2009) ‘Food Retail’. In: FAO. Available from
http://www.fao.org/fileadmin/user_upload/tci/docs/AH4-Food%20Retail.pdf [accessed 29
October 2014].
FAO (2012) ‘Food and Agriculture commodities production’. In: faostat. Available from
http://faostat.fao.org/site/339/default.aspx [accessed 29 October 2014].
FIBL (2014) ‘Growing Organic Agriculture Sector Explores its Future’. In: fibl. Available from
http://www.fibl.org/en/media/media-archive/media-archive14/media-release14/article/growing-
organic-agriculture-sector-explores-its-future.html [accessed 30 October 2014].
Foodnews (2014) ‘Global Outlook 2014’. In: agra. Available from http://www.agra-
net.com/content/agra/ips/pdf/Marketing-HTML-PDFs/fnoutlook2014_web.pdf [accessed 30
October 2014].
FreshPlaza (2014) ‘Global (food & grocery) retail market sales to reach US$11 trillion by 2018
says new study’. In: freshplaza. Available from
http://www.freshplaza.com/article/125588/Global-(food-and-grocery)-retail-market-sales-to-
reach-US11-trillion-by-2018-says-new-study [accessed 5 October 2014].
FSAI (2014) ‘Free small food business start-up seminar in Galway’. Fsai. Available from
http://www.fsai.ie/news_centre/press_releases/business_startup_galway_29042014.html
[accessed 6 October 2014].
Galway2040 (2014) ‘Agriculture & Food’. In: galway2014. Available from
http://galway2040.ie/pillars/agriculture/ [accessed 4 October 2014].
Galway Food Fetival (2015) ‘Local Food Producer’. In: galwayfoodfestival. Available from
http://www.galwayfoodfestival.com/news [accessed 19 March 2015].
Galway Food Festival (2015b). ‘Taste Trail’. In: galwayfoodfestival. Available from
http://www.galwayfoodfestival.com/programme/food-trail [accessed 20 March 2015].
Galwaymarket (2014) ‘Food Stalls’. In: galwaymarket. Available from
http://www.galwaymarket.com/ [accessed 4 October 2014].

THE WHITAKER INSTITUTE
FOOD SECTORAL OVERVIEW 37
Greenhealthcare (2013) ‘Case Study UHG: Food Waste Reduction Programme’. In:
Greenhealthcare. Available from http://www.greenhealthcare.ie/wp-
content/uploads/2014/05/Case-Study-Food-Waste-UHG-revised.pdf [accessed 5 October
2014].
Galway Tourism (2015). ‘Top 5 restaurants’. In: galwaytourism. Available from
http://www.galwaytourism.ie/ptop-5-restaurants.html [accessed 20 March 2015].
GRD (2013) ‘Growing Galway Food Information Pack’. In: grd. Available from
http://www.grd.ie/blog/growing-galway-food-information-pack [accessed 5 March 2015].
High Beam (2015) ‘Farmers see how to get back to nature ; Hundreds of farmers turned up to
view the State-run organic farm in Athenry, Co Galway, reports Sen MacConnell’. In: highbeam.
Available from http://www.highbeam.com/doc/1P2-24690283.html [accessed 19 March 2015].
Ibec (2014) ‘Sector Profile’. In: fdii. Available from
http://www.fdii.ie/Sectors/FDII/FDII.nsf/vPages/Food_Industry_in_Ireland~sector-
profile?OpenDocument [accessed 30 October 2014].
IBEF (2014) ‘Indian Food Industry’. In: ibef. Available from http://www.ibef.org/industry/indian-
food-industry.aspx [accessed 4 October 2014].
Ibisworld (2014) ‘Global Fast Food Restaurants: Market Research Report’. In: ibisworld.
Available from http://www.ibisworld.com/industry/global/global-fast-food-restaurants.html
[accessed 5 October 2014].
IHF (2014) ‘Growing Galway Food’. In: ihf. Available from http://ihf.ie/content/growing-galway-
food [accessed 3 October 2014].
In-tuition (2014) ‘Local Enterprise Offices Offering Online Trading Vouchers’. In: in-tuition.
Available from http://www.in-tuition.ie/local-enterprise-offices-offering-online-trading-vouchers/
[accessed 21 March 2015].
LAPN (2014) ‘Case Study – Foodwaste – Galway’. In: localprevention. Available from
http://localprevention.ie/wp-content/uploads/2014/10/Milltown-Case-Study.pdf [accessed 19
March 2015].
Local Enterprise Office (2014). ‘Networking: Craft, Food and Technology/I.T.’. In:
localenterpriseoffice. Available from https://www.localenterprise.ie/Galway/Training-
Events/Networks/ [accessed 21 March 2015].

THE WHITAKER INSTITUTE
FOOD SECTORAL OVERVIEW 38
THE WHITAKER INSTITUTE
FOOD SECTORAL OVERVIEW 39
Local Enterprise Office (2014b). ‘Small Food Business Start-up Seminar, Galway’. In:
localenterpriseoffice. Available from
https://www.fsai.ie/news_centre/events/Small_Food_Business_Start-
Up_Seminar_Galway_28052014.html [accessed 21 March 2015].
Marketwatch (2014) ’10 companies that control the world’s food’. In: marketwatch. Available
from http://www.marketwatch.com/story/10-companies-that-control-the-worlds-food-2014-09-01
[accessed 30 October 2014].
MAST (2015) ‘MAST Market Listings – Galway’. In mast. Available from
http://www.mast.ie/Galway.html [accessed 19 March 2015].
McGuire, K. (2011) ‘Food waste: Prevention better than cure’. In: anygivenfood. Available from
http://anygivenfood.com/food-waste-prevention-better-than-cure/ [accessed 5 October 2014].
Meetwest (2014) ‘about meetwest’. In: meetwest. Available from http://meetwest.ie/ [accessed 3
October 2014].
Murphy, M. (2014) ‘Bord Bia Study Shows Fast Food Dominates Irish Foodservice Market’. In:
FFT. Available from http://fft.ie/index.php/3912/bord-bia-study-shows-fast-food-dominates-irish-
foodservice-market/ [accessed 19 March 2015].
Office of National Statistics UK (2012) Living Costs and Food Survey. Available from
http://www.ons.gov.uk/ons/dcp171766_337457.pdf [accessed 30 January 2015]
Organic Farming (2014) ‘Organic Farming: Newsletter’. In: teagasc. Available from
http://www.teagasc.ie/publications/2014/3227/Organic_Newsletter_July_2014.pdf [accessed 03
November 2014].
Pegasus (2013) ‘Global Food Market’. In: Pegasus. Available from
http://pegasusagritech.com/hydroponics/global-food-market/ [accessed 30 October 2014].
Plunkett Research (2014) ‘Introduction to the food & beverage Industry’. In: plunkettresearch.
Available from http://www.plunkettresearch.com/food-beverage-grocery-market-
research/industry-trends [accessed 4 October 2014].
Select Stores (2014) ‘Select Stores Dalkey Shortlisted The Irish Times Best Shops 2014’. In:
selectstores. Available from http://www.selectstores.ie/2014/08/select-stores-dalkey-short-list-
the-irish-times-best-shops-2014/ [accessed 19 March 2015].
THE WHITAKER INSTITUTE
FOOD SECTORAL OVERVIEW 40
Stakeholder Dialogue Group on Food Sustainability (2014) ‘Actions towards a more sustainable
European food chain’ Available from http://www.fooddrinkeurope.eu/uploads/press-
releases_documents/Declaration_Sustainability_of_Food_System.pdf [accessed 29 January
2015]
Statista (2014) ‘Forecasted sales growth of the world's leading 4 food retailers between 2010
and 2015’. In: statista. Available from http://www.statista.com/statistics/240549/forecast-for-
sales-growth-of-the-global-leading-food-retailers/ [accessed 29 October 2014].
Statistics South Africa (2011) ‘Income and Expenditure of Households 2010/2011’. In: beta2.
Available from http://beta2.statssa.gov.za/publications/P0100/P01002011.pdf [accessed 19
March 2015].
Teagasc (2014) ‘Artisan Food: Artisan Food in Ireland’. In: teagasc. Available from
http://www.teagasc.ie/ruraldev/artisan_food/artisan_food_in_ireland.asp [accessed 30 October
2014].
TheTwelveHotel (2014) ‘Galway on the way to being Top Foodie Town in Ireland’. In:
thetwelvehotel. Available from http://www.thetwelvehotel.ie/2014/5/2/Galway-on-the-way-to-
being-Top-Foodie-Town-in-Ireland [accessed 6 October 2014].
Transparency (2014) ‘Organic Food Market – Global Industry Size, Share, Trends, Analysis and
Forecasts 2012 – 2018’. In: transparencymarketresearch. Available from
http://www.transparencymarketresearch.com/organic-food-market.html [accessed 5 October
2014].
Tripadvisor (2015) ‘Best restaurants in Galway, Ireland’. In: tripadvisor. Available from
http://www.tripadvisor.ie/Restaurants-g186609-
Galway_County_Galway_Western_Ireland.html#EATERY_OVERVIEW_BOX [accessed 20
March 2015].
UNEP (2014) ‘Food waste facts’. In: unep. Available from
http://www.unep.org/wed/2013/quickfacts/ [accessed 4 October 2014].
U.S. Bureau of Labor Statistics (2012) ‘Consumer Expenditures in 2010: Lingering Effects of the
Great Recession’. In: bls. Available from
http://www.bls.gov/opub/reports/cex/consumer_expenditures2010.pdf [accessed 19 March
2015].

THE WHITAKER INSTITUTE
FOOD SECTORAL OVERVIEW 41
USDA (2012) ‘Global food industry’. In: USDA. Available from
http://www.ers.usda.gov/topics/international-markets-trade/global-food-markets/global-food-
industry.aspx [accessed 28 October 2014].
Watrous, M. (2014) ‘Ten Food Trends unveiled at I.F.T. 2014’. In: foodbusinessnews. Available
from
http://www.foodbusinessnews.net/articles/news_home/Consumer_Trends/2014/06/Ten_food_tr
ends_unveiled_at_IF.aspx?ID=%7BC8BEEAF6-9CD1-401B-9A19-972D66B243C4%7D&cck=1
[accessed 6 October 2014].
WDC (2014) ‘Organic Agri-Food’. In: wdc. Available from http://www.wdc.ie/regional-
development/organics/ [accessed 03 November 2014].

Whitaker Institute for Innovation & Societal Change
Cairnes Building National University of Ireland Galway
Galway Ireland
T: +353 (0)91 492817
E: [email protected] www.nuigalway.ie/whitakerinstitute


