Food sources of energy and nutrients in thediets of infants and toddlers in urban areas ofChina, based on one 24-hour dietary recallHuan Wang1, Liya Denney2*, Yingdong Zheng1, Gerard Vinyes-Pares3, Kathleen Reidy4, Peiyu Wang1
and Yumei Zhang1*
Abstract
Background: Food sources of nutrients in young children in China have been little investigated. The objective ofthis study was to understand feeding patterns of young children through an analysis of food sources of energy andnutrients in the diets of infants and toddlers living in urban areas in China.
Methods: This study was part of the cross-sectional study, Maternal Infant Nutrition Growth (MING). One 24-hdietary recall was completed for a total of 1409 children (infants 6–11 months, younger toddlers 12–23 months,and older toddlers 24–36 months) via face-to-face interviews with the primary caregivers. All food, beverage anddietary supplements that the child consumed on the previous day were recorded and processed with a databaseincluding data from Chinese Food Composition tables. All reported foods and supplements were assigned to oneof 83 food groups developed for the study. Percent contribution of each food group to nutrient intakes wascalculated.
Results: Children in all 3 age groups received a majority of energy (52 to 69 %) from few foods including infantformula or growing-up (fortified) milk, rice, noodles, pork and eggs, with rice becoming the number one source ofenergy by 24 months. Rice and noodles were not only top sources of energy (17 to 26 %) and carbohydrate(27 to 40 %) but also top sources of protein (13 to 16 %), iron (13 to 18 %) and zinc (11 to 18 %). Supplementsmade substantial contributions to intakes of vitamin A, zinc, iron and calcium. Salt added during home-cooking wasthe main source of sodium (60 to 80 %).
Conclusions: Few foods made up the core of the diets of infants and young toddlers living in urban areas inChina. Low nutrient-dense rice and noodles were top sources of many nutrients, which could potentially lead toinadequate intakes of some key nutrients.
BackgroundEarly childhood is a time when food preferences anddietary habits are being established. The dietary patternsestablished during this time often persist into adulthoodand have implications for developing diet-related chronicdiseases later [1], such as cardiovascular disease and dia-betes [2]. Knowledge about the sources of energy andnutrients in young children’s diets can help health pro-fessionals to gain a more complete understanding abouttheir diets and the specific strategies for improvement.
Food sources of energy and nutrients in young chil-dren have been studied in the US [3–6]. With a focus onthe US infant and toddler population, the Feeding In-fants and Toddlers Study (FITS) recently reported thesources of energy and 24 nutrients in detail and de-scribed shifts in major nutrient sources as children age[6]. Dietary sources of nutrients have also been studiedin pre-school children in Belgium and Sweden [7, 8]. Bycomparison, such studies in China are very limited. Todate, few published studies available in China only de-scribed the intake of one nutrient such as energy or fatsor iron with limited information for food sources [9–11].The current paper describes the major food sources of
energy and nutrients among infants and toddlers in China
* Correspondence: [email protected]; [email protected]é Research Centre, Lausanne, Switzerland1School of Public Health, Peking University, Beijing, ChinaFull list of author information is available at the end of the article
using data from the Maternal Infant Nutrition Growth(MING) study, in which one 24-h dietary recall was col-lected from infants and toddlers (6 to 35 months of age).
MethodsSample design and subjectsThe MING study methods and sample will be subse-quently described in detail. Briefly, the MING study was across-sectional study to investigate the dietary and nutri-tional status of pregnant women, lactating mothers andyoung children aged from birth up to 3 years. Infants andtoddlers were recruited from maternal and child care cen-tres in 8 tier 1 and tier 2 cities in China. Subjects were re-cruited randomly based on the child registration list ineach of the maternal and child care centres (two in eachcity) until the target number was reached. Final samplessizes in three subgroups were 444 children 6 to 11 months(infants), 476 children 12 to 23 months (younger toddlers)and 489 children 24 to 35 months (older toddlers).The study was conducted according to the guidelines in
the Declaration of Helsinki. All of the procedures involv-ing human subjects were approved by the Medical EthicsResearch Board of Peking University (No.IRB00001052-11042). Written informed consent was obtained from theprimary caregiver of each infant or toddler participating inthe study.
Data collection methodsOne 24-h dietary recall was collected for each child bytrained interviewers via face-to-face interviews with theprimary caregiver. Interviewers asked the primary care-giver about all food, beverages and supplements that thechild consumed on the previous day. Portions were esti-mated using measurement aids (including spoons, cupsand bowls) and a picture booklet of common foods con-sumed in China (designed for national nutrition survey bythe Centre of Disease Control in China). The informationcollected was then converted to weight in grams using aportion to weight conversion list for common foods. Useof nutrient supplements was also collected during theface-to-face interview with the primary caregiver as partof a general questionnaire. A list of dietary supplementscommonly used in China was used to code the supple-ment(s) reported. The primary caregiver was also encour-aged to bring the packing of the nutrient supplement tothe interviewer. The information collected included thename and brand of the supplement, age when supplementwas first given and the amount used.Food records were entered and processed with a food
composition database created for this study that includeddata from Chinese Food Composition (CFC) tables 2004& 2009 [12, 13] and branded baby food products and diet-ary supplements commonly consumed in China. CFCcontains information of 1773 foods with 36 nutrients. The
values for both beta-carotene and retinol were available inthe database, thus vitamin A was estimated in retinol ac-tivity equivalents using the following formula [14]: Retinolactivity equivalents = μg retinol + 1/2 (μg beta-caroteneequivalents/6).We did not collect data on the amount of human milk
fed, but simply the number of times the mother nursedduring the day and estimated the amount based on pub-lished literature [15]. For infants aged 6 to 11 months fedhuman milk as the sole milk source, the amount of humanmilk was assumed to be 600 mL/day; for partially breast-fed infants, the amount of human milk was estimated as600 mL/day minus the amount of formula or other milksconsumed. For breastfed toddlers aged 12 to 23 months,the amount of human milk was estimated as 89 mL perfeeding occasion; and for toddlers aged 24–35.9 months,the amount of human milk was estimated as 59 mL perfeeding occasion [15].
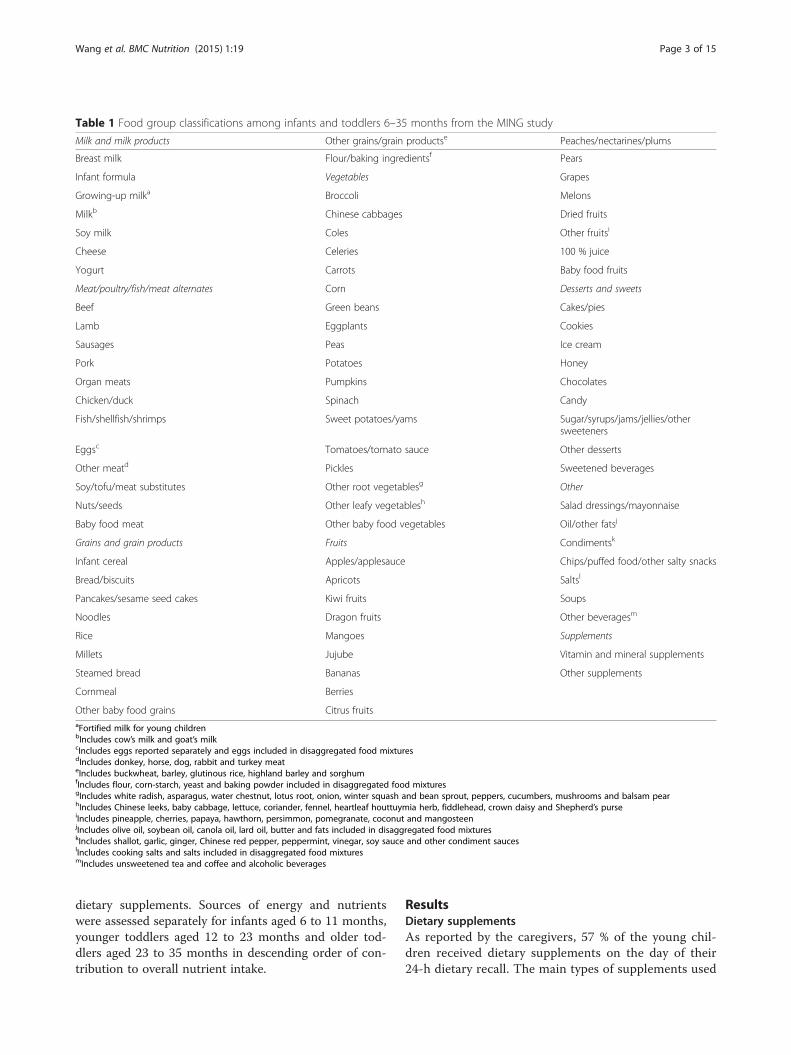
Analytic methodsA comprehensive listing of dietary sources of nutrientswas initially developed by Krebs-Smith and colleagues[16] and later expanded by other researchers [4, 17]. Tomake the results of the present study comparable withthe information obtained in other countries, the classifi-cations of food group were designed to be similar tothose used by Fox and colleagues [6], but at same timereflect the characteristics of the Chinese diet by havingtraditional, frequently consumed foods listed individuallysuch as noodles, steamed bread and Chinese cabbages.Thus, a list of 83 food groups including two for dietarysupplements were created based on similarities in nutri-ent content and role in the diet (Table 1).A total of 680 individual foods and supplements were re-
ported by the caregivers in this study. These foods andsupplements were assigned to one of the 83 groups except16 food mixtures that were infrequently consumed such ashamburgers, pizzas, dumplings or sushi, etc. The 16 foodmixtures were disaggregated into their ingredients, and theingredients were then assigned to one of the 83 groups.
Statistical analysisStatistical Analysis Software (version 9.2, 2008, SAS In-stitute, Inc, Cary, NC) was used to calculate the contri-bution of each food group to the overall intake of energyand nutrients. After all foods and supplements reportedwere assigned to one of the 83 groups, the weighted per-centage contribution of each food group for all infantsand toddlers was calculated by summing the amount ofa given nutrient provided by each food group for all in-dividuals and dividing by the total intake of that nutrientconsumed by all individuals from all foods and supple-ments. Only foods/food groups that contributed over1 % of the nutrient intake are represented including
Wang et al. BMC Nutrition (2015) 1:19 Page 2 of 15
dietary supplements. Sources of energy and nutrientswere assessed separately for infants aged 6 to 11 months,younger toddlers aged 12 to 23 months and older tod-dlers aged 23 to 35 months in descending order of con-tribution to overall nutrient intake.
ResultsDietary supplementsAs reported by the caregivers, 57 % of the young chil-dren received dietary supplements on the day of their24-h dietary recall. The main types of supplements used
Table 1 Food group classifications among infants and toddlers 6–35 months from the MING study
Milk and milk products Other grains/grain productse Peaches/nectarines/plums
Breast milk Flour/baking ingredientsf Pears
Infant formula Vegetables Grapes
Growing-up milka Broccoli Melons
Milkb Chinese cabbages Dried fruits
Soy milk Coles Other fruitsi
Cheese Celeries 100 % juice
Yogurt Carrots Baby food fruits
Meat/poultry/fish/meat alternates Corn Desserts and sweets
Other baby food grains Citrus fruitsaFortified milk for young childrenbIncludes cow’s milk and goat’s milkcIncludes eggs reported separately and eggs included in disaggregated food mixturesdIncludes donkey, horse, dog, rabbit and turkey meateIncludes buckwheat, barley, glutinous rice, highland barley and sorghumfIncludes flour, corn-starch, yeast and baking powder included in disaggregated food mixturesgIncludes white radish, asparagus, water chestnut, lotus root, onion, winter squash and bean sprout, peppers, cucumbers, mushrooms and balsam pearhIncludes Chinese leeks, baby cabbage, lettuce, coriander, fennel, heartleaf houttuymia herb, fiddlehead, crown daisy and Shepherd’s purseiIncludes pineapple, cherries, papaya, hawthorn, persimmon, pomegranate, coconut and mangosteenjIncludes olive oil, soybean oil, canola oil, lard oil, butter and fats included in disaggregated food mixtureskIncludes shallot, garlic, ginger, Chinese red pepper, peppermint, vinegar, soy sauce and other condiment sauceslIncludes cooking salts and salts included in disaggregated food mixturesmIncludes unsweetened tea and coffee and alcoholic beverages
Wang et al. BMC Nutrition (2015) 1:19 Page 3 of 15
were fish liver oil, multiple vitamin and mineralsupplements.
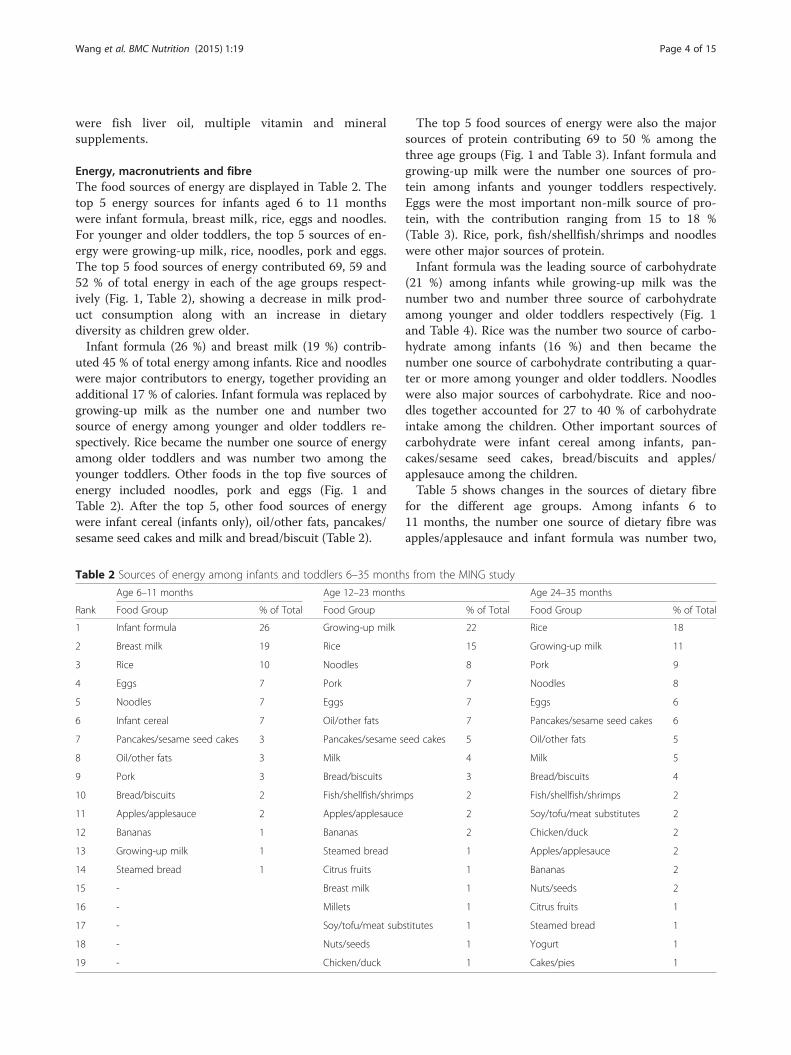
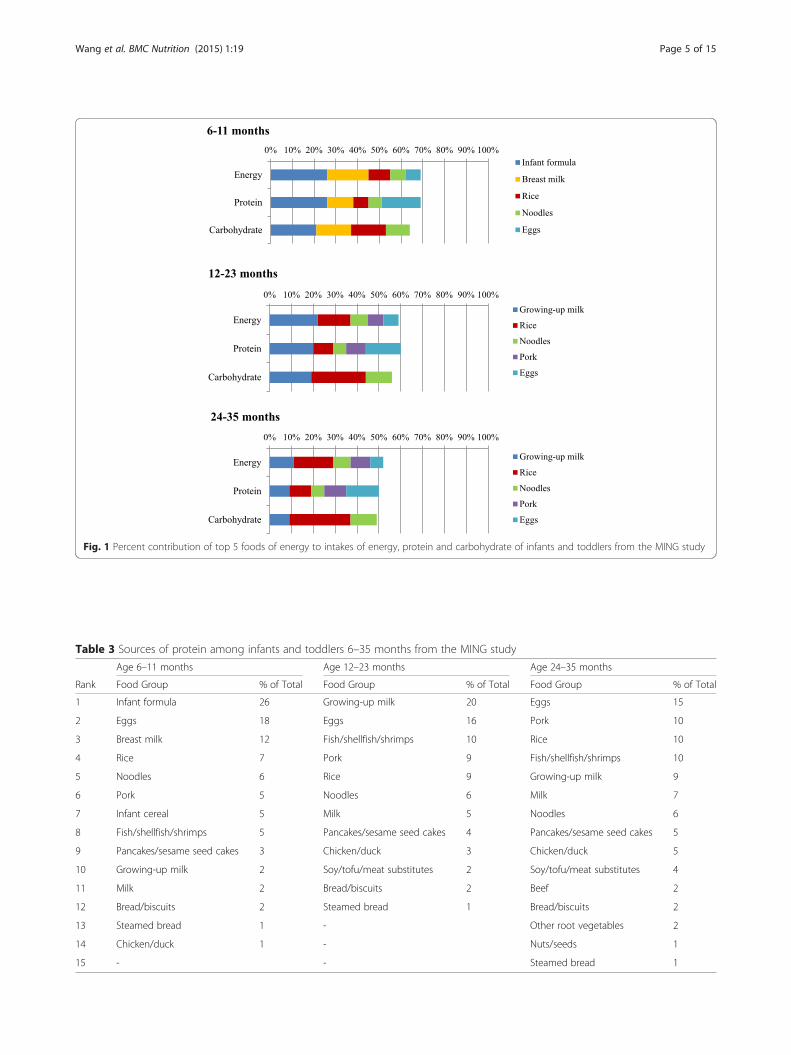
Energy, macronutrients and fibreThe food sources of energy are displayed in Table 2. Thetop 5 energy sources for infants aged 6 to 11 monthswere infant formula, breast milk, rice, eggs and noodles.For younger and older toddlers, the top 5 sources of en-ergy were growing-up milk, rice, noodles, pork and eggs.The top 5 food sources of energy contributed 69, 59 and52 % of total energy in each of the age groups respect-ively (Fig. 1, Table 2), showing a decrease in milk prod-uct consumption along with an increase in dietarydiversity as children grew older.Infant formula (26 %) and breast milk (19 %) contrib-
uted 45 % of total energy among infants. Rice and noodleswere major contributors to energy, together providing anadditional 17 % of calories. Infant formula was replaced bygrowing-up milk as the number one and number twosource of energy among younger and older toddlers re-spectively. Rice became the number one source of energyamong older toddlers and was number two among theyounger toddlers. Other foods in the top five sources ofenergy included noodles, pork and eggs (Fig. 1 andTable 2). After the top 5, other food sources of energywere infant cereal (infants only), oil/other fats, pancakes/sesame seed cakes and milk and bread/biscuit (Table 2).
The top 5 food sources of energy were also the majorsources of protein contributing 69 to 50 % among thethree age groups (Fig. 1 and Table 3). Infant formula andgrowing-up milk were the number one sources of pro-tein among infants and younger toddlers respectively.Eggs were the most important non-milk source of pro-tein, with the contribution ranging from 15 to 18 %(Table 3). Rice, pork, fish/shellfish/shrimps and noodleswere other major sources of protein.Infant formula was the leading source of carbohydrate
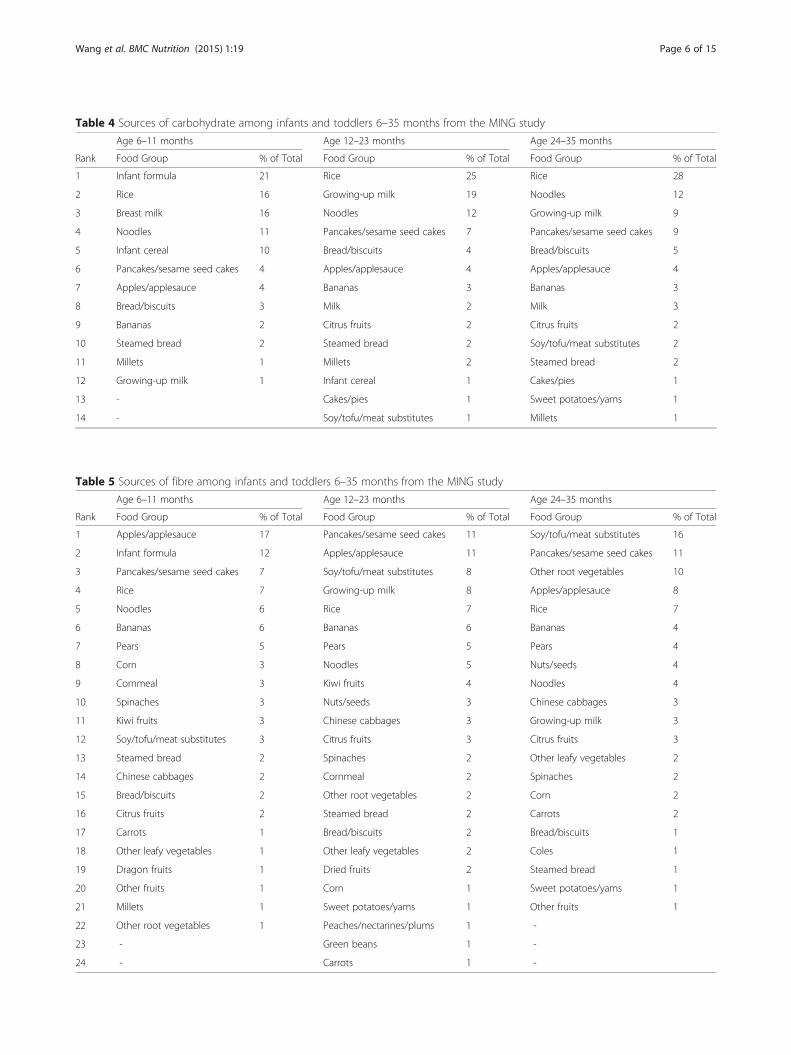
(21 %) among infants while growing-up milk was thenumber two and number three source of carbohydrateamong younger and older toddlers respectively (Fig. 1and Table 4). Rice was the number two source of carbo-hydrate among infants (16 %) and then became thenumber one source of carbohydrate contributing a quar-ter or more among younger and older toddlers. Noodleswere also major sources of carbohydrate. Rice and noo-dles together accounted for 27 to 40 % of carbohydrateintake among the children. Other important sources ofcarbohydrate were infant cereal among infants, pan-cakes/sesame seed cakes, bread/biscuits and apples/applesauce among the children.Table 5 shows changes in the sources of dietary fibre
for the different age groups. Among infants 6 to11 months, the number one source of dietary fibre wasapples/applesauce and infant formula was number two,
Table 2 Sources of energy among infants and toddlers 6–35 months from the MING study
Age 6–11 months Age 12–23 months Age 24–35 months
Rank Food Group % of Total Food Group % of Total Food Group % of Total
13 Steamed bread 2 Spinaches 2 Other leafy vegetables 2
14 Chinese cabbages 2 Cornmeal 2 Spinaches 2
15 Bread/biscuits 2 Other root vegetables 2 Corn 2
16 Citrus fruits 2 Steamed bread 2 Carrots 2
17 Carrots 1 Bread/biscuits 2 Bread/biscuits 1
18 Other leafy vegetables 1 Other leafy vegetables 2 Coles 1
19 Dragon fruits 1 Dried fruits 2 Steamed bread 1
20 Other fruits 1 Corn 1 Sweet potatoes/yams 1
21 Millets 1 Sweet potatoes/yams 1 Other fruits 1
22 Other root vegetables 1 Peaches/nectarines/plums 1 -
23 - Green beans 1 -
24 - Carrots 1 -
Wang et al. BMC Nutrition (2015) 1:19 Page 6 of 15
followed by pancakes/sesame seed cakes, rice, noodles,bananas. Among toddlers, in addition to apples/apple-sauce, pancakes/sesame seed cakes, and soy/tofu/meatsubstitutes were the most important sources of dietaryfibre. Despite being commonly consumed, various leafyvegetables including Chinese cabbages and spinach arenot significant contributors to dietary fibre amongtoddlers.Infant formula and breast milk together contributed
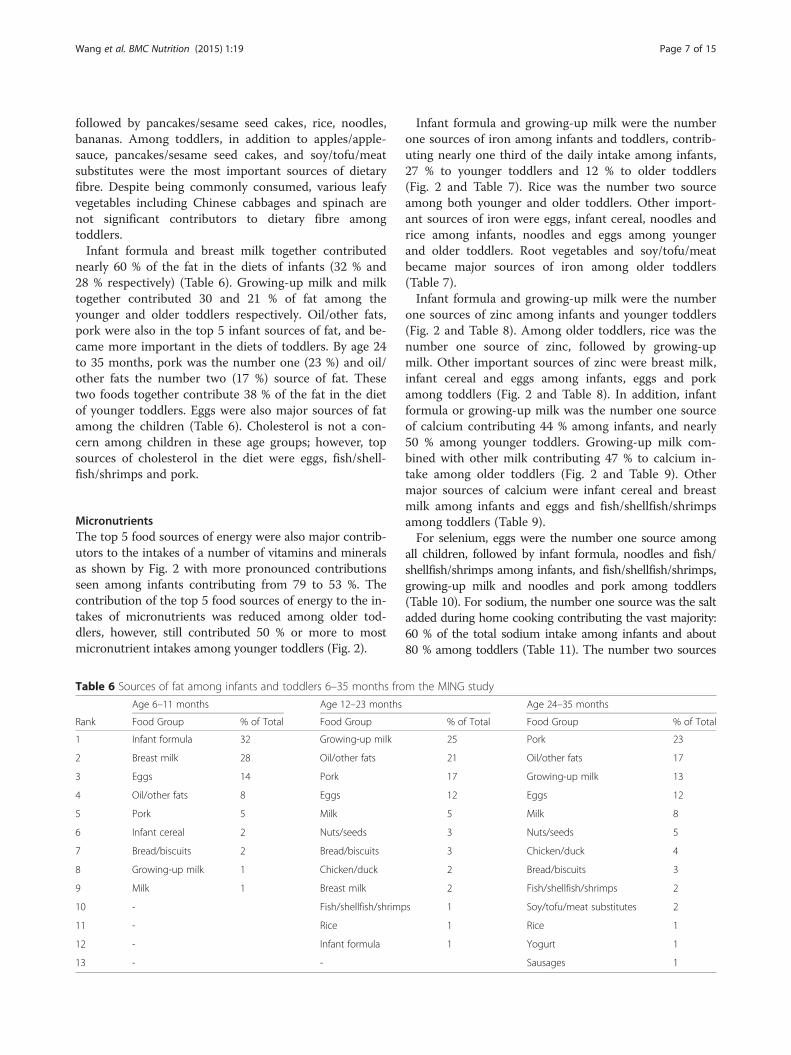
nearly 60 % of the fat in the diets of infants (32 % and28 % respectively) (Table 6). Growing-up milk and milktogether contributed 30 and 21 % of fat among theyounger and older toddlers respectively. Oil/other fats,pork were also in the top 5 infant sources of fat, and be-came more important in the diets of toddlers. By age 24to 35 months, pork was the number one (23 %) and oil/other fats the number two (17 %) source of fat. Thesetwo foods together contribute 38 % of the fat in the dietof younger toddlers. Eggs were also major sources of fatamong the children (Table 6). Cholesterol is not a con-cern among children in these age groups; however, topsources of cholesterol in the diet were eggs, fish/shell-fish/shrimps and pork.
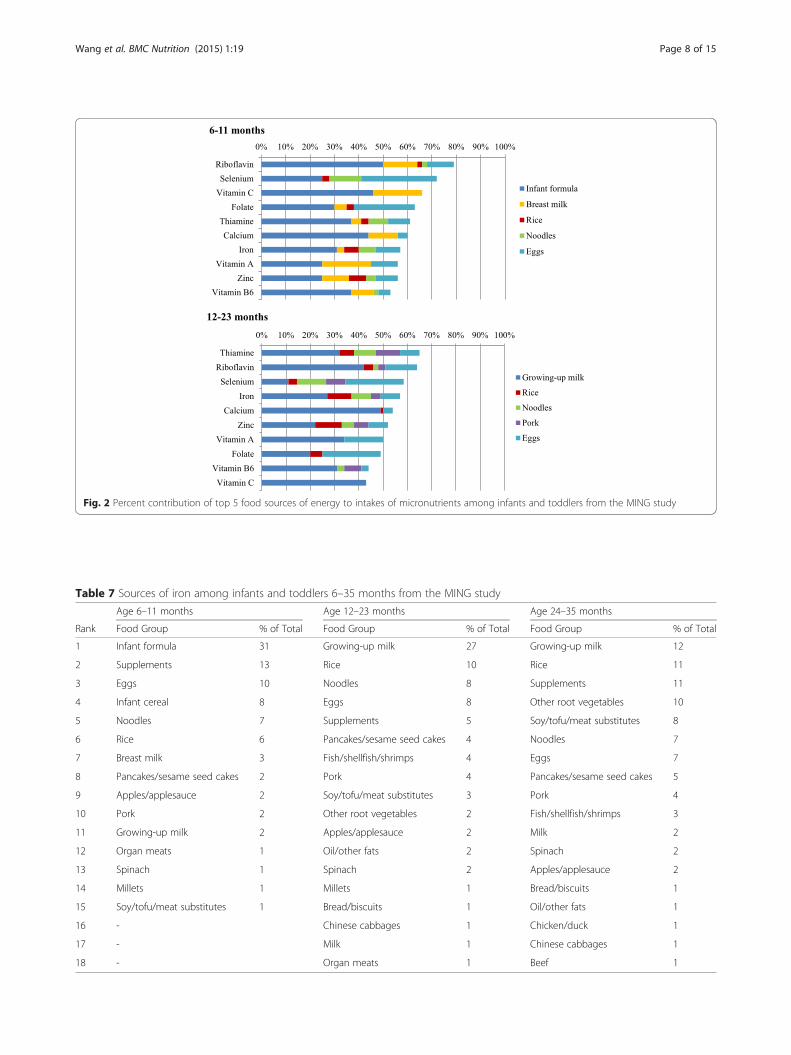
MicronutrientsThe top 5 food sources of energy were also major contrib-utors to the intakes of a number of vitamins and mineralsas shown by Fig. 2 with more pronounced contributionsseen among infants contributing from 79 to 53 %. Thecontribution of the top 5 food sources of energy to the in-takes of micronutrients was reduced among older tod-dlers, however, still contributed 50 % or more to mostmicronutrient intakes among younger toddlers (Fig. 2).
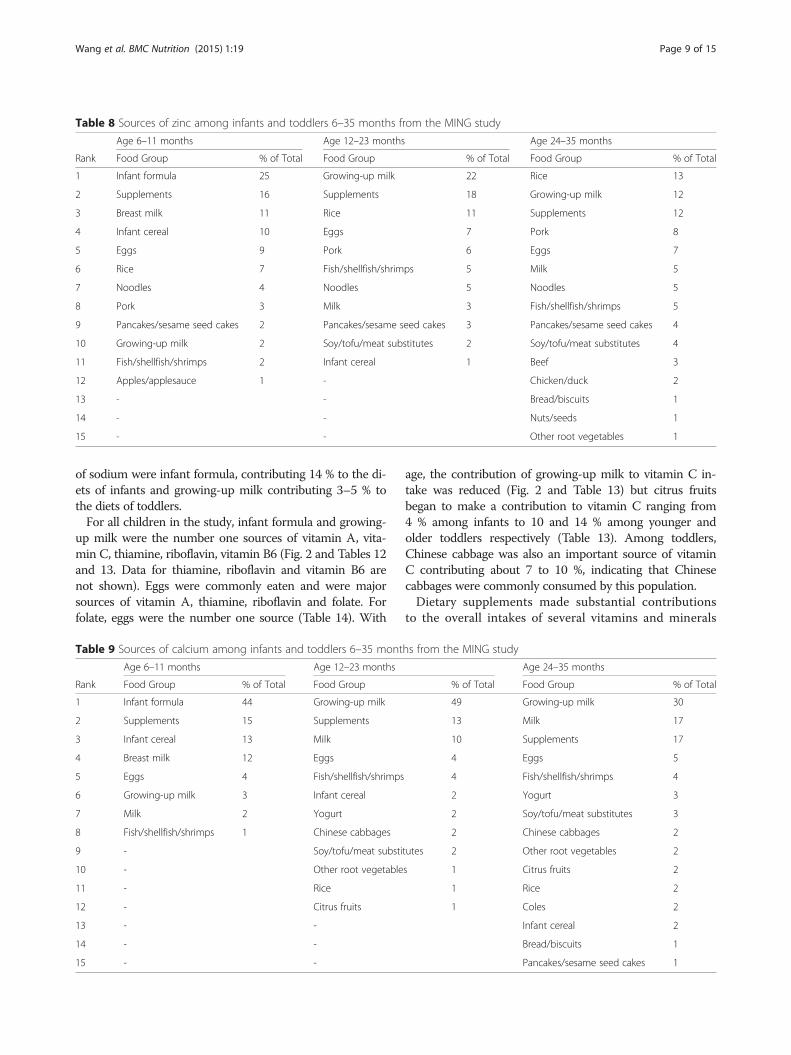
Infant formula and growing-up milk were the numberone sources of iron among infants and toddlers, contrib-uting nearly one third of the daily intake among infants,27 % to younger toddlers and 12 % to older toddlers(Fig. 2 and Table 7). Rice was the number two sourceamong both younger and older toddlers. Other import-ant sources of iron were eggs, infant cereal, noodles andrice among infants, noodles and eggs among youngerand older toddlers. Root vegetables and soy/tofu/meatbecame major sources of iron among older toddlers(Table 7).Infant formula and growing-up milk were the number
one sources of zinc among infants and younger toddlers(Fig. 2 and Table 8). Among older toddlers, rice was thenumber one source of zinc, followed by growing-upmilk. Other important sources of zinc were breast milk,infant cereal and eggs among infants, eggs and porkamong toddlers (Fig. 2 and Table 8). In addition, infantformula or growing-up milk was the number one sourceof calcium contributing 44 % among infants, and nearly50 % among younger toddlers. Growing-up milk com-bined with other milk contributing 47 % to calcium in-take among older toddlers (Fig. 2 and Table 9). Othermajor sources of calcium were infant cereal and breastmilk among infants and eggs and fish/shellfish/shrimpsamong toddlers (Table 9).For selenium, eggs were the number one source among
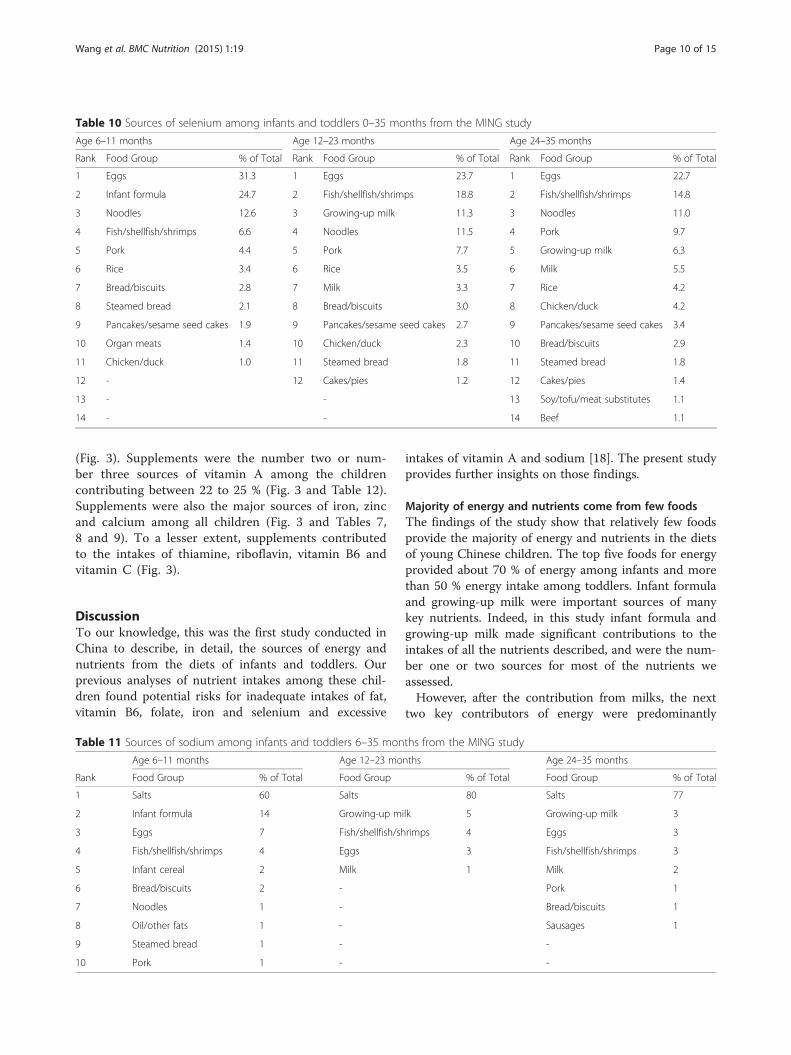
all children, followed by infant formula, noodles and fish/shellfish/shrimps among infants, and fish/shellfish/shrimps,growing-up milk and noodles and pork among toddlers(Table 10). For sodium, the number one source was the saltadded during home cooking contributing the vast majority:60 % of the total sodium intake among infants and about80 % among toddlers (Table 11). The number two sources
Table 6 Sources of fat among infants and toddlers 6–35 months from the MING study
Age 6–11 months Age 12–23 months Age 24–35 months
Rank Food Group % of Total Food Group % of Total Food Group % of Total
1 Infant formula 32 Growing-up milk 25 Pork 23
2 Breast milk 28 Oil/other fats 21 Oil/other fats 17
Wang et al. BMC Nutrition (2015) 1:19 Page 8 of 15
of sodium were infant formula, contributing 14 % to the di-ets of infants and growing-up milk contributing 3–5 % tothe diets of toddlers.For all children in the study, infant formula and growing-
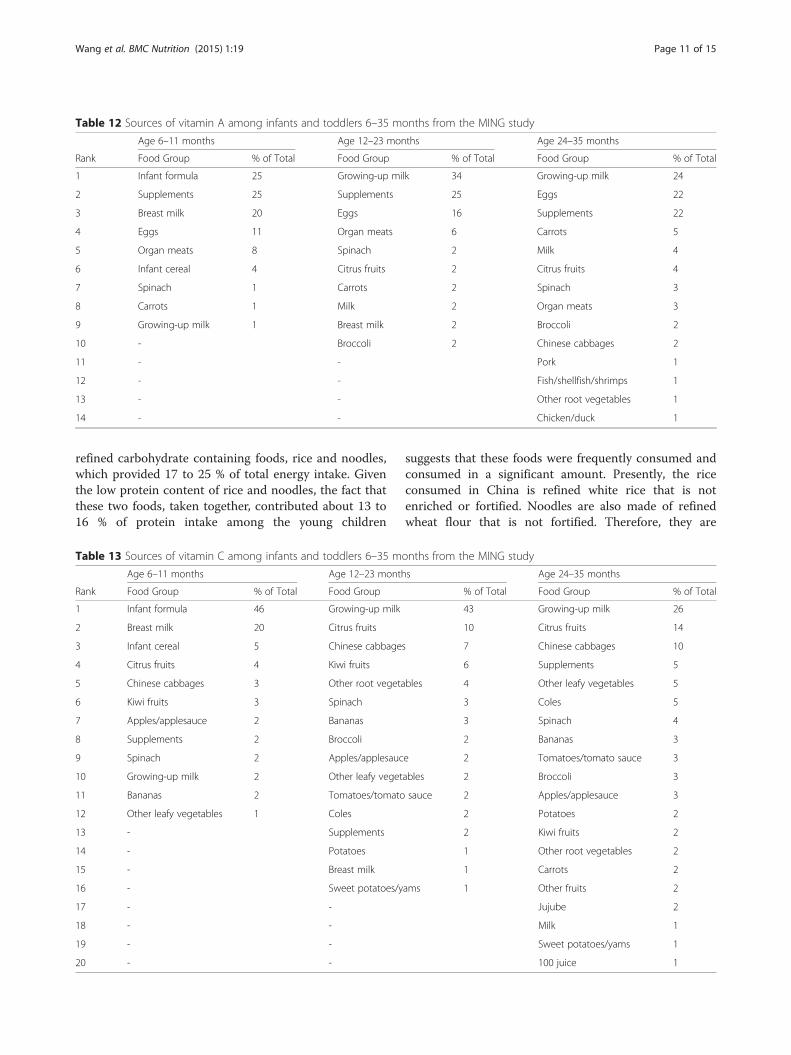
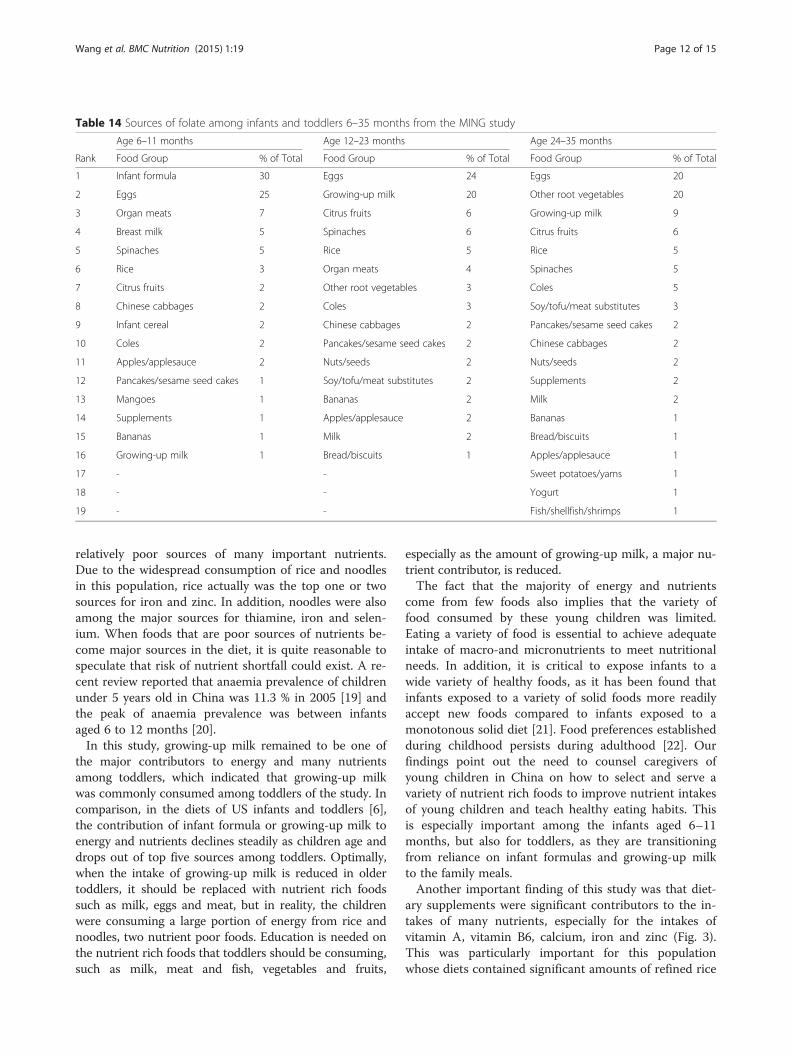
up milk were the number one sources of vitamin A, vita-min C, thiamine, riboflavin, vitamin B6 (Fig. 2 and Tables 12and 13. Data for thiamine, riboflavin and vitamin B6 arenot shown). Eggs were commonly eaten and were majorsources of vitamin A, thiamine, riboflavin and folate. Forfolate, eggs were the number one source (Table 14). With
age, the contribution of growing-up milk to vitamin C in-take was reduced (Fig. 2 and Table 13) but citrus fruitsbegan to make a contribution to vitamin C ranging from4 % among infants to 10 and 14 % among younger andolder toddlers respectively (Table 13). Among toddlers,Chinese cabbage was also an important source of vitaminC contributing about 7 to 10 %, indicating that Chinesecabbages were commonly consumed by this population.Dietary supplements made substantial contributions
to the overall intakes of several vitamins and minerals
Table 8 Sources of zinc among infants and toddlers 6–35 months from the MING study
Age 6–11 months Age 12–23 months Age 24–35 months
Rank Food Group % of Total Food Group % of Total Food Group % of Total
8 Fish/shellfish/shrimps 1 Chinese cabbages 2 Chinese cabbages 2
9 - Soy/tofu/meat substitutes 2 Other root vegetables 2
10 - Other root vegetables 1 Citrus fruits 2
11 - Rice 1 Rice 2
12 - Citrus fruits 1 Coles 2
13 - - Infant cereal 2
14 - - Bread/biscuits 1
15 - - Pancakes/sesame seed cakes 1
Wang et al. BMC Nutrition (2015) 1:19 Page 9 of 15
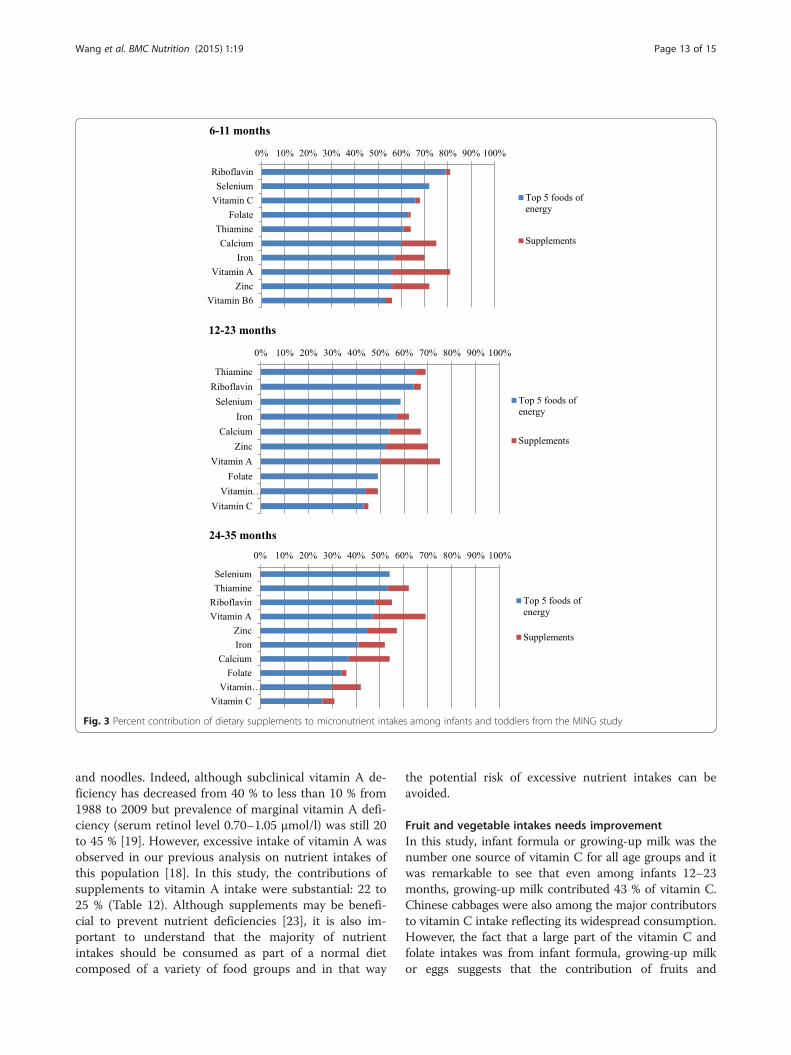
(Fig. 3). Supplements were the number two or num-ber three sources of vitamin A among the childrencontributing between 22 to 25 % (Fig. 3 and Table 12).Supplements were also the major sources of iron, zincand calcium among all children (Fig. 3 and Tables 7,8 and 9). To a lesser extent, supplements contributedto the intakes of thiamine, riboflavin, vitamin B6 andvitamin C (Fig. 3).
DiscussionTo our knowledge, this was the first study conducted inChina to describe, in detail, the sources of energy andnutrients from the diets of infants and toddlers. Ourprevious analyses of nutrient intakes among these chil-dren found potential risks for inadequate intakes of fat,vitamin B6, folate, iron and selenium and excessive
intakes of vitamin A and sodium [18]. The present studyprovides further insights on those findings.
Majority of energy and nutrients come from few foodsThe findings of the study show that relatively few foodsprovide the majority of energy and nutrients in the dietsof young Chinese children. The top five foods for energyprovided about 70 % of energy among infants and morethan 50 % energy intake among toddlers. Infant formulaand growing-up milk were important sources of manykey nutrients. Indeed, in this study infant formula andgrowing-up milk made significant contributions to theintakes of all the nutrients described, and were the num-ber one or two sources for most of the nutrients weassessed.However, after the contribution from milks, the next
two key contributors of energy were predominantly
Table 10 Sources of selenium among infants and toddlers 0–35 months from the MING study
Age 6–11 months Age 12–23 months Age 24–35 months
Rank Food Group % of Total Rank Food Group % of Total Rank Food Group % of Total
1 Eggs 31.3 1 Eggs 23.7 1 Eggs 22.7
2 Infant formula 24.7 2 Fish/shellfish/shrimps 18.8 2 Fish/shellfish/shrimps 14.8
Wang et al. BMC Nutrition (2015) 1:19 Page 10 of 15
refined carbohydrate containing foods, rice and noodles,which provided 17 to 25 % of total energy intake. Giventhe low protein content of rice and noodles, the fact thatthese two foods, taken together, contributed about 13 to16 % of protein intake among the young children
suggests that these foods were frequently consumed andconsumed in a significant amount. Presently, the riceconsumed in China is refined white rice that is notenriched or fortified. Noodles are also made of refinedwheat flour that is not fortified. Therefore, they are
Table 12 Sources of vitamin A among infants and toddlers 6–35 months from the MING study
Age 6–11 months Age 12–23 months Age 24–35 months
Rank Food Group % of Total Food Group % of Total Food Group % of Total
1 Infant formula 25 Growing-up milk 34 Growing-up milk 24
2 Supplements 25 Supplements 25 Eggs 22
3 Breast milk 20 Eggs 16 Supplements 22
4 Eggs 11 Organ meats 6 Carrots 5
5 Organ meats 8 Spinach 2 Milk 4
6 Infant cereal 4 Citrus fruits 2 Citrus fruits 4
7 Spinach 1 Carrots 2 Spinach 3
8 Carrots 1 Milk 2 Organ meats 3
9 Growing-up milk 1 Breast milk 2 Broccoli 2
10 - Broccoli 2 Chinese cabbages 2
11 - - Pork 1
12 - - Fish/shellfish/shrimps 1
13 - - Other root vegetables 1
14 - - Chicken/duck 1
Table 13 Sources of vitamin C among infants and toddlers 6–35 months from the MING study
Age 6–11 months Age 12–23 months Age 24–35 months
Rank Food Group % of Total Food Group % of Total Food Group % of Total
1 Infant formula 46 Growing-up milk 43 Growing-up milk 26
2 Breast milk 20 Citrus fruits 10 Citrus fruits 14
3 Infant cereal 5 Chinese cabbages 7 Chinese cabbages 10
4 Citrus fruits 4 Kiwi fruits 6 Supplements 5
5 Chinese cabbages 3 Other root vegetables 4 Other leafy vegetables 5
Wang et al. BMC Nutrition (2015) 1:19 Page 11 of 15
relatively poor sources of many important nutrients.Due to the widespread consumption of rice and noodlesin this population, rice actually was the top one or twosources for iron and zinc. In addition, noodles were alsoamong the major sources for thiamine, iron and selen-ium. When foods that are poor sources of nutrients be-come major sources in the diet, it is quite reasonable tospeculate that risk of nutrient shortfall could exist. A re-cent review reported that anaemia prevalence of childrenunder 5 years old in China was 11.3 % in 2005 [19] andthe peak of anaemia prevalence was between infantsaged 6 to 12 months [20].In this study, growing-up milk remained to be one of
the major contributors to energy and many nutrientsamong toddlers, which indicated that growing-up milkwas commonly consumed among toddlers of the study. Incomparison, in the diets of US infants and toddlers [6],the contribution of infant formula or growing-up milk toenergy and nutrients declines steadily as children age anddrops out of top five sources among toddlers. Optimally,when the intake of growing-up milk is reduced in oldertoddlers, it should be replaced with nutrient rich foodssuch as milk, eggs and meat, but in reality, the childrenwere consuming a large portion of energy from rice andnoodles, two nutrient poor foods. Education is needed onthe nutrient rich foods that toddlers should be consuming,such as milk, meat and fish, vegetables and fruits,
especially as the amount of growing-up milk, a major nu-trient contributor, is reduced.The fact that the majority of energy and nutrients
come from few foods also implies that the variety offood consumed by these young children was limited.Eating a variety of food is essential to achieve adequateintake of macro-and micronutrients to meet nutritionalneeds. In addition, it is critical to expose infants to awide variety of healthy foods, as it has been found thatinfants exposed to a variety of solid foods more readilyaccept new foods compared to infants exposed to amonotonous solid diet [21]. Food preferences establishedduring childhood persists during adulthood [22]. Ourfindings point out the need to counsel caregivers ofyoung children in China on how to select and serve avariety of nutrient rich foods to improve nutrient intakesof young children and teach healthy eating habits. Thisis especially important among the infants aged 6–11months, but also for toddlers, as they are transitioningfrom reliance on infant formulas and growing-up milkto the family meals.Another important finding of this study was that diet-
ary supplements were significant contributors to the in-takes of many nutrients, especially for the intakes ofvitamin A, vitamin B6, calcium, iron and zinc (Fig. 3).This was particularly important for this populationwhose diets contained significant amounts of refined rice
Table 14 Sources of folate among infants and toddlers 6–35 months from the MING study
Age 6–11 months Age 12–23 months Age 24–35 months
Rank Food Group % of Total Food Group % of Total Food Group % of Total
1 Infant formula 30 Eggs 24 Eggs 20
2 Eggs 25 Growing-up milk 20 Other root vegetables 20
3 Organ meats 7 Citrus fruits 6 Growing-up milk 9
4 Breast milk 5 Spinaches 6 Citrus fruits 6
5 Spinaches 5 Rice 5 Rice 5
6 Rice 3 Organ meats 4 Spinaches 5
7 Citrus fruits 2 Other root vegetables 3 Coles 5
8 Chinese cabbages 2 Coles 3 Soy/tofu/meat substitutes 3
Wang et al. BMC Nutrition (2015) 1:19 Page 12 of 15
and noodles. Indeed, although subclinical vitamin A de-ficiency has decreased from 40 % to less than 10 % from1988 to 2009 but prevalence of marginal vitamin A defi-ciency (serum retinol level 0.70–1.05 μmol/l) was still 20to 45 % [19]. However, excessive intake of vitamin A wasobserved in our previous analysis on nutrient intakes ofthis population [18]. In this study, the contributions ofsupplements to vitamin A intake were substantial: 22 to25 % (Table 12). Although supplements may be benefi-cial to prevent nutrient deficiencies [23], it is also im-portant to understand that the majority of nutrientintakes should be consumed as part of a normal dietcomposed of a variety of food groups and in that way
the potential risk of excessive nutrient intakes can beavoided.
Fruit and vegetable intakes needs improvementIn this study, infant formula or growing-up milk was thenumber one source of vitamin C for all age groups and itwas remarkable to see that even among infants 12–23months, growing-up milk contributed 43 % of vitamin C.Chinese cabbages were also among the major contributorsto vitamin C intake reflecting its widespread consumption.However, the fact that a large part of the vitamin C andfolate intakes was from infant formula, growing-up milkor eggs suggests that the contribution of fruits and
Fig. 3 Percent contribution of dietary supplements to micronutrient intakes among infants and toddlers from the MING study
Wang et al. BMC Nutrition (2015) 1:19 Page 13 of 15
vegetables to micronutrient intakes in the diets of theseChinese infants and toddlers was not optimal. Fruits andvegetables are not only excellent natural sources of micro-nutrients [24, 25] but also associated with reduced risk ofchronic diseases later in life [26–28]. Infancy and earlychildhood are critical periods for forming lifelong dietaryhabits [29]. Therefore, public health workers should en-courage caregivers of young children to increase the con-sumption of fruits and vegetables among infants andtoddlers to meet nutrient requirements as well as develophealthy dietary habits.
Strength and limitationThe strength of this study is that it used a much moredetailed food group classification method than any pre-vious studies conducted among infants and toddlers inChina and so was able to describe the sources of energyand a number of key nutrients in detail.However, we are aware that this study has some limita-
tions. First, data for food consumption of these infantsand toddlers relied totally on self-reports of caregivers andthe information was only collected using a single 24-hdietary recall. The approach of using 1 day of intake togain insight into food sources of energy and nutrients as-sumes that the diet on that day is representative or typicalof habitual intake, and some evidence suggests that day-to-day variation is much less in the diets of infants andtoddlers than among older children and adults [30]. Sec-ondly, this study was conducted among infants and tod-dlers recruited from the maternal and child care centresin selected cities in China, including the three most indus-trialised cities, and was not a nationally representativesample. Therefore, sample weights or other sampling ad-justments were not applied. Some children may comefrom better-off families indicated by the reported house-hold income. Therefore the data may represent the chil-dren from more developed urban areas rather than thegeneral population of infants and toddlers in China.Thirdly, although the subjects of the study were recruitedfrom a wide-spread of geographic locations in China, foodconsumption of children from different regions could bedifferent but this was not investigated in the presentstudy.
ConclusionsThis study provides important insights from an analysisof food sources of energy and nutrients in the diets ofinfants and toddlers recruited from the maternal andchild care centres in 8 cities in China. The results showthat few foods made up the core of the diets of infantsand young toddlers and a large proportion of energy wasfrom low-nutrient dense foods (rice and noodles), whichpotentially could lead to inadequate intakes of some keynutrients. The intakes of more nutrient dense foods
including fruits and vegetables, milk and meat should beencouraged. Information from this study could be usedfor the development of various public health strategiesto improve diet quality and address nutrient shortfalls inthe diets of this vulnerable population.
Competing interestsThe author(s) declare that they have no competing interests. The study wasfunded by the Nestle Nutrition Institute China and the Nestle ResearchCentre. It was a collaborative effort between Peking University School ofPublic Health and Nestle.
Authors’ contributionsHW contributed to the data collection, performed the statistical analyses anddrafted the manuscript; LD contributed to interpretation of the data andcritical revision of the manuscript; YZ contributed to data collection andstatistical analyses; GVP contributed to the data interpretation and revision ofthe manuscript; KR contributed to the conception and design of the study,interpretation of the data and critical revision of the manuscript; YZcontributed to the conception and design of the study and data collection;PW contributed to the conception and design of the study. All authors readand approved the final manuscript.
AcknowledgementsThe authors thank the families who volunteered for this study, Laurence Lifor project support and guidance, Celia Ning for project management anddata collection and local project staff for recruitment and data collection.
Author details1School of Public Health, Peking University, Beijing, China. 2Nestlé ResearchCentre, Lausanne, Switzerland. 3Nestlé R&D Centre, Beijing, China. 4NestléNutrition Global R&D, Florham Park, NJ, USA.
Received: 29 April 2015 Accepted: 7 September 2015
References1. Harding JE. The nutritional basis of the fetal origins of adult disease.
Int J Epidemiol. 2001;30(1):15–23.2. Barker DJ, Fall CH. Fetal and infant origins of cardiovascular disease. Arch
Dis Child. 1993;68(6):797–9.3. Salvo D, Frediani JK, Ziegler TR, Cole CR. Food group intake patterns and
nutrient intake vary across low-income Hispanic and African Americanpreschool children in Atlanta: a cross sectional study. Nutr J. 2012;11:62.
4. Subar AF, Krebs-Smith SM, Cook A, Kahle LL. Dietary sources of nutrientsamong US children, 1989-1991. Pediatrics. 1998;102(4 Pt 1):913–23.
5. Stroehla BC, Malcoe LH, Velie EM. Dietary sources of nutrients among ruralNative American and white children. J Am Diet Assoc. 2005;105(12):1908–16.
6. Fox MK, Reidy K, Novak T, Ziegler P. Sources of energy and nutrients in thediets of infants and toddlers. J Am Diet Assoc. 2006;106(1 Suppl 1):S28–42.
7. Sepp H, Abrahamsson L, Lennernas Junberger M, Risvik E. The contributionof food groups to the nutrient intake and food pattern among pre-schollchildren. Food Qual Prefer. 2002;13:107–16.
8. De Keyzer W, Lin Y, Vereecken C, Maes L, Van Oyen H, Vanhauwaert E, et al.Dietary sources of energy and macronutrient intakes among Flemishpreschoolers. Arch Public Health. 2011;69(1):5.
9. Li Y, Guo Z, Min P. Assessment of dietary energy intake on weaning infantsaged 6-24 months. Acta Nutrimenta Sinica. 2011;33:616–8.
10. Geng Y, Han J, Li Y. Current situation of different fatty acid intake and itsfood source among children in China. Chinese Journal of School Health.2011;32:530–1.
11. Gao P, Wang J, Li Y, Liang H, Chen D, Lv J, et al. Investigation on the dietaryiron intake of infants from four month-old to one year-old in Shunyi Districtof Beijing. Wei Sheng Yan Jiu. 2012;41(4):576–8. 584.
12. Center of Disease Control Institute of Nutrition and Food Hygiene. ChinaFood Composition. 1st ed. Beijng: Beijing Medical University Press; 2004.
13. Center of Disease Control Institute of Nutrition and Food Hygiene. ChinaFood Composition. 2nd ed. Beijing: Beijing Medical University Press; 2009.
14. Nutrition Coordinating Center University of Minnesota. Revisiting vitamin Ameasurements. NDS Q. 2002;12(2).
Wang et al. BMC Nutrition (2015) 1:19 Page 14 of 15
15. Butte NF, Fox MK, Briefel RR, Siega-Riz AM, Dwyer JT, Deming DM, et al.Nutrient intakes of US infants, toddlers, and preschoolers meet or exceeddietary reference intakes. J Am Diet Assoc. 2010;110(12 Suppl):S27–37.
16. Krebs-Smith SM, Cronin FJ, Haytowitz DB, Cook DA. Food sources of energy,macronutrients, cholesterol, and fiber in diets of women. J Am Diet Assoc.1992;92(2):168–74.
17. Subar AF, Krebs-Smith SM, Cook A, Kahle LL. Dietary sources of nutrientsamong US adults, 1989 to 1991. J Am Diet Assoc. 1998;98(5):537–47.
18. Denney L, Vinyes Pares G, Zhang Y, Wang P, Reidy K. Nutrient intakes ofinfants and toddlers in China (MING study). Malaysian J Nutr.2015;21(Supplement):S31.
19. Wong AY, Chan EW, Chui CS, Sutcliffe AG, Wong IC. The phenomenon ofmicronutrient deficiency among children in China: a systematic review ofthe literature. Public Health Nutr. 2014;17(11):2605–18.
20. Chang S, He W, Jia F, Chen C. Analysis on the changes of nutritional statusin China anemia status of children under 5 in China. Wei Sheng Yan Jiu.2007;36(2):210–2.
22. Nicklaus S, Boggio V, Chabanet C, Issanchou S. A prospective study of foodvariety seeking in childhood, adolescence and early adult life. Appetite.2005;44(3):289–97.
23. Siega-Riz AM, Estrada Del Campo Y, Kinlaw A, Reinhart GA, Allen LH,Shahab-Ferdows S, et al. Effect of supplementation with a lipid-basednutrient supplement on the micronutrient status of children aged 6-18months living in the rural region of Intibuca. Honduras Paediatr PerinatEpidemiol. 2014;28(3):245–54.
24. U.S. Department of Health and Human Services. Dietary Guidelines forAmericans 2005. Washington DC: US Government Printing Office; 2005.
25. Wardlaw GM, Insel PM. Perspectives in nutrition. St. louis, Mosby: Mosby-Year Book Inc.; 1996.
26. Law MR, Morris JK. By how much does fruit and vegetable consumptionreduce the risk of ischaemic heart disease? Eur J Clin Nutr. 1998;52(8):549–56.
27. Joshipura KJ, Ascherio A, Manson JE, Stampfer MJ, Rimm EB, Speizer FE, etal. Fruit and vegetable intake in relation to risk of ischemic stroke. JAMA.1999;282(13):1233–9.
28. Voorrips LE, Goldbohm RA, van Poppel G, Sturmans F, Hermus RJ, van denBrandt PA. Vegetable and fruit consumption and risks of colon and rectalcancer in a prospective cohort study: The Netherlands Cohort Study on Dietand Cancer. Am J Epidemiol. 2000;152(11):1081–92.
29. Mikkila V, Rasanen L, Raitakari OT, Pietinen P, Viikari J. Consistent dietarypatterns identified from childhood to adulthood: the cardiovascular risk inYoung Finns Study. Br J Nutr. 2005;93(6):923–31.
30. Lanigan JA, Wells JC, Lawson MS, Cole TJ, Lucas A. Number of days neededto assess energy and nutrient intake in infants and young children between6 months and 2 years of age. Eur J Clin Nutr. 2004;58(5):745–50.
Submit your next manuscript to BioMed Centraland take full advantage of:
• Convenient online submission
• Thorough peer review
• No space constraints or color figure charges
• Immediate publication on acceptance
• Inclusion in PubMed, CAS, Scopus and Google Scholar
• Research which is freely available for redistribution
Submit your manuscript at www.biomedcentral.com/submit
Wang et al. BMC Nutrition (2015) 1:19 Page 15 of 15