STUDIES IN SPORT, PHYSICAL EDUCATION AND HEALTH 83 Jarmo Perttunen Foot Loading in Normal and Pathological Walking Esitetään Jyväskylän yliopiston liikunta- ja terveystieteiden tiedekunnan suostumuksella julkisesti tarkastettavaksi yliopiston Agora rakennuksessa (Ag Aud. 2) huhtikuun 13. päivänä 2002 kello 12. Academic dissertation to be publicly discussed, by permission of the Faculty of Sport and Health Sciences of the University of Jyväskylä, in the Building Agora, Ag Aud. 2, on April 13, 2002 at 12 o'clock noon. UNIVERSITY OF JYVÄSKYLÄ JYVÄSKYLÄ 2002
Transcript
STUDIES IN SPORT, PHYSICAL EDUCATION AND HEALTH 83
Jarmo Perttunen
Foot Loading in Normal andPathological Walking
Esitetään Jyväskylän yliopiston liikunta- ja terveystieteiden tiedekunnan suostumuksellajulkisesti tarkastettavaksi yliopiston Agora rakennuksessa (Ag Aud. 2)
huhtikuun 13. päivänä 2002 kello 12.
Academic dissertation to be publicly discussed, by permission ofthe Faculty of Sport and Health Sciences of the University of Jyväskylä,in the Building Agora, Ag Aud. 2, on April 13, 2002 at 12 o'clock noon.
UNIVERSITY OF JYVÄSKYLÄ
JYVÄSKYLÄ 2002
Foot Loading in Normal andPathological Walking
STUDIES IN SPORT, PHYSICAL EDUCATION AND HEALTH 83
Jarmo Perttunen
Foot Loading in Normal andPathological Walking
UNIVERSITY OF JYVÄSKYLÄ
JYVÄSKYLÄ 2002
Editors Harri Suominen Department of Health Sciences, University of Jyväskylä Marja-Leena Tynkkynen and Pekka Olsbo Publishing Unit, University Library of Jyväskylä
Perttunen, Jarmo Foot Loading in Normal and Pathological Walking Jyväskylä: University of Jyväskylä, 2002, 86 p. (Studies in Sport, Physical Education and Health, ISSN 0356-1070; 83) ISBN 951-39-1222-1 Finnish summary Diss.
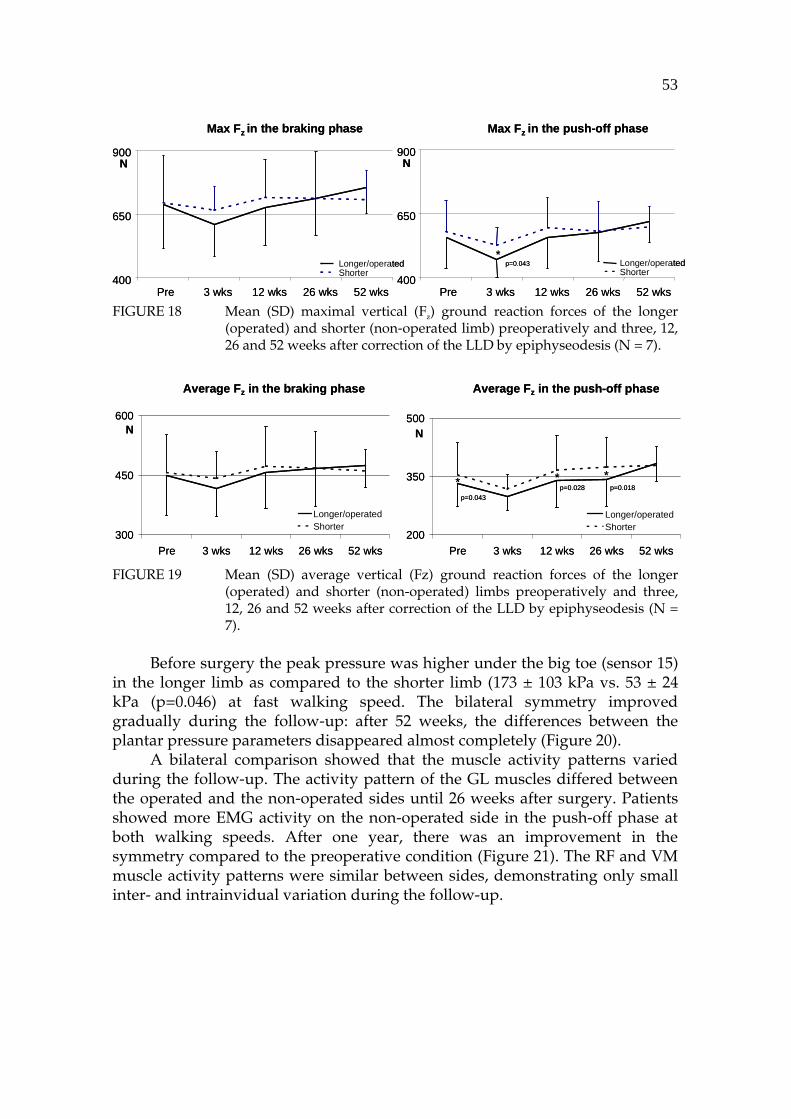
The present series of studies was designed to study the interaction between foot loading patterns and neuromusculoskeletal adaptation during normal and pathological walking. The behaviour of the foot was examined in healthy subjects and different groups of patients. In order to know how surgical intervention affected the ability to walk, foot loading patterns and neuromusculoskeletal function was studied before and after corrective surgery. Special emphasis was laid on understanding the benefits of corrective surgery. The test procedure for the Paromed-System used in the present study showed that it could be used accurately to examine the bilateral symmetry of foot loading during walking without any disturbance to the subject. The highest peak plantar pressures were found under the heel, the first metatarsal and the big toe in both the normal and patient groups. The results suggested that foot loading asymmetry did not increase at faster walking speeds in healthy subjects. However, patients with limb length discrepancy and patients recovering from tibial fracture had excessive foot loading asymmetries, which tended to become greater at fast walking speeds. The peak plantar pressures usually increased under the foot in the healthy subjects when walking speed increased while decreasing under the lateral forefoot. In contrast to this medial shift, bilateral comparison showed that the plantar pressures under the operated foot after free-flap reconstruction of the tibial fractures had shifted more to the lateral side of the forefoot. This lateralisation was a compensatory mechanism to reduce the loading on the ankle joint. The results from the triple jump showed that the high lateral forefoot pressure and maximal vertical ground reaction force in the braking phase and maximal horizontal ground reaction force in the anterior-posterior direction in the push-off phase were closely correlated to the length of the triple jump. In patients the foot loading and muscle strength symmetry improved notably during the follow-up after the reconstruction surgery to correct the limb length discrepancy. Because symmetry after the different surgical interventions was not completely restored, long rehabilitation period is needed after corrective surgery.
Author’s address Jarmo Perttunen Neuromuscular Research Center Department of Biology of Physical Activity University of Jyväskylä, Jyväskylä, Finland
Supervisor Professor Paavo V. Komi Neuromuscular Research Center Department of Biology of Physical Activity University of Jyväskylä, Jyväskylä, Finland
Reviewers Professor Alain Delarque University of Marseille, Marseille, France
Professor Carlo Frigo University of Milan, Milan, Italy
Opponents Professor Carlo Frigo University of Milan, Milan, Italy
Professor Per Renström Karolinska Institutet, Stockholm, Sweden
ACKNOWLEDGEMENTS
This study was carried out under the supervision of Professor Paavo V Komi at the Department of Biology of Physical Activity, University of Jyväskylä, during the years 1995 – 2002. Professor Paavo V. Komi, the Head of the Neuromuscular Research Center, Department of Biology of Physical Activity deserves a special acknowledgement. His guidance in completing this thesis was invaluable. I wish to express my gratitude to all the people who in different ways made this work possible, in particular the following persons:
− Professor Alain Delarque University of Marseille and Professor Carlo Frigo University of Milan, reviewers of this study, for their valuable comments and criticism on the manuscript of this thesis.
− My co-authors, Heikki Kyröläinen PhD, Ari Heinonen PhD, Pekka Kannus PhD, Heikki Sievänen PhD, Juhani Merikanto PhD, Esa Anttila MD, Jerker Södergård MD, Heikki Nieminen MD, Erkki Tukiainen MD Heikki Kuokkanen MD, and Professor Sirpa Asko-Seljavaara.
− All my colleagues working at the Department, especially Professor Keijo Häkkinen, Professor Timo Takala, Janne Avela PhD, Taija Finni PhD, Kari Keskinen PhD, Antti Mero PhD, Teemu Pullinen PhD, Ensio Helimäki MSc, Sami Kuitunen MSc, Vesa Linnamo MSc, Olavi Pajala MSc, Tapani Pöyhönen MSc, and Juha Isolehto for their valuable comments and willingness to discuss the issues reported here.
− Engineers Markku Ruuskanen, Sirpa Roivas, Seppo Seppälä and Markku Sillanpää for their technical assistance with the measurements.
− Pirkko Puttonen and Marja-Liisa Romppanen for their skilful assistance and their patience in the data collection during the measurements and in the data analysis.
− Sinikka Hänninen, Pertti Karppinen, Timo Kokkonen and Veli Maaranen for their assistance in the data analysis.
− Hellevi Labbart and Minna Herpola for their administrative assistance.
− Michael Freeman for revising the language of this thesis. − Walter Becker and Donald Fagen for their support during the long
evenings.− All the subjects who volunteered to participate in this study.
I would especially like to thank my parents, Reijo Perttunen and Tarja Perttunen for their everlasting support. Finally, I most gratefully thank my beloved wife Jaana, and our children Jukka-Pekka and Johanna. I deeply appreciate their continuous understanding and encouragement from bottom of my heart. This dissertation is dedicated to them. This project was financially supported by the Department of Biology of Physical Activity, University of Jyväskylä, and the Ministry of Education, Finland.
ORIGINAL PAPERS
The present thesis is based on the following papers, which will be referred to by their Roman numerals. In addition, some data not presented in the papers are also included.
I Perttunen J and Komi PV 2001. Effects of walking speed on foot loading patterns. J Human Movem Stud 40: 291–305.
II Perttunen J, Nieminen H, Tukiainen E, Kuokkanen H, Asko-Seljavaara S, and Komi PV 2000. Asymmetry of gait after free flap reconstruction of severe tibial fractures with extensive soft-tissue damage. Scand J Plast Reconstr Hand Surg 34: 237–43.
III Perttunen J, Kyröläinen H, Komi PV, and Heinonen A 2000. Biomechanical loading in the triple jump. J Sport Sci 18: 363–70.
IV Heinonen A, Sievänen H, Kyrölainen H, Perttunen J, and Kannus P 2001 Mineral mass, size and estimated mechanical strength of triple jumpers’ lower limb. Bone 29: 279–85.
V Perttunen J, Anttila E, Södergård J, Merikanto J, and Komi PV 2001. Gait asymmetry in patients with limb length discrepancy, submitted.
VI Perttunen J, Anttila E, Södergård J, Merikanto J, and Komi, PV 2001. Limb-length discrepancy and gait – One-year follow-up study after epiphyseodesis, submitted.
VII Perttunen J, Anttila E, Södergård J, Merikanto J, and Komi PV 2001. Effect of intramedullary gradual elongation of the shorter limb on gait patterns, submitted.
CONTENTS
ABSTRACTACKNOWLEDGEMENTORIGINAL PAPERS ABBREVIATIONS AND NOMENCLATURE
aBMD areal bone mineral density aEMG average electromyography BMD bone mineral density CG centre of gravitycm centimetre, unit of displacementCOP centre of pressure g·cm-2 unit of densityDXA dual-energy X-ray absorptiometry GL gastrocnemius lateralis muscleGM gluteus maximus muscleG gigaohmi, unit of electric resistanceGRF ground reaction force EMG electromyography Fx ground reaction force in the anterior-posterior direction Fy ground reaction force in the medio-lateral direction Fz ground reaction force in the vertical direction Hz hertz, frequency (per second) kg kilogram, unit of weight kPa kilopascal, force perpendicular to the sensor per unit area of sensorm metre, unit of displacementm·s-1 meter per second, unit of velocity MVC isometric maximal voluntary contraction forcemV millivolt, electric potential difference N newton, unit of force N·cm-2 force perpendicular to the sensor per unit area of sensorpQCT peripheral quantitative computed tomography RF rectus femoris muscleSOL soleus muscleSD standard deviation SI symmetry index TA tibialis anterior muscleµV microvolt, electric potential difference VM vastus medialis muscle VL vastus lateralis muscle
1 INTRODUCTION
The measurement of foot loading has advanced considerably over the recent decades. It first became a useful clinical tool through the pioneering work of Beely (1882) and Elftman (1934). Interest in both the qualitative and quantitative understanding of pressures on the plantar surface of the foot during human locomotion had a strong influence on the development of measurement technology (Ralphs et al. 1990). A novel system for measuring the plantar pressure distribution means that accurate and high-resolution displays can be drawn from the continuous pressures that occur under the foot or the shoe. The use of this technology in clinical work is feasible (Graf 1993, Young 1993, Mueller 1995, Mittlmeier et al. 1999). Knowledge of the forces acting under the foot is important in the assessment of various foot pathologies (Lord et al. 1986). These have included such conditions as diabetes (e.g. Stokes et al. 1975, Boulton et al. 1983, Duckworth et al. 1985, Sokol et al. 1991, Cavanagh et al. 1993, Patel & Wieman 1994, Lavery et al. 1995, Garbalosa et al. 1996, Murray et al. 1996, Giacolone et al. 1997, Stess et al. 1997, Armstrong et al. 1998), rheumatoid arthritis (e.g. Minns & Craxford 1984, Betts et al. 1988, Masson et al. 1989, Woodburn & Helliwell 1996, Hodge et al. 1999), post-operative assessment after corrective surgery (e.g. Betts et al. 1988, Mittlmeier & Morlock 1991, Lanshammar et al. 1993, Wanivenhaus & Brettschneider 1993, Becker et al. 1994, Phillipson et al. 1994, Widhe & Berggren 1994, Becker et al. 1995, Rosenbaum et al. 1996A, Becker et al. 1997, Rosenbaum et al. 1997, Bitzan et al. 1997, Mittlmeier et al. 1999, Schmidt et al. 1999, Kleinhans et al. 2001, Rosenbaum et al. 2001) and many other diseases and traumas (e.g. Rodgers & Cavanagh 1989, Durham et al. 1994, Meyring et al. 1997, Femery et al. 2001). For example, in diabetic neuropathy, the plantar pressures have indicated a relationship between excessive localised pressure and ulceration (Stokes et al. 1975, Boulton et al. 1983, Veves et al. 1992, Patel & Wieman 1994). These patients are at risk of recurrent ulceration because of impaired pain and joint position sensation and increased pressures under the metatarsal heads (Boulton et al. 1983).
Currently several measurement systems utilising a wide range of technologies are available for both research purpose and clinical work (Lord 1981, Alexander et al. 1990, Cavanagh et al. 1992, Cobb & Claremont 1995).
14
Hughes et al. (1993) estimated that as many as 40 different types of systems have been used. Many of these are constructed so that the sensors are inside the shoes at certain anatomical landmarks under the sole of the foot. In-shoe techniques are advantageous as compared to traditional pressure devices (Cavanagh et al. 1992). The insoles are designed to provide localised information with multiple gait cycles and in-shoe measurement increases the versatility of measurements by allowing for the calculation of more robust statistical estimates (Cavanagh et al. 1992). In addition to ground reaction force measurements (GRF) and electromyography recordings (EMG), in-shoe pressure measurement can be used to study gait asymmetries over many consecutive steps.
The general purpose of the present series of studies was to examine foot loading responses under different loading conditions. Special emphasis was placed on studying the interaction between foot loading patterns and neuromusculoskeletal adaptation as well as comparing healthy and affected sides. Furthermore, the purpose was to identify how impairment of the ability to walk affected the foot loading patterns and neuromusculoskeletal function. As this project involved several different groups of patients, the important practical objective was to use the information gathered in assessing the success of surgical procedures and rehabilitation.
2 REVIEW OF THE LITERATURE
2.1 Gait cycle
2.1.1 Phases of gait
The biomechanics of walking on a level surface has frequently been explored and characterised (e.g. Saunders et al. 1953, Murray et al. 1964, Inman et al. 1981, Winter 1991, Perry 1992, Vaughan et al. 1999). The gait cycle is defined as the period from the heel contact of one foot to the next heel contact of the same foot. This cycle is divided into the stance and swing periods. On average, the gait cycle is about one second in duration with 60 % on the stance and 40 % on the swing. The stance period can subdivided into the first double support, followed by a period of single support and then the second double support (Perry 1992, Vaughan et al. 1999). During the early part of the stance, the heel is in contact with the ground, progressing to foot-flat during the single support and then to forefoot contact during the terminal double support, and ending with the toe-off. This pattern may vary greatly in a pathological gait. The stance and swing periods can be further subdivided into eight functional phases, five during the stance and three during the swing. The first two phases, initial contact and loading response, occur during weight acceptance. Midstance and terminal stance occur during the single limb support phase and finally the limb advancement begins with the pre-swing, which is the final phase of the stance period (Figure 1) (Perry 1992).
Limb advancement continues through the three phases of the swing: initial swing, midswing, and terminal swing. During the initial swing the swing leg is accelerated forward by hip and knee flexion together with ankle dorsiflexion. The midswing occurs when the accelerating limb is aligned with the stance limb. In the terminal swing the decelerating leg prepares for contact with the ground and is controlled by the hamstring muscles (Figure 1) (Perry 1992).
16
Stance period Swing period
Initialcontact
Loadingresponse
Midstance
Terminalstance
Preswing MidswingInitialswing
Terminalswing
First doublesupport
Second doublesupport
Single limb support
Stance period Swing period
Initialcontact
Loadingresponse
Midstance
Terminalstance
Preswing MidswingInitialswing
Terminalswing
First doublesupport
Second doublesupport
Single limb support
FIGURE 1 The normal gait cycle of an 8-year old boy (redrawn with modifications from Vaughan et al. 1999).
2.1.2 Ground reaction forces during walking
The ground reaction force (GRF) in walking is the force applied by the body to the ground. It is equal and opposite to the force applied by the foot to the ground (Perry 1992). The largest GRF is the vertical component (Fz), which accounts for the acceleration of the body's centre of mass in the vertical direction during walking (Eberhart & Inman 1951). During the first 100 ms, Fz
goes to a maximum of 120 % of body weight (BW), dropping to about 60 - 80 % BW during the single stance period (Perry 1992). The centre of gravity (CG) is located around the middle of the pelvis and makes a sinusoidal motion during walking (Saunders et al. 1953). If the entire body is treated as a mass on a spring, the magnitude of the GRF can be more easily understood. Newton's second law states that an unbalanced force must equal its mass times acceleration. Therefore, when the acceleration is positive, Fz must be greater than BW. Positive acceleration occurs during the double support when the CG is at its lowest point. When the CG is at its highest point during the single support phase, the acceleration is negative and Fz must be less than BW (Inman et al. 1981, Winter 1991, Perry 1992, Vaughan et al. 1999).
The horizontal GRFs (anterior-posterior and medio-lateral) are considerably smaller than the vertical GRF. The anterior-posterior GRF (Fy) has an amplitude of 25 % BW. In the braking phase Fy is negative. Negative Fy is caused by the braking action of the foot coming down in front of the CG, indicating that it is pushing backward on the person. In the push-off phase Fy is positive when the body moves forward. The medio-lateral GRF (Fx) is related to balance during walking. Its magnitude is less than 10 % of BW in most situations. The Fx acts, firstly, in the medial direction during the loading response and then acts laterally during the rest of the stance period. Lateral shear reaches its peak in the terminal stance (Inman et al. 1981, Winter 1991, Perry 1992, Vaughan et al. 1999).
17
2.1.3 Muscle activity during walking
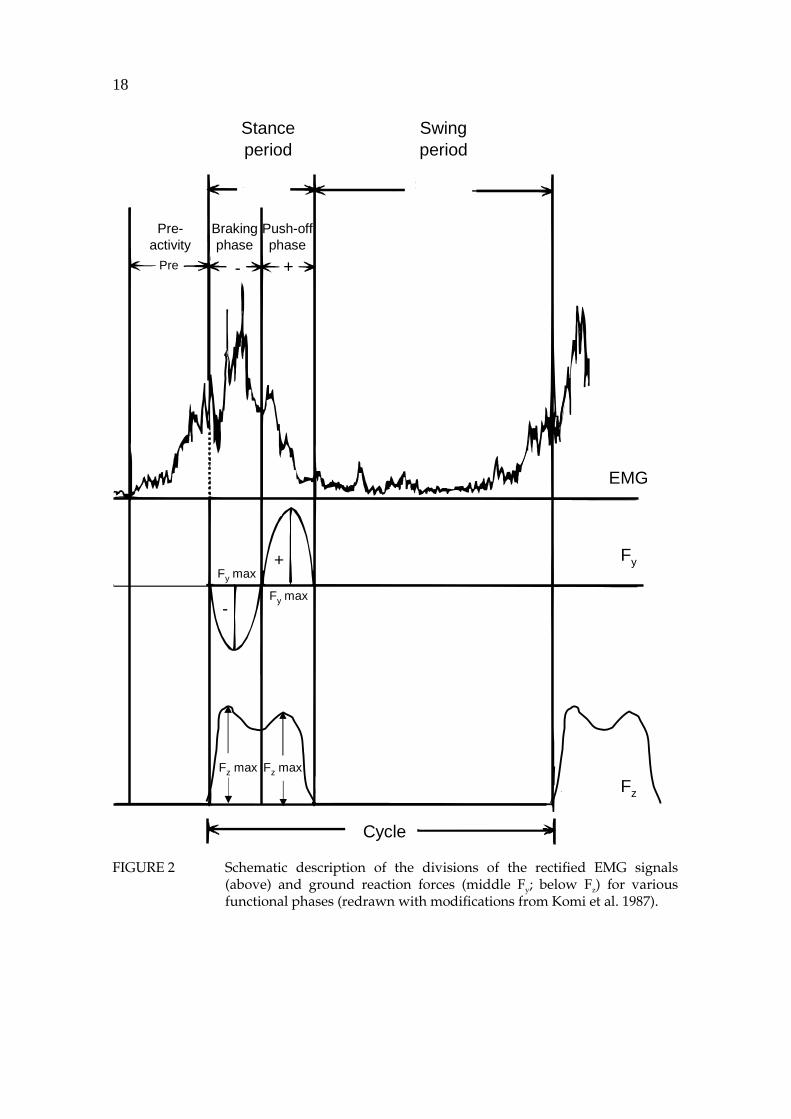
Muscle activity during normal walking has been well documented (e.g. Inman et al. 1981, Basmajian & DeLuca 1985, Shiavi 1985, Winter 1991, Perry 1992). In general, the lower leg muscles are most active in expectation of and just after foot contact when the foot adapts to the supporting surface (Basmajian & DeLuca 1985) (see also Figure 2). The pretibial group is activated on two occasions during the gait cycle: firstly, in the terminal swing phase and at the onset of heel contact and, secondly, at the beginning of acceleration during the swing period. The plantar flexor muscles have the highest activity in the push-off phase and the knee flexor muscles have their highest activity in the deceleration phase of the swing period and early ground contact. The knee extensor muscles have biphasic activity patterns. The first peak in activity occurs during the transition from swing to stance, and the second smaller peak occurs at the end of the push-off phase and during the early swing period (Milner et al. 1971, Dubo et al. 1976, Murray et al. 1984, Arsenault et al. 1986A, Shiavi et al. 1987).
2.2 Plantar pressure measurement techniques
As mentioned in the previous section, plantar pressure measurement has become an important research tool in gait analysis. The distribution of pressure between the sole of the foot and the ground provide valuable information about the structure and function of the foot (Gerber 1982, Ranu 1985). One of the earliest recorded attempts to describe foot loading patterns was made by Beely (1882) over a century ago.
There are three approaches to the measuring of plantar pressure: from the plantar surface of the bare foot to the ground, between the sole of the shoe and the ground, and between the plantar surface of the foot and the insole of the shoe (Lord 1981). Plantar pressure distribution has been analysed extensively using various sensors, e.g. capacitive (Nicol & Hennig 1976), resistive (Rose et al. 1992), piezo-electric (Hennig et al. 1982) and laser (Hughes et al. 2000). Capacitive and force sensitive resistor transducers are the two basic types in use today for plantar pressure measurement. Compression decreases the capacitance of a capacitor and the resistance of a force sensitive resistor (Cavanagh et al. 1992, Cavanagh & Ulbrect 1994). The various devices and measuring techniques are well covered in the reviews by Lord (1981), Roy (1988), Alexander et al. (1990), Cavanagh et al. (1992), Schaff (1993), Cavanagh & Ulbrect (1994), and Cobb & Claremont (1995).
18
Swingperiod
Stanceperiod
+-
+
-
EMG
Fy
Fz
Pre-activity
Brakingphase
Push-offphase
Cycle
Pre
Fy max
Fy max
Fz max Fz max
FIGURE 2 Schematic description of the divisions of the rectified EMG signals (above) and ground reaction forces (middle Fy; below Fz) for various functional phases (redrawn with modifications from Komi et al. 1987).
19
2.2.1 Barefoot plantar pressure measurement
Several methods exist which measure plantar pressure distribution under the bare foot (Cobb & Claremont 1995). The four main types are foot printing technique, optical systems, force plates and load cells, and insoles and pressure pads (Lord 1981). Morton (1930) used the printing technique, which offers a simple way of recording load distribution. Unfortunately, this device only recorded the highest pressure that occurred at a given point under the foot during a step. Harris and Beath (1947) developed their own footprint technique. The Harris mat is inexpensive and very practical but it provides only qualitative information about foot pressures (Silvano et al. 1980). Optical techniques give a better level of resolution for barefoot measurements than the foot printing systems. Therefore, pedobarograph systems have been used widely in static (Minns 1982) and dynamic plantar pressure studies (Duckworth et al. 1982, Betts et al. 1988, Fernando et al. 1991). Elftman (1934) described the first floor-mounted device for recording time-dependent pressure distribution. Since then, a number of different force plate and load cell systems have been developed. However, these platform systems cannot assess behaviour at the foot-shoe interface (Cavanagh et al. 1992) and the synchronised measurement of the specific periods of the gait cycle is difficult (Hennig et al. 1994). Subjects often have difficulty targeting the plates and therefore many walking trials are needed. They may also find barefoot walking problematical or uncomfortable (Duckworth et al. 1982).
2.2.2 In-shoe pressure measurement
In-shoe pressure measurements systems are frequently utilised in research and clinical work. Therefore, a variety of techniques have been developed that allow for the measurement of pressure inside the shoe (Roy 1988). In-shoe discrete transducers or matrix insoles for measurements at selected foot sole sites overcome targeting and barefoot walking problems (Cobb & Claremont 1995) as the transducers can be located at appropriate sites of interest (Lord et al. 1992). The in-shoe technique allows recording of plantar pressure between foot and shoe, and data can be collected easily from many consecutive steps (Cavanagh et al. 1992).
Small discrete in-shoe transducers are usually easy to manufacture (Cavanagh et al. 1992). Transducers can, however, introduce errors because their precise location will be a factor in the determination of the results (Lord 1981). For example, a small and thick transducer placed directly under the first metatarsal head may dorsiflex the metatarsal to a significant extent and may also be painful (Roy 1988). Palpation as a method of determing the location of sensors leads to inaccurate results, yielding values that are too high under bony protuberances or too low when the transducers move together with the skin of the sole during foot contact (Lord 1981, Lord et al. 1992).
Several problems associated with the use of discrete transducers can be avoided by using the matrix-insole technique, where transducers are embedded
20
in a thin and flexible insole (Cobb & Claremont 1995). The dynamic measurement of footwear and orthoses is possible with the insole technique and thin insoles can easily be placed into subject’s footwear. Insole pressure transducers are designed to provide localised information across multiple gait cycles, whereas the single force plate is limited to the capture of only one step from a walk (Lord 1981, Cavanagh et al. 1992). Recently, a number of measurement devices have been developed and employed (e.g. Nicol & Hennig 1978, Zhu et al. 1991A, Rose et al. 1992, Schumacher 1995, Pataky et al. 2000). However, the insole technique also suffers from problems: the problem of crosstalk between elements, repeatability between elements within and between insoles, errors due to bending forces, difficulty of calibration, temperature effects, and mechanical breakage (Roy 1988, Cavanagh et al. 1992, Cobb & Claremont 1995, Pitei et al. 1996).
2.3 Factors influencing plantar pressure
2.3.1 Structural factors
There are a number of parameters related to plantar pressure. High forefoot plantar pressure during gait is a significant risk factor for ulceration with diabetes patients (Stokes et al. 1975, Ctercteko et al. 1981, Boulton et al. 1983, Veves et al. 1992, Patel & Wieman 1993). However, abnormal high foot pressures alone do not cause foot ulceration, as patients with rheumatoid arthritis who had abnormally high plantar pressures but no neuropathy did not develop foot ulceration, whereas diabetic patients with neuropathy and high plantar pressures developed these problems (Masson et al. 1989). The duration of high pressure has also to be taken into account (Lord et al. 1986). Therefore, the integral of the pressure/time curve has been used as a sensitive indicator (e.g. Soames 1985).
Limited joint mobility at the subtalar and first metatarsophalangeal joint may be a major factor in causing abnormally high plantar pressure (Fernando et al. 1991). Induration following periarticular loss of soft tissues over the metatarsal heads is associated with recurrent ulcers and plantar-pad hardness, leading to further ulceration by decreasing shock absorbing capacity (Brink 1995). The plantar callus is a risk for subsequent ulceration (Murray et al. 1996). Young et al. (1992) demonstrated that removal of the callus dramatically decreases (by 29 % on average) elevated plantar pressures. It has also been suggested that a lack of variability in the stresses on the feet may cause ulceration (Cavanagh et al. 1993), although reduced variability in plantar loading has not been found to be a factor in the development of plantar lesions in neuropathic patients (Cavanagh et al. 1998).
Other structural factors, such as relative metatarsal length (Morton 1935, Rodgers & Cavanagh 1989), bony prominences (Duckworth et al. 1985), and the formation of the medial longitudinal arch of the foot (Hennig et al. 1994,
21
Miyahara 1993, Rodgers 1995) have been suggested as causes of elevated plantar pressure. Cavanagh et al. (1997) studied foot structure with radiographic measurements and optical pedobarographs. They found that radiographically obtained structural measurements explain approximately 35 % of the variance in peak plantar pressure under the heel and the first metatarsal head during walking. According to the authors, the two main factors in the prediction of pressure are compressed soft tissue thickness and medial longitudinal arch height.
Predictive models of the regional peak plantar pressures have been developed further by Morag & Cavanagh (1999). Their foot structure and function model predicted the variance in peak plantar pressure better than the previous model by Cavanagh et al. (1997). The variance of peak plantar pressure varied from 48.6 % to 56.6 % in different anatomical regions. Morag & Cavanagh (1999) found that structure was dominant in predicting peak pressures under the midfoot and first metatarsal head while both the structure and function predictors were important at the heel and the hallux. A large calcaneal inclination and high foot-approach velocity increased peak plantar pressure in the heel area. The magnitude of midfoot pressure was dominated mainly by arch height, body mass, and age. Body mass and arch height increased and age decreased plantar pressure. Body mass as a single predictor accounted for 23.4 % of the variance in the midfoot, but the authors found no similar associations in other regions of the foot. The Morton’s index, the height of the sesamoid, calcaneal inclination, proximal first phalanx inclination, and Chopart’s angle were the factors that determined peak plantar pressure under the first metatarsal head. However, the structural factors together accounted for the majority of the variance in peak plantar pressure; the high activity of the gastrocnemius muscle during the push-off phase was also related to high peak pressure under the first metatarsal head. Pressure on the hallux is a balanced combination of the structural and functional factors, according to the authors. A long hallux, a small amount of compressed tissue under the sesamoides, a large angle between the proximal and distal phalanx, a small dynamic range of motion at the first metatarsal joint, and high peak velocities of dorsiflexion at this joint in the push-off phase increased pressure on the hallux.
A weak positive correlation has been found between body mass and peak plantar pressures under the lateral forefoot (Stott et al. 1973, Grieve & Rashdi 1984, Soames 1985, Hennig & Milani 1993) and medial forefoot (Snow et al. 1992), but not under the heel area, during gait. In contrast, Clarke (1980) found that the sum of peak pressure (from each of eight anatomical areas added together) had a poor correlation with body mass in walking. Cavanagh et al. (1991) found that the correlation coefficient between body mass and peak plantar pressure under the metatarsal heads or hallux in a group of diabetic men was .37 and in the control group .36. Similar findings were observed by Sarnow et al. (1994). Hennig & Milani (1993) and later Hills et al. (2001) found a higher correlation between body mass and peak plantar pressure in women than in men. In addition, Hills et al. (2001) demonstrated that obese adults had significantly higher plantar pressure than non-obese during standing and walking. In contrast to the findings in adults, body mass has been identified as
22
a major factor influencing the magnitude of the pressures under the feet of school children (Hennig et al. 1994). Furthermore, body mass has been reported to be a fairly good predictor of midfoot peak plantar pressure (Morag & Cavanagh 1999).
The mild correlation between peak plantar pressure and body mass is a rather confusing finding (Cavanagh et al. 1991), because peak GRF during gait has been shown to be related to body mass (Andriacchi et al. 1977). The nature of the recording systems (Soames 1985, Cavanagh et al. 1991) or the distributions of high loads across larger local anatomical areas (Hennig et al. 1994) are often the reasons for the lack of a strong relationship. Barnett et al. (2001) compared a force measuring platform with an insole measuring system at the same sampling frequency. Both systems gave similar temporal results, but the in-shoe systems underestimated the magnitude of the force data. The increase in lateral foot pressures with increasing weight may also be due to the problems involved in controlling the lateral stability of higher body mass during gait (Soames 1985).
Age has been found to be related to decreased heel plantar pressure (Morag & Cavanagh 1999). The peak plantar pressures on the lateral metatarsal heads and midfoot have also been found to correlate significantly with age (Stott et al. 1973). However, more work is needed to evaluate the true effect of age on plantar pressure distribution.
2.3.2 Functional factors
In addition to structural factors, there are also a number of functional factors, which are closely related to the plantar pressure. A high foot-approach velocity has been found to increase the peak plantar pressure at the heel area. Similarly, a high peak velocity of dorsiflexion at the first metatarsal joint in the push-off phase elevates pressure on the hallux and high activity of the gastrocnemius increases the peak plantar pressure under the first metatarsal head during the push-off phase (Morag & Cavanagh 1999). Recently, sensory feedback from the cutaneous receptors in the foot has been found to play an important role in the regulation of plantar pressure distribution. When the sensory feedback from a part of the foot was inhibited by cooling the skin of the sole to less than 6° C, the centre of pressure (COP) shifted towards areas of greater sensitivity during walking (Nurse & Nigg 2001). Furthermore, it was found that the peak plantar pressures were higher in the areas of normal sensitivity and lower in the insensitive areas. Because changes in sensory feedback affect motor output, sensory input variables must included in any future predictive models of the regional peak plantar pressures (Nurse & Nigg 2001).
2.3.3 Methodological factors
The selection of the corrected transducer size is important because the size required will depend on the size of the anatomical landmark. Plantar pressure measuring systems with larger transducers will give data of substantially
23
poorer quality. A transducer, which is larger than the actual landmark gives a lower reading than the actual pressure. Thus in these cases, the spatial resolution of the measuring system is poor (Morlock & Mittlmeier 1992, Cavanagh & Ulbrect 1994, Lord 1997). A 10 mm2 compared to 5 mm2 transducer underestimated peak pressures in the toe region, whereas in the heel region both transducers yielded similar peak pressures. The difference between the two regions is probably because the peak pressures under the toes and metatarsal heads are more localised than those in the heel region (Davis et al. 1996).
The peak plantar pressures are also affected by sampling frequency (Roy 1988). The peak pressures are lower, especially, in the heel area, when the sampling frequency is low, because heel impact cannot be detected accurately at low sampling rates. This leads to an underestimation of peak pressures at faster walking speeds (Morlock & Mittlmeier 1992, Schaff et al. 1994, Rozema et al. 1996). Acceptable sampling frequencies for gait study are 50 Hz and above (Schaff 1993).
The data collection technique (first step, two-step and midgait method) used has an effect on plantar pressure distribution (Rodgers 1985, Meyers-Rice et al. 1994, Harrison & Folland 1997, McPoil et al. 1999, Wearing et al. 1999). Rodgers (1985) compared pressures recorded from both the first step and the midgait for 60 healthy men. The peak pressures for the heel and metatarsal heads were on average 34.0 % and 4.7 % lower, respectively, for the first step. Lower first step peak and lower two-step values for the rearfoot were also reported by Meyers-Rice et al. (1994) and McPoil et al. (1999). During midgait the forefoot peak pressure values were lower than those in the first step and two-step protocols, 13 %, 7 %, respectively (Meyers-Rice et al. 1994). In contrast, McPoil et al. (1999) found that only the two-step method gave higher forefoot plantar pressure values than the midgait protocol.
Contact time seems to be most sensitive parameter to different walking condition and leg problems (Bryant et al. 1999). In a recent study Wearing et al. (1999) showed that the two-step gait initiation protocol and the gait termination protocol resulted in increased stance period compared to the midgait. The differences may due to slower velocity during the beginning and end of the walking trials. Harrison & Folland (1997) compared different gait protocols and reported elevated first step peak values under the heel and medial and lateral forefoot as compared to the midgait. The low sampling frequency (25 Hz) and the unnatural first step may explain the differences in the heel pressure values compared to those obtained in the earlier studies by Rodgers (1985) and Meyers-Rice et al. (1994). The stride length controlled protocol has been recommended as the most consistent for forefoot pressure studies (Harrison & Folland 1997). Walking strategies also have effect on plantar pressure. The hip walking strategy produces a 27 % decrease in forefoot peak plantar pressure and a 24 % increase in heel peak plantar pressure as compared to the ankle (normal) walking strategy (Mueller et al. 1994). It is likely that these different results are caused by the fact that the steady-state gait is not achieved until the third step (Hirokawa 1989, Miller & Verstraete 1996). It is therefore important in a steady-state gait study that at least three steps are taken before data recording
24
(Miller & Verstraete 1996) and at least five trials from each foot are recorded (Cavanagh & Ulbrect 1994).
Visual targeting has a minor effect on the plantar pressure (Nichloson et al. 1998). Harrison and Folland (1997) suggested that targeting during midgait might create abnormal gait patterns. In contrast, Grabiner et al. (1995) noted that visual guidance had a negligible effect on the variability of GRFs. However, force plate targeting results in temporospatial variations in the gait cycle. Stride and step length elongate or shorten just before and immediately after the target area (Hirokawa 1989). Adjustments in step length, however, had no effect on the magnitude, timing and variability of GRF (Wearing et al. 2000). The main problem in these and other related studies is how representative the measurement can be when it is performed on a single small force plate (Cavanagh et al. 1992). Therefore, it is questionable whether the placement of the foot takes place naturally under these conditions. The question should be answered by applying the insole technique and using several force plates, which would allow recordings of many consecutive steps and eliminate possible targeting problems.
2.3.4 Influence of footwear on plantar pressure
The flexible sole of an ordinary shoe increases the total area of foot contact during the stance period, and shifts the COP from the first and second metatarsal heads and toes to the midline of the shoe (Grundy et al. 1975). It has been shown showed that in the shod foot the peak plantar pressures and maximal forces were lower than in barefoot walking in most of the areas under the foot except the medial forefoot (Sarnow et al. 1994, Nyska et al. 1995). Leather-soled Oxford-style shoes and running shoes both significantly reduced the pressure under the second metatarsal. Running shoes decreased the pressure in all areas under the foot, but the Oxford-style shoes did not significantly reduce plantar pressure in the other parts of the sole of the foot. The effect of Oxford-style shoes were similar to that of socks on peak plantar pressure. Therefore, running shoes may relieve pressures sufficiently to protect the sole from ulceration (Perry et al. 1995).
A high-heeled shoe with a narrow toe box resulted in an increase in the peak pressure beneath the metatarsal heads and hallux (Mandato & Nester 1999). The average peak pressures under the foot increased by 22 %, 57 %, and 76 % for low, medium and high heels, respectively, when compared to barefoot walking (Snow et al. 1992). The prolonged use of high-heeled shoes has been found to shift the COP laterally (Gefen et al. 2002). This lateral shift reduces the medio-lateral stability under the feet and impairs body balance. These changes in the distribution of body balance combined instability of high-heeled shoes increases the risk of accidental injury (Gefen et al. 2002).
Therapeutic footwear has been shown to reduce peak pressures (Schaff & Cavanagh 1990). However, Lavery et al. (1997) found that comfort and athletic cross-trainer shoes were as effective as commonly prescribed therapeutic shoes in reducing the mean peak pressure on the forefoot. Different insole materials
25
are also capable of reducing considerably the peak plantar pressures and pressure-time integrals (e.g. Leber & Evanski 1986, McPoil & Cornwall 1992, Sanfilippo et al. 1992, Lavery et al. 1997, Bus et al. 2001, Drerup & Wetz 2001).
2.3.5 Reliability of plantar pressure measurements
It has been indicated above that different plantar pressure measurement technologies produce different results (Cavanagh & Ulbrect 1994). If the measuring device is unable to yield consistent, repeatable results in successive trials, its information is poor for research purposes (Quaney et al. 1995). Variables based on time seem to vary more than those of pressure or force and need more trials to achieve the same levels of reliability (Hughes et al. 1991, Kernozek et al. 1996). In contrast, Wearing et al. (1999) found that the timing parameters were the most consistent, while peak pressure and the pressure-time integral were found to be the least consistent variables. Low sampling frequency may partly explain the poor reliability values of parameters based on time (Hughes et al. 1991).
Quaney et al. (1995) compared pedobarograph and capacitive pressure measuring systems. They found good between-trial reliability, with an intraclass correlation coefficient greater than 0.898 for both systems. To achieve good reliability using a pressure measurement system (>.90), a maximum of 10 steps is recommended (Hughes et al. 1991, Kernozek et al. 1996). Milani et al. (1990) found that the day-to-day variability of plantar pressure distribution measuring walking depends on the foot area.
Several studies have compared two or more measuring systems (e.g. Hughes et al. 1987, Hughes et al. 1993, McPoil et al. 1995, Quaney et al. 1995). The peak plantar pressure and plantar pressure timing patterns showed a similar overall distribution, but with differences in specific foot regions (Hughes et al. 1987, Hughes et al. 1993, Quaney et al. 1995). There are many reasons for these differences. The subjects may belong to more than one group (Hughes et al. 1993). Therefore, the results may indicate subject differences rather than system differences. The walking velocity used may not be the same in walking trials done using different systems (Hughes et al. 1987). A higher spatial resolution and different sampling frequency may also explain discrepancies between pressure measurement systems (Quaney et al. 1995).
Quesada & Rash (2000) collected plantar pressure data simultaneously from capacitive and resistive in-shoe pressure measurement systems during gait. The resistive insole system recorded approximately 20 % greater overall peak pressures. The difference was greatest under the heel (32 %) and lowest under the big toe (14 %). Consequently, the variability of the capacitive insole system was 60 %, 20 %, and 22% lower than that of the resistive system, at the heel, central metatarsal head, and big toe, respectively. Unfortunately, the authors did not report the sampling frequencies, as these may partly explain the great difference observed in the heel area. Regardless of the differences obtained between the various measurement technologies, all were capable of measuring regional pressure satisfactorily (Hughes et al. 1993, Quaney et al.
26
1995, Quesada & Rash 2000). On the contrary, McPoil et al. (1995) reported, that the reliability and validity of the resistive insole technology was unsatisfactory.
2.4 Plantar pressure distribution in walking studies
Although a great deal of individual variability exists in peak plantar pressure, the findings are relatively consistent and pressure patterns are quite similar in the different plantar pressure studies. In general, the highest peak pressures have been obtained under the heel, forefoot and big toe, while the lowest pressures have been found under the midfoot and lateral toes during gait. The highest pressures under the heel occurred in early stance and the highest pressures under the metatarsal heads in late stance (e.g. Boulton et al. 1983, Soames 1985, Rodgers 1985, Shorten et al. 1989, Zhu et al. 1991B, Hennig & Milani 1993, Chang et al. 1994, Hennig et al. 1994, Perry et al. 1995, Zhu et al. 1995, Rosenbaum et al. 1996A, Wearing et al. 1999). A comparison of the regional peak pressures obtained in several studies is summarised in figure three. The duration of contact with the ground under the heel and midfoot takes up approximately 60 % of the whole stance period. The duration of ground contact under the metatarsal heads is approximately 60 % and under the toes 50 – 55 % (Soames 1985). All the metatarsal heads are loaded during standing (Cavanagh et al. 1987, Hennig & Milani 1993) and walking (e.g. Hennig & Milani 1993, Perry et al. 1995). These findings reject Morton’s (1935) classical theory of tripod loading, according to which there is no pressure is under the middle metatarsal heads.
0
200
400
600
800
1 2 3 4 5 6 7 8 9 10
Mea
n P
ress
ure
kPa
12
3
10
4
9 8
76 5
FIGURE 3 Means and SD for the peak pressures under the foot during walking on the basis of plantar pressure studies (Rodgers 1985, Shorten et al. 1989, Zhu et al. 1991B, Snow et al. 1992, Hennig & Milani 1993, Hennig et al. 1994, Chang et al. 1994, Perry et al. 1995, Zhu et al. 1995, Rosenbaum et al. 1996A, Bryant et al. 2000).
27
2.5 Effects of walking speed on foot loading
Walking speed is the product of step frequency and step length, or stride frequency and stride length (Inman et al. 1981, Winter 1991, Perry 1992). The control of speed is very important as it is well known that the size of the GRFs depends on walking speed (e.g. Andriacchi et al. 1977, Vaughan et al. 1987, Nilsson & Thorstensson 1989, Winter 1991). The electromyographic activity (EMG) of the lower leg muscles also increases when walking speed increases but the patterns of activity remain basically the same (e.g. Miyashita et al. 1970, Milner et al. 1971, Brandell 1977, Winter 1983, Murray et al. 1984, Nilsson et al. 1985, Shiavi et al. 1987). A reduction in walking speed is a common characteristic in patients, independent of diagnosis (e.g. Andriacchi et al. 1977, Minns & Craxford 1984, Trias et al. 1994, Perttunen et al. 1995). The peak plantar pressure and GRFs may vary at similar walking speeds, since walking speed can be produced with different combinations of stride length and cadence.
Walking speed also changes plantar pressure distribution. In general, peak pressures and total force increase linearly with an increase in walking speed. Furthermore, peak plantar pressures increase in most areas of the sole, but decrease or remain almost constant in the lateral mid- and forefoot and fifth toe when walking speed increases (Shorten et al. 1989, Hughes et al. 1991, Rosenbaum et al. 1994, Kernozek et al. 1996). The increase in pressure under the medial forefoot and decrease under the lateral forefoot are associated with a significant medial shift in the location of the forefoot pressure peak (Shorten et al. 1989, Rosenbaum et al. 1994). This shift seems to be closely related to a more pronounced pronation, as indicated by the increase in eversion of the hindfoot (Rosenbaum et al. 1994). In contrast, some authors have found no reduction in peak plantar pressure under the lateral forefoot with increased walking speed (Zhu et al. 1995, Rozema et al. 1996). The pressure-time integrals decrease in proportion as walking speed increases (Zhu et al. 1995, Kernozek et al. 1996). The differences between studies may due to several factors: the spatial resolution of the measuring system, the walking speeds tested, sampling frequency, and the effects of measuring in-shoe versus the bare foot on a rigid platform (Kernozek et al. 1996).
2.6 Walking symmetry
Non-pathological human gait typically reflects symmetrical lower extremity foot loading patterns (Clayes 1983, Hamill et al. 1984, Menard et al. (1992) and a symmetrical gait is the best for walking at a freely chosen step rate (Rodano & Santambrogio 1989). No significant differences were found in the Fz and Fy
parameters between right/left and preferred/nonpreferred legs during walking (Hamill et al. 1984, Menard et al. 1992). Likewise, the plantar pressure patterns
28
are bilaterally symmetrical (Grieve & Rashdi 1984, Luger et al. 1999). However, the parameters of the GRF in the medio-lateral direction were characterised by considerable asymmetries, probably due to the high variability found along this axis (Herzog et al. 1989, Giakas & Baltzopoulos 1997). Therefore, Fx
measurements are not reliable and should not be used as critical measures in walking assessment.
On the contrary, the electromyographic (EMG) findings in the literature are somewhat controversial. Pierotti et al. (1991) did not find asymmetry in average EMG patterns in normal subjects for six knee muscle activities during free, slow and fast walking speeds. Furthermore, the bilateral symmetry became more repeatable at the fast walking speed. Similarly, Arsenault et al. (1986B) did not find asymmetries in the EMG amplitude profiles for the soleus (SOL) and rectus femoris (RF) muscles. However, the biarticular RF muscle showed wider variation than the monoarticular SOL muscle. In contrast, Õunpuu & Winter (1989) reported symmetrical EMG activity in seven selected muscles recorded simultaneously during walking, except the SOL muscle. On the other hand, in six of the seven muscles tested the activity on the dominant side was greater than that on the non-dominant. It must be emphasised, however, that in human gait, EMG activation of the leg extensor muscles is much more sensitive to extensive loading differences than are GRFs, for example Komi & Gollhofer (1991). According to Sadeghi et al. (2000), gait asymmetry seems to reflect a natural functional difference between the limbs. This functional difference is probably related to the contribution of each limb in carrying out the tasks of propulsion and control during able-bodied walking. Limb laterality may be another explanation for the existence of functional differences between the limbs (Sadeghi et al. 2000).
2.7 Leg length discrepancy
Leg length discrepancy (LLD) is a condition where the lower extremities are of unequal length. The bilateral discrepancy may be in the femur, in the tibia, or in both and is a common clinical finding in paediatric orthopaedics (Moseley 2000). It has been estimated that 1 per 1000 of the population requires some form of limb length correction (Guichet et al. 1991). Corrective procedures are usually recommended when the bilateral difference in limb length is more than two centimetres (Beaty 1992). However, this recommendation has not been well defined; there is uncertainty in the literature concerning the magnitude of the LLD for surgical intervention (e.g. Menelaus 1991, Moseley 2000, Gurney 2002). An uncorrected LLD may result in pain and the early appearance of osteoarthritis of the lower extremities (e.g. Gofton & Trueman 1971, Giles & Taylor 1981, Kujala et al. 1987). Surgical procedures to equalise LLD include the following: shortening of the longer leg, slowing or stopping the growth of the longer leg, and lengthening of the shorter leg (Moseley 2000).
29
Uncorrected discrepancies can change movement kinetics and kinematics and result in altered gait patterns or in a limping gait. The ground contact time reportedly decreases on the shorter side (Delacerda & Wikoff 1982, D’Amico et al. 1985, Schuit et al. 1989, Kaufman et al. 1996, Bhave et al. 1999). Gait asymmetry is the greater the larger the bilateral difference in the leg (Kaufman et al. 1996). Comparing GRF bilaterally, Bhave et al. (1999) found that the mean Fz in the push-off phase was 104 percent of BW for the short limb as compared with 116 percent for the long limb. Schuit et al. (1989) found that maximal Fx
was larger in the foot of the shorter leg. Subsequently, Liu et al. (1998) found that the asymmetry of Fz on initial contact increases, but asymmetry of Fx
decreases in the terminal phase of stance in the shorter leg. The authors also concluded that the effect of the amount of correction produced by a heel lift on gait symmetry is unpredictable. Schuit et al. (1989) reported that, especially after shoe-lift, the asymmetry of the Fz between the limbs increased. LLD more than 5.5 percent of the length of the longer extremity have been reported to lead to greater mechanical work on the longer side, and to a greater vertical displacement of the CG of the body (Song et al. 1997).
2.8 Lower leg fractures
Fractures with extreme soft-tissue damage often cause impairment of calf muscle function, which may be associated with an impaired ability to walk. Becker et al. (1995) used plantar pressure distribution measurements and found significant load asymmetry after successful surgical treatment of ankle fractures. Patients with more successful operations put more load on the lateral side of the forefoot of the injured leg. Similarly, less successful operative treatment resulted in reduced pressures under the metatarsal heads. Rosenbaum et al. (1996A) also found a lateral shift in the plantar pressure of the injured foot after calcaneal fractures. In a vitro study by Rosenbaum et al. (1996B) increased loading in the calcaneocuboid joint and decreased loading in the talonavicular joint after simulated calcaneal fractures led to high lateral plantar pressure. Furthermore, Durham et al. (1994) observed that after free flap reconstruction of a soft tissue defect in the heel, peak plantar pressure was elevated in the injured heel as compared with the healthy side.
3 THE PURPOSE OF THE STUDY
As has been become evident from the preceding paragraphs foot loading has been rather extensively studied, especially in normal gait. Such studies have mostly concentrated on the plantar pressure distribution or the ground reaction force (GRF) patterns. In order to understand the true meaning of foot loading its measurement needs to be integrated with other measures of neuromusculo-skeletal function. Therefore, the main focus of this series of studies was to examine the interaction between foot loading patterns and neuromusculo-skeletal adaptation during gait. Furthermore, the purpose was to identify how the impaired ability to walk after surgical intervention affected foot loading patterns and neuromusculoskeletal function and to evaluate the efficacy of surgical treatment and rehabilitation. The detailed objectives of the present study can be categorised as follows:
1) It has been demonstrated that walking speed affects the pressure distribution patterns and force production in healthy subjects at different walking speeds. However, these studies have not been performed in true natural walking condition. Therefore, the plantar pressures and GRF variables were examined bilaterally under conditions which allow natural walking with many consecutive steps along a long force platform. These two methods were also compared to identify possible asymmetries in human walking. Furthermore, the purpose of the first study was to examine whether the measurement of plantar pressure was a relevant way to clarify pathological foot mechanics.
2) Tibial fractures with excessive soft-tissue damage often cause impairment of calf muscle function, which may be associated with the impaired ability to walk. Thus, the second study focused on identifying how the impaired ability to walk affected plantar pressure distribution and the neuromuscular function of the leg muscles after reconstructive surgery for severe tibial fractures with massive soft-tissue damage and an estimating the potential of these parameters in evaluating the efficacy of treatment.
31
3) The third study (III – IV) collected reference data from an extremely high foot loading activity. The triple jump is a sports event in which the human lower limbs have to be able to tolerate extremely high impact loading and in which the lower limb bones are close to the upper limit of the adaptive capacity of human bones. Thus, the purpose of the third study was to investigate neuromuscular function and impact loads in the triple jump with a specific focus on the interaction between GRFs, plantar pressures, and muscle activities during the triple jump. In addition, this study examined the bone mineral density of these triple jumpers and compared their results with those of normal controls.
4) Uncorrected limb length discrepancy (LLD) may lead to pathological loading of the spine and the lower limbs. Therefore, an understanding of foot loading characteristics helps to prevent possible degenerative changes of certain spine and limb structures. The purposes of the remaining studies (V – VII) were to examine how the correction of LLD by two different surgical procedures modified the foot loading patterns and how the force production of the leg extensor muscles changed after surgical intervention. In addition, special attention was paid to the interaction between neuromusculoskeletal adaptation and movement patterns before and after corrective surgery. The studies were also undertaken to evaluate whether recovery from these musculoskeletal disorders was satisfactory as evaluated by the present methodology.
4 RESEARCH METHODS
4.1 Subjects
Seventy subjects participated in the various experiments in this study. Physical characteristics of the subjects are presented in Table 1. There were 12 adult subjects in the first experiment, which is reported in paper I. The second experiment included 17 patients, who were selected according to severity of their tibial fracture. Their results are reported in paper II. The third experiment included 16 subjects, eight national level triple jumpers and eight control subjects. Their results are reported in papers III and IV. For the fourth experiment, reported in paper V, the number of subjects was 25, 14 of whom were selected for the fifth and sixth experiments. These 14 young patients were further divided into two experimental groups according to the surgical technique need. Their results are reported in the papers VI and VII. All the subjects were fully informed of the procedures and the risks involved in these studies and they gave their informed consent. The study was conducted according to the Helsinki Declaration and the studies were approved by the Ethics Committee of the Central Hospital of Central Finland. The Ethics Committee of the University Hospital of Helsinki approved the study design of the second experiment.
33
TABLE 1 Physical characteristics of the subjects, mean and SD.
Mean SD Mean SD Mean SDExp. 1 Healthy subjects (n = 12) 29 6 1.83 0.09 81.4 12.4Exp. 2 Patients (n = 17) 51 11 1.78 0.06 85.4 16.2Exp. 3 A Male jumpers (n = 4) 24 2 1.85 0.04 76.7 3.8
The measurements were performed immediately after familiarisation on a 30-m long walkway (covered with a Tartan-mat). A 10-m long force platform consisted of two parallel rows of individual plates. Details about the force plates will be given in paragraph 4.3.2. The force plate system was mounted in the middle of the walkway. The healthy subjects were examined at target velocities of 4.0 km·h-1 (slow), 5.5 km·h-1 (normal), and 7.0 km·h-1 (fast) walking speeds, corresponding to 1.11, 1.53 and, 1.94 m·s-1, respectively. The margin for accepting a trial was ± 2.5% of the selected speeds, and the subjects’ walking speed was measured and controlled by photocells. The order of the walking speeds was randomised, and all the subjects walked three times at each speed. In each trial at least five contacts from each foot were collected. Every subject wore the same type of athletic running shoes during testing in order to minimise any possible effects of shoes on performance.
A portable, in-shoe pressure data-acquisition system was used to measure plantar pressure distribution. The insoles were connected to the Data Logger, which was fixed by a belt to the subject’s back. The sampling frequency was 100 Hz. The data collection was initiated by remote control and was synchronised with the ground reaction force (GRF). Asymmetries during walking were examined using the symmetry index (SI) (Herzog et al. 1989).
4.2.2 Experiment 2
In the second experiment, foot loading patterns were investigated in 17 patients recovering from the reconstruction of severe tibial fractures. The gait analyses
34
were done from 9 months to 14 years after a successful free flap reconstruction. The subjects did the walking trials on a 30-m walkway and they were given time to become familiar with the experimental procedure. All the patients were instructed to walk naturally twice along the walkway at their own preferred speed. Walking speed was measured with photocells and the recording distance was 10 m. The bilateral plantar pressure distribution and bilateral electromyographic activity (EMG) of the lateral head of the gastrocnemius (GL), tibialis anterior (TA), and vastus medialis (VM) muscles were measured. The sampling frequency for plantar pressure was 200 Hz, and for the EMG recordings 800 Hz. The data collection was initiated by remote control.
4.2.3 Experiment 3
Sixteen subjects were involved in the third experiment. The 2-D GRFs were measured by a force platform (13-m long) from three female and four male national level triple jumpers during the hop, step and jump. Their personal best competition performances were 13.25 ± 0.11 m (females) and 15.75 ± 0.82 m (males), and the average training background of the whole group was 7 ± 3 years. The measurements were performed immediately after a competition season. The subjects performed three to six jumps and the three longest jumps were selected for the final analysis. Run-up speed during the last five metres was measured with the photocells (III).
The Paromed-System® was used to measure the plantar pressure distribution simultaneously with the EMG recorded bilaterally. The EMG was recorded with surface electrodes from the gluteus maximus (GM), vastus lateralis (VL) and gastrocnemius lateralis (GL) muscles of both legs. The data collection was initiated by remote control and was synchronised with the GRF. The signal transmitted by a light synchronisation device was recorded in the Data Logger. The same signal was also sent telemetrically to another computer. In the analysis, the collected triple jump recordings were divided into the hop, step and jump phases. The contact period was divided into the braking and push-off phases according to the direction of the horizontal GRF (Mero & Komi, 1986).
As a reference locomotion, the jumpers walked three times at their preferred speed along the 30-m walkway incorporating the 13-m force platform. The highest GRFs in the dominant lower limb (i.e., the primary take-off limb) were included in the further analysis. Their gender-, age-, height-, and weight-matched nonathletic pairs were also asked to walk over the force platform at exactly the same speed as the jumpers. During these trials, the 2-D GRF of the dominant lower limb was recorded. The bone mineral density (BMD) data from the jumpers were compared with the corresponding data from the controls. In addition, all the subjects were given a questionnaire for the evaluation of past injuries, known diseases, diet, medication and the life-style. The training history of the triple jumpers and the physical activity of the control group were also assessed.
35
4.2.4 Experiments 4, 5, and 6
In experiments four, five, and six the foot loading patterns were examined in the two patient groups. The similar plantar pressure, GRF, and EMG measurement protocol was used in all the experiments. The patients were instructed to walk naturally at a normal (1.53 m·s-1) and fast (1.94 m·s-1) walking speed. Before the measurements, all the subjects performed walking trials on the 30-m walkway to become familiar with the experimental procedure. The long force platform was mounted in the middle of the walkway and walking speed was measured by photocells placed at both ends. The margin for acceptance of the trial was ± 2.5 % of the selected speeds. The order of walking speeds was randomised, and all the subjects walked three times at both speeds. In each trial at least five contacts were collected from each foot. Every subject wore the same type of rubber-soled shoe during testing in order to minimize any possible effects of shoes on performance. Asymmetries during walking were examined using the SI (Herzog et al. 1989).
The bilateral plantar pressure distribution measurements were performed simultaneously with EMG recordings and the data collection was initiated by remote control. The EMGs were recorded bilaterally from the lateral head of the gastrocnemius (GL), vastus medialis (VM), and rectus femoris (RF) muscles. The sampling frequency for each pressure sensor was 200 Hz and for the EMG recordings 800 Hz. During each walking condition, 2-D GRFs were measured by two rows of force platform 10-m (in length) simultaneously with plantar pressure and EMG measurements during many consecutive steps (Figure 4).
To complement the walking measurement, additional performance measurements were recorded as well. These included the maximum unilateral isometric torque of the knee extensor muscles. The knee angle was 100° and the thigh was fixed on the seat in the distal part of the femur. The hips were fixed at 110° flexion. The ankle was attached to the moment arm just above the malleolus. The untested leg rested on a support table and the arms were not allowed to be supported during efforts. The patients also performed warm-up muscle actions before the measurements and after that they were asked to exert maximal unilateral force as rapidly as possible and to maintain that force for about 3-4 s. In all the tests, the subjects received verbal encouragement to exert maximal force. The patients performed from two to three muscle actions, and the best of them was selected for the final analysis.
In experiment five, seven patients were monitored for 52 weeks after epiphyseodesis for LLD, and in the last experiment seven patients were monitored for 52 weeks after closed intramedullary lengthening of the femur with lengthening device. The measurements were repeated three, 12, 24 and 52 weeks postoperatively in both patient groups. In addition, the same measurements were also performed one year after nail removal in experiment six (VII).
36
Insoles for measuring plantarpressure distribution
Datalogger
EMG electrodes
Photocell
Force platform
Photocell
Camera Camera
Insoles for measuring plantarpressure distribution
Datalogger
EMG electrodes
Photocell
Force platform
Photocell
Camera Camera
FIGURE 4 Schematic illustration of the walking conditions in experiments 4 – 6.
4.3 Recording procedures and analyses
4.3.1 Plantar pressure measurements
An in-shoe pressure data-acquisition system (Paromed-System, Paromed™ Medizintechnik GmbH, Germany, overall mass of 1.9 kg) was used to measure the distribution of plantar pressure in all the experiments in this project. The Paromed Datalogger is a 40-channel data-recording unit with 32 channels dedicated to pressure sensors and eight universal channels for analogy input from other measurement sources (e.g. EMG). The unit (weight 570 g) has two insole pressure transducers with 16 piezoresistive microsensors per insole embedded in constrained hydrocells (Figure 5). Each hydrocell consists of an incompressible fluid preserved in a constrained polyurethane pack that can only be deflected at the top and bottom. Theoretically the design allows for a pressure measurement that unifies the normal and tangential components of the force applied (Paromed Datalogger Instruction Manual 1995, Paromed Datalogger Operating Instruction 1999). The microsensor consists of a Wheatstone bridge circuit fixed onto a silicone membrane that deflects under pressure into an evacuated chamber. This allows for the measurement of loads between the foot and the supporting material and is considered to be self-compensating against changes in temperature (Leyerer et al. 1997).
37
FIGURE 5 On the left is the Paromed Datalogger® with insoles and remote control. During the experiments the Paromed Datalogger® is fixed by a belt on the patient’s back (on the right).
The measuring area of the sensors covers 23 % of the insole. The sensors are arranged to record pressures from the most clinically relevant areas of the foot, as optimised on the basis of a study of 350 subjects (Schumacher 1995). According to the manufacturer areas with little relevant information are equipped with fewer sensors (midfoot). In contrast, areas with great pressure information (forefoot) have a higher spatial resolution. With that structure the insoles can describe normal plantar pressures patterns satisfactorily. The sensors are calibrated by the manufacturer and each insole comes with a calibration file (Paromed Datalogger Instruction Manual 1995, Paromed Datalogger Operating Instruction 1999). According to the bench testing of the Parotec System, it has a range of measurement of 62.5 N·cm-2, resolution of 0.25 N·cm-2, accuracy of ± 2.0 % of full scale, and precision of ± 0.4 % of full scale. The results showed further that there was no visible temperature or humidity drift. The tests also showed insignificant hysteresis (0.05 % at 20 N·cm-2) and non-linearity (± 0.42 % of full scale) (Schumacher 1995).
In the present walking measurements, the subjects took more than three steps before the start of data recording to ensure a steady-state gait. In each walking trial at least five contacts of from each foot were collected. Thus, a minimum of 15 contacts from each foot were recorded and averaged in every experiment According to Hughes et al. (1991), a mean of ten contacts to each subject gives good reproducibility (0.97) for peak plantar pressure recordings. During testing, every subject wore the same type of rubber-soled shoes in order to minimize any possible effects of shoes on performance.
The plantar pressure data and EMG were saved on the exchangeable memory card (SPRAM-PCMCIA type I) and subsequently transferred to the Silicon Graphics workstation (Silicon Graphics, Inc, USA) for analyse and visualisation. All the plantar pressure analyse, visualisation and computer simulations were done by BMVM software (produced in the Department of Biology of Physical Activity). Bilateral maximal and average plantar pressures and the timing patterns of all the sensors were analysed and contour curves were drawn as well. The 3–D pressure contours were generated by the NURBS-
38
method (Non-Uniform Rational B-Splines method) (Kokkonen 1999). In addition, asymmetries for different parameters during walking were examined using the symmetry index (SI) presented by Herzog et al. (1989).
where Xr = gait variable for the right leg Xl = gait variable for the left leg
Perfect symmetry between legs requires a value of zero for SI and the level of symmetry was considered acceptable when SI < 10%.
4.3.2 Ground reaction force measurements
The GRFs were measured in the all experiments except experiment two, by strain gauge-type force plates (Raute Oy, Finland; natural frequency 150 Hz, linearity 1 %, cross talk 2 %). Fourteen separate force plates (I, V – VII) (total length 10 m; biomechanical laboratory of the Department of Biology of Physical Activity) are mounted in two rows and both force platform rows collect data only from their own side (Figure 4). This method allows GRFs to be collected from both feet simultaneously with plantar pressure and EMG measurements during many consecutive steps. In the triple jump experiments (III, IV) 2-D GRFs were recorded by a 13-m force platform (TR-test, Finland and Kistler, Switzerland; natural frequency > 150 Hz and sampling frequency 1 kHz) during the hop, step and jump.
Maximal and average GRFs as well as the resultant forces and their directions were analysed. All recorded and calculated signals were averaged intraindividually at each walking speed. Contact times were divided into the braking and push-off phases according to the direction of the Fy (Mero & Komi 1986) (see also Figure 2). A vertical force signal of 20 N was used to identify and trigger the beginning and the end of contact.
4.3.3 Measurement of electromyographic activity
In all the walking experiments EMG was recorded by a Paromed Dataloggersystem with pre-gelled single-use surface ECG electrodes (Niko Surgical Ltd., Type 4560, UK). Electrodes were placed longitudinally on the surface of the muscle belly at a fixed inter-electrode distance of 38 mm. Cross talk between muscles was assumed to have a minimal influence on the recorded signals because of the relatively large inter-electrode distance (Winter et al. 1994). To keep the inter-electrode impedance low the skin was dry shaved, rubbed with sandpaper and cleaned with isopropanol. The preamplification factor near the electrodes is set by the manufacturer (Paromed™ Medizintechnik GmbH) at 100 and the input impedance at 10 GΩ. The low and high cut-off frequencies
SI = Xr - Xl
½(Xr + Xl)•100%
39
were 10 Hz and 400 Hz, respectively. The sampling frequency was 800 Hz with bandwidth variation from 1 Hz to 120 kHz.
In the knee extensor MVC experiment (V – VII) the EMG signals were transmitted telemetrically, amplified by an FM microvolt amplifier (Glonner Electronic GmbH, Germany) (bandwidth 3 Hz to 360 Hz, sampling frequency 1 kHz). The EMG signal was stored simultaneously with the force signal on a computer hard disk via a real time data acquisition system (Codas, Dataq Instruments Inc., USA) with a sampling frequency of 1 kHz.
The EMG signals were full-wave rectified and the average EMG (aEMG) was computed in experiment two (II) for two phases: preactivity (0-100 ms before the heel contact) and stance. In experiments four, five and, six (V – VII), aEMG was computed for four phases: preactivity, braking, push-off, and postactivity (0-100 ms after toe-off). Contact times were divided into braking and push-off phases according to the direction of the Fy (Mero & Komi 1986) (Figure 2). In the triple jump experiment (IV), aEMG was also computed for four phases: preactivity (50-100 ms and 0-50 ms before touchdown), braking and push-off. The EMG amplitudes were then normalised to the average levels of five consecutive contacts recorded while walking at the preferred speed. Thus, the walking activity levels were denoted as 100% for these four phases. The EMG data was afterwards analysed with BMVM software at the Biomechanical laboratory.
4.3.4 Muscle strength measurements
The maximum isometric torque of the knee extensor muscles was measured in the sitting position (V – VII) by using a variable-resistance knee extension machine (David 200, David Fitness and Medical, Finland). The machine was modified so that the lever arm could be locked and the MVC could be recorded. The force signal was stored simultaneously with the EMG signal on a computer hard disk via a real time data acquisition system (Codas, Dataq Instruments Inc., USA). The force and EMG data were further digitised and analysed with a CODAS computer system.
4.3.5 Bone mineral density measurements
To evaluate how a triple jumper’s bones adapt to the extreme loading that occurs in the event, BMD was investigated by peripheral quantitative computed tomographic scans (pQCT) (Norland/Stratec XCT 3000, Stratec Medizintechnic GmbH, Germany) in experiment three (IV). BMD measurements were taken from the distal femur, proximal tibia, tibial midshaft, distal quarter of tibial shaft, and distal tibia of the dominant lower limb, according to standard procedures (Sievänen et al. 1998).
40
4.3.6 Statistical methods
Means and standard deviations (SD) were calculated in each subjects (I – VII). Multivariate analysis of variance (MANOVA) for repeated measurements was used to test for main effects of repetitions and experimental conditions as well as their combined effects on selected variables. It revealed that repetition had no statistically significant influence on any of the main variables in experiments one and three (I, III). Therefore, all the signals from each contact were averaged within the subject at each walking speed. Stepwise multiple regression analysis was used to examine the relationships between variables in experiment three.
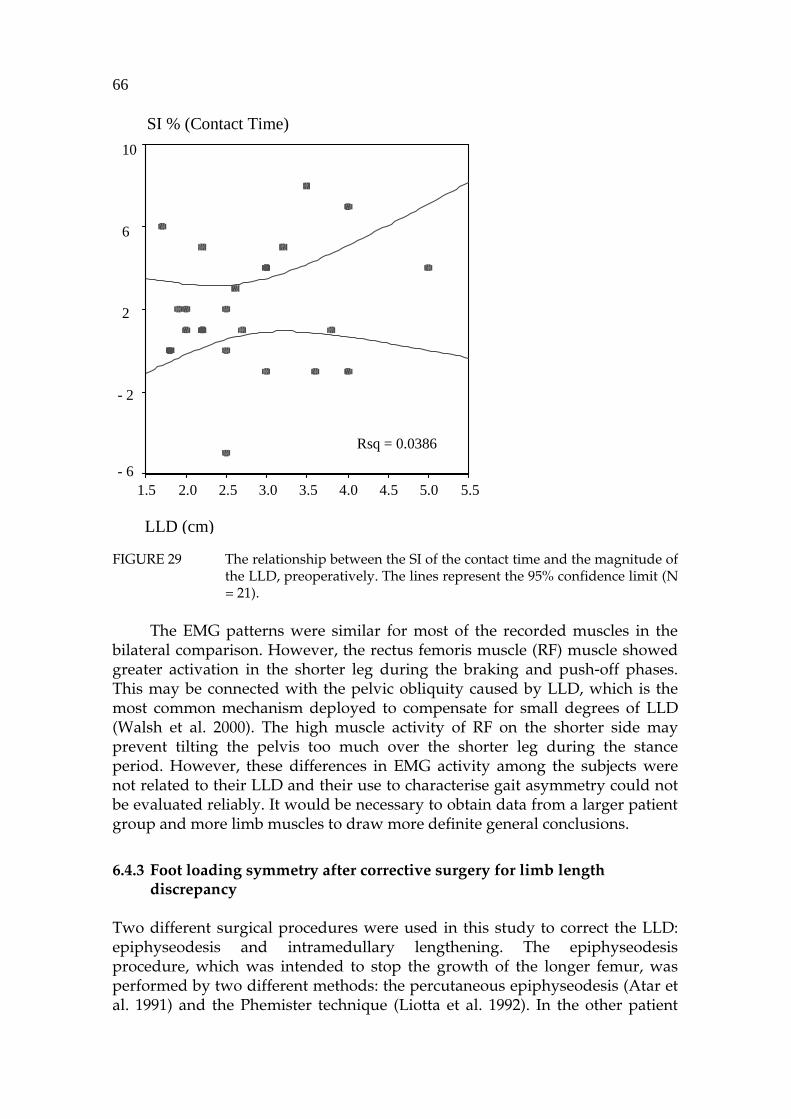
The statistical significance of the findings was evaluated with a paired t-test for comparison of all paired variables between the affected and the non-affected limb (II, V). Linear regression analysis was used to calculate the acceptable upper and lower limits of the discrepancy in patients with LLD (V).
The Wilcoxon Signed-Rank Test was used for paired comparison significance between surgically treated and the untreated limb of the patients (VI, VII). The comparison of the bone variables and leg extensor strength between the triple jumpers and their matched pairs were also analysed by the Wilcoxon Signed-Rank Test (IV). Furthermore, Spearman’s rank correlation coefficient was used to determine the association between the bone variables and the GRFs during walking and performance of the triple jump (IV). All statistical analyses were performed through the use of a statistical software package (SPSS, Version 8.0 or Version 9.0, SPSS Inc., USA).
5 RESULTS
The main findings from the present series of experiments are presented below. For more details the original papers (I – VII) should be consulted. Some unpublished results are also included.
5.1 Interaction between walking speed and foot loading
In the study of the normal population (I), the vertical and horizontal ground reaction forces (GRF) were strongly dependent on walking speed, as shown in figure six. The mean peak Fz in the braking phase was 1.07 ± 0.03, 1.24 ± 0.05 and 1.48 ± 0.08 times BW for the slow, normal and fast speeds, respectively. The corresponding values during the push-off phase were 1.07 ± 0.03, 1.14 ± 0.04 and 1.23 ± 0.06 times BW.
The peak plantar pressures were generally higher when walking speed increased (Figure 7). The highest peak pressures were obtained under the heel, the first metatarsal and the big toe (over 200 kPa), while the lowest peak pressures were found under the midfoot. Statistically significantly increased peak plantar pressures were found under the heel (p<0.001), the lateral forefoot (p<0.01), the first metatarsal (p<0.01), and the big toe (p<0.01). The foot loading patterns shifted towards the medial side of the forefoot with increased walking speed. The peak pressures were significantly reduced in the lateral region of the forefoot (p<0.01), but also diminished slightly in the centre part of the forefoot with increased walking speed.
42
( )N
FIGURE 6 The mean GRFs of one subject in the healthy subject group (experiment 1) at slow (24 contacts), normal (20 contacts), and fast (17 contacts) walking speed.
43
0
100
200
300
1 2 3 4 5 6 7 8 9 10 11 12 13 14 15 16
slow normal fastkPa Right foot
**
**
**
**
**
**
**
*
*
*
*
**
*
*
*
*
*
*
* p<0.01; * p<0.001*
FIGURE 7 The mean (SD) peak plantar pressures of the various sensors in the healthy subject group at slow, normal and fast walking speed (N = 12). The values are shown diagrammatically for the right foot only. Significance denotes differences from normal walking speed.
5.2 Walking symmetry
5.2.1 Normal gait
The foot loading patterns of the healthy subjects demonstrated symmetrical gait in the natural walking conditions (experiment 1). No statistically significant differences were found in this group between the left and right sides in any of the Fz and Fy parameters in the braking and push-off phases at the slow, normal, and fast walking speeds. In addition, the bilateral comparison of the mean SI for the GRF parameters remained under 10% between sides. Bilateral comparison of the plantar pressure distribution showed that the normal subject group had symmetrical patterns at the selected walking speeds (Figure 8). However, bilateral comparison of the mean SI for these parameters showed much greater variability, especially under the medial midfoot (sensor number 8).
44
Slow Normal Fast
FIGURE 8 Examples of the plantar pressure contour curves of one healthy subject at slow, normal, and fast walking speed.
5.2.2 Pathological gait
The patient groups showed excessive asymmetries as compared to the healthy subjects. After free flap reconstruction for open tibial fractures the stance period was shorter on the non-operated side. It was also shorter in the shorter limb as compared to the longer limb at normal and fast walking speeds in the LLD study.
Bilateral plantar pressure comparison showed that the peak pressures beneath the non-operated foot were generally higher than under the operated foot after reconstruction surgery for open tibial fractures. The peak pressures under the lateral forefoot (sensors 9, 10, and 12) were significantly higher (p<0.001) on the operated than on the non-operated side. In contrast, the peak pressures were lower (p<0.001) under the medial side of the foot (sensors 3, 13, 14, and 16) (Figure 9). The pressure distribution patterns differed considerably between individuals, as shown in the contour curves of two different patients (Figure 10). In addition to these bilateral differences, the unilateral comparison showed differences in plantar pressure distribution. The non-operated foot showed greater variability than the operated foot in consecutive contacts, as can be seen in the COP curves (Figure 11).
45
FIGURE 9 Comparison of the occurrence of the higher pressure points between the operated and non-operated leg after free flap reconstruction for open tibial fractures. Black circles denote higher pressures on the operated side and grey circles significantly lower pressures on the operated side (N = 17).
Non-operatedOperated Non-operatedOperated
A B
FIGURE 10 Examples of the contour curves of two patients after free flap reconstruction for open tibial fractures while walking. A. The peak pressures were higher under the-operated foot. B. The peak pressures were higher under the non-operated foot.
13
3
14
109
12
46
1 2
34
56 7 8
910
111213
14
15 16
12
34
5678
910
11 1213
14
1516
1 2
34
56 7 8
910
111213
14
15 16
12
34
5678
910
11 1213
14
1516
2nd step 3rd step
Non-operatedOperated Non-operatedOperated
1 2
34
56 7 8
910
111213
14
15 16
12
34
5678
910
11 1213
14
1516
1 2
34
56 7 8
910
111213
14
15 16
12
34
5678
910
11 1213
14
1516
2nd step 3rd step
1 2
34
56 7 8
910
111213
14
15 16
12
34
5678
910
11 1213
14
1516
1 2
34
56 7 8
910
111213
14
15 16
12
34
5678
910
11 1213
14
1516
1 2
34
56 7 8
910
111213
14
15 16
12
34
5678
910
11 1213
14
1516
1 2
34
56 7 8
910
111213
14
15 16
12
34
5678
910
11 1213
14
1516
1 2
34
56 7 8
910
111213
14
15 16
12
34
5678
910
11 1213
14
1516
1 2
34
56 7 8
910
111213
14
15 16
12
34
5678
910
11 1213
14
1516
1 2
34
56 7 8
910
111213
14
15 16
12
34
5678
910
11 1213
14
1516
1 2
34
56 7 8
910
111213
14
15 16
12
34
5678
910
11 1213
14
1516
2nd step 3rd step
Non-operatedOperated Non-operatedOperated
FIGURE 11 Centre of pressure curves from two consecutive steps (2nd and 3rd).
Uncorrected LLD resulted in excessive plantar pressure asymmetries as compared to the healthy subjects, especially at fast walking speed. The peak pressure was higher under the big toe (sensor 15) on the longer side as compared to the shorter side (168 ± 113 kPa vs. 112 ± 72 kPa, p=0.037) at fast walking speed. The average plantar pressure of the longer limb was greater under the heel area (sensors 1, 2 and 3) in normal walking. However, the average pressure under the medial forefoot was higher in the shorter limb (33.9 ± 15.4 kPa vs. 27.7 ± 9.8 kPa) (sensor 12) (p=0.033). The bilateral comparison of the mean SI for the peak plantar pressure values showed even greater variability.
The heel impact (sensors 1 and 2) of the longer limb lasted longer than that of the shorter leg at both walking speeds. The time to peak plantar pressure in the relative scale took place significantly earlier in the short limb at several points: sensors 2, 5, 6, 7, 9 and 10 at normal walking speed and sensors 9 and 12 at fast walking speed (p<0.05). Bilateral comparison of the plantar pressures showed furthermore that the beginning of the sensor activity took place earlier on the shorter side at the lateral midfoot (sensor 6) and under the forefoot (sensors 10 and 11) at normal walking speed and (sensors 6 and 7) at fast walking speed (p<0.05)). Similarly, the end of the sensor action took place earlier in the rearfoot of the shorter leg (sensors 1 – 4 and 6 – 7) at normal walking speed and sensors in 1 - 4 at fast walking speed (p<0.05).
The GRF also showed asymmetries between the longer and shorter limb. At normal walking speed the mean peak Fz in the push-off phase was 1.29 ± 0.09 times BW in the shorter limb and 1.33 ± 0.05 BW in the longer limb
47
(p=0.027). The corresponding values at the fast speed were 1.48 ± 0.15 and 1.55 ± 0.11 BW (p=0.001). The peak horizontal GRF in the anterior-posterior direction (Fy) was greater in the push-off phase in the longer limb (170 ± 42 N) vs. (154 ± 44 N) (p<0.001)) at fast walking speed.
The EMG patterns of the rectus femoris (RF), vastus medialis (VM) and gastrocnemius lateralis (GL) muscles showed similar bilateral patterns at both walking speeds in the LLD study. As expected, the knee extensor muscles were already activated 100 ms before heel contact. The rectus femoris muscle had a biphasic activity pattern and the gastrocnemius was primarily active in the push-off phase (Figure 12). In addition, the RF muscle showed greater activation in the shorter leg during the braking and push-off phases. After the free flap reconstruction for open tibial fractures, the EMG patterns varied considerably among the subjects. Five patients showed more EMG activity in the GL muscle on the operated side after surgery, four patients showed more EMG activity on the non-operated side and three patients showed no differences in GL activity between the lower limbs. The low EMG activity of GL corresponded well with the low plantar pressure under the forefoot during the push-off phase (Figure 13).
5.3 High magnitude loading
The measurements performed on the triple jumpers demonstrated that Fz and Fy
were highest during the step. For all contacts, (hop, step and jump) the GRFs were higher in the braking than in the push-off phases. In the braking phase of the hop, step and jump, the maximal Fz was 11.3 ± 3.6, 15.2 ± 3.3 and 12.9 ± 3.1 times BW and Fy 4.8 ± 1.4, 7.0 ± 3.9 and 6.2 ± 1.1 times BW, respectively. The maximal Fz in the braking phase and the maximal Fy in the push-off phase were best GRF predictors (58.9 % and 27.1 %, respectively) for the final distance in the triple jump.
As expected the highest peak pressures were obtained in these athletes under the heel and forefoot areas while the lowest pressures were found under the midfoot in the triple jump. In several cases, the heel pressures were so high that the signals exceeded the measuring range of the transducers. The observed peak pressures were more than four times higher in the triple jump as compared to normal walking (Figure 14) performed by these same athletes. The peak pressures under the lateral forefoot (sensors 6, 9, 12) correlated positively (p<0.001) with the length of the triple jump (r=0.71, r=0.87, r=0.90, respectively) (Figure 15). In the triple jump the heel and forefoot sensors responded at the same time, implying that the sole of the foot touched the ground flat. In the individual analyses, all three triple jump phases demonstrated high pre- and braking activities of the leg extensor muscles. The mean EMG values of the vastus lateralis muscle were greater (p<0.001) during the braking phase than during the push-off phase. However, no clear quantitative phase (hop, step and jump) differences were observed in any of the EMG patterns (Figure 16).
48
0
0.2
0.4 mV
0
0.2
0.4 mV
0
0.2
0.4 mV
0
0.2
0.4 mV
0
0.2
0.4 mV
0
0.2
0.4 mV
Longer leg Shorter leg
GA
VM
RF
-200
0
200
400
600
800 N
-200
0
200
400
600
800 N
Contact
Contact
Contact
Contact
Toe-off
Toe-off
Toe-off
Toe-off
Contact
Contact
Contact
Contact
Toe-off
Toe-off
Toe-off
Toe-off
Fz Fz
Fy Fy
— —+ +
Toe-off Toe-off
Toe-off
Toe-offToe-off
Toe-offToe-off
FIGURE 12 A representative example of the mean EMG activity patterns (SD) and corresponding Fz and Fy ground reaction forces measured at fast walking speed in a patient with LLD. The dashed line indicates the end of the braking phase.
49
TA terve
0
200
400
600µV
GL terve
0
200
400
600µV
VM terve
0
200
400
600µV
TA vamma
0
200
400
600µV
GL vamma
0
200
400
600µV
VM vamma
0
200
400
600µV
Operated Non-operated
VM VM
TA TA
GL GL
600
400
200
0
600
400
200
0
600
400
200
0
600
400
200
0
600
400
200
0
600
400
200
0
µV
µV
µV
µV
µV
µV
FIGURE 13 Mean (SD) of the rectified EMGs (tibialis anterior, lateral head of gastrocnemius, and vastus medialis) and the maximal pressure contour curves of both feet of one subject after free flap reconstruction for open tibial fractures. The first and second solid lines indicate the beginning and end of the contact, respectively.
50
The loading characteristics, particularly in the braking phase of the triple jump step predicted best the bone size and the bone strength variables. In this phase, the body-weight-adjusted GRFs correlated significantly with the tibial midshaft and tibial distal quarter cortical area and section modulus (rs= 0.79-0.81, p<0.05) (Figure 17). The body-weight adjusted GRFs for walking correlated significantly (rs=0.62, p<0.05) with the proximal tibia total area only. Although, the bones of the triple jumpers were stronger, in both groups the foot loading characteristics were similar during normal walking speed. No significant relationship was found between the loading variables and aBMD of the lumbar spine and femoral neck. There were no significant correlations between the loading characteristics and the total density of the femoral neck, distal femur or proximal tibia (rs ranging from –0.31 to 0.31), or between the loading characteristics and the trabecular density of the distal tibia (rs ranging from –0.43 to 0.13).
0
250
500
750
1000
1 2 3 4 5 6 7 8 9 10 11 12 13 14 15 16
Sensor numbers
Walking
Hop of the triple jumpStep of the triple jumpJump of the triple jump
Pressure (kPa)
FIGURE 14 Example of the peak pressures of the various sensors for one male jumper measured during the hop, step and jump phases of the triple jump and during walking. The missing standard deviation bars indicate that the signals from these sensors exceeded the range of measurement of the sensors.
51
FIGURE 15 Relationship between length of triple jump and peak plantar pressures of the lateral forefoot (sensors 6, 9, 12) when averaged for the three phases of the triple jump.
500
400
300
200
100
Hop Step Jump
Vastus Lateralis
* *
*
*
* ** *Preactivity
Braking
Push-off
µV500
400
300
200
100
Hop Step Jump
Vastus Lateralis
** **
**
**
** **** **Preactivity
Braking
Push-off
µV
FIGURE 16 Mean (SD) average EMG of the vastus lateralis muscle in the preactivity, braking and push-off phases of the triple jump. Asterisks denote differences between hop, step and jump (p>0.05) (N = 7).
r = 0.71p < 0.05n = 7
P6 P9 P12r = 0.87p < 0.05n = 7
r = 0.90p < 0.05n = 7
Length of triple jump (m)
Pressure (kPa)
0
200
400
600
800
1000
12 13 14 15
r = 0.71p < 0.05n = 7
r = 0.71p < 0.05n = 7
P6 P9 P12r = 0.87p < 0.05n = 7
r = 0.87p < 0.05n = 7
r = 0.90p < 0.05n = 7
r = 0.90p < 0.05n = 7
Length of triple jump (m)
Pressure (kPa)
0
200
400
600
800
1000
12 13 14 15
52
2220181614
2600
2200
1800
1400
Tib
ial d
ista
l qua
rter
BS
I, (m
m3 )
GRF, (times BW)
rs=0.81, p<0.05
B
2220181614
440
400
360
320
280
Tib
ial d
ista
l qua
rter
CoA
, (m
m2 )
GRF, (times BW)
rs=0.81, p<0.05
A
2220181614
2600
2200
1800
1400
Tib
ial d
ista
l qua
rter
BS
I, (m
m3 )
GRF, (times BW)
rs=0.81, p<0.05
B
2220181614
440
400
360
320
280
Tib
ial d
ista
l qua
rter
CoA
, (m
m2 )
GRF, (times BW)
rs=0.81, p<0.05
A
FIGURE 17 Weight-adjusted maximal vertical ground reaction forces vs. tibial distal quarter cortical area (A) and density-weighted section modulus (B) in the braking phase of the triple jump (N = 8).
5.4 Limb length discrepancy experiments
The preoperative results were presented in section 5.2.2. Immediately after these preoperative measurements, the patients underwent surgery in which one of the two different techniques were used to correct the LLD. The first procedure was epiphyseodesis, which is performed to slow the growth rate of the longer leg, and the second was intramedullary lengthening which is a corrective procedure to elongate the shorter limb.
5.4.1 Epiphyseodesis
Contact time was preoperatively longer on the longer side at normal and fast walking speeds. After 52 weeks postoperatively, the difference between the shorter and longer limb had disappeared at normal walking speed but the difference was still present at fast walking speed. The maximal and average Fy
were significantly greater in the braking and push-off phases in the operated (longer) limb 52 weeks after surgery. The maximal Fz values were lower on the longer (operated) limb in the braking and push-off phases (Figure 18) until the 26th week. The average Fz in the push-off phase was also lower in the operated limb before surgery, and remained lower until 26 weeks after surgery (Figure 19). Similarly, the average resultant forces (Fr) were significantly lower in the operated limb 12 and 26 weeks after surgery at fast walking speed. The mean LLD decreased considerably during the follow-up. It was preoperatively 2.5 ± 0.8 cm and 52 weeks postoperatively only 0.9 ± 1.2 cm.
53
Max Fz in the braking phase
400
650
900
Pre 3 wks 12 wks 26 wks 52 wks
N
Longer/operatedShorter
Max Fz in the push-off phase
400
650
900
Pre 3 wks 12 wks 26 wks 52 wks
N
Longer/operatedShorter
*p=0.043
Max Fz in the braking phase
400
650
900
Pre 3 wks 12 wks 26 wks 52 wks
N
Longer/operatedShorter
Max Fz in the push-off phase
400
650
900
Pre 3 wks 12 wks 26 wks 52 wks
N
Longer/operatedShorter
*p=0.043
FIGURE 18 Mean (SD) maximal vertical (Fz) ground reaction forces of the longer (operated) and shorter (non-operated limb) preoperatively and three, 12, 26 and 52 weeks after correction of the LLD by epiphyseodesis (N = 7).
Average Fz in the braking phase
300
450
600
Pre 3 wks 12 wks 26 wks 52 wks
N
Longer/operatedShorter
Average Fz in the push-off phase
200
350
500
Pre 3 wks 12 wks 26 wks 52 wks
N
Longer/operatedShorter
* * *
p=0.043
p=0.028 p=0.018
Average Fz in the braking phase
300
450
600
Pre 3 wks 12 wks 26 wks 52 wks
N
Longer/operatedShorter
Average Fz in the push-off phase
200
350
500
Pre 3 wks 12 wks 26 wks 52 wks
N
Longer/operatedShorter
* * *
p=0.043
p=0.028 p=0.018
FIGURE 19 Mean (SD) average vertical (Fz) ground reaction forces of the longer (operated) and shorter (non-operated) limbs preoperatively and three, 12, 26 and 52 weeks after correction of the LLD by epiphyseodesis (N = 7).
Before surgery the peak pressure was higher under the big toe (sensor 15) in the longer limb as compared to the shorter limb (173 ± 103 kPa vs. 53 ± 24 kPa (p=0.046) at fast walking speed. The bilateral symmetry improved gradually during the follow-up: after 52 weeks, the differences between the plantar pressure parameters disappeared almost completely (Figure 20).
A bilateral comparison showed that the muscle activity patterns varied during the follow-up. The activity pattern of the GL muscles differed between the operated and the non-operated sides until 26 weeks after surgery. Patients showed more EMG activity on the non-operated side in the push-off phase at both walking speeds. After one year, there was an improvement in the symmetry compared to the preoperative condition (Figure 21). The RF and VM muscle activity patterns were similar between sides, demonstrating only small inter- and intrainvidual variation during the follow-up.
FIGURE 20 A representative example of the centre of pressure curves at fast walking (1.94 m·s-1) speed preoperatively, and 52 weeks after epiphyseodesis.
FIGURE 21 Comparison of the rectified EMG of the gastrocnemius muscle and corresponding plantar pressure contour curves (stance period) for both legs before the surgery, and 12 and 52 weeks postoperatively. Dashed lines indicate the beginning and the end of the stance phase.
55
5.4.2 Intramedullary lengthening
The patients scheduled for intramedullary lengthening of the shorter limb demonstrated a longer stance period preoperatively on the long side at both walking speeds. After 52 weeks postoperatively, the difference between the shorter (operated) and longer limb disappeared at fast walking speed but the difference remained at normal walking speed between the non-operated (634 ± 21 ms) and the operated limb (647 ± 21 ms) (p=0.028). The mean discrepancy measured radiologically (Friberg et al. 1985) decreased during the follow-up. It was 3.0 ± 1.1 cm before the surgery and one year later when the nail was removed, it was only 0.3 ± 0.3 cm.
Preoperatively, the peak plantar pressures demonstrated asymmetry between the legs at both walking speeds. After 52 weeks, these differences had disappeared (Figure 22). The average plantar pressure of the longer limb was greater in the medial forefoot (sensors 10, 11, 13) (p<0.05) during normal walking. In contrast, the average pressure under the medial rearfoot was higher in the shorter limb (sensor 3) (p=0.028). After 52 weeks, the differences in the average plantar pressures had almost disappeared (Figures 23).
Peak Pressures (Normal walking)
0
250
500
1 2 3 4 5 6 7 8 9 10 11 12 13 14 15 16
kPa Shorter BLonger BShorter ALonger A
*
**
*p=.028
p=.043
p=.028
p=.043
1 2
34
56 7 8
910
111213
14
15 16
12
34
5678
910
11 1213
14
1516
FIGURE 22 The mean (SD) peak plantar pressure values (N = 7) of all sensors measured during normal walking speed (1.53 m·s-1) (B = before surgery and A = 52 weeks after intramedullary lengthening of the shorter limb).
56
Peak Pressures (Fast walking)
0
350
700
1 2 3 4 5 6 7 8 9 10 11 12 13 14 15 16
kPa Shorter BLonger BShorter ALonger A
1 2
34
56 7 8
910
111213
14
15 16
12
34
5678
910
11 1213
14
1516
p=.046 *p=.028
*
*p=.046
*p=.018
FIGURE 23 The mean (SD) peak plantar pressure values (N = 7) of all sensors measured during normal walking speed (1.94 m·s-1) (B = before and A = 52 weeks after intramedullary lengthening of the shorter limb).
The timing patterns of the sensors showed many statistically significant differences preoperatively between the sides, but during the follow-up the bilateral symmetry improved considerably. However, one year after intramedullary lengthening the maximal and average vertical Fz and the maximal and average resultant forces (Fr) showed significantly greater values in the braking and push-off phases in the non-operated (longer) limb. The low vertical Fz in the operated limb and low plantar pressure under the forefoot corresponded well to the low EMG activity of GL in the push-off phase. The EMG activity of the GL muscle was lower on the operated side in the push-off phase during the follow-up (Figure 24).
57
0
400
800
1200
0
0.5
1
0
0.5
1
0
400
800
1200
0
0.5
1
0
0.5
1
0
400
800
1200
0
400
800
1200
Before
After(12 weeks)
Shorter/operated leg Longer leg
Shorter/operated leg Longer leg
GA GA
GA GA
mV mV
mV mV
Fz Fz
Fz Fz
N N
N N
FIGURE 24 A representative example of the vertical ground reaction force, muscle activity patterns of the gastrocnemius muscle, and plantar pressure contours at fast walking speed before and 12 weeks after surgery. The dashed line indicates the beginning and end of the contact period.
58
5.5 Isometric knee extensor torque
In the LLD studies (experiments four, five, and six) the patients also performed the tests for maximal isometric knee extension torque. The MVC of the longer limb was higher (626 ± 219 Nm) than that of the shorter limb (542 ± 185 Nm) (p=0.036). The bilateral difference ( %) in MVC was significantly related to the magnitude of the LLD. Similarly, the bilateral differences in Fz in both the braking and push-off phases were also interrelated (p> 0.05). The MVC of the operated limb decreased drastically after epiphyseodesis and intramedullary lengthening. After epiphyseodesis it remained lower than the torque of the non-operated limb until the 26th week (Figure 26). The aEMG of the VM muscle of the operated limb also decreased significantly during the first three postoperative weeks. Thereafter a gradual increase was observed until the 52nd
week (Figure 26). The pattern of EMG changes reflected those of the torque changes during the follow-up period.
In contrast, the MVC of the longer (non-operated) limb was still greater one year after intramedullary lengthening operation (748 ± 226 Nm vs. 526 ± 133 Nm) (p=0.018). The bilateral difference, however, disappeared one year after nail removal (Figure 27).
Max Isometric Torque
0
400
800
Pre 3 weeks 12 weeks 26 weeks 52 weeks
Nm
Longer/operatedShorter
*p=0.028
FIGURE 25 Mean (SD) curves of the maximum isometric knee extensor torque of the longer (operated) and shorter (non-operated) limbs during 52-weeks follow-up. Pre refers to the measurements before epiphyseodesis (N = 7).
59
EMG (VM)
20 %
60 %
100 %
140 %
180 %
Pre 3 weeks 12 weeks 26 weeks 52 weeks
VM Longer/operatedVM Shorter
FIGURE 26 Mean (SD) curves of • EMG of the vastus medialis muscle (VM) in the operated limb before and after epiphyseodesis (N = 7).
Max Isometric Torque
100
500
900
Pre 3 weeks 12weeks
26weeks
1 yrs. 2 yrs.
Shorter/operatedLonger
Nm
FIGURE 27 Mean (SD) curves of the maximum isometric knee extensor torque of the longer (non-operated) and shorter (operated limb) during the follow-up period after intramedullary lengthening (N = 4).
6 DISCUSSION
The present study demonstrated that walking speed did not increase bilateral foot loading asymmetry in the healthy subjects. Furthermore, the findings indicated that, compared to the healthy subjects, the patients with limb length discrepancy and patients who were recovering from tibial fracture had excessive foot loading asymmetries. On the other hand, reconstruction surgery for LLD led to considerable improvements in foot loading and muscle strength symmetry during the follow-up period. Although the decrease in symmetry found in neuromuscular performance immediately after the surgery was not surprising, the rapid recovery from epiphyseodesis was noteworthy. The outcome after the different surgical interventions was not complete symmetry, although significant improvements were achieved in foot loading symmetry and in neuromuscular function. The differences imply that to achieve complete symmetry a longer adaptation and rehabilitation period is required.
6.1 Methodological considerations vis-à-vis the Paromed System®
The Paromed-System has been used recently in a variety of plantar pressure measurements (e.g. Virmavirta et al. 2000, Chesnin et al. 2000. Femery et al. 2001). In the present project, it was utilised in every experiment. A belt on the subject’s back attached the equipment firmly and according to the subjects it did not disturb their walking and jumping trials. The Paromed-System seems to be very sensitive to changes in pressure during walking, although the measuring area of the sensors covers only 23 % of the insole. There is a relatively large space between the sensors, but they are arranged so as to record plantar pressures from the most clinically relevant foot areas (Schumacher 1995). However, in the triple jump, the impact forces in the braking phase were so powerful that the Paromed-System could not record the true loading values satisfactorily. In several cases the heel pressures (sensors 1 and 2, see
61
Figure 14) were so high that they exceeded the measuring range of the sensors. In addition, the braking and the push-off times were much shorter in the triple jump than during walking. Therefore the sampling frequency (200 Hz) used in this project was insufficient to record the true peak plantar pressure values during heel impact in the triple jump.
To determine the validity of the Paromed-System, the vertical GRF values were estimated from the pressure measurements by using coordinates for the insoles. This mathematical model was developed for each size of insole. The Fz values calculated from this model corresponded almost completely with the true Fz values recorded from the force platform during the same trial (Figure 28). The reproducibility of the measurement systems is also critical, because movement of the foot or the insole may result in a large variability in the pressure recordings. This disadvantage was mitigated in this study by averaging several consecutive steps in every experiment (at least 10 steps, in many cases over 20 steps). According to Hughes et al. (1991), a mean of ten contacts for each subject ensures good reproducibility for peak plantar pressure recordings. Furthermore, in the normal walking condition at least three steps are required to achieve the steady-state gait (Miller & Verstraete 1996). To ensure this, the subjects always took more than three natural steps before the data recording began in every walking experiment. In addition, the patients had asymmetrical contacts even in consecutive steps (Figure 11). The measurement protocol used here allows several successive steps to be recorded and thus reduces the variability in the foot loading patterns as well as eliminating possible targeting problems.
As mentioned earlier, the footwear used also has a considerably effect on plantar pressure distribution (e.g. Schaff & Cavanagh 1990, Sarnow et al. 1994, Nyska et al. 1995 Perry et al. 1995). Therefore, every subject wore the same type of shoes in every experiment in order to minimize any effects of shoes on performance. In addition, the “best-fit” insoles were carefully selected for every subject.
62
r > 0.96
N
(s)
12
3
2000
1000
0
0 0.1 0.2 0.3 0.4
Fz
Fz
Fz
PP
PP
PP
FIGURE 28 The validity comparison of plantar pressure (PP) curves with vertical ground reaction force (Fz) curves. The PP lines represent the sum of the plantar pressure curves from 16 anatomical areas averaged from three subjects (44 contacts per subjects). The Fz curves are from the same subjects and conditions. The correlation coefficients between the plantar pressure and vertical ground reaction force curves are r>0.96 (redrawn with modifications from Isolehto & Hofmann 1999).
6.2 Foot loading responses
As expected, the highest peak plantar pressures were obtained under the medial heel, the first metatarsal and the big toe in both the normal (Figure 7) and patient groups (Figure 22). The lowest pressures were in the midfoot area. These findings are in agreement with the literature (e.g. Boulton et al. 1983, Soames 1985, Rodgers 1985, Shorten et al. 1989, Zhu et al. 1991B, Hennig & Milani 1993, Chang et al. 1994, Hennig et al. 1994, Perry et al. 1995, Zhu et al. 1995, Rosenbaum et al. 1996A, Wearing et al. 1999). In the triple jump, the highest peak pressures were obtained under the heel and the forefoot areas while the lowest pressures were found under the midfoot. The lateral forefoot pressures (sensors 6, 9, 12) were also very high and were strongly related (p<0.001) to the length of the triple jump (Figure 15). The strong relationship between the lateral forefoot pressures and the length of the triple jump suggests
63
that the BW rolls powerfully over the lateral side of the foot during the contact phase. This may be related to the requirements for powerful force production during the push-off phase and a minimal decrease in horizontal speed. The peak plantar pressure values for both the heel and the lateral side of the forefoot are similar, as reported by Nicol (1977).
6.3 Effect of walking speed
The present results of the normal population also support previous studies that at fast walking speed the peak pressures increase in most areas of the sole of the foot and at the same time the pressure under the lateral forefoot decreases (Figure 7) (Shorten et al. 1989, Hughes et al. 1991, Rosenbaum et al. 1994, Kernozek et al. 1996). In the present study, however, the peak plantar pressures decreased at higher speeds also in the midfoot region and in the central part of the forefoot. This change occurs primarily as a shift in pressure towards the medial side of the foot, and it seems to be closely related to a more pronounced pronation motion (Shorten et al. 1989, Rosenbaum et al. 1994). The medial shift in plantar pressures has clinical relevance. The greater lateral pressures of patients may be caused by a slower walking speed and not necessarily by leg injuries. This emphasises the importance of controlling walking speed accurately in these studies.
6.4 Foot loading symmetry
Increased walking speed has been found to increase foot loading asymmetry (Rodano & Santambrogio 1989). This was not confirmed in the present study, which showed that walking speed did not increase foot loading asymmetry in the healthy subjects (Figure 7). The small asymmetries were located only under the midfoot. However, the peak plantar pressures were much smaller under the midfoot than in other regions of the foot. Therefore, the relatively large differences in plantar pressures between the legs under the midfoot are caused by the small magnitude of the peak pressures and the high variability of these values. However, in the patient groups the foot loading asymmetry became greater at fast walking speed. At fast walking speed, the contact time and the double support phase decrease. The balance becomes more unstable than at normal walking speed and therefore fast walking results in asymmetrical foot loading patterns. The most common way to avoid loading on the affected or shorter limb was the shortening of the stance period. In this manner, patients can reduce the loading on the operated or shorter leg.
64
6.4.1 Foot loading symmetry after reconstruction surgery for tibial fracture
The loading patterns after the free-flap reconstruction for severe tibial fracture showed asymmetrical responses in every patient. Bilateral comparison showed that the peak plantar pressures in the operated foot were lower under the medial forefoot and under the big toe. On the other hand, the pressures in the surgically treated foot were higher under the lateral forefoot, implying that the loading has shifted more to the outer edge of the foot (Figure 9). Therefore, the operated foot rolled more laterally during the stance period. This lateralisation after severe injury has also been seen in previous studies. In a series of 40 successful surgical treatments of ankle fractures, Becker et al. (1995) found that the forefoot loading of the treated leg was lateralised in the patients with good operative results. Rosenbaum et al. (1996A) who also found a similar lateral shift in the injured foot after calcaneal fractures confirmed the same findings later. Lateralisation after severe tibial fractures supports the assumption that the fibula is more loaded during walking.
Bilateral comparison showed considerable variation in the muscle activity patterns after the free flap reconstruction for open tibial fractures among the subjects, but the EMG recordings did not show clear differences between the muscles when compared bilaterally. However, the low EMG activity of GL matched the low plantar pressure under the forefoot during the push-off phase (Figure 13). The differences in EMG activity among the subjects were not related to the severity of the injury and their use to characterise the success of the surgical treatment could not be evaluated on the basis of the present results.
The changes in the peak plantar pressure distribution under the forefoot area and the shorter stance period on the operated side may be the result of biomechanical compensatory mechanisms in the ankle joint. Lateralisation is a possible way of reducing the load in the ankle joint and preventing degenerative changes in the joint cartilage (Becker et al. 1995). In the vitro study by Rosenbaum et al. (1996B), increased loading in the calcaneocuboid joint and reduced loading in the talonavicular joint after simulated calcaneal fractures led to higher lateral plantar pressure. This suggests that severe tibial fractures may lead to similar loading changes in the calcaneocuboid and talonavicular joints and further to different foot loading patterns in the operated foot. Finally, the second experiment emphasises that despite the long adaptation periods after surgery, patients failed to return completely to their normal foot loading patterns.
6.4.2 Foot loading symmetry before corrective surgery for limb length discrepancy
The present study showed clearly that moderate limb length discrepancy results in asymmetrical foot loading patterns as compared to the healthy subjects. Bilateral comparison revealed asymmetry both at normal and at fast walking speed. The shorter limb also bore the weight for less time than the longer limb before the corrective procedures. This is in accordance with the
65
earlier literature (Delacerda & Wikoff 1982, D’Amico et al. 1985, Schuit et al. 1989, Kaufman et al. 1996, and Bhave et al. 1999). The peak plantar pressure was higher in the push-off phase on the longer side than on the shorter side. The difference increased at fast walking speed. Furthermore, the timing patterns of the plantar pressure sensors showed that there was a difference in the plantar pressure patterns of the limbs. In the shorter leg, both the heel rise and the push-off occurred quite early. The COP curves (Figure 20) showed clearly that the loading did not reach the forefoot and the big toe area under the shorter limb. Thus, the foot loading pattern has shifted more to the forefoot and the big toe in the longer limb to compensate for the walking disturbances caused by the LLD. The high foot loading in the push-off phase and the high peak plantar pressures under the big toe on the longer side implied that the toes play an important role during the push-off phase on that side.
The symmetry index has been used widely to determine gait symmetry. In the present study, bilateral comparison of the SI for the GRF parameters showed some differences. However, much greater bilateral differences could be seen in the mean SI for the peak plantar pressures. The SI values differed considerably from zero in most of the pressure sensors under the foot during walking. The asymmetry in the foot loading patterns increased at the higher walking speeds. However, the SI equation has limitations. When a large asymmetry is present, the average value does not correctly reflect the performance of either limb. In addition, variables that have large values but where the inter-limb differences are relatively small will tend to lower the SI and thus an imply an increase in symmetry (Sadeghi et al. 2000). The large standard deviation in the SI in this study, as compared with the small deviation in a previous study in normal subjects (Herzog et al. 1989), implies that the SI may not necessarily be an accurate method of assessing gait symmetry, especially among patients.
A LLD greater than two centimetres causes asymmetrical gait patterns greater than that observed in the normal population (Kaufman et al. 1996). Furthermore, Liu et al. (1998) found a mean value for acceptable inequality of 2.33 cm (range, 2.12 - 2.54 cm). In the present study, a mean LLD value of over 2.5 cm resulted in asymmetrical gait (Figure 29). This confirms the assumption that surgical operations to equalise LLD are valuable when the bilateral difference of the limb length is more than two centimetres. However, the fact that the range of LLD in the patients was quite narrow can be seen as a limitation of the present study.
66
LLD (cm)
5.55.04.54.03.53.02.52.01.5
10
6
2
- 2
- 6
SI % (Contact Time)
Rsq = 0.0386
FIGURE 29 The relationship between the SI of the contact time and the magnitude of the LLD, preoperatively. The lines represent the 95% confidence limit (N = 21).
The EMG patterns were similar for most of the recorded muscles in the bilateral comparison. However, the rectus femoris muscle (RF) muscle showed greater activation in the shorter leg during the braking and push-off phases. This may be connected with the pelvic obliquity caused by LLD, which is the most common mechanism deployed to compensate for small degrees of LLD (Walsh et al. 2000). The high muscle activity of RF on the shorter side may prevent tilting the pelvis too much over the shorter leg during the stance period. However, these differences in EMG activity among the subjects were not related to their LLD and their use to characterise gait asymmetry could not be evaluated reliably. It would be necessary to obtain data from a larger patient group and more limb muscles to draw more definite general conclusions.
6.4.3 Foot loading symmetry after corrective surgery for limb length discrepancy
Two different surgical procedures were used in this study to correct the LLD: epiphyseodesis and intramedullary lengthening. The epiphyseodesis procedure, which was intended to stop the growth of the longer femur, was performed by two different methods: the percutaneous epiphyseodesis (Atar et al. 1991) and the Phemister technique (Liotta et al. 1992). In the other patient
67
group, the LLD would be treated by elongation of the shorter limb. In this study, the closed intramedullary lengthening of the femur with a lengthening device (Albizzia®) (Guichet et al. 1995) was used to correct the LLD. The mean LLD had almost completely disappeared within 52 weeks postoperatively after epiphyseodesis (before 2.5 ± 0.8 cm, after 0.9 ± 1.2 cm) and intramedullary lengthening (before 3.0 ± 1.1 cm, after 0.3 ± 0.3 cm).
After one year, there was a clear improvement in gait symmetry when compared to the preoperative condition in these patients. However, despite the anatomical correction, there were still failures in functional performance one year later. The difference in GRFs (Fz and Fy) between the limbs had almost disappeared 52 weeks after epiphyseodesis (Figures 18 – 19). However, after intramedullary lengthening Fz and Fy were slightly higher in the non-operated limb. Bilateral symmetry in the plantar pressure patterns increased gradually during the follow-up (Figures 20, 22 – 23). In spite of this, the outcome was not complete because there were still asymmetrical loading patterns in the both patient groups. These differences imply that to achieve the complete symmetry a longer adaptation and rehabilitation period is required. However, the improved walking symmetry obtained after surgical treatment in this study may diminish possible pathological loading of the lower extremity and may prevent the early appearance of arthritis in the lower extremities.
6.5 Neuromuscular performance
Before the corrective procedures of the LLD (experiment four) the knee extensor muscles in the longer limb were stronger than those on the shorter side. Thus, it is possible that the force generating capacity of the knee extensor muscles and the loading of the same limb are interrelated. If the muscles are stronger this would mean that the limb could also be ready to accept and tolerate greater impact and push-off loads. This assumption is, however, speculative, but one can also assume that in everyday life the longer side is more continuously loaded than the shorter. Earlier studies (Kaufman et al. 1996, Bhave et al. 1999) confirm this observation. Thus, greater use of the limb (and subsequently the respective muscles) could imply a normal training effect, which could then be seen both in the isometric force measurement and in the values of the braking and push-off forces during gait.
As expected (e.g. Narici et al. 1989, Perhonen et al. 1992, Häkkinen 1994, Oey et al. 1999), muscle strength decreased drastically during the first weeks after the surgery (experiments five and six) (Figure 25). In a recent study Oey et al. (1999) showed that muscle strength of the corrected limb was decreased in the early phase of distraction during femoral lengthening but was recovered before lengthening was ended. The present study showed clearly that the EMG activity of the knee extensor muscle (VM) is considerably reduced during the first postoperative weeks (Figure 26). However, this reduction was not statistically significant, thereby confirming the earlier results of Perhonen et al.
68
(1992) and Oey et al. (1999). The decreased EMG activity was associated with a similar reduction in force production. The intra- and extra-articular swelling has been suggested to be one of the causes inhibiting muscle activation during the early postoperative weeks (Kennedy et al. 1982, Perhonen et al. 1992). After corrective surgery for LLD, swelling was present on the third week, but the mechanisms that induce quadriceps inhibition after surgery remain unclear.
After 26 weeks, the recovery models changed considerably depending on the operative technique used. In the epiphyseodesis group, there were no differences between the operated and non-operated limbs. Furthermore, the relatively fast increase in muscle strength during the follow-up may partly explain the rapid recovery from surgery. In the intramedullary group, however, the big differences between the sides continued to remain in the maximum isometric torque of the knee extensor muscles one year after surgery (Figure 26). To investigate how the muscle strength of the knee extensor muscles behaved after nail removal, the strength measurements were repeated one year after this procedure (two years postoperatively). These results showed that recovery from the operation is a long-term process (Figure 26). In the intramedullary group, it took two years to achieve bilateral symmetry. No special rehabilitation program was administrated to the patients to except for conventional physiotherapy. They participated in normal school gymnastics and other related activities as soon as possible after the corrective surgery. However, this was not sufficient to correct fully the functional deficiency within one year.
6.6 High magnitude loading responses
The triple jump is one of the most demanding sports, given the extremely high impact forces with which athletes must cope while travelling at maximal horizontal speed. In one words a jumper must be able to tolerate high impact forces with a minimal decrease in horizontal speed. Therefore, the triple jump experiment yielded vital information about the importance of man-shoe-surface interaction in very high loading conditions. The results of the present study not only confirm earlier findings (Ramey & Williams 1985, Jin 1989) that a triple jumper must be able to tolerate very high GRFs but also contribute detailed and important information about their force production, foot loading, and bone loading patterns.
The highest peak plantar pressures were recorded under the heel, big toe and the first metatarsal head during the step, and the largest GRFs were also detected during the step. This confirms earlier findings where the highest pressures were found during the hop and step (Nicol 1977, Milani & Hennig 1992). The foot pressures recorded were similar to those reported for another high impact load sport, the javelin (Bartlett et al. 1995). As mentioned previously lateral forefoot pressure was highly associated with the length of the triple jump (Figure 15). Furthermore, maximal Fz in the braking phase and
69
maximal Fy in the push-off phase are the best GRF predictors for the final distance in the triple jump.
The EMG results suggest that the mechanical loading places high demands on the neuromuscular system as characterised by a high rate of activation in the preactivity phase followed by high eccentric activity by the leg extensor muscles. In this study, this can be seen as the high braking activity of the VL muscle as compared to its activity in the respective push-off phase, especially in the jump phase (Figure 16).
High impact load training is effective for improving and maintaining BMD. It provides a powerful osteogenetic stimulus for the loaded bones (e.g. Kirchner et al. 1995, Nichols et al. 1995, Heinonen et al. 1996). In the present study, the peak GRFs recorded were very high. It is quite likely that the bone loading forces were also extremely high, as in the triple jump the Fz consists of an initial impact phase in which the force first rises rapidly to a maximum and then declines rapidly to near zero. This suggests that by producing high strains with high strain rates and peak forces in versatile movements, triple jumping may produce very effective stresses on bones and thus initiate formation of a strong bone structure. In general, the present study demonstrates that triple jump training has a substantial influence on human bone. However, despite the stronger muscles and bones of the triple jumpers compared to their controls, only minor differences in the foot loading characteristics between groups were observed during normal walking speed (III).
6.7 Perspectives
The results of this study indicated that foot loading behaviour is different in normal and pathological gait and that walking speed affects foot loading patterns. In this study, the measurements were performed only on the flat level. However, we rarely walk on an even surface only, but several times per day walk on the uneven ground or climb stairs. In order to describe how the foot behaves in these more difficult walking conditions, further studies should focus on walking downstairs and upstairs. Work on these important questions is already in progress.
7 PRIMARY FINDINGS AND CONCLUSIONS
The main findings and conclusion of the present study can be summarised as follows:
1) The test procedure for the Paromed-System used in the present study showed that it could be used with precision to examine the bilateral symmetry of foot loading in normal and pathological gait without any disturbance to the subject. However, in the triple jump experiment the Paromed-System was unable to record the true loading values satisfactorily as the range of measurement of the pressure sensors under the heel was frequently exceeded. Furthermore, the good fit between the measured GRF and the GRF values calculated from the plantar pressure measurements during walking served as a good indication of the validity of the Paromed-System.
2) The results obtained from normal walking performances support earlier findings that GRFs increase with walking speed. In contrast, plantar pressure behaved differently in this study. The peak plantar pressures increased in most areas under the foot but decreased under the lateral forefoot at the faster walking speeds. This medial shift has clinical relevance because bilateral comparison showed that the pressures in the surgically treated foot after free-flap reconstruction for tibial fracture were higher under the lateral forefoot. This implies that the foot loading pattern had shifted more to the outer edge of the sole. Therefore, walking speed has to be defined carefully when patients and healthy controls are being compared. The greater lateral forefoot pressure found in patients may be caused by slower walking speed and may not necessarily be related to leg injuries or other leg problems.
3) The highest peak plantar pressures were found under the medial heel, the first metatarsal and the big toe in both the normal and patient groups. The study showed that walking speed did not increase bilateral foot loading
71
asymmetry in the healthy subjects. However, the results obtained from the patient groups showed that the patients with limb length discrepancy and those who were recovering from tibial fracture had greater foot loading asymmetries when compared to the healthy subjects. This foot loading asymmetry became greater at fast walking speed and the most common difference was that the contact time was shorter on the operated or shorter side. In this way, the patients were able to reduce the loading on the affected limb.
4) Bilateral comparison revealed that uncorrected limb length discrepancies produce asymmetrical foot loading patterns at both normal and fast walking speeds. However, the differences in EMGs between the limbs were smaller than expected. The asymmetry was related to the LLD and the surgical treatments were shown to be valuable when the discrepancy is over 2.5 cm. There was clear enhancement of the foot loading symmetry after the one-year follow-up. However, despite the anatomical correction, failures in neuromusculoskeletal performance continued to remain.
5) The isometric torque of the knee extensor muscles decreased drastically during the first weeks after surgery. After 26 weeks, there were no differences between the operated and nonoperated limbs in the epiphyseodesis group. However, in the intramedullary lengthening group, there were still large differences in MVC between sides. In this group, the time required to achieve perfect symmetry was two years. Thus, recovery from intramedullary lengthening surgery is a long-term process.
6) The results from the triple jump study showed that high lateral forefoot pressure and maximal Fz in the braking phase and maximal Fx in the push-off phase were significantly related to the length of the triple jump. Furthermore, the high mechanical loading involved put great demands on the neuromuscular system, especially in the preactivity phase of the leg extensor muscles. In addition, these results confirm that high magnitude loading plays an important role in improving and maintaining BMD.
YHTEENVETO
Perusteellinen kävely- ja kuormitusanalyysi on usein tarpeellinen jalkaongelmissa, jotta mahdollinen tukien ja ortoosien valinta sekä alaraajoihin kohdistuvien leikkausten jälkeinen kuntoutus pystytään suorittamaan parhaalla mahdollisella tavalla. Kävelijä tuottaa tukivaiheen aikana alustaan voimia pysty- ja vaakasuunnassa, joita on perinteisesti mitattu voimalevyantureilla. Ne eivät pysty kuitenkaan yksistään erottelemaan kuormitusta jalkapohjan eri osien välillä riittävän täsmällisesti. Kiinnostus selvittää kuormitus tarkasti on johtanut kehityksen alkeellisista jalkapohjan mustekuvista hyvin pieniin kengän sisälle asetettaviin mittausantureihin.
Tämän tutkimussarjan tarkoituksena oli selvittää kävelyn biomekaniikkaa eri potilasryhmillä ja terveillä verrokeilla. Kaikkiaan 70 koehenkilöä osallistui viiteen poikkileikkaus- ja kahteen seurantatutkimukseen. Tutkimussarjassa keskityttiin erityisesti jalkapohjan kuormituksen ja hermolihasjärjestelmän väliseen vuorovaikutukseen luonnollisissa kävelyolosuhteissa. Jalkapohjan eri osille kohdistuvaa kuormitusta rekisteröitiin erillisillä kenkiin sijoitettavilla painepohjallisilla. Telemetrinen mittaus mahdollisti tiedonkeruun aloittamisen missä tahansa kävelyn aikana ja siksi mittaustilanteessa pystyttiin taltioimaan useita peräkkäisiä askelkontakteja kummastakin jalasta eri kävelynopeuksilla. Tutkimuksessa käytetty paineenmittausjärjestelmällä (Paromed-System)saatua tietoa täydennettiin muilla hermolihasjärjestelmän toimintaa ja liikkumiskykyä kuvaavilla tutkimusmenetelmillä kuten elektromyografialla (EMG) ja voimalevyantureilla. Saatu aineisto käsiteltiin BMVM -järjestelmällä (Biomechnical Visualisation and Modelling), joka on Jyväskylän yliopiston liikuntabiologian laitoksella kehitetty tutkimuksissa syntyvän tiedon keruu- ja analyysijärjestelmä. Järjestelmän avulla pystytään tulosten matemaattisen laskennan lisäksi toistamaan rekisteröidyt ilmiöt animaationa, joka lisää kävelyn mekanismien ymmärrystä. Liikesuorituksen visualisoinnissa yhdistettiin useita eri biosignaaleja (painepohjalliset, EMG, voimalevyanturit jne.). Kävelyanalyysien lisäksi mitattiin polven isometrinen ojennusvoima voimadynamometrilla ja alaraajojen luuntiheys (BMD) kaksienergisellä röntgenabsorbtiolla (DXA).
Tutkimuksessa käytetty jalkapohjan kuormitukseen mittaamiseen tarkoitettu laitteisto osoittautui erittäin luotettavaksi kävelyn tutkimisessa. Suurimmat jalkapohjan paineet kohdistuivat kantapään ja päkiän alle sekä terveillä koehenkilöillä että eri potilasryhmillä. Terveillä koehenkilöillä kävely oli hyvin symmetristä eri kävelynopeuksilla ja jalkapohjan kuormitus siirtyi enemmän päkiän ulkoreunalle kävelynopeuden kasvaessa. Terveiden koehenkilöiden tulokset olivat jokseenkin yhteneviä tämänhetkisen paineenjakaantumisesta koskevan käsityksen kanssa. Potilasryhmät erosivat selvästi terveiden koehenkilöiden jalkapohjan kuormitus- ja alaraajalihasten aktivaatiomalleista. Vaikeat säärimurtumat ja laajat säären pehmytkudos-vammat korjataan nykyisin mikrokirurgisella leikkaustekniikalla. Korjausleikkausten jälkeen kuormitus jalkapohjassa siirtyi enemmän päkiän
73
ulkoreunalle. Kävelynopeus onkin aina vakioitava kliinisissä tutkimuksissa erilaisten kuormitusmallien vuoksi.
Hoitamattoman alaraajan pituuseron todettiin tässä tutkimuksessa johtavan epäsymmetriseen kävelyyn ja se voi olla myös syynä esim. selän kiputiloihin ja alaraajojen isojen nivelten ennenaikaiseen nivelrikkoon. Ennen alaraajaan kohdistuvaa korjausleikkausta kuormituksen jakautuminen jalkapohjassa ja alaraajalihasten aktivaatiomallit poikkesivat olennaisesti jalkojen välillä kaikilla koehenkilöillä. Alaraajojen pituuserojen korjausleikkaukset (epifysiodeesi ja intramedullaari pidennys) paransivat huomattavasti ennen leikkausta todettua epäsymmetristä kävelyä. Molemmissa leikkausryhmissä isometrinen polven ojennusvoima pieneni merkitsevästi leikatussa raajassa välittömästi leikkauksen jälkeen. Jalkojen välinen puoliero hävisi vuoden seurannan aikana epifysiodeesiryhmässä, mutta intramedullari pidennysryhmän potilailla oli vielä havaittavissa eroja jalkojen voimissa vuosi leikkauksen jälkeen. Jalkoihin kohdistuvat korjausleikkaukset vaativatkin tehokkaan ja pitkällisen kuntoutuksen.
Yhdessä osatutkimuksessa käytettiin kansallisen tason kolmiloikkaajia, joiden jalkapohjaan kohdistuvia paineita mitattiin kävelyn lisäksi myös kolmiloikkasuorituksen aikana. Kolmiloikan katsotaan edustavan yleisesti äärimmäistä jalkojen luihin ja lihaksiin kohdistuvaa kuormitusta. Näissä mittauksissa saatiin erittäin suuria kuormitusarvoja, joita voidaan käyttää viitearvoina muihin ryhmiin nähden. Erityisen mielenkiintoinen oli tulos, jonka mukaan hyppääjien alaraajojen luun tiheys oli huomattavasti suurempi kuin muiden vertailuryhmien.
74
REFERENCES
Abu-Faraj ZO, Harris GF, Abler JH, and Wertsch JJ 1997. A Holter-type, microprocessor-based, rehabilitation instrument for acquisition and storage of plantar pressure data. J Rehabil Res Dev 34: 187-94.
Alexander IJ, Chao EYS, and Johnson KA 1990. The assessment of dynamic foot-to-ground contact forces and plantar pressure distribution: a review of the evoluation of current techniques and clinical applications. Foot & Ankle 11: 152-67.
Andriacchi TP, Ogle JA, and Galante JO 1977. Walking speed as a basis for normal and abnormal gait measurements. J Biomech 10: 261-8.
Armstrong DG and Lavery LA 1998. Elevated peak plantar pressures in patients who have Charot arthropathy. J Bone Joint Surg [A] 80-A: 365-9.
Arsenault AB, Winter DA, and Marteniuk RG 1986A. Is there a 'normal' profile of EMG activity in gait? Med Biol Eng Comput 24: 337-43.
Arsenault AB, Winter DA, and Marteniuk RG 1986B. Bilateralism of EMG profiles in human locomotion. Am J Phys Med 65: 1-16.
Atar D, Lehman WB, Grant AD, and Strongwater A 1991. Percutaneos epiphysiodesis. J Bone Joint Surg [Br] 73-B: 173.
Barnett S, Cunningham JL, and West S 2001. A comparison of vertical force and temporal parameters produced by an in-shoe pressure measuring system and a force platform. Clin Biomech 16: 353-7.
Bartlett R., Müller E, Raschner C, Lindinger S, and Jordan C 1995. Pressure distribution on the plantar surface of the foot during the javelin throw. J Appl Biomech 11: 163-76.
Basmajian J and DeLuca CJ 1985. Muscles Alive (5th edition). Baltimore, USA. Williams & Wilkins.
Beaty JH 1992. Congenital anomalies of lower extremity. In: Crenshaw AH (Ed.) Campbell´s Operative Orthopaedics 8th vol 3. St. Louis, USA. Mosby Year Book 2126-58.
Becker HP, Rosenbaum D, Zeithammer G, Gerngross H, and Claes L 1994. Gait pattern analysis after ankle ligament reconstruction (modified Evans procedure) Foot Ankle Int 15: 477-82.
Becker HP, Rosenbaum D, Kriese T, Gerngross H, and Claes L 1995. Gait asymmetry following successful surgical treatment of ankle fractures in young adults. Clin Orthop 311: 262-9.
Becker HP, Rosenbaum D, Claes L, and Gerngross H 1997. Dynamische Pedographie zur Abklärung der funktionellen Sprunggelenkinstabilität. Unfallchirurg 100: 133-9.
Beely F. Zur Mechanik des Stehens. Longenbeck’s Archiv Für Klinische Chirurgie 27: 457-71 1882.
Betts RP, Stockley I, Getty CJM, Rowley DI, Duckworth T, and Franks CI 1988. Foot pressure studies in the assessment of forefoot arthroplasty in the rheumatoid foot. Foot & Ankle 8: 315-26
75
Bhave A, Paley D, and Herzenberg JE 1999. Improvement in gait parameters after lengthening for the treatment of limb-length discrepancy. J Bone Joint Surg [A] 81-A: 529-34.
Bitzan P, Giurea A, and Wanivenhaus A 1997. Plantar pressure distribution after resection of the metatarsal heads in rheumatoid arthritis. Foot Ankle Int 18: 391-7.
Boulton AJM, Hardisty CA, Betts RB, Franks CI, Worth RC, Ward JD, and Duckworth T 1983. Dynamic foot pressure and other studies as diagnostic and management aids in diabetic neuropathy. Diabetes Care 6: 26-33.
Brandell BR 1977. Functional roles of the calf and vastus muscles in locomotion. Am J Phys Med 56: 59-74.
Brink T 1995. Induration of the diabetic foot pad: another risk factor for recurrent neuropathic plantar ulcers. Biomed Tech (Berl) 40: 205-9.
Bryant A, Singer K, and Tinley P 1999. Comparison of the reliability of plantar pressure measurements using the two-step and midgait methods of data collection Foot Ankle Int 20: 646-50.
Bryant AR, Tinley P, and Singer KP 2000. Normal values of plantar pressure measurements determined using the EMED-SF system J Am Podiatr Med Assoc 90: 295-9.
Bus SA, Ulbrecht JS, and Cavanagh PR 2001 Quantifying load transfer in therapeutic insoles. Clin Biomech 16: 830 (Abstract).
Cavanagh PR, Rodgers MM, and Iiboshi A 1987. Pressure distribution under symptom-free feet during barefoot standing. Foot & Ankle 7: 262-76.
Cavanagh PR, Sims DS Jr., and Sanders LJ 1991. Body mass is a poor predictor of peak plantar pressure in diabetic men. Diabetes Care 14: 750-5.
Cavanagh PR, Hewitt FG Jr., and Perry JE 1992. In-shoe plantar pressure measurement: a review. Foot 2: 185-94.
Cavanagh PR, Simoneau GG, and Ulbrecht JS 1993. Ulceration, unsteadiness, and uncertainty: the biomechanical consequences of diabetes mellitus. J Biomech 26: 23-40.
Cavanagh PR and Ulbrect JS 1994. Clinical plantar pressure measurement in diabetes: rationale and methodology. Foot 4: 123-35.
Cavanagh PR, Morag E, Boulton AJM, Young MJ, Deffner KT, and Pammer SE 1997. The relationship of static foot structure to dynamic foot function. J Biomech 30: 243-50.
Cavanagh PR, Perry JE, Ulbrecht JS, Derr JA, and Pammer SE 1998. Neuropathic diabetic patients do not have reduced variability of plantar loading during gait. Gait Posture 7: 191-9.
Chang An-H, Abu-Faraj ZA, Harris GF, Nery J, and Shereff MJ 1994. Multistep measurement of plantar pressure alterations using metatarsal pads. Foot & Ankle 15 654-60.
Chesnin KJ, Selby-Silverstein L, and Besser MP 2000. Comparison of an in-shoe pressure measurement device to a force plate: concurrent validity of center of pressure measurements. Gait Posture 12: 128-33.
Clarke 1980. The pressure distribution under the foot during barefoot walking. Unpublished doctoral dissertation. The Pennsylvania State University. USA.
76
Clayes R 1983. The analysis of ground reaction forces symmetry during walking and running. Int Orthop 7: 113-9.
Cobb J and Claremont DJ 1995. Transducers for foot pressure measurement: survey of recent developments. Med Biol Eng Comput 33: 525-32.
Ctercteko GC, Dhanendran M, Hutton WC and, LeQuesne LP 1981. Vertical forces acting on the feet of diabetic patients with neuropathic ulceration. Br J Surg 68: 608-14.
D’Amico JC, Dinowitz HD, and Polchaninoff M 1985. Limb Length Discerancy – An Electodynographic Analysis. J Am Podiat Assoc 75: 639-43.
Davis BL, Cothren RM, Quesada P, Hanson SB, and Perry JE 1996. Frequency content of normal and diabetic plantar pressure profiles: implications for the selection of transducer sizes. J Biomech 29: 979-983.
Delacerda FG and Wikoff D 1982. Effect of Lower Limb Asymmetry on the Kinematics of Gait. J Orthop Sport Phys Ther 3: 105-7.
Drerup B and Wetz HH 2001. Effect of walking velocity on pressure distribution in different types of therapeutic footwear. In Biomechanics of the Lower Limb in Disease and Rehabilitation (Eds. Kenney L, Mickelborough J, Nester C, and Rithalia S). Salford UK. University of Salford.
Dubo HIC, Peat M, Winter DA, Quanbury MA, Hobson DA, Steinke T, and Reimer BS 1976. Electromyographic temporal analysis of gait: normal human locomotion. Arch Phys Med Rehabil 57: 415-20.
Duckworth T, Betts RP, Franks CI, and Burke J 1982. The measurement of pressures under the foot. Foot & Ankle 3: 130-41.
Duckworth T, Boulton AJ, Betts RP, Franks CI, and Ward JD 1985. Plantar pressure measurements and the prevention of ulceration in the diabetic foot. J Bone Joint Surg [Br] 67-Br: 79-85.
Durham JW, Saltzman CL, Steyers CM, and Miller BA 1994. Outcome after free flap reconstruction of the heel. Foot Ankle Int 15: 250-5.
Eberhart HD and Inman VT 1951. An evaluation of experimental procedures used in a fundamental study of human locomotion. Ann NY Acad Sci 51: 1213-28.
Elfman HOA 1934. Cinematic study of the distribution of pressure in the Human Foot Anat Record 59: 481–91.
Femery V, Moretto P, Renaut H, and Thévenon A 2001. Spasticité et distribution des pressions plantaires chez des enfants atteints d’ hémiplégie cérébrale infantile. Ann Réadaptation Méd Phys 44: 26-34.
Fernando DJ, Masson EA, Veves A, and Boulton AJ 1991. Relationship of limited joint mobility to abnormal foot pressures and diabetic foot ulceration. Diabetes Care 14: 8-11.
Friberg O, Koivisto E, and Wegelius C 1985. A Radiographic method for measurement of leg length inequality. Diagn Imag Clin Med 54: 78-81.
Garbalosa JC, Cavanagh PR, Wu G, Ulbrecht JS, Becker MB, Alexander IJ, and Campbell JH 1996. Foot function in diabetic patients after partial amputation. Foot Ankle Int 17: 43-8.
Gefen A, Megido-Ravid, M, Itzchak Y, and Arcan M 2002. Analysis of muscular fatigue and foot stability during high-heeled gait. Gait Posture 15: 56–63.
77
Gerber H 1982. A system for measuring dynamic pressure distribution under the human foot. J Biomech 15: 225-7.
Giacalone VF, Armstrong DG, Ashry HR, Lavery DC, Harkless LB, and Lavery LA 1997. A quantitative assessment of healing sandals and postoperative shoes in offloading the neuropathic diabetic foot. J Foot Ankle Surg 36: 28-30.
Giakas G and Baltzopoulos V 1997. Time and frequency domain analysis of ground reaction forces during walking: an investigation of variability and asymmetry. Gait Posture 5: 189-97.
Giles LGF and Taylor JR 1981. Low-back pain associated with leg length inequality. Spine 6: 510-21.
Gofton JP and Trueman GE 1971. Studies in osteoarthritis of the hip. Part II: Osteoarthritis of the hip and leg-length disparity. Can Med Assoc J 104: 791-9.
Grabiner MD, Feuerbach JW, Lundin TM, and Davis BL 1995. Visula guidance to force plates does not influence ground reaction force variability. J Biomech 28: 1115-7.
Graf PM 1993. The EMED system of foot pressure analysis. Clin Pod Med Surg 10: 445-54.
Grive DW and Rashdi T 1984. Pressures under normal feet in standing and walking as measured by foil pedobarography. Ann Rheum Dis 43: 816-8.
Grundy MR, Tosh PA, McLeish RD, and Smidt L 1975. An investigation of the centres of pressure under the foot while walking. J Bone Joint Surg [Br] 57-Br: 98-103.
Guichet JM Grammont PM, Trouilloud P, and Prévot J 1995. Gradual elongation intramedullary nail for femur (Albizzia®). J Jpn Orthop Assoc 69: 310.
Gurney B 2002. Leg length discrepancy. Gait Posture 15: 195-206. Häkkinen K 1994. Neuromuscular adaptation during strength training, aging,
detraining and immobilization. Crit Rev Phys Rehabil Med 6: 161-98. Hamill J, Bates BT, and Knutzen KM 1984. Ground reaction force symmetry
during walking and running. Res Q Exerc Sport 55: 289-93. Harris RI and Beath T 1947. Army foot survey – an investigation of foot
ailments in Canadian soldiers Ottawa, Canada. National Research Council of Canada, N.R.C. # 1574.
Harrison AJ and Folland JP 1997. Investigation of gait protocols for plantar pressure measurement of non-pathological subjects using a dynamic pedobarograph. Gait Posture 6: 50-5.
Heinonen A, Kannus P, Sievänen H, Oja P,Pasanen M, Rinne M, Uusi-Rasi K and Vuori I 1996. Randomised controlled trial of high-impact exercise and selected risk factors for osteoporotic fractures. Lancet 348: 1343–7.
Hennig EM, Cavanagh PR, Albert HT, and MacMillan NH 1982. A piezoelectric method of measuring the vertical contact stress beneath the human foot. J Biomed Eng 4: 213-22.
Hennig EM and Rosenbaum D 1991. Pressure distribution patterns under the feet of children in comparison with adults. Foot & Ankle 11: 306-11.
78
Hennig EM and Milani TL 1993. The tripod support of the foot. An analysis of pressure distribution under static and dynamic loading. Z Orthop 131: 279-84.
Hennig EM, Staats A, and Rosenbaum D 1994. Plantar pressure distribution patterns of young school children in comparison to adults. Foot Ankle Int 15: 35-40.
Herzog W, Nigg BM, Read LJ, and Olsson E 1989. Asymmetries in ground reaction force patterns in normal human gait. Med Sci Sports Exerc 21: 110-4.
Hills AP, Hennig EM, McDonald M, and Bar-Or O 2001. Plantar pressure differences between obese and non-obese adults: A biomechanical analysis. Int J Obes 25: 1674-9.
Hodge MC , Bach TM, and Carter GM 1999. Orthotic management of plantar pressure and pain in rheumatoid arthritis. Clin Biomech 14: 567-75.
Hughes J, Kriss S, and Klenerman L 1987. A clinician’s view of foot pressure: a comparison of three different methods of measurement. Foot & Ankle 7: 277-84.
Hughes J, Pratt L, Linge K, Clark P, and Klenerman L 1991. Reliability of pressure measurements: the EMED system. Clin Biomech 6: 14-8.
Hughes J, Clark P, Linge K, and Klenerman L 1993. A laser plantar pressure sensor for the diabetic foot. Med Eng Phys 22: 149-54.
Hughes R, Rowlands H, and McMeekin S 2000. A comparison of two studies of the pressure distribution under the feet of normal subjects using different equipment. Foot & Ankle 14: 514-9.
Inman VT, Ralston HJ, Todd, F 1981. Human walking. Baltimore, USA. Williams & Wilkins.
Isolehto J and Hofmann C 1999 Fulcrum –projekti Väliraportti 23.07.1999. Jyväskylä, Finland. Department of Biology of Physical Activity, University of Jyväskylä.
Jin H 1989. The ground reaction force in the triple jump. Sports Science (Beijing) 9: 64-7.
Kaufman KR, Miller LS, and Sutherland DH 1996. Gait asymmetry in patients with limb-length inequality. J Pediat Orthop 16: 144-50.
Kennedy JC, Alexander IJ, and Hayes KC 1982. Nerve supply of the human knee and its functional importance. Am J Sports Med 10: 329-35.
Kernozek TW and Lamott EE 1995. Comparisons of plantar pressures between the elderly and young adults. Gait Posture 5: 143-8.
Kernozek TW, Lamott EE, and Dancis MJ 1996. Reliability of an in-shoe pressure measurements system during treadmill walking. Foot Ankle Int 17: 204-9.
Kirchner EM, Lewis RD, and O’Connor PJ 1995. Bone mineral density and dietary intake of female college gymnasts. Med Sci Sports Exerc 27, 543-9.
Kleinhans L, Kleinhans T, Raschke M, Hopfenmüller W, and Mittlmeier Th 2001. Dynamic loading of the lower leg in patients mobilized with an Ilizarov-type external fixator after fracture. Clin Biomech 16: 840 (Abstract).
79
Kokkonen T 1999. Biomechanical visualization technique. Master Thesis. Department of Mathematical Information Technology. Jyväskylä, Finland. University of Jyväskylä.
Komi PV, Gollhofer A, Schmidtbleicher D, and Frick U 1987. Interaction between man and shoe in running: Considerations for a more comprehensive measurement approach. Int J Sports Med 8: 196-202.
Komi PV and Gollhofer A 1991. Biomechanics of man-shoe-surface interaction. Jyväskylä, Finland. Department of Biology of Physical Activity, University of Jyväskylä.
Kujala UM, Friberg O, Aalto T, and Österman K 1987. Lower limb asymmetry and patellofemoral joint incongruence in the etiology of knee exertion injuries in athletes. Int J Sports Med 8: 214-20.
Lanshammar H, Turan I, and Lindgren U 1993. Assessment of foot disorders using biomechanical analysis of foot loads during locomotion. Clin Biomech 8: 135-41.
Lavery LA, Lavery DC, and Quebedeax-Farnham TL 1995. Increased foot pressures after great toe amputation in diabetes. Diabetes Care 18: 1460-2.
Lavery LA, Vela SA, Fleischli JG, Armstrong DG, and Lavery DC 1997. Reducing plantar pressure in the neuropathic foot. A comparison of footwear. Diabetes Care 20: 1706-10.
Leber C and Evanski PM 1986 A comparison of shoe insole materials in plantar pressure relief. Prosthet Orthot Int 10: 135-8.
Leyerer R, Schaff P, and Wetter O 1997. Device for prevention of ulcers in the feet of diabetes patients. In: Patent Number 5,642,096. Paromed™ Medizintechnik GmbH. USA.
Liotta FJ, Ambrose TA, and Eilert RE 1992. Fluoroscopic technique versus phemister technique for epiphysiodesis. J Pediat Orthop 12: 248-51.
Liu X-C, Fabry G, Molenaers G, Lammens J, and Moens P 1998. Kinematic and kinetic asymmetry in patients with leg-length discrepancy. J Pediat Orthop 18: 187-9.
Lord M 1981. Foot pressure measurement: a review of methodology. J Biomed Eng 3: 91-9.
Lord M, Reynolds DP, and Hughes JR 1986. Foot pressure measurement: a review of clinical findings. J Biomed Eng 8: 283-94.
Lord M, Hosein R, and Williams RB 1992. Method for in-shoe shear stress measurement. J Biomed Eng 14: 181-6.
Lord M 1997. Spatial resolution in plantar pressure measurement. Med Eng Phys 19: 140-4.
Luger EJ, Nissan M, Karpf A, Steinberg EL, and Dekel S 1999. Patterns of weight bearing distribution under metatarsal heads. J Bone Joint Surg [Br] 81-Br: 199-202.
Mandato MG and Nester EJ 1999. The effects of increasing heel height on forefoot peak pressure Am Podiatr Med Assoc 89: 75-80.
Masson EA, Hay EM, Stockley I, Veves A, Betts RP, and Boulton AJ 1989. Abnormal foot pressures alone may not cause ulceration. Diabet Med 6: 426-8.
80
McPoil TG and Cornwall MW 1992. Effect of insole material on force and plantar pressures during walking. J Am Podiatr Med Assoc 82: 412-6.
McPoil TG, Cornwall MW, and Yamada W 1995. A comparison of two in-shoe plantar pressure measurement systems Lower Extremity 2: 95-103
McPoil TG, Cornwall MW, Dupuis L, and Cornwell M 1999. Variability of plantar pressure data. J Am Podiatr Med Assoc 89: 495-501.
Menard MR, McBride ME, Sanderson DJ, and Murray DD 1992. Comparative biomechanical analysis of energy-storing prosthetic feet. Arch Phys Med Rehabil 73: 451-8.
Menelaus MB 1991. The management of limb inequality. London UK. Churchill Livingstone 4-5.
Mero A and Komi PV 1986. Force-, EMG-, and elasticity-velocity relationships at submaximal, maximal and supramaximal running speeds in sprinters. Eur J Appl Physiol 55: 553-61.
Meyers-Rice B, Sugars L, McPoil T, and Cornwall MW 1994. Comparison of three methods of obtaining plantar pressures in non-pathological subjects. J Am Pod Med Assoc 84: 499-504.
Meyring S, Diehl RR, Milani TL, Hennig EM, and Berlit P 1997. Dynamic plantar pressure distribution measurements in hemiparetic patients. Clin Biomech 12: 60-5.
Milani TL, Hennig EM, and Stothart PJ 1990. Day to day variability and pressure distribution measurements during walking and running. In Proceedings from Canadian Society for Biomechanics Meeting, 6th Biennial Conference. Quebec, Canada 57-8.
Milani TL and Hennig EM 1992. In-shoe pressure distribution in the triple jump. In Proceedings of the Second North American Congress on Biomechanics (Eds. Draganich L, Wells R and Bechthold J). Chicago, USA 285-6.
Miller CA and Verstraete MC 1996. Determination of the step duration of gait initiation using a mechanical energy analysis J Biomech 29: 1195-9.
Milner M, Basmajian JV, and Quanbury AO 1971. Multifactorial analysis of walking by electromyography and computer Am J Phys Med 50: 235-58.
Minns RJ 1982. Two simple plantar pressure recording devices in clinical use: evaluation using a pedobarograph. Eng Med 11: 117-20.
Minns RJ Craxford AD 1984. Pressure under the forefoot in rheumatoid arthritis. Clin Orthop 187: 235-42.
Mittlmeier Th and Morlock MM 1991. Statische und dynamische Belastungsmessungen am posttraumatischen Fuss. Orthopäde 20: 22-32.
Mittlmeier Th, Weiler A, Söhn T, Kleinhans L, Mollbach S, Duda G, and Südkamp NP 1999. Functional monitoring during rehabilitation following anterior cruciate ligament reconstruction. Clin Biomech 14: 576-84.
Miyahara K 1993. Pressure distribution on the sole in normal adult men during walking using the ANIMA-G2800 for recording. J Jpn Orthop Assoc 67: 449-62.
Miyashita M, Matsui H, and Miura M 1970. The relation between electrical activity in muscle and speed of walking and running. Res Bull 14: 41-9.
81
Morlock MM and Mittlmeier TWF 1992. Pressure distribution measurements during normal gait: dependency on measurement frequency and sensor resolution. In Proceedings of the Second North American Congress on Biomechanics (Eds. Draganich L, Wells R and Bechthold J). Chicago, USA 113-4.
Morton DJ 1930. Structural Factors in Static Disorders of the Foot. Am J Surg 19: 315-26.
Morton DJ 1935. The human foot. New York USA. Columbia University Press. Moseley CF 2000. Leg length discrepancy. In Lovell and Winter’s Pediatric
Orthopedics 5th Edition, vol. 2 (Eds. Morrisey RT and Weinstein SL). Philadelphia, USA. Lippincott Williams & Wilkins 1104-50.
Mueller MJ, Sinacore DR, Hoogstrate S, and Daly L 1994. Hip and ankle walking strategies: effect on peak plantar pressures and implications for neuropathic ulceration. Arch Phys Med Rehabil 75: 1196-200.
Mueller MJ 1995. Use of an in-shoe pressure measurement system in the management of patients with neuropathic ulcers or metatarsalgia. J Orthop Sports Phys Ther 21: 328-36.
Murray HJ, Young MJ, Hollis S, and Boulton AJ 1996. The association between callus formation, high pressures and neuropathy in diabetic foot ulceration. Diabet Med 13: 979-82.
Murray MP, Drought AB, and Kory RC 1964. Walking patterns of normal men. J Bone Joint Surg [A] 46-A: 335-60.
Murray MP, Mollinger LA, Gardner GM, and Sepic SB 1984. Kinematic and EMG pettrens during slow, free and fast walking. J Orthop Res 2: 272-80.
Narici N, Roi G, Landoni L, Minetti A, and Cerretelli P 1989. Changes in force, cross-sectional area and neural activation during strength training and detraining of the human quadriceps. Eur J Appl Physiol 59: 310-19.
Nicol K and Hennig EM 1976. Time dependent method for measuring force distribution using a flexible mat as a capacitor. In Biomechanics V-B (Ed. Komi PV). Baltiomore, USA. University Park Press 374-80.
Nicol K 1977. Druckverteilung über den Fuss bei portlichen Absprungen und Landungen in Hinblic auf eine Reduzierung von Sportverletzungen. Leistungsport 7: 220-7.
Nicol K and Hennig EM 1978. Measurement of pressure distribution by means of a flexible, large surface mat. In Biomechanics VI-A (Eds. Asmussen E and Jorgenson K). Baltiomore, USA. University Park Press 374-80.
Nichols DL, Sanborn CF, Bonnick SL, Gench B, and Dimarco N 1995. Relationship of regional body composition to bone mineral density in college females. Med Sci Sports Exerc 27, 178-82.
Nicholson DE, Armstrong PF, MacWilliams BA, Terry S, Porter J, and Miller ML 1998. The effects of velocity, step, initiation and a visible platform on plantar pressures of healthy children. Gait Posture 7: 146 (Abstract).
Nilsson J and Thorstensson A 1989. Ground reaction forces at different speeds of human walking and running. Acta Physiol Scand 136: 217-27.
Nilsson J, Thorstensson A, and Halbertsma J 1985. Changes in leg movements and muscle activity with speed of locomotion and mode of progression in humans. Acta Physiol Scand 123: 457-75.
82
Nurse MA and Nigg BM 2001. The effect of changes in foot sensation on plantar pressure and muscle activity. Clin Biomech 16: 719-27.
Nyska M, McCabe C, Linge K, Laing P, and Klenerman L 1995. Effect of the shoe on plantar foot pressures. Acta Orthop Scand 66: 53-61.
Oey PL, Engelbert RHH, van Roermond PM, and Wieneke GH 1999. Temporary muscle weakness in the early phase of distraction during femoral lengthening. Clinical and electromyographical observations. Electromyogr Clin Neurophysiol 39: 217-20.
Õunpuu S and Winter DA 1989. Bilateral electromyographical analysis of the lower limbs during walking in normal adults. Electroencephalogr Clin Neurophysiol 72: 429-38.
Pataky Z, Faravel L, Da Silva J, and Assal J-P 2000. A new ambulatory foot pressure device for patients with sensory impairment. A system for continuous measurement of plantar pressure and a feed-back alarm. J Biomech 33: 1135-8.
Patel VG and Wieman TJ 1994. Effect of metatarsal head resection for diabetic foot ulcers on the dynamic plantar pressure distribution. Am J Surg 167: 297-301.
Perhonen K, Komi, PV, Häkkinen K, von Bondsdorff H, and Partio E 1992. Strength training and neuromuscular function in elderly people with total knee endoprosthesis. Scand J Med Sci Sports 2: 234-43.
Perry J 1992. Gait Analysis. Normal and Pathological Gait. Thorfare, USA. SLACK Incorporated.
Perry JE, Ulbrecht JS, Derr JA, and Cavanagh PR 1995. The use of running shoes to reduce plantar pressures in patients who have diabetes. J Bone Joint Surg [A] 77-A: 1819-28.
Perttunen JR, Rautio J, and Komi PV 1995. Gait patterns after free-flap reconstruction of the foot sole. Scand J Plast Reconstr Hand Surgery 29: 271-8.
Phillipson A, Dhar S, Linge K, McCabe C, and Klenerman L 1994. Forefoot arthroplasty and changes in plantar foot pressures. Foot Ankle Int 15: 595-8.
Pierotti SE, Brand RA, Gabel RH, Pedersen DR, and Clarke WR. Are leg electromyogram profiles symmetrical? J Orthop Res 1991: 9 720-9.
Pitei DL, Ison K, Edmonds ME, and Lord M 1996. Time-dependent behaviour of a force-sensitive resistor plantar pressure measurement insole. Proc Inst Mech Eng H 210: 121-5.
Quaney B, Meyer K, Cornwall MW, and McPoil TG 1995. A comparison of the dynamic pedobarograph and EMED systems for measuring dynamic foot pressures. Foot Ankle Int 16: 562-6.
Quesada PM and Rash GS 2000. Quantitative assessment of simultaneous capacitive and resistive plantar pressure measurements during walking Foot Ankle Int 21: 928-34.
83
Ralphs G, Lunsford TR, and Greenfield J 1990. Measurement of plantar pressure using Fuji prescale film -- preliminary study. J Prosths Orthot 2: 130-8.
Ramey MR and Williams KR 1985. Ground reaction forces in the triple jump. Int J Sport Biomech 1: 233-9.
Ranu HS 1986. Miniature load cells for the measurement of foot-ground reaction forces and centre of foot pressure during gait. J Biomed Eng 8: 175-7.
Rodano R, and Santambrogio GC 1989. Walking symmetry at different step frequencies: An analysis based on the ground reaction force processing. In Biomechanics XI (Eds. Gregor RJ, Zernicke RF, and Whiting WC). Los Angeles, USA. UCLA Abstract 299.
Rodgers MM 1985. Plantar pressure distribution measurement during barefoot walking: Normal values and predictive equations. Unpublished doctoral dissertation. The Pennsylvania State University. USA.
Rodgers MM and Cavanagh PR 1989 Pressure distribution in Morton’s foot structure. Med Sci Sports Exerc 21: 23-8.
Rose NE, Feiwell LA, and Cracchiolo A III 1992. A method for measuring foot pressures using a high resolution, computerized insole sensor: the effect of heel wedges on plantar pressure distribution and center of force. Foot & Ankle 13: 263-70.
Rosenbaum D, Hautmann, S, Gold, M, and Claes L 1994. Effects of walking speed on plantar pressure patterns and hindfoot angular motion. Gait Posture 2: 191-7.
Rosenbaum D, Bauer G, Lubke B,and Claes L 1996A. Funktionsstörungen des Fusses nach Kalcaneusfraktur. Sportverl Sportschad 10: 32-7.
Rosenbaum D, Bauer G, Augat P, and Claes L 1996B. Calcaneal fractures cause a lateral load shift in Chopart joint contact stress and plantar pressure pattern in vitro. J Biomech 29: 1435-43.
Rosenbaum D, Becker H-P, Sterk J, Gerngross H, and Claes L 1997. Functional evaluation of the 10-year outcome after modified Evans repair for chronic ankle instability. Foot Ankle Int 18: 765-71.
Rosenbaum D, Bertsch C, and Hillmann A 2001. Barefoot and in-shoe pressure measurements after surgical treatment of foot tumours. Clin Biomech 16: 853 (Abstract).
Roy KJ 1988. Force, pressure, and motion measurements in the foot: current concepts. Clin Podiatr Med Surg 5: 491-508.
Rozema A, Ulbrecht JS, Pammer SE, and Cavanagh PR 1996. In-shoe plantar pressures during activities of daily living: implications for therapeutic footwear design. Foot Ankle Int 17: 352-9.
Sadeghi H, Allard P, Prince F, and Labelle H 2000. Symmetry and limb dominance in able-bodied gait: a review. Gait Posture 12: 34-45.
Sanfilippo PB, Stess RM, and Moss KM 1992. Dynamic plantar pressure analysis. Comparing common insole materials. J Am Podiatr Med Assoc 82: 507-13.
84
Sarnow MR, Veves A, Giurini JM, Rosenblum BI, Chrzan JS, and Habershaw GM 1994. In-shoe foot pressure measurements in diabetic patients with at-risk feet and in healthy subjects. Diabetes Care 17: 1002-6.
Saunders JBDM, Inman VT, and Eberhart HD 1953. The major determinats in normal and pathological gait. J Bone Joint Surg [A] 35-A: 543-58.
Schaff PS 1993. An overview of foot pressure measurement systems. Clin Pod Med Surg 10: 403-15.
Schaff PS, Wetter O, and Binder E 1994. Pressure measurement inside the shoe- The importance of required sampling frequency and their determination in different areas of the foot during running. In Second World Congress of Biomechanics (Eds. Blankevoort L and Kooloos JGM) Abstract 178.
Schmidt R, Meyer-Wölbert B, Röderer M, Becker HP, Benesch S, Fels T, and Gerngross H 1999. Dynamische Ganganalyse. Unfallchirurg 102: 110-4.
Schuit D, Adrian M, and Pidcoe P 1989. Effects of heel lifts on ground reaction force patterns in subjects with structural leg-length discrepancies. Phys Ther 69: 663-70.
Schumacher DPF 1995. Final report: checking the measuring technical characteristics of the Parotec pressure distribution measuring system. Munich, Germany. TUV Product Service.
Shiavi R 1985. Electromyographic patterns in adult locomotion: a comprehensive review. J Rehabil Res Dev 22: 85-98.
Shiavi R, Bugle HJ, and Limbird T 1987. Electromyographic gait assessment, Part 1: Adult EMG profiles and walking speed. J Rehabil Res Dev 24: 13-23.
Shorten M, Beekman Eden K, and Himmelsbach JA. 1989. Plantar pressure during barefoot walking. In Biomechanics XI (Eds. Gregor RJ, Zernicke RF and Whiting WC). Los Angeles, USA. UCLA Abstract 121.
Sievänen H, Koskue V, Rauhio A, Kannus P, Heinonen A, and Vuori I 1998. Peripheral quantitative computed tomography in human long bones: Evaluation of in vitro and in vivo precision. J Bone Miner Res 13: 871– 82.
Silvino N, Evanski PM, and Waugh TR 1980. The Harris and Beath footprinting mat: diagnostic validity and clinical use. Clin Orthop 15: 265-9.
Snow RE, Williams KR, and Holmes GB Jr. 1992. The effects of wearing high heeled shoes on pedal pressure in women. Foot & Ankle 13: 85-92.
Soames RW 1985. Foot pressure patterns during gait. J Biomed Eng 7: 120-6. Sokol G, Weidinger St, Hörnlein B, Maierhof B, and Irsigler K 1991. Dynamische
Druckverteilungsmessung auf der Fusssohle von Diabetikern und einer Vergleichsgruppe. Wien Klin Wochenschr 103: 367-70.
Song KM, Halliday SE, and Little DG 1997. The effect of limb-length discrepancy on gait. J. Bone and Joint Surg [A] 79-A: 1690-8.
Stess RM, Jensen SR and, Mirmiran R 1997. The role of dynamic plantar pressures in diabetic foot ulcers. Diabetes Care 20: 855-8.
Stokes IAF, Faris IB, and Hutton WC 1975. The neuropathic ulcer and loads on the foot in diabetic patients. Acta Orthop Scand 46: 839-47.
Stott JR, Hutton WC, and Stokes IA 1973. Forces under the foot. J Bone Joint Surg [Br] 55: 335-44.
85
Trias D, Gioux M, Cid M, and Bemsch Cl 1994. Gait analysis of myopathic children in relation to impairment level and energy cost. J Electromyogr Kinesiol 4: 67-81.
Vaughan CL, Du Toit LL, and Roffey M. (1987) Speed of walking and forces acting on the feet. In Biomechanics X-A. (Ed. Jonsson B). Umeå, Sweden: National Board of Occupational Safety and Health, 349-53.
Vaughan CL, Davis BL, and O’Connor JC 1999. Dynamics of Human Gait (Second Edition) Cape Town, South Africa. Kiboho Publishers.
Veves A, Murray HJ, Young MJ, and Boulton AJM 1992. The risk of foot ulceration in diabetic patients with high foot pressure: a prospective study. Diabetologia 35: 660-3.
Virmavirta M and Komi PV 2000. Plantar pressures during ski jumping take-off. J Appl Biomech 16: 320-26.
Walsh M, Connolly P, Jenkinson A, and O’Brien T 2000. Leg length discrepancy – an experimental study of compensatory changes in three dimension using gait analysis. Gait Posture 12: 156-61.
Wanivenhaus A and Brettschneider W 1993. Influence of metatarsal head displacement on metatarsal pressure distribution after hallux valgus surgery. Foot & Ankle 14: 85-89.
Wearing SC, Urry SR, Smeathers JE, and Battistutta D 1999. A comparison of gait initiation and termination methods for obtaining plantar foot pressures. Gait Posture 10: 255-63.
Wearing SC, Urry SR, and Smeathers JE 2000. The effect of visual targeting on ground reaction force and temporospatial parameters of gait. Clin Biomech 15: 583-91.
Widhe T and Berggren L 1994. Gait analysis and dynamic foot pressure un the assessment of treated clubfoot. Foot Ankle Int 15: 186-90.
Winter DA 1983. Biomechanical motor patterns in normal walking. J Motor Behav 15: 302-30.
Winter DA 1991. The biomechanics and motor control of human gait: Normal, elderly and pathological. Second edition. Waterloo, Canada. University of Waterloo Press.
Winter DA Fuglevand AJ, and Archer SE 1994. Crosstalk in surface electromyography: theoretical and practical estimates. J Electromyogr Kinesiol 4: 15-26.
Woodburn J and Helliwell PS 1996. Relation between heel position and the distribution of forefoot plantar pressures and skin callosities in rheumatoid arthritis. Ann Rheum Dis 55: 806-10.
Young MJ, Cavanagh PR, Thomas G, Johnson MM, Murray H, and Boulton AJ 1992. The effect of callus removal on dynamic plantar foot pressures in diabetic patients. Diabet Med 9: 55-7.
Young CR 1993. The F-SCAN system of foot pressure analysis. Clin Pod Med Surg 10: 455-61.
Zhu HS, Harris GF, Wertsch JJ, Tompkins WJ, and Webster JG 1991A. A microprocessor-based data-acquisition system for measuring plantar pressures from ambulatory subjects. IEEE Trans Biomed Eng 38: 710-4.
86
Zhu HS, Wertsch JJ, Harris GF, Loftsgaarden JD, and Price MB 1991B. Foot pressure distribution during walking and shuffling. Arch Phys Med Rehabil 72: 390-7.
Zhu H, Wertsch JJ, Harris GF, and Alba HM 1995. Walking cadence effect on plantar pressures. Arch Phys Med Rehabil 76: 1000-5.
S T U D I E S I N S P O R T , P H Y S I C A L E D U C A T I O N A N D H E A L T H
1 KIRJONEN, JUHANI, On the description of ahuman movement and its psychophysicalcorrelates under psychomotor loads. 48 p.1971.
2 KIRJONEN, JUHANI JA RUSKO, HEIKKI, Liikkeenkinemaattisista ominaispiirteistä, niidenpsykofyysisistä selitysyhteyksistä ja näidenmuutoksista psykomotorisen kuormituksen jakestävyysharjoittelun vaikutuksesta. - On thekinematic charac-teristics and psychophysicalcorrelates of a human movement and theirchanges during psychomotor loading andendurace conditioning. 156 p. 1971.
3 SARVIHARJU, PEKKA J., Effects of psycho-physicalloading and progressive enduranceconditioning on selected biochemicalcorrelates of adaptive responses in man. 95 p.1973.
4 KIVIAHO, PEKKA, Sport organizations and thestructure of society. 54 p. 1973.
5 KOMI, PAAVO V., NELSON, RICHARD C. AND PULLI,MATTI, Biomechanics of skijumping. 53 p.1974.
6 METELI, Työolot, terveys ja liikuntakäyttäy-tyminen metallitehtaissa. Kartoittavan kyselynaineistot ja toteuttaminen. 178 p. 1974.
7 TIAINEN, JORMA M., Increasing physicaleducation students’ creative thinking. 53 p.1976.
8 RUSKO, HEIKKI, Physical performancecharacteristics in Finnish athletes. 40 p. 1976.
9 KIISKINEN, ANJA, Adaptation of connectivetissues to physical training in young mice.43 p. 1976.
10 VUOLLE, PAULI, Urheilu elämänsisältönä.Menestyneiden urheilijoiden elämänurakilpailuvuosina - Top sport as content of life.227 p. 1977.
11 SUOMINEN, HARRI, Effects of physical training inmiddle-aged and elderly people with specialregard to skeletal muscle, connective tissue,and functional aging. 40 p. 1978.
12 VIITASALO, JUKKA, Neuromuscular performancein voluntary and reflex contraction withspecial reference to muscle structure andfatigue. 59 p. 1980.
13 LUHTANEN, PEKKA, On the mechanics of humanmovement with special reference to walking,running and jumping. 58 p. 1980.
14 LAAKSO, LAURI, Lapsuuden ja nuoruudenkasvuympäristö aikuisiän liikuntaharrastus-ten selittäjänä: retrospektiivinen tutkimus. -Socialization environment in childhood andyouth as determinant of adult-age sportinvolvement: a retrospective study. 295 p.1981.
15 BOSCO, CARMELO, Stretch-schortening cycleinskeletal muscle function with specialreference to elastic energy and potentiation ofmyoelectrical activity. 64 p. 1982.
16 OLIN, KALEVI, Päätöksentekijöiden viiteryhmätkaupunkien liikuntapolitiikassa. - Referencegroups of decision-makers in the sport
politics of cities. 155 p. 1982.17 KANNAS, LASSE, Tupakointia koskeva terveys-
kasvatus peruskoulussa. - Health educationon smoking in the Finnish comprehensiveschool. 251 p. 1983.
18 Contribution of sociology to the study of sport.Festschrift Book in Honour of Professor KaleviHeinilä. Ed. by OLIN, K. 243 p. 1984.
19 ALÉN, MARKKU, Effects of self-administered,high-dose testosterone and anabolic steroidson serum hormones, lipids, enzymes and onspermatogenesis in power athletes. 75 p. 1985.
20 HÄKKINEN, KEIJO, Training and detrainingadaptations in electromyographic, musclefibre and force production characteristics ofhuman leg extensor muscles with specialreference to prolonged heavy resistance andexplosive type strength training. 106 p. 1986.
21 LAHTINEN, ULLA, Begåvningshandikappadungdom i utveckling. En uppföljningstudie avfunktionsförmåga och fysisk aktivitet hosbegåvningshandikappade ungdomar i olikalivsmiljöer. 300 p. 1986.
22 SILVENNOINEN, MARTTI, Koululainen liikun-nanharrastajana: liikuntaharrastusten jaliikuntamotiivien sekä näiden yhteyksienmuuttuminen iän mukana peruskoululaisillaja lukiolaisilla. - Schoolchildren andphysically active interests: The changes ininterests in and motives for physical exerciserelated to age in Finnish comprehensive andupper secondary schools. 226 p. 1987.
23 POHJOLAINEN, PERTTI, Toimintakykyisyys,terveydentila ja elämäntyyli 71-75-vuotiaillamiehillä. - Functional capacity, health statusand life-style among 71-75 year-old men.249 p. Summary 13 p. 1987.
24 MERO, ANTTI, Electromyographic acticity, forceand anaerobic energy production in sprintrunning; with special reference to differentconstant speeds ranging from submaximal tosupramaximal. 112 p. Tiivistelmä 5 p. 1987.
25 PARKATTI, TERTTU, Self-rated and clinicallymeasured functional capacity among womenand men in two age groups in metal industry.131 p. Tiivistelmä 2 p. 1990.
26 HOLOPAINEN, SINIKKA, Koululaisten liikunta-taidot. - The motor skills of schoolboys andgirls. 217 p. Summary 6 p. 1990.
27 NUMMINEN, PIRKKO, The role of imagery inphysical education. 131 p. Tiivistelmä 10 p.1991.
28 TALVITIE, ULLA, Aktiivisuuden ja omatoimi-vuuden kehittäminen fysioterapian tavoittee-na. Kehittävän työntutkimuksen sovelluslääkintävoimistelijan työhön. - Thedevelopment of activity and self-motivation asthe aim of physiotherapy. The application ofdevelopmental work research in physio-therapy. 212 p. Summary 8 p. 1991.
S T U D I E S I N S P O R T , P H Y S I C A L E D U C A T I O N A N D H E A L T H
yhteistyöskentelyn avulla koululiikunnassa. -The role of teaching method in prosociallearning - developing helping behavior bymeans of the cooperative teaching method inphysical education. 132 p. Summary 2 p. 1993.
30 LIIMATAINEN-LAMBERG, ANNA-ESTER, Changes instudent smoking habits at the vocationalinstitutions and senior secondary schools andhealth education. 195 p. Yhteenveto 5 p. 1993.
31 KESKINEN, KARI LASSE, Stroking characteristics offront crawl swimming. 77 p. Yhteenveto 2 p.1993.
32 RANTANEN, TAINA, Maximal isometric strengthin older adults. Cross-national comparisons,background factors and association withMobility. 87 p. Yhteenveto 4 p. 1994.
33 LUSA, SIRPA, Job demands and assessment ofthe physical work capacity of fire fighters.91 p. Yhteenveto 4 p. 1994.
34 CHENG, SULIN, Bone mineral density and qualityin older people. A study in relation to exerciseand fracture occurrence, and the assessment ofmechanical properties. 81 p. Tiivistelmä 1 p.1994.
35 KOSKI, PASI, Liikuntaseura toimintaympäristös-sään. - Sports club in its organizationalenvironment. 220 p. Summary 6 p. 1994.
36 JUPPI, JOEL, Suomen julkinen liikuntapolitiikkavaltionhallinnon näkökulmasta vuosina 1917-1994. - Public sport policy in Finland from theviewpoint of state administration in 1917-1994. 358 p. Summary 7 p. 1995.
37 KYRÖLÄINEN, HEIKKI, Neuromuscularperformance among power- and endurance-trained athletes. 82 p. Tiivistelmä 3 p. 1995.
38 NYANDINDI, URSULINE S., Evaluation of a schooloral health education programme inTanzania: An ecological perspective. 88 p.Tiivistelmä 2 p. 1995.
39 HEIKINARO-JOHANSSON, PILVIKKI, Includingstudents with special needs in physicaleducation. 81 p. Yhteenveto 4 p. 1995.
40 SARLIN, EEVA-LIISA, Minäkokemuksen merkitysliikuntamotivaatiotekijänä. - The significanceof self perception in the motivationalorientation of physical education. 157 p.Summary 4 p. 1995.
41 LINTUNEN, TARU, Self-perceptions, fitness, andexercise in early adolescence: a four-yearfollow-up study. 87 p. Yhteenveto 5 p.1995.
42 SIPILÄ, SARIANNA, Physical training and skeletalmuscle in elderly women. A studyof muscle mass, composition, fibercharacteristics and isometric strength. 62 p.Tiivistelmä 3 p. 1996.
43 ILMANEN, KALERVO, Kunnat liikkeellä. Kunnalli-nen liikuntahallinto suomalaisen yhteiskun-nan muutoksessa 1919-1994. - Municipalitiesin motion. Municipal sport administration inthe changing Finnish society 1919-1994. 285p. Summary 3 p. 1996.
44 NUMMELA, ARI, A new laboratory test methodfor estimating anaerobic performance
characteristics with special reference to sprintrunning. 80 p. Yhteenveto 4 p. 1996.
45 VARSTALA, VÄINÖ, Opettajan toiminta ja oppilai-den liikunta-aktiivisuus koulun liikunta-tunnilla. - Teacher behaviour and students’motor engagement time in school physicaleducation classes. 138 p. Summary 4 p. 1996.
46 POSKIPARTA, MARITA, Terveysneuvonta, oppi-maan oppimista. Videotallenteet hoitajienterveysneuvonnan ilmentäjinä ja vuoro-vaikutustaitojen kehittämismenetelmänä. -Health counselling, learning to learn. Video-tapes expressing and developing nurses´communication skills. 159 p. Summary 6 p.1997.
47 SIMONEN, RIITTA, Determinants of adultpsychomotor speed. A study of monozygotictwins. - Psykomotorisen nopeudendeterminantit identtisillä kaksosilla. 49 p.Yhteenveto 2 p. 1997.
48 NEVALA-PURANEN, NINA, Physical work andergonomics in dairy farming. Effects of occu-pationally oriented medical rehabilitaton andenvironmental measures. 80 p. (132 p.) 1997.
49 HEINONEN, ARI, Exercise as an OsteogenicStimulus. 69 p. (160 p.) Tiivistelmä 1 p. 1997.
50 VUOLLE, PAULI (Ed.) Sport in social context byKalevi Heinilä. Commemorative book inHonour of Professor Kalevi Heinilä. 200 p.1997.
51 TUOMI, JOUNI, Suomalainen hoitotiede-keskustelu. - The genesis of nursing andcaring science in Finland. 218 p. Summary 7 p.1997.
52 TOLVANEN, KAIJA, Terveyttä edistävän organi-saation kehittäminen oppivaksi organisaati-oksi. Kehitysnäytökset ja kehittämistehtävätterveyskeskuksen muutoksen virittäjänä. -Application of a learning organisation modelto improve services in a community healthcentre. Development examples anddevelopment tasks are the key to converting ahealth care. 197 p. Summary 3 p. 1998.
53 OKSA, JUHA, Cooling and neuromuscularperformance in man. 61 p. (121 p.) Yhteenveto2 p. 1998.
54 GIBBONS, LAURA, Back function testing andparaspinal muscle magnetic resonance imageparameters: their associations and determi-nants. A study on male, monozygotic twins.67 p (128 p.) Yhteenveto 1p. 1998.
55 NIEMINEN, PIPSA, Four dances subcultures. Astudy of non-professional dancers´ sociali-zation, participation motives, attitudes andstereotypes. - Neljä tanssin alakulttuuria.Tutkimus tanssinharrastajien tanssiinsosiaalistumisesta, osallistumismotiiveista,asenteista ja stereotypioista. 165 p. Yhteenveto4 p. 1998.
56 LAUKKANEN, PIA, Iäkkäiden henkilöiden selviy-tyminen päivittäisistä toiminnoista. - Carryingout the activities of daily living among elderlypeople. 130 p. (189 p.). Summary 3 p. 1998.
S T U D I E S I N S P O R T , P H Y S I C A L E D U C A T I O N A N D H E A L T H
57 AVELA, JANNE, Stretch-reflex adaptation in man.Interaction between load, fatigue and musclestiffness. 87 p. Yhteenveto 3 p. 1998.
58 SUOMI, KIMMO, Liikunnan yhteissuunnittelu-metodi. Metodin toimivuuden arviointiJyväskylän Huhtasuon lähiössä. - Collabo-rative planning method of sports culture.Evaluation of the method in the Huhtasuosuburb of the city of Jyväskylä. 190 p.Summary 8 p. 1998.
59 PÖTSÖNEN, RIIKKA, Naiseksi, mieheksi, tietoisek-si. Koululaisten seksuaalinen kokeneisuus,HIV/AIDS-tiedot, -asenteet ja tiedonlähteet. -Growing as a woman, growing as a man,growing as a conscious citizen. 93 p. (171 p.).Summary 3 p. 1998.
60 HÄKKINEN, ARJA, Resistance training in patientswith early inflammatory rheumatic diseases.Special reference to neuromuscular function,bone mineral density and disease activity. -Dynaamisen voimaharjoittelun vaikutuksetnivelreumaa sairastavien potilaiden lihas-voimaan, luutiheyteen ja taudin aktiivisuu-teen. 62 p. (119 p.) Yhteenveto 1 p. 1999.
61 TYNJÄLÄ, JORMA, Sleep habits, perceived sleepquality and tiredness among adolescents. Ahealth behavioural approach. - Nuortennukkumistottumukset, koettu unen laatu javäsyneisyys. 104 p. (167 p.) Yhteenveto 3 p.1999.
62 PÖNKKÖ, ANNELI, Vanhemmat ja lastentarhan-opettajat päiväkotilasten minäkäsityksentukena. - Parents´ and teachers´ role in self-perception of children in kindergartens. 138 p.Summary 4 p. 1999.
63 PAAVOLAINEN, LEENA, Neuromuscular charac-teristics and muscle power as determinants ofrunning performance in endurance athleteswith special reference to explosive-strengthtraining. - Hermolihasjärjestelmän toiminta-kapasiteetti kestävyyssuorituskykyä rajoitta-vana tekijänä. 88 p. (138 p.) Yhteenveto 4 p.1999.
64 VIRTANEN, PAULA, Effects of physical activityand experimental diabetes on carbonic an-hydrace III and markers of collagen synthesisin skeletal muscle and serum. 77 p. (123 p.)Yhteenveto 2 p. 1999.
65 KEPLER, KAILI, Nuorten koettu terveys,terveyskäyttäytyminen jasosiaalistumisympäristö Virossa. -Adolescents’ perceived health, healthbehaviour and socialisation enviroment inEstonia. - Eesti noorte tervis, tervisekäitumineja sotsiaalne keskkond. 203 p. Summary 4p.Kokkuvõte 4 p. 1999.
66 SUNI, JAANA, Health-related fitness test batteryfor middle-aged adults with emphasis onmusculoskeletal and motor tests. 96 p. (165p.) Yhteenveto 2 p. 2000.
67 SYRJÄ, PASI, Performance-related emotions inhighly skilled soccer players. A longitudinalstudy based on the IZOF model. 158 p.
Summary 3 p. 2000.68 VÄLIMAA, RAILI, Nuorten koettu terveys kysely-
aineistojen ja ryhmähaastattelujen valossa. -Adolescents’ perceived health based onsurveys and focus group discussions. 208 p.Summary 4 p. 2000.
69 KETTUNEN, JYRKI, Physical loading and laterlower-limb function and findings . A studyamong male former elite athletes. - Fyysisenkuormituksen yhteydet alaraajojen toimintaanja löydöksiin entisillä huippu-urhelijamiehil-lä. 68 p. (108 p.) Yhteenveto 2 p. 2000.
71 HELIN, SATU, Iäkkäiden henkilöiden toiminta-kyvyn heikkeneminen ja sen kompensaatio-prosessi. - Functional decline and the processof compensation in elderly people. 226 p.Summary 10 p. 2000.
72 KUUKKANEN, TIINA, Therapeutic exerciseprograms and subjects with low back pain.A controlled study of changes in function,activity and participation. 92 p. (154 p.)Tiivistelmä 2 p. 2000.
73 VIRMAVIRTA, MIKKO, Limiting factors in skijumping take-off. 64 p. (124 p.) Yhteenveto 2 p.2000.
74 PELTOKALLIO, LIISA, Nyt olisi pysähtymisenpaikka. Fysioterapian opettajien työhönliittyviä kokemuksia terveysalan ammatillises-sa koulutuksessa. - Now it’s time to stop.Physiotherapy teachers’ work experiences invocational health care education. 162 p.Summary 5 p. 2001.
75 KETTUNEN, TARJA, Neuvontakeskustelu. Tutki-mus potilaan osallistumisesta ja sen tukemi-sesta sairaalan terveysneuvonnassa.- Health counseling conversation. A studyof patient participation and its support bynurses during hospital counseling. 123 p. (222p.) Summary 6 p. 2001.
76 PULLINEN, TEEMU, Sympathoadrenal response toresistance exercise in men, women andpubescent boys. With special reference tointeraction with other hormones andneuromuscular performance. 76 p. (141 p.)Yhteenveto 2 p. 2001.
77 BLOMQVIST, MINNA, Game understandingand game performance in badminton.Development and validation of assessmentinstruments and their application to gamesteaching and coaching. 83 p. Yhteenveto5 p. 2001.
78 FINNI, TAIJA, Muscle mechanics during humanmovement revealed by in vivo measurementsof tendon force and muscle length. 83 p. (161p.) Yhteenveto 3 p. 2001.
79 KARIMÄKI, ARI, Sosiaalisten vaikutusten arvi-ointi liikuntarakentamisessa. EsimerkkinäÄänekosken uimahalli. - Social impactassessment method in sports planning. - Thecase of Äänekoski leisure pool. 194 p.Summary 3 p. 2001.
S T U D I E S I N S P O R T , P H Y S I C A L E D U C A T I O N A N D H E A L T H
80 PELTONEN, JUHA, Effects of oxygen fraction ininspired air on cardiorespiratory responsesand exercise performance. 86 p. (126 p.)Yhteenveto 2 p. 2002.
81 Heinilä, Liisa, Analysis of interactionprocesses in physical education. Developmentof an observation instrument, its applicationto teacher training and program evaluation.406 p. Yhteenveto 11 p. 2002.
82 LINNAMO, VESA, Motor unit activation andforce production during eccentric,concentric and isometric actions. - Motoris-ten yksiköiden aktivointi ja lihasten voiman-tuotto eksentrisessä, konsentrisessa jaisometrisessä lihastyössä. 77 p. (150 p.)Yhteenveto 2 p. 2002.
83 PERTTUNEN, JARMO, Foot loading in normaland pathological walking. 86 p. (213 p.)Yhteenveto 2 p. 2002.