A NEW VISION FOR CALIFORNIA’S HEALTHCARE SYSTEM: Integrated Care with Aligned Financial Incentives School of Public Health UNIVERSITY OF CALIFORNIA, BERKELEY for Improving California’s Healthcare Delivery System Berkeley Forum
Transcript
A NEW VISION FOR CALIFORNIA’S HEALTHCARE SYSTEM:
Integrated Care with Aligned Financial Incentives
School of Public Health
UNIVERSITY OF CALIFORNIA, BERKELEY
THE NICHLAS C. PETRIS CENTERhttp://petris.org
for Improving California’s Healthcare Delivery System
Berkeley Forum
PARTICIPANT LISTAnthem Blue Cross Pam Kehaly, President
Blue Shield of California* Bruce Bodaken, Chairman, President and Chief Executive Officer
Blue Shield of California* Paul Markovich, President and Chief Executive Officer
California Department of Insurance** Dave Jones, Insurance Commissioner
California Health and Human Services Agency** Diana S. Dooley, Secretary
Cedars-Sinai Medical Center Thomas M. Priselac, President and Chief Executive Officer
Dignity Health Lloyd Dean, Chief Executive Officer
Health Net Jay M. Gellert, President and Chief Executive Officer
HealthCare Partners Robert J. Margolis, Managing Partner and Chief Executive Officer
Kaiser Permanente George C. Halvorson, Chief Executive Officer
MemorialCare Health System Barry Arbuckle, President and Chief Executive Officer
Sharp HealthCare Michael W. Murphy, President and Chief Executive Officer
Sutter Health Patrick E. Fry, President and Chief Executive Officer
U.S. Department of Health and Human Services** Herb K. Schultz, Regional Director (Region IX)
* During 2012, Bruce Bodaken retired as President and CEO of Blue Shield of California, and Paul Markovich replaced him.** These individuals’ participation in the Forum meetings/discussions does not represent any formal endorsement of the Report by their state or federal Department/Agency nor in their official individual capacities as elected or appointed public officials at the aforementioned Departments/Agencies.
LE ADERSHIP TE AMStephen M. Shortell, PhD, MPH, MBA Chair of the Berkeley Forum, Blue Cross of California Distinguished Professor and Dean of School of Public Health, University of California, Berkeley
Richard M. Scheffler, PhD Vice Chair of the Berkeley Forum, Distinguished Professor of Health Economics and Public Policy and Director of the Nicholas C. Petris Center on Health Care Markets and Consumer Welfare, School of Public Health, University of California, Berkeley
Ian Morrison, PhD Consultant and Facilitator, Berkeley Forum
Liora G. Bowers, MBA, MPH Director of Health Policy and Practice, Nicholas C. Petris Center on Health Care Markets and Consumer Welfare, School of Public Health, University of California, Berkeley
Brent D. Fulton, PhD, MBA Assistant Adjunct Professor of Health Economics and Policy, Associate Director, Nicholas C. Petris Center on Health Care Markets and Consumer Welfare, School of Public Health, University of California, Berkeley
Pictured on next page:
Standing (left to right): Clare Connors, Evan Gallagher, Tien Pham, Michael Kass, Anthony Barrueta, Sue Kim, Robert Reed, Pam Kehaly, Paul Markovich, Diana Dooley, Bart Asner, George Halvorson, Barry Arbuckle, Wade Rose, Mike Murphy, Patricia Clarey, Bonnie Preston, Thomas Priselac, Yumna Bahgat, Ian Morrison, Brent Fulton
Sitting (left to right): Stephen Shortell, Liora Bowers, Richard Scheffler
Inset at top (left to right): Bruce Bodaken, Dave Jones, Lloyd Dean, Herb Shultz, Jay Gellert, Robert Margolis, Patrick Fry
LE AD AUTHORSRichard M. Scheffler and Liora G. Bowers
CO-AUTHORS*
Brent D. FultonClare Connors**Stephen M. ShortellIan Morrison
* With assistance from the following at the Petris Center, School of Public Health, University of California, Berkeley:
Sue Kim, PhD Research Associate in Health Economics
Christopher Whaley Doctoral student in Health Services and Policy Analysis
Evan Gallagher MPP Candidate
Thanh-Tien Pham Forum Coordinator and Project Manager
**Clare Connors, MPH, Research Associate
Berkeley Forumfor Improving California’s Healthcare Delivery System
School of Public Health
UNIVERSITY OF CALIFORNIA, BERKELEY
The Berkeley Forum, established in January 2012, includes select CEOs of California’s health systems, health insurers and physician organizations, along with state regulators and policymakers, that are collaborating to improve the affordability and quality of healthcare for all Californians. The University of California, Berkeley’s School of Public Health serves as a neutral facilitator for discussions and the analytic staff for this effort.
Figure 7: Total Employer-Sponsored Health Insurance Premiums for Single Coverage in California and the United States, 1999 – 2011 . . . . . . . . . . . 26
Figure 8: Total Employer-Sponsored Health Insurance Premiums for Family Coverage in California and the United States, 1999 – 2011 . . . . . . . . . . . 26
Figure 9: Historical (2005 – 2011) and Projected (2012 – 2022) Employer-Sponsored Health Insurance Premiums for Single and Family Coverage as a Percent of Median Household Income in California . . . . . . . . . . . . . . . . . . . . . . . . . . . . . . . . . . . 26
Figure 10: California Cost Curve: Projected Healthcare Expenditures as a Share of Gross State Product Under Different Scenarios, 2012-2022 . . . . . . . . . . . . . . . . . . 32
Figure 11: Projected California Healthcare Expenditures Under Different Scenarios, 2013 – 2022 . . . . . . . . . . . . . . . . 33
Figure A1: Percent of California Physicians Practicing by Medical Group Size, 2011 . . . . . . . . . . . . . . . . . . . . . . . . . . . 43
Figure A2: Distribution by Practice Size of HMO-Accepting Physician Practices in California (2004, 2012) . . . . . . . . . . . . . . . . . . . . . . . . . . . . . . . . . . . . . . . . . . . 43
Figure A3: Lives Covered by HMO-Accepting Physician Practices in California (2004, 2012) . . . . . . . . . . . 43
Figure A4: Accountable Care Organizations by Type and County in California, 2013 . . . . . . . . . . . . . . . . . 44
Figure A5: Share of Healthcare Expenditures Accounted for by California Population Cohorts Ranked by Expenditures, 2009 . . . . . . . . . . . . . . . . . . . . . . . . . 47
Figure A6: Share of Medi-Cal’s Top 5% Healthcare Spending Cohort in 2005 that Remained in the Top 5% from 2006 – 2010 . . . . . . . . . . . . . . . . . . . . . . . 50
Figure A7: Historical (1999 – 2011) and Projected (2012 – 2022) Employer-Sponsored Health Insurance Premiums for Single and Family Coverage in California . . . . . . . . . . . . . . . . . . . . . . . . . . . . . . . . . 50
LIST OF TABLES
Table 1: Healthcare Utilization in California vs. Rest of the U.S., 2005 – 2009 . . . . . . . . . . . . . . . . . . . . . . . . . . . .17
Table 2: Health Status, Chronic Conditions and Lifestyle Factors Over Time for California Adults, 1995 – 2010. . . . . . . . . . . . . . . . . . . . . . . . . . . . . . . . . . . . 21
Table 3: Initiatives Examined by the Berkeley Forum . . . . 29
Table 4: Healthcare Expenditure Reductions in California from Initiatives under Different Scenarios, 2013-2022 . . . . . . . . . . . . . . . . . . . . . . . . . . . . . . . . . . 30
Table 5: Impact of Initiatives on Reducing the Projected Growth Rate of Healthcare Expenditures in California . . . . . . . . . . . . . . . . . . . . . . . . . . . . . . . . . . . . . . . . . . . 31
Table A1: Organizational and Payment Characteristics of California vs. Rest of the U.S. Hospitals, 2011 . . . . . . . . . 44
Table A2: List of Accountable Care Organizations Operating in California, 2013 . . . . . . . . . . . . . . . . . . . . . . . . . . 45
Table A3: Selected Healthcare Quality Measures in California and the United States . . . . . . . . . . . . . . . . . . . . . . . 46
Table A4: Care Management Practices (CMPs) Among Physician Organizations with Twenty or More Physicians in California and the Rest of the U.S., 2006 – 2007 . . . . . . 46
Table A5: Demographic Characteristics and Medical Conditions of Top 5% vs. Bottom 95% Healthcare Expenditure Cohorts in California, 2009 . . . . . . . . . . . . . 48-49
A New Vision for California’s Healthcare System 3
PR E FACE Our nation has embarked on one of the boldest social initiatives in its history: To expand health insurance coverage to nearly all Americans while simultaneously trying to reduce the rate of increase in healthcare spending. The challenge is great everywhere in the country, but especially here in California, due to our state’s large and diverse population and its sizeable number of uninsured residents.
Some social problems are so complex that they cannot be solved by any single firm, industry, sector or government agency acting alone. Instead, they require a partnership and leadership across organizations. Recognizing this, private and public sector leaders in California came together to address the challenge of developing a more affordable and cost-effective healthcare system that would contribute to improved population health for all Californians.
This was the motivation behind the Berkeley Forum for Improving California’s Healthcare Delivery System. The Forum includes the CEOs of six of California’s leading health systems, three health insurers and two large physician organizations, along with the California Secretary of Health and Human Services, the U.S. Department of Health and Human Services Region IX Director and California insurance regulators (see “Participant List” on the inside front cover of the report).1 The University of California, Berkeley School of Public Health was pleased to serve as a neutral facilitator for discussions and as the analytic staff for this effort. “A New Vision for California’s Healthcare System: Integrated Care with Aligned Financial Incentives” is the result of the collective work of all involved.
This report is based on extensive analysis and careful investigation using multiple data sources (see appendices), in consultation with healthcare experts at both the state and national level. In the pages that follow, we provide a brief history and background of the state’s delivery and payment systems, along with a discussion of the healthcare affordability crisis. We then analyze how seven specific initiatives might reduce healthcare spending relative to the state’s gross domestic product, or bend the “Cost Curve,” defined in this report as the share of Gross State Product (GSP) spent on healthcare. Particular emphasis is paid to the 5% of Californians who routinely account for more than half of the state’s healthcare expenditures in a given year. We also assess two specific initiatives aimed at improving the health and healthcare of Californians, one involving increasing physical activity, the other expanding palliative care. And we lay out a vision for California’s future healthcare system that is intended to better align financial incentives and increase care integration.
This document complements Governor Brown’s “Let’s Get Healthy California” report of December, 2012. The Governor’s report established baseline indicators and target goals for assessing the health of Californians in priority areas, along with examples of initiatives. This report provides estimates of the expenditure reductions that can be achieved by pursuing some of those initiatives. To have their maximum impact,
Stephen M. Shortell, PhD, MPH, MBA
1 The participation by the California Secretary of Health and Human Services, the U.S. Department of Health and Human Services Region IX Director and California insurance regulators in the Forum meetings does not represent any formal endorsement of the Report by their state or federal Department/Agency nor in their official individual capacities as elected or appointed public officials at the aforementioned Departments/Agencies.
PHO
TO B
Y JI
M B
LOC
K
4 Berkeley Forum | F E BRUA RY 201 3
the initiatives will require sustained leadership from the healthcare delivery, public health, education, housing, labor, transportation, social services and related sectors, all working together.
The ultimate result of these efforts will be measured by improved affordability and a healthier California. While much is already happening, this report urges accelerated action. We need to reach farther and dig deeper. We all need to put our oars in the water and start rowing in the same direction to make California the healthiest state in the nation at a cost that we can afford. I hope you will engage with the ideas and analyses in this report and think hard about what you will do to move us forward.
Best wishes,
Stephen M. Shortell, PhD, MPH, MBAChair of the Berkeley Forum for Improving California’s Healthcare Delivery SystemBlue Cross of California Distinguished Professor Dean, School of Public HealthUniversity of California, BerkeleyFebruary, 2013
If you want to go fast, go alone. If you want to go far, go together.Old African proverb
A New Vision for California’s Healthcare System 5
BERKELEY FORUM VISION
In response to our healthcare challenges, the Forum Vision calls for a rapid shift towards integrated systems that coordinate care for patients across conditions, providers, settings and time, along with risk-adjusted global budgets that encompass the vast majority of an individual’s healthcare expenditures. Specifically, the Forum endorses two major goals for California to achieve by 2022: 1) Reducing the share of healthcare expenditures paid for via fee-for-service from the current 78% to 50%; and 2) Doubling, from 29% to 60%, the share of the state’s population receiving care via fully- or highly-integrated care systems. The Berkeley Forum also calls for greater emphasis on population health, including lifestyle and environmental factors that promote good health.
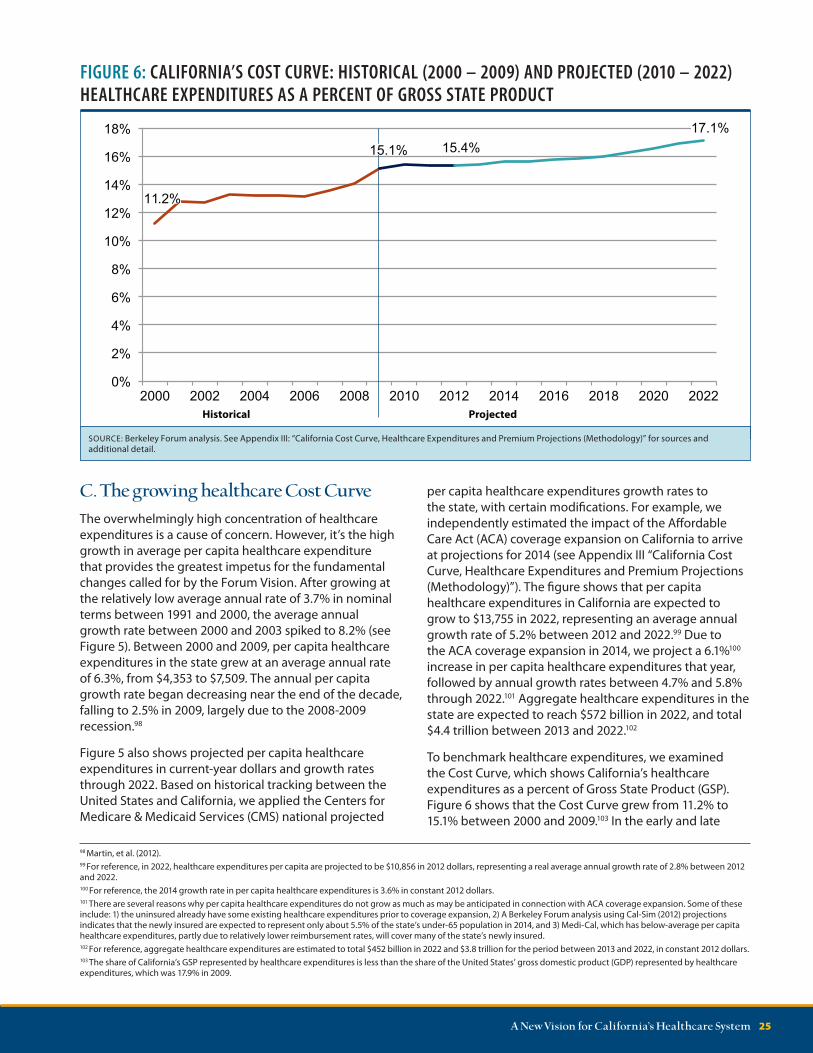
In a typical day, Californians spend over $850 million on healthcare. In a typical year, 53% of the state’s healthcare expenditures are spent by just 5% of the population. More alarming is the fact that by 2022, total employer-based insurance premiums for a family are projected to consume almost a third of median household income. Similarly, the share of the Gross State Product consumed by healthcare continues to grow; it is projected to rise from 15.4% in 2012 to nearly 17.1% in 2022, reducing our ability to invest in other crucial areas. We also face a continuing obesity epidemic that results in growing rates of chronic diseases skewed to the lower end of the socioeconomic ladder. Additionally, the state’s healthcare system will be stressed even further due to several million additional Californians gaining insurance coverage via the Affordable Care Act. These are just some of the reasons it is critical that we address the financial sustainability
E X ECU T I V E SU M M A RYof the state’s healthcare system without delay. It is time for fundamental change. It is time for action.
Recognizing this, California private and public sector leaders came together in an unprecedented collaborative effort, with academic expertise and analytic support provided by the University of California, Berkeley’s School of Public Health, to address these challenges. Determined to avoid solutions divorced from societal, regulatory and political realities, the Forum has devised a transformational, bottoms-up approach to creating a more affordable, cost-effective healthcare system that would, at the same time, improve Californians’ health and well-being.
These are ambitious goals. To attain them, the Forum supports a flexible approach to payment reform, including shared-savings as well as bundled and episode-based payments that can facilitate the transition towards broader implementation of risk-adjusted global budgets.
6 Berkeley Forum | F E BRUA RY 201 3
0%
10%
20%
30%
40%
50%
60%
70%
80%
90%
100%
8.1
17.4
8.5 9.2
21.1
4.5
6.6
Fee-for-service
Payment type
Partial risk
Full / dual risk
$47.7
$20.6
$245.0
Payment type1,2 ($,billions)
Payment type2 (Lives, millions)
Integration level3 (Lives, millions)
High
Low
Integration level
Moderate
Full
Notes: 1) Expenditure estimates are reported in 2012 dollars. 2) Full / dual risk refers to a payment arrangement in which providers accept risk for both professional services and hospital services. Partial risk refers to a payment arrangement in which providers accept professional services risk only. 3) There are various factors that are relevant in assessing care integration; for the purposes of this analysis, we estimate lives by integration level based on medical group size in California given that size has been shown to be associated with use of more integrated care processes. Only Kaiser Permanente physicians are considered to be fully-integrated. Medical groups of greater than 100 physicians are considered highly-integrated, while Independent Practice Associations (IPAs) are considered moderately-integrated. Lives receiving care from medical groups with 100 or fewer physicians are allocated into either moderate or low integration based on both medical group size and a physician’s likelihood of being in an IPA.SOURCE: Berkeley Forum analysis. See Appendix II: “California’s Delivery System Integration and Payment System (Methodology)” for more detail on methodology, assumptions and sources.
The Forum Vision was developed considering the characteristics of California’s unique healthcare system, namely:
n Californians already have relatively low utilization of healthcare services—including rates of hospital admissions and inpatient days at 79% and 74%, respectively, of the rest of the U.S.
n California has the 9th lowest per capita personal healthcare spending among states in the country.
n Health maintenance organizations (HMOs) with providers under full or partial risk insure 44% of California’s population, about double the U.S. share. However, fee-for-service reimbursement still accounts for about $245 billion (or 78%) of healthcare
FIGURE 1E: BREAKDOWN OF PAYMENT MECHANISMS AND DELIVERY SYSTEM INTEGRATION IN CALIFORNIA, BY LIVES AND DOLLARS, 2012
expenditures, and only about 11 million Californians (or 29%) receive care in fully- or highly-integrated systems (see Figure 1E).
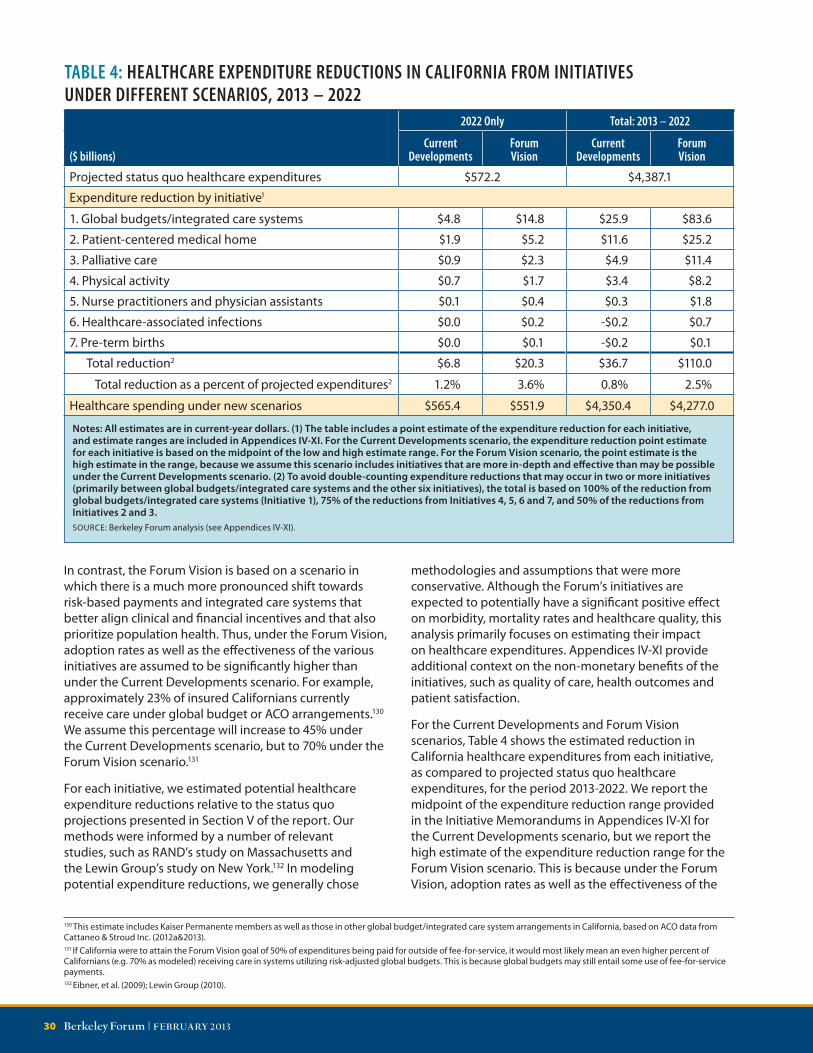
To assess the potential of the Forum Vision to create a more affordable healthcare system, we estimated the potential expenditure reductions associated with seven different initiatives, most of which target populations with the highest healthcare expenditures. We did so under two scenarios: 1) “Current Developments,” which considers unfolding market forces, policies and regulations and is distinct from the status quo, which is based on historical trends; and 2) the “Forum Vision,” which calls for aggressive changes, such as increased reliance on integrated care systems, risk-adjusted global budgeting, and population health practices (see Figure 2E).
A New Vision for California’s Healthcare System 7
-$20.0 $0.0 $20.0 $40.0 $60.0 $80.0 $100.0 $120.0
Pre-term births
Healthcare-associated infections
Nurse practitioners and physician assistants
Physical activity
Palliative care
Patient centered medical homes
Global budgets / integrated care systems
Current year dollars (billions)
Forum Vision
Current Developments
$110.0 (2.5%) $36.7 (0.8%)
Total reduction1,2
(and % of total expenditures)
FIGURE 2E: HEALTHCARE EXPENDITURE REDUCTIONS IN CALIFORNIA FROM INITIATIVES UNDER THE CURRENT DEVELOPMENTS AND FORUM VISION SCENARIOS, 2013 – 2022 TOTAL
Notes: 1) Total projected healthcare expenditures in California from 2013 – 2022 are $4,387 billion (in current-year dollars). 2) The “total reduction” is adjusted for savings overlap among the individual initiatives. SOURCE: Berkeley Forum analysis. Refer to Appendices IV-XI for expenditure reduction estimates for each initiative as well as to Appendix III: “California Cost Curve, Healthcare Expenditures, and Premium Projections (Methodology)” for projections of California’s healthcare expenditures under the status quo from 2013 – 2022.
Under the Current Developments scenario, these initiatives are expected to reduce healthcare expenditures by $37 billion between 2013 and 2022. This reduction represents 0.8% of the $4.4 trillion in total healthcare expenditures projected under the status quo (see Figure 2E).
Under the Forum Vision, we estimate:
n A $110 billion reduction in healthcare expenditures from 2013 to 2022, representing 2.5% of the total $4.4 trillion in projected healthcare expenditures under the status quo during these 10 years (see Figure 2E).
n An average reduction of $802 per California household per year over this period, and $1,422 per household in 2022.
n A reduction of the projected 2022 “Cost Curve,” or healthcare expenditures as a share of GSP, from 17.1% to 16.5% (see Figure 3E).
The above initiatives represent great opportunities for improving the health and healthcare of Californians. Additional initiatives not explored here would also complement the Forum Vision, and could lower expenditures beyond the 2.5% projected under the Forum Vision. The Berkeley Forum participants endorse the above seven initiatives and support their implementation to help achieve the Forum Vision. Furthermore, Forum participants believe that two of these initiatives warrant additional attention and have a significant potential for reducing expenditures while improving health and healthcare quality. First, the Forum calls for a statewide effort to increase the rates of physical activity among all Californians. Secondly, the Forum supports increased palliative care access for seriously ill patients, as a means of providing fully-informed, person- and family-centered care, and an enhanced quality of life for this population.
FIGURE 3E: CALIFORNIA COST CURVE: PROJECTED HEALTHCARE EXPENDITURES AS A SHARE OF GROSS STATE PRODUCT UNDER DIFFERENT SCENARIOS, 2012 – 2022
The Forum recognizes several significant challenges to implementing the Forum Vision. One is the need for a new regulatory framework that allows for the development of more integrated care systems, both incentivizes and promotes efficiency and quality, and ensures market-based competition. Other challenges to the Forum Vision include growing rates of employer self-insurance and government policies and market forces that are contributing to a decline in HMO enrollment among those with employer-sponsored insurance.
Forum participants remain committed to working together and with others in establishing new policies, regulations, approaches and shared practices that would help facilitate implementation of competing integrated care systems and adoption of risk-adjusted global budgets. Forum members additionally support Medicare and Medicaid patients receiving care from coordinated
settings, and their providers engaging in deeper and broader risk-based contracting. Forum members also recognize that for their Vision to be achieved, various policy and regulatory changes will be necessary at the state and federal level, including changes to Medicare’s reimbursement and benefit structure and to the existing state-federal Medicaid financing approach. Finally, the Forum reinforces the need for continued efforts by stakeholders in the healthcare delivery, public health, education, housing, labor, transportation, and social services sectors, along with the employer community, and supports the goal of Governor Brown’s “Let’s Get Healthy California” report to make California the healthiest state in the nation by 2022.
SOURCE: Berkeley Forum analysis. See Section VI “Addressing the Affordability Crisis: Bending the Cost Curve” and Appendix III: “California Cost Curve, Healthcare Expenditures, and Premium Projections (Methodology)”.
A New Vision for California’s Healthcare System 9
SEC TION I
IntroductionIt’s Tuesday, and 38 million Californians are starting their daily routines—driving children to school, heading to the office, running errands or enjoying retirement. Over one million of those Californians will earn their living as part of the state’s healthcare workforce.2 Many of their friends and neighbors will interact with the healthcare system in other ways. Nearly 300,000 will visit their doctor. More than 750,000 prescriptions will be filled. And more than 10,000 people will be admitted to the most intensive of all healthcare settings—the hospital.3
One of these people, 62-year old Mr. Jones, is an obese man who has suffered from hypertension for years.4 Diagnosed with congestive heart failure (CHF) three years ago, he was rushed to a San Diego hospital last week due to fever, chills and shortness of breath. Mr. Jones was treated for pneumonia with complications, and after four days, was released from the hospital with four new prescriptions. Unfortunately, these medications were added to a medicine cabinet containing ten other prescription drugs—drugs that Mr. Jones wasn’t taking as directed. The doctors treating him in the hospital were unaware of these other medications, and the difficulty Mr. Jones had with complying with his prescription regimen. When Mr. Jones returned home from the hospital, he was confused and unsure of whom to ask about his pills. But his first appointment with his family doctor was not scheduled until several days later. As a result, Mr. Jones was rushed back to the hospital in serious condition, due to a combination of drug interactions and failure to adhere to his recommended treatment.
On the same day that Mr. Jones is fighting for his life, 1,375 new Californians are being born.5 Over a third of them are delivered via C-section,6 including baby boy Wong. The infant’s arrival in Fresno results in a price tag of slightly under $8,400.7 By contrast, had he come into the world in Sacramento, the price would have been around $13,700. Had baby boy Wong been born vaginally, not only might there have been health benefits to him and his mother, but the delivery price would likely have been only about two-thirds as much. Fortunately, baby boy Wong arrived full term, increasing his chances of being healthy. But there were some scares along the way.
2 Bates, et al. (2011).3 The reported statistics are rough estimates for illustrative purposes only. Hospital statistics are based on data from the California Office of Statewide Health Planning and Development (2010). Physician visits and prescription drug statistics are based on data from the Medical Expenditure Panel Survey.4 The individuals referenced in this section are not real people (nor do their names represent specific persons) but are only illustrative sketches.5 California births in 2011 from California Department of Public Health (2011).6 Centers for Disease Control and Prevention (2011).7 Based on Milliman’s analysis of Thomson Reuters MarketScan Commercial Claims and Encounters Database 2008-2010. Not adjusted for relative cost of living within California.
These three stories are a small sample of the events taking place in California’s healthcare system daily. On a typical day, Californian’s spend about $265 million on hospitals, $235 million on physicians and $100 million on pharmaceuticals— almost $800 million on healthcare, every single day.
10 Berkeley Forum | F E BRUA RY 201 3
During a visit to her community health clinic in her sixth month of pregnancy, Mrs. Wong exhibited troubling signs that she may be at risk for preterm delivery. Via in-home assistance and a nurse coordinator, Mrs. Wong enjoyed active monitoring throughout the remainder of her term. The happy result was that baby boy Wong avoided all of the grave health risks associated with premature birth. In addition, tens of thousands of dollars in medical expenses were saved.
On this Tuesday a year ago, 48-year-old Mrs. Hernandez was one of the nearly 200,000 Californians annually diagnosed with diabetes.8 Because of her health plan and medical group, she was quickly able to enroll in a comprehensive diabetes management program. As a result, Mrs. Hernandez was able to get her blood sugar under control. She was also encouraged to make some lifestyle changes designed to slow the progression of the disease. She and her 19-year-old daughter now take half-hour fitness walks every morning. They also enjoy their regular Saturday morning trip to the farmer’s market to buy fresh produce. Mrs. Hernandez hopes that her efforts may help her daughter prevent the onset not only of diabetes, but also of other health problems that run in the family. For Mrs. Hernandez, the results are already apparent, both in her improved health and in the greatly reduced cost of her treatment. The annual expense for her maintenance medications along with the cost of all her appointments with her health care providers is about $1,0009—far below the $11,000 annual average to treat diabetes.10
These three stories are a small sample of the events taking place in California’s healthcare system every day. On a typical day, Californian’s spend about $285 million each on hospital and physician services and $110 million on pharmaceuticals—a little over $850 million on healthcare in all.11
Hundreds of thousands of Californians, each of them presenting with any of countless conditions, will arrive at a healthcare facility on a given day. The resulting costs are borne by all Californians, whether or not they are actively taking part in the healthcare system; it comes through higher insurance premiums and higher taxes. Californians spend an average of $23 a day, every single day, on healthcare, representing about 23% of the median wage in the state.12
This affordability crisis prompted private and public-sector leaders of California to come together via the Berkeley
8 Behavioral Risk Factor Surveillance System (2010).9 The $1,000 estimate is an approximation, and is based on four physician visits ($100 each), four educator/nutritionist visits ($80 each), lab work ($200), and metformin ($100), all representing typical costs for a controlled diabetic without complications.10 Dall, et al. (2010). To arrive at this estimate, we took the cited figure from the study of $9,677 in 2007 and increased it at the rate of California’s per capita healthcare expenditures through 2012 (See Appendix III: “California Cost Curve, Healthcare Expenditures and Premium Projections (Methodology)”).11 Breakdown for services based on Kaiser Family Foundation (2009a) estimates, using total 2012 California healthcare expenditures (See “Appendix III: “California Cost Curve, Healthcare Expenditures and Premium Projections(Methodology)”).12 Median wage data from U.S. Bureau of Labor Statistics (2011); Based on total 2012 healthcare expenditures, regardless of payer source. (See “Appendix III: “California Cost Curve, Healthcare Expenditures and Premium Projections (Methodology)”). Note that we assume 240 working days a year to calculate total wages; however healthcare expenditures are based on 365 days in a year.
Forum. During a series of meetings over the past year, and using research provided by the Forum staff, the Berkeley Forum discussed the factors that affect California’s healthcare utilization, costs and prices. The group benchmarked the state’s performance in health status, care quality and affordability in the context of the state’s considerable geographic and socioeconomic variations. Throughout the process, Forum participants were mindful of the basic characteristics of California’s unique system: higher physician integration, provider accountability and the delegated model, and better financial alignment through full and partial risk-based payments. The Forum’s discussions centered on expanding these approaches to even more segments of the state’s healthcare system, including additional physicians, facilities and patients. As the discussions progressed, a profound concern emerged about the growing burden of poor health not only on individuals, but also on at-risk populations and on the system as a whole. Forum participants developed and endorsed a broad Vision calling for a rapid shift towards fully- or highly-integrated care systems, along with risk-based payment mechanisms that prioritize population health. Adopting this Vision would result in fundamental changes to how we conceive of, deliver, and pay for healthcare in California.
These fundamental changes are the heart of this report. Section II expands on the Forum Vision summarized above. Section III includes a history of California’s healthcare system, and analyzes current performance in areas such as care integration and risk-based payment mechanisms. Section IV discusses health status and healthcare quality in the state, while Section V assesses the growth rates and increasing concentration of California healthcare expenditures. It also provides projections for those expenditures and for employer-sponsored health insurance premiums. To help address the growing affordability challenge, Section VI assesses the impact of the Forum’s seven initiatives on bending the “Cost Curve” over the coming ten years. Section VII offers additional context and recommendations involving two Forum priority areas—physical activity and palliative care. Section VIII discusses several challenges to implementing the Forum Vision. The report concludes in Section IX with a discussion of the key strategies and initiatives involved in implementing the Forum Vision. We finish the report by returning to the vignettes of the three Californians described in the Introduction, providing a perspective on how the Forum Vision would positively shape health and healthcare experiences in the state.
A New Vision for California’s Healthcare System 11
SEC TION II
The Forum VisionIn response to our healthcare challenges, the Forum Vision calls for a rapid shift towards integrated systems that coordinate care for patients across conditions, providers, settings and time, along with risk-adjusted global budgets that encompass the vast majority of an individual’s healthcare expenditures. Specifically, the Forum endorses two major goals for California to achieve by 2022: 1) Reducing the share of healthcare expenditures paid for via fee for service from the current 78% to 50%; and 2) Doubling, from 29% to 60%, the share of the state’s population receiving care via fully- or highly- integrated care systems. The Berkeley Forum also calls for greater emphasis on population health, including lifestyle and environmental factors that promote good health.Over the last three decades, healthcare providers, insurers and purchasers have attempted numerous initiatives to reduce healthcare expenditures while improving health outcomes. These included provider-centered methods such as disease management and hospital discharge programs, as well as consumer-oriented efforts such as wellness incentives to maintain healthy lifestyles and greater cost-sharing to reduce unnecessary care. Many of these initiatives lead to quality improvements and expenditure reductions. But Californians have nonetheless continued to face a combination of rising expenditures and sub-optimal health outcomes. As a result, our healthcare system is experiencing ever-greater financial challenges, including higher premiums and cost-sharing, lower levels of employer-sponsored coverage and major pressure on state and federal budgets. Simultaneously, Californians are experiencing an epidemic of poorly managed chronic diseases, caused in large part by growing rates of obesity and inactivity, along with increasing health disparities among socio-economic groups. There are many individual initiatives underway to address these challenges. But the Forum believes that for all their benefits, they do not go far enough. Much more needs to be done, and done soon.
To seriously address the state’s healthcare challenges, the Forum believes that the fundamental structure
of healthcare delivery and financing must change. The Forum believes that healthcare must be delivered via systems that coordinate care for patients across conditions, providers, settings and time, and are paid to deliver good outcomes, quality and patient satisfaction at an affordable cost. Specifically, the Forum recommends significant payment reform that aligns financial and clinical incentives. The act of tying providers to a risk-adjusted global budget that encompasses the full spectrum of a population’s healthcare needs is the single most important step that can be taken to achieve the twin goals of better health and better healthcare.13
Within or alongside risk-adjusted global budgets, various payment mechanisms for providers or facilities may be warranted. In addition, patients may opt to pay extra on their own for additional benefits or services. The Forum supports a pluralistic approach that encompasses many different reform initiatives, such as shared-savings, bundled and episode-based payments. These efforts can help address care fragmentation and misaligned incentives, as well as facilitate the transition towards deeper and broader implementation of risk-adjusted global budgets. The Forum Vision is not tied to any particular product type, such as HMOs or PPOs, and recognizes that market forces may require that products evolve to allow innovative payment models to emerge, such as risk-based payments in PPOs or increased cost-sharing in HMOs. Regardless of the extent of risk assumed, having consistent payment methodologies across different payers and providers would mitigate the extraordinarily high and growing burden of administrative inefficiencies in our current system. For example, consistent payment systems could greatly streamline billing, claims processing, prior authorizations and eligibility verification. Payment mechanisms should be risk-adjusted for the underlying health status of the patient population, and also adjusted for factors that promote the public good, such as medical education, community benefits and care provision in underserved areas.
The Forum believes that integrated care systems composed of sufficiently scaled medical groups and hospital and health systems can provide the platform for effective stewardship of both the health and financial risk of a population. As part of this Vision, individual or small physician practices, free-standing hospitals, nursing homes, rehabilitation centers and other components of the care continuum would be brought together in new organizations that could be held accountable for the overall health and care of patients. It is crucial that these new organizations have patient populations large enough to properly support investments in areas such as
13 In California’s dual regulatory structure, capitation arrangements are restricted to Department of Managed Health Care regulated Health Maintenance Organization (HMO) products, and are not allowed in Department of Insurance regulated Preferred Provider Organizations (PPOs). Therefore, this report primarily uses the broader terminology of global budgets rather than global payments. Global budgeting refers to a pre-determined expenditure target for a defined population, and providers take upside (and potentially downside) risk on whether the budget is met, but not necessarily 100% of the risk. Reimbursement for services may still be on a fee-for-service basis. In contrast, a global payment is akin to a pre-determined per-member per-month capitated payment, wherein providers take both upside and downside risk at 100%, which can be mitigated through reinsurance.
12 Berkeley Forum | F E BRUA RY 201 3
information technology, new care practices, outcomes data collection and evidence-based initiatives. The Forum expects that fundamental payment reforms would unleash the power of innovation and care redesign on the scale necessary to achieve better health at a more affordable cost. Indeed, the few examples of fully-integrated delivery systems that exist today demonstrate that financial accountability for a population’s health is a very effective motivator of innovative practices in prevention, chronic disease management and care for seriously ill patients. These organizations are the country’s pioneers in effective use of the physician and non-physician workforce, alternative care sites, health information technology, patient engagement and care management tools.
As we implement this Vision, it is important to remember that a highly competitive market among integrated healthcare systems is crucial to preventing organizational complacency or undue market leverage, which could result in insufficient choices and higher prices for patients and purchasers. Payers and consumers should always be able to choose among viable competing options of integrated systems; these systems might span geographies by combining traditional practice sites and virtual networks. Innovations such as telemedicine, remote monitoring and connections between central expertise “hubs” and small practice “spokes” can help support competition, particularly in more rural settings. The Forum also supports transparency in the reporting of standardized measures of quality and outcomes, since complete and free access to information will promote competition, empower patients and fuel additional improvement within the healthcare system. Implementing mechanisms to capture claims details within capitation arrangements, which is not standard practice today, is also necessary to support robust measurement, internal quality improvement and overall system transparency.
The Forum supports engaging Californians directly in taking active responsibility for healthier lifestyles and value-driven healthcare decisions. However, the Forum also believes that providers and payers have a responsibility to help patients make optimal clinical and financial decisions involving the care they receive. As such, the Forum is concerned about current trends that distance providers and payers from value-driven accountability for healthcare, such as the movement away from HMO principles or the adoption of blanket cost-sharing approaches without regard to value. While such approaches are perhaps attractive to purchasers because they reduce patient demand in the short-term, the Forum believes they ultimately make less attainable the long-term goal of better health at a more affordable cost. The Forum strongly supports benefit designs that
promote healthier lifestyles, patient engagement and shared decision-making as important steps towards cost-effective, high-value care.
The Forum expects that the accountability resulting from risk-based payments would support greater investment in the long-term health of patients. Transparency in risk-adjusted outcomes, moreover, could facilitate the purchasing of healthcare services in support of good health. The Forum recognizes that environmental and behavioral factors are paramount in influencing health outcomes. The choices individuals make in areas such as nutrition or medication adherence are usually affected by factors outside of the healthcare system, but nonetheless can be contributors to poor health status and outcomes. California should collectively create a culture of health that crosses socioeconomic and demographic lines and touches all Californians every day, in all aspects of their lives and work. A critical part of this effort will involve creating environments where the default option is healthier food and smaller portions, as well as increased physical activity, especially walking. This sort of transformation will require dedication and collaboration across the employer, healthcare, education, transportation and housing sectors.
There are numerous other important issues affecting the healthcare system that we do not address here, including the technology “arms race,” the incompatibility of electronic health record systems, the cost-shifting from public to private payers and the healthcare system’s growing regulatory burdens. Nonetheless, we believe successful implementation of the Forum Vision will result in a healthier population and a more efficient healthcare delivery system. Of course, this Vision will require work on the part of all stakeholders; business models and processes will have to change, and the public will have to be educated and engaged. Fortunately, California is particularly well-positioned to lead the nation in fundamentally restructuring its payment system to facilitate the greater integrated care and prioritization of prevention envisioned in this report. A distinguishing characteristic of our system is high HMO14 enrollment and the presence of large medical groups, both of which have helped create well-established processes to address population health needs. At the same time, because our hospitals are both larger and more likely to be part of a multi-hospital system, they are capable of undertaking the sorts of financial risks and investments that would be challenging for smaller hospitals. As California is home to some of the nation’s leading integrated delivery systems, as well as a growing number of ACOs15 and other risk-based health delivery models, we are confident that our state has the foundation to make this major leap forward.
14 For the purposes of the report, we define HMOs to include Knox-Keene licensed HMOs, as well as HMO “look-alike” plans offered by Medicare Advantage and Medi-Cal, such as Medi-Cal County Organized Health System Plans. These plans share characteristics such as mandatory selection of a primary care physician, utilization review, lower patient cost-sharing and capitated payments for some or all of the care provided.15 Unless stated otherwise, this report does not use the term Accountable Care Organization (ACO) to refer to a specific model or insurance product, but rather to all entities that 1) provide care for a specified group of patients, 2) operate under a global budget or spending target that encompasses most or all of an individual’s healthcare services, 3) report on and receive incentives related to quality of care, and 4) share financial risk.
A New Vision for California’s Healthcare System 13
SEC TION III
The California Healthcare System: Past and PresentThe Forum Vision sets out a path for California’s healthcare system that emphasizes a rapid shift towards fully- or highly-integrated care systems and risk-based payment mechanisms that emphasize population health. But achieving that future for California requires an understanding of the state’s past. Therefore, we begin with a short history of California’s healthcare delivery and payment system. We then discuss characteristics of the current system and then assess the system’s performance with respect to the goals of the Forum Vision.
A. A brief historyCalifornia is unique not only in its high level of HMO enrollment, but also in its use of risk-based payments and the delegated model, both of which transfer risk and a range of care management functions from health plans to provider organizations. Under the delegated model, health plans contract with physician groups, providing a capitated payment per enrollee in exchange for the group’s assuming responsibility for downstream costs, utilization management and chronic disease care management for their assigned enrollees. The presence of large physician organizations—many with strong hospital affiliations—along with the significant presence of Kaiser Permanente (Kaiser), made acceptance of this model more attractive in California.16
Kaiser began offering health plans to the community in 1945, and by 1976, membership had grown to about three million.17 The Kaiser model includes a partnership involving the health plan, hospitals and large multi-specialty medical groups. Faced with Kaiser’s success—the organization enjoyed a 15%-20% price advantage in the insurance market until the 1990s—other California health plans and providers began seeking a competitive response.18 Demand for Health Maintenance Organization (HMO) plans increased after passage of the federal Health Maintenance Organization Act of 1973, which required
employers to offer at least one HMO product in markets where they were available.19 Physicians started forming medical groups and Independent Practice Associations (IPAs), composed of private-practice physicians who jointly negotiated with insurers, mainly on a capitated basis. These physician groups began developing methods for managing the health of their patient populations, specifically for reducing hospitalizations. The result was that health plans transferred risk and care management responsibilities to these physician groups. As interest grew in risk-based payments as a means to reduce unnecessary utilization, health plans began transferring some of the institutional (hospital) risk to providers. Many hospitals were involved in forming affiliated IPAs, often encouraged by health plans to create joint arrangements to manage this risk. Capitation20 was used extensively to deal with both institutional and professional services risk.
However, this broad physician-hospital capitation model was not without its problems. Many risk-bearing organizations went bankrupt, which led to stricter regulations on the type and amount of risk that could be assumed. Many HMO patients experienced hurdles in accessing care and in complying with complex administrative requirements,21 resulting in a backlash against the concept by both consumers and employers. Most significantly, perhaps, hospitals lost substantial revenue due to the processes established by HMOs to help reduce hospitalizations. Hospitals determined that they were not recouping enough revenue from the joint risk agreements to compensate for their growing overcapacity. As smaller hospitals consolidated and larger systems emerged, hospitals saw opportunities for more attractive reimbursement via a traditional model based on admissions. Commercial inpatient rates increased quickly, further attracting hospitals to move towards separate service-based reimbursement in which they had greater negotiating leverage.22 Physician groups also began reducing the level and inclusion of capitation, carving out areas such as prescription drugs and mental health. By the early 2000s, commercial HMO coverage rates and the use of broad physician-hospital capitation had declined from their mid-1990s peak.23
B. The current delivery and payment systemDespite these developments, the delegated model HMO is still more important in California than in other states, because of its long history and the more recent movement of patients into Medi-Cal and Medicare
16 California HealthCare Foundation (2009b).17 Group Health Association of America (1977).18 McCarthy, et al. (2009). 19 Gruber, et al. (1988).20 Capitation is a payment arrangement in which a provider receives a set payment per patient to provide health services during a defined time period. 21 For an illuminating case study on the state of HMOs in the late 1980 and early 1990s, see Kane, et al. (1996).22 Based on an interview with Tom Williams, President and CEO of Integrated Healthcare Association on July 20, 2012. 23 Robinson (2001).
14 Berkeley Forum | F E BRUA RY 201 3
0%
20%
40%
60%
80%
100%
0
2
4
6
8
10
12
14
16
18
2004 2005 2006 2007 2008 2009 2010 2011 2012
HM
O e
nrol
lmen
t as
% o
f pop
ulat
ion
Mill
ions
of l
ives
Medicare Advantage Medi-Cal/Healthy Families Commercial HMO enrollment as % of population
managed care. In California, 44% of the population is covered by an HMO, and this share has remained relatively consistent over the last eight years.24 This share is about twice the U.S. HMO rate,25 which has been declining over the past ten years in favor of Preferred Provider Organization (PPO) / Point of Service (POS)-type plans. The composition of the California HMO population has shifted dramatically; commercial HMO enrollment has declined by nearly 15% since 2004 while enrollment in public programs has increased (Figure 1). California’s Medicare Advantage enrollment grew 37% between 2004 and 2012,26 and Medi-Cal managed care enrollment grew 82% during the same period.27 Large medical groups that were instrumental in developing the delegated model in California have been challenged by this demographic change in the HMO population, as Medi-Cal payments do not make up for the lost revenue from commercial patients. With the change in the HMO payer mix, there has also been a shift in the physician groups caring for HMO patients, as there is often little overlap between the medical groups who treat the commercial and Medi-Cal populations. The movement of additional populations into Medi-Cal managed care, such as the recent mandated enrollment of dual-eligible Medi-Cal/Medicare members, is also requiring HMOs to
24 Cattaneo & Stroud Inc. (2012a).25 Kaiser Family Foundation (2012).26 Kaiser Family Foundation (2004); Kaiser Family Foundation (2012d).27 Cattaneo & Stroud Inc. (2012a).28 Mathematica Policy Research/Kaiser Family Foundation Analysis of CMS Medicare Advantage enrollment and landscape files 2011-2012 (2012).29 Cattaneo & Stroud’s HMO Medical Group Enrollment Report is based on a survey of medical groups with six or more primary care physicians and at least one direct HMO contract.30 IMS Health Incorporated (2010).
FIGURE 1: HMO ENROLLMENT IN CALIFORNIA, 2004 – 2012
develop new capacities for effectively managing the care of some of the sickest populations with the most complex healthcare needs.
Due to its long history with HMO contracts and the delegated model, California has led the nation in clinical and financial integration among physicians. Physician organizational structure varies greatly within the state depending on such factors as urbanization, local preferences and hospital and insurer markets. Many physicians have joined medical groups, which are defined as an organization with common ownership that can span various practice sites and counties. In California, 41% of physicians practice in medical groups of more than 25 physicians, and 80% of these physicians are in groups of more than 100 (see Figure A1 in Appendix I).30 On the other hand, 35% of the state’s physicians are either solo practitioners or are in a group of between two and four physicians. Figure 2 shows that 15 counties in California have at least 40% of their physicians practicing in groups of 25 or more. While the Bay Area and surrounding counties, along with several counties in Southern California, have higher penetration of medical groups with more than 25 physicians, many counties are still served by physicians in smaller medical groups.
Notes: 1) 96% of California’s Medicare Advantage enrollees are enrolled in an HMO.28
SOURCE: Berkeley Forum analysis using Cattaneo & Stroud Inc. (2012a).29
A New Vision for California’s Healthcare System 15
Many of California’s smaller group physician practices are often part of a “virtually integrated” IPA, which jointly negotiates with insurers and cares for HMO patients. Between 2004 and 2012, the enrollee population shifted towards larger risk-bearing organizations, many of them IPAs.31 For example, in 2004, there were 13 HMO-accepting physician organizations with over 1,000 physicians, caring for slightly under 8 million Californians. By 2012, there were more than twice as many, and they cared for more than 10 million Californians (see Figures A2 and A3 in Appendix I).
The prevalence of HMOs and large physician organizations has put California at the forefront of initiatives to encourage higher-quality healthcare. For example, the California Pay for Performance (P4P) Program is the largest non-governmental physician incentive program in the United States. It measures dozens of indicators involving approximately 35,000 physicians in over 200 groups on behalf of eight health plans representing 10 million people. This year, the program is making a significant shift towards a shared savings model, in which payments will be based on a combination of quality and efficiency.32
The California delivery system is also characterized by large hospitals and health systems that provide a network of integrated care. Relative to the rest of the United States, California hospitals are more likely to be part of a larger health system and have a greater number of hospital beds, ICU beds and admissions per bed (see Table A1 in Appendix I).33 ACOs are more likely to be successful in a delivery system such as California’s, which is characterized by large, multispecialty medical groups, formal or informal partnerships with hospitals, established physician leadership and experience with payment methods other than the traditional fee-for-service approach.34
It is estimated that 623,700 Californians are currently served by one of 41 operational ACOs, as tracked by Cattaneo & Stroud Inc. As of January, 2013, Los Angeles County’s 16 ACOs covered approximately 213,000 patients, followed by Orange County’s 11 ACOs covering 94,600. Enrollment in California ACOs varies from as few as 500 patients to as many as 68,000 (the Heritage Provider Network’s Pioneer ACO) with an average of 15,200 (see Table A2 and Figure A4 in Appendix I, for more information on California ACOs).35
Many see ACOs as a way to extend HMO principles to the state’s non-HMO population, which represents slightly
more than half of all Californians. If complementary accountable care models proliferate in the state, millions of other Californians served by physicians and health systems affiliated with an ACO may benefit from the “spillover” of new care practices developed for the ACO population. Some question whether ACOs are a step backwards for those covered under HMO plans, as the reimbursement landscape in California has for decades included capitation, shared risk pools and pay for performance quality incentive programs.36 However, even within the delegated model, many risk agreements with providers do not include all healthcare services. As a result, some recent commercial ACOs are combining traditional HMO payment models like capitation with both quality measures and shared risk pools based on total expenditures for an individual.
31 Cattaneo & Stroud Inc. (2012a). This data source only includes organizations that have six or more primary care physicians and at least one HMO contract. 32 Yanagihara (2012).33 Health systems are defined by the American Hospital Assoication (2011) as either “a multi-hospital or a diversified single hospital system. A multi-hospital system is two or more hospitals owned, leased, sponsored, or contract managed by a central organization. Single, freestanding hospitals may be categorized as a system by combining three or more, and at least 25%, of their owned or leased non-hospital pre-acute or post-acute health care organizations.”34 Crosson (2011).35 Cattaneo & Stroud Inc. (2013).36 Frohlich, et al. (2011).
FIGURE 2: PERCENT OF PHYSICIANS PRACTICING IN MEDICAL GROUPS OF MORE THAN 25 PHYSICIANS IN CALIFORNIA, BY COUNTY, 2011
Notes: Medical groups can span multiple counties and size is defined by number of physicians under a common ownership structure, rather than number of physicians in a particular office location. NA: not available.SOURCE: Berkeley Forum analysis using IMS Health Incorporated (2010).
1 - 20%
>20 - 40%
>40 - 60%
>60 - 100%
NA
16 Berkeley Forum | F E BRUA RY 201 3
C. California’s current performance compared to the Forum VisionCalifornia has a long history of HMOs with risk-based payments and integrated care, facts often cited as major reasons for the state’s lower-than-average healthcare utilization. For example, in 2010, California’s rates of hospital admissions and inpatient days were 79% and 74%, respectively, those of the rest of the U.S.37
We explored whether some of the lower hospital utilization may be explained by California having relatively higher rates of uninsured38,39 and a younger population,40 as well as larger Asian and Latino populations, all groups that tend to have lower healthcare utilization.41 To account for demographic and health differences between California and the rest of the United States, we used the 2005-2009 Medical Expenditure Panel Survey—Household Component (MEPS-HC) to compare utilization between California and the rest of the United States, controlling for gender, age, race/ethnicity, income, insurance status, number of key medical conditions and body mass index.42 Table 1 shows that California’s adjusted utilization is still significantly lower than the rest of the country. Specifically, Californians’ rate of inpatient discharges and inpatient days were only 76% and 83%, respectively, of the rest of the country. This provides evidence that California healthcare system characteristics, including greater use of risk-based payments and integrated care than other parts of the country, may contribute to lower utilization in the state. Our findings
are consistent with those of earlier research, such as a 1996 study showing that areas of California with the highest HMO penetration were able to reduce hospital utilization over a 10-year period by 44%, compared to just 29% for the areas with the lowest HMO penetration.43 Similarly, a 1995 study showed that capitated California medical groups demonstrated lower hospital admissions and lengths of stay for non-Medicare patients, with such groups reporting average annual hospital days of 134 per thousand HMO enrollees, compared to an average U.S. rate of 297 per thousand HMO enrollees.44
Further evidence for the ability of risk-based payments and integrated care to reduce utilization comes from Medicare beneficiaries. A California study found risk-adjusted rates of inpatient days were 30% lower for Medicare Advantage patients than for fee-for-service Medicare patients.45 More broadly in the United States, a nationwide comparison of Medicare Advantage and fee-for-service Medicare patients from 2003-2009, which used a study design that matched patients based on factors including age, sex, race and health status, still found 20-30% lower utilization of services such as the emergency department and ambulatory surgery for Medicare Advantage patients.46
These results are consistent with a California Association of Physician Groups’ (CAPG) report that shows Medicare Advantage patients in California averaged 69% of the number of hospital days of Medicare fee-for-service patients (1,174 vs. 1,706 hospital days per thousand
37 Berkeley Forum analysis using Kaiser Family Foundation (2010).38 California Healthline (2012).39 Hadley, et al. (2008).40 U.S. Census Bureau (2009).41 Agency for Healthcare Research and Quality (2011).42 All analyses involving the Medical Expenditure Panel Survey in this report were conducted while Christopher Whaley and Brent Fulton were Special Sworn Status researchers of the U.S. Census Bureau at the Center for Economic Studies. Research results and conclusions expressed are those of the co-authors and do not necessarily reflect the views of the Census Bureau. These results have been screened to insure that no confidential data are revealed.43 Robinson (1996).44 Robinson (1996).45 America’s Health Insurance Plans, Center for Policy & Research (2009).46 Landon, et al. (2012).
TABLE 1: HEALTHCARE UTILIZATION IN CALIFORNIA VS. REST OF THE U.S., 2005 – 2009
Healthcare Service Incidence Rate Ratio: California vs. Rest of the U.S. Standard Error
Number of inpatient discharges 0.76*** 0.04
Number of inpatient days 0.83* 0.07
Number of emergency room visits 0.78*** 0.03
Number office-based physician visits 0.91*** 0.02
Notes: Results are based on negative-binomial regression models, which control for gender, age, race/ethnicity, income, insurance status, number of key medical conditions and body mass index. The sample size for each model was 155,776. Asterisks indicate the significance level of the incidence rate ratio as compared to one: *p<0.05 and ***p<0.001. SOURCE: Berkeley Forum analysis using MEPS-Household Component, 2005-2009.
A New Vision for California’s Healthcare System 17
enrollees, respectively).47 Furthermore, CAPG “elite group” Medicare patients in California averaged fewer than 800 days per thousand enrollees in 2009.48 The CAPG “elite groups” are large multi-specialty medical groups that score highest in four quality domains measured by CAPG: care management processes, health information technology, transparency and patient-centered care. Many “elite groups” have assumed institutional risk in addition to professional services risk. The CAPG report did not control for demographic and health status differences between Medicare Advantage and fee-for-service Medicare beneficiaries; however, its results are consistent with the California and nationwide Medicare Advantage studies discussed above, which did control for such factors.
Evidence of the ability of integrated systems to reduce costs is rapidly emerging. Although there are various systems across the United States that have attained high levels of integration (e.g. Geisinger Health System, Kaiser Permanente and Intermountain Healthcare) data about these organizations’ costs are mostly proprietary, and comparisons are difficult because of selection bias and varying risk profiles.49 Similarly, ACOs are in a relatively early stage of adoption across the United States, and thus broad evidence is not yet available. Nonetheless, support for the Forum Vision can be found in various studies of care systems that share characteristics of early ACO adopters. For example, one recent study found that Medicare beneficiaries treated by physicians in large multi-specialty practices (many of which were integrated with hospitals or health plans) received between 5% and 15% better quality of care, and had healthcare expenditures that were $272 (3.6%) per year lower, than a comparison group treated under fee-for-service Medicare.50 Similar efficiencies have been found in studies of provider groups that handle most aspects of patient care and that take on financial risk for improving care and lowering expenditures. An evaluation of the Medicare Physician Group Practice Demonstration, the predecessor to the current Medicare Shared Savings program, showed a cost savings of $114 per beneficiary, or 1.4%, for those receiving care from physicians participating in the demonstration project.51 Even greater savings of $500 per-member per-year were achieved for the dual-eligible population. In California, a Milliman evaluation of the CalPERS Accountable Care Organization offered by
Blue Shield of California with its partners Dignity Health and Hill Physicians showed an average annual reduction in expenditures of 7.3% for the two-year study period.52 As the results from similar projects continue to be evaluated, we expect additional evidence to emerge.
Several studies53 have pointed to the ability of integrated delivery systems to meet the main criteria identified in the groundbreaking Institute of Medicine report Crossing the Quality Chasm,54 including evidence-based care processes; effective use of information technology; coordination of care across patient conditions, services and settings; and use of performance measurement for accountability.
Figure 3 (on the following page) shows a Forum analysis of the current state of payment methods and integration in California’s healthcare system, based on estimates and assumptions regarding HMO penetration, capitation arrangements, medical group size and “virtually integrated” IPA physician participation rates.
As shown in Figure 3, despite a high HMO penetration in California and the prevalence of risk-based payments, the vast majority of medical services in the state are still paid for on a fee-for-service basis. Overall, we estimate that approximately $245 billion, or 78% of California’s estimated $313 billion healthcare expenditures in 2012, came through fee-for-service arrangements. Approximately 16.6 million of 38 million Californians (44%) are covered under a contract that includes at least partial risk-based payment, including 8.1 million (21%) under full or dual risk (which includes physician and hospital services). Partial risk payments through non-Kaiser Health Maintenance Organizations (HMOs), however, generally only capitate physician services. Therefore, the vast majority of healthcare services, such as hospitalizations, mental health care and prescription medications, are paid via fee-for-service reimbursement, even for HMO patients. It is important to note, however, that physicians with partial-risk contracts have some incentive to manage hospitalizations for their HMO populations, even though the hospital payment is considered fee-for-service. These incentives stem from health plans and physician organizations layering on top of capitation certain performance measures that financially reward providers based on the hospital utilization patterns of their patients.55
Figure 3 also shows that California has a significant portion of its population receiving care through either fully-integrated delivery systems or highly-integrated systems (defined as a medical group with more than 100 physicians). About 11.1 million Californians (29%), virtually all of whom are publicly or privately insured, receive care from such systems. However, an estimated 17.4 million Californians (46%) still receive their care from low-integration systems, which tend to include small practices mostly unaffiliated with IPAs. Approximately
47 Sanofi Managed Care Digest (2012).48 California Association of Physician Groups (2012).49 One study that was able to overcome some of these limitations was the RAND Health Insurance Experiment, which showed that individuals randomly assigned to an HMO plan had 28% lower expenditures than those assigned to a fee-for-service plan. For a discussion of these results see Newhouse (1993).50 Weeks, et al. (2010).51 Colla, et al. (2012).52 Markovich (2012).53 Casalino, et al. (2003); Shortell, et al. (2004); and Crosson (2005).54 Institute of Medicine (March 2001).55 Rosenthal, et al. (2001).
18 Berkeley Forum | F E BRUA RY 201 3
7.3 million of these 17.4 million are uninsured, whose care in safety-net settings is often haphazard and uncoordinated. An additional 9.2 million Californians (24%) generally receive care from moderately-integrated care systems, which represent mostly mid-sized medical groups or practices affiliated with IPAs. Although IPAs often exhibit a level of clinical and financial alignment comparable to large medical groups, in this analysis, we consider them to be moderately-integrated. This is because it is common for physicians to belong to multiple IPAs. Thus, the scope and impact of an IPA’s care management practices and financial incentives may be weakened relative to those of large medical groups.
California is well-positioned to shift towards a more coordinated, cost-effective healthcare system given its high rate of HMO enrollment and its highly organized medical groups and health systems. Nonetheless, we have a long way to go before the Forum Vision is fully realized, particularly in transitioning Californians out of low-integration settings and shifting healthcare expenditures away from the fee-for-service model.
The Forum Vision was informed by the unique history of HMOs and the delegated model in California, including the tumultuous 1990s, a period of provider bankruptcies and anti-HMO consumer backlash. But the Forum does not fear a repeat of those events, for several reasons. First, the regulatory structure has since evolved to better ensure that consumers are protected and medical groups and health plans are monitored for solvency. Second, new models of integrated care and risk-based payment, such as ACOs, evaluate using criteria that reward quality as well as cost control.56 For example, the Medicare Shared Savings Program has 33 quality measures that determine payments to providers.57 An increasing culture of transparency, in which consumers have access to information on care quality, is also a key component of many integrated care models. Our final reason for optimism about the successful implementation of the Forum Vision is the 20-plus years of experience that California’s providers and health plans have had in managing population health and risk-based payments.
56 For more background on ACOs, see Singer, et al. (2011) and Bowers, et al. (2011).57 Centers for Medicare & Medicaid Services (2012).
0%
10%
20%
30%
40%
50%
60%
70%
80%
90%
100%
8.1
17.4
8.5 9.2
21.1
4.5
6.6
Fee-for-service
Payment type
Partial risk
Full / dual risk
$47.7
$20.6
$245.0
Payment type1,2 ($,billions)
Payment type2 (Lives, millions)
Integration level3 (Lives, millions)
High
Low
Integration level
Moderate
Full
Notes: 1) Expenditure estimates are reported in 2012 dollars. 2) Full / dual risk refers to a payment arrangement in which providers accept risk for both professional services and hospital services. Partial risk refers to a payment arrangement in which providers accept professional services risk only. 3) There are various factors that are relevant in assessing care integration; for the purposes of this analysis, we estimate lives by integration level based on medical group size in California given that size has been shown to be associated with use of more integrated care processes. Only Kaiser Permanente physicians are considered to be fully-integrated. Medical groups of greater than 100 physicians are considered highly-integrated, while Independent Practice Associations (IPAs) are considered moderately-integrated. Lives receiving care from medical groups with 100 or fewer physicians are allocated into either moderate or low integration based on both medical group size and a physician’s likelihood of being in an IPA.SOURCE: Berkeley Forum analysis. See Appendix II: “California’s Delivery System Integration and Payment System (Methodology)” for more detail on methodology, assumptions and sources.
FIGURE 3: BREAKDOWN OF PAYMENT MECHANISMS AND DELIVERY SYSTEM INTEGRATION IN CALIFORNIA, BY LIVES AND DOLLARS, 2012
A New Vision for California’s Healthcare System 19
A paramount cause for concern, in both California and the entire United States, is the growing obesity epidemic. Between 1995 and 2010, obesity rates in California rose nearly 70%, from 14.6% to 24.7%, according to the Behavioral Risk Factor Surveillance System (see Table 2 on the following page).65 Without significant changes, 46.6% of Californians are expected to be obese by 2030, according to a recent study by Trust for America’s Health.66,67 Obese children and adolescents face double the risk for mortality before the age of 55 when compared to their non-obese counterparts.68 There is a high correlation between obesity and low physical activity rates and a host of diseases, including type 2 diabetes, coronary heart disease and stroke, hypertension, arthritis, and cancers of the breast, kidney and colon. The picture is not entirely bleak; California experienced a slight increase in physical activity rates between 2001 and 2009. Still, almost half of Californians do not attain the minimum physical activity levels recommended for good health.69
Table 2 shows growing rates of other chronic conditions that parallel the rise in obesity among Californians. Diabetes, hypertension and high cholesterol among adults increased 69%, 16% and 30%, respectively, between the mid-1990s and 2009-2010.
Another challenge for the California healthcare system involves health disparities among different socioeconomic and geographic populations. There are a number of factors associated with poor health, including lower income levels, lack of health insurance and membership in a minority group.
Almost nine million Californians, or 23.5% of the state’s population, live in poverty as assessed by the Census Bureau’s newly developed Supplemental Poverty Measure (SPM), which includes factors such as government benefits and cost of living. This is the highest in the country, and much higher than the average U.S. rate of 15.8%.70,71 Fully 35% of low-income California adults report being in poor or fair health, compared to just 14% of the more affluent.72
SEC TION IV
California’s Healthcare System Performance with Regards to Health Status, Health Disparities and Care QualityThe preceding section provided evidence that relative to other states, California’s healthcare system encourages more integration and accountability. We now examine how the California system performs with regards to health status, health disparities and care quality. The good news is that Californians on average tend to be healthier than other Americans, with higher life expectancy,58 lower rates of smoking and lower rates of colorectal and breast cancer deaths.59
Nonetheless, California has significant room for improvement in both health and healthcare, whether by its own historical standards or in comparison to top-performing states or health plans. One indication that progress still needs to be made comes from the fact that significantly greater numbers of Californians currently consider themselves to be in poor or fair health: 18.1% in 2010 compared to 15.5% in 1996.60 Among the health-related statistics that clearly need improvement are high uninsured rates, growing rates of chronic disease and obesity and persistent health disparities. A recent review of quality of care metrics paints a mixed picture, with some areas improving but others worsening. Last December’s “Let’s Get Healthy California”61 report provides a more thorough analysis of these issues.
According to the U.S. Census Bureau, California had the ninth-highest uninsured rate in the country in 2010.62 A 2009 study showed that one in five non-elderly Californians was uninsured, greatly reducing their ability to access care.63 Approximately two in five uninsured California children, and half of uninsured adults, reported not seeing a healthcare provider in the past year, about four times the rates of their counterparts with employer-based insurance. Approximately half of uninsured California adults report having no usual source of care, more than five times the rate for adults with employer-based insurance.64
58 Kaiser Family Foundation (2012).59 Commonwealth Fund (2009).60 Behavioral Risk Factor Surveillance System (2012).61 California Health and Human Services Agency (2012).62 California Healthline (2012).63 Lavarreda, et al. (2012).64 California Health Interview Survey (2009).65 Behavioral Risk Factor Surveillance System (2012). 66 Levi, et al. (2012).67 Though not directly comparable to this California estimate, a recent study looks at evidence that prevalence of obesity in the United States has leveled off. In contrast to linear time trend forecasts that indicate 51% of the U.S. population will be overweight in 2030, Finkelstein, et al. (2012) estimates that about 42% of the U.S. population will be obese in 2030.68 Franks, et al. (2010).69 Behavioral Risk Factor Surveillance System (2011).70 Short (2012).71 Using the Census Bureau’s traditional poverty measure, California’s rate is 16.3% vs. the U.S.’s rate of 15.0%. 72 California Health Interview Survey (2009).
20 Berkeley Forum | F E BRUA RY 201 3
Health disparities among California’s racial and ethnic groups are well-documented.73 At 21.1%, African-Americans are more likely to report poor or fair health status, compared to 11.7% of Caucasians.74 African-Americans have almost twice the rates of mortality amenable to healthcare as non-African-American Californians, at 175 vs. 96 deaths, respectively, per 100,000 people.75 In 2009, 10.6% and 12.9% of California’s Latino and African-American population, respectively, reported having been diagnosed with diabetes, compared to the 6.3% rate among non-Latino whites.76 Between 1999 and 2007, California’s Office of Statewide Health Planning and Development (OSPHD) evaluated 16 indicators among ambulatory-sensitive care conditions, such as bacterial pneumonia, diabetes-related amputations and adult asthma.77 The analysis showed lower age- and gender-adjusted performance for African-American patients in 14 out of 16 indicators—often two or three times worse than for Caucasians. There appears to be some improvement in this area, however, as OSPHD data revealed a decrease in disparities for 10 indicators for African-Americans, and for thirteen indicators for Latinos, during the study period. According to the Agency for Healthcare Research and Quality, some factors that contribute to these persistent disparities include environment or lifestyle issues, poor access to or a low quality of outpatient care and higher predisposition for diseases.78
Finally, California has room for improvement in terms of care quality. California ranks 29th among the 50 states in overall healthcare quality, according to the 2011 AHRQ National Healthcare Quality Report, which measured performance in such areas as preventive care, acute and chronic care quality, and patient experience (see Table A3 in Appendix I).79 Much of California’s population with chronic conditions could benefit from better care management. The Right Care Initiative’s analysis of select Healthcare Effectiveness Data and Information Set (HEDIS) measures, a tool used widely by health plans, found that Kaiser and Sharp health plans were the only California insurers to regularly reach the national 90th percentile mark in such indicators as adequate screening and management of hypertension, diabetes and cholesterol.80 An OSHPD analysis of ambulatory- care sensitive conditions between 2005 and 2009 showed mixed results.81 There was an improvement in six conditions, including dehydration, but declines in four others, including hypertension. But there was sobering news from a study that extrapolated from U.S.
73 Agency for Healthcare Research and Quality (2011).74 Lavarreda, et al. (2012).75 Commonwealth Fund (2009).76 California Health Interview Survey (2009).77 Tran, et al. (2010).78 Agency for Healthcare Research and Quality (2011).79 Ibid.80 California Department of Managed Health Care (2012). 81 California Office of Statewide Health Planning and Development (2012).
TABLE 2: HEALTH STATUS, CHRONIC CONDITIONS AND LIFESTYLE FACTORS OVER TIME FOR CALIFORNIA ADULTS, 1995 – 2010
Notes: Asterisks indicate no overlap in the 95% confidence intervals between the year shown and the benchmark year. The Behavioral Risk Factor Surveillance System (BRFSS) adjusts data for population characteristics such as gender and ethnicity, but does not control for confounding factors or conditions. 1) Most BRFSS data is collected once every two years, in either even or odd years. Where data are available for both years (e.g. both 1995 and 1996), the latter year data is used. Intervals between comparison years vary, as they were selected to provide the longest time range to observe trends. 2) The diabetes category does not include pregnancy-related or pre-diabetes cases. SOURCE: Berkeley Forum analysis using Centers for Disease Control and Prevention (1995 – 2010).
Fair or poor health 15.5% 16.0% 17.6% 18.1%* 16.8%
Obese 14.6% 21.9%* 22.7%* 24.7%* 69.2%
Overweight or obese 50.9% 59.4%* 60.6%* 61.6%* 21.0%
Diabetes2 5.1% 6.5% 7.1% 8.6%* 68.6%
Hypertension 22.1% 23.3% 25.7%* 25.7%* 16.3%
High cholesterol 28.0% 31.7% 35.2%* 36.5%* 30.4%
Current asthma NA 7.2% 7.2% 7.7% 6.9%
A New Vision for California’s Healthcare System 21
SEC TION V
The Affordability Crisis: An Examination of California’s Healthcare Expenditures and Insurance PremiumsIn the previous section, we examined the performance of the California healthcare system with regards to coverage, health status, disparities and quality. We now move on to discussing its financial sustainability. We first assess how healthcare expenditures in California compare to those in the United States as a whole. We then analyze the high concentration of healthcare expenditures in the state. We estimate the growing share of California’s Gross State Product that is being devoted to healthcare, and the alarming growth projected for employer-sponsored health insurance premiums over the coming ten years. We conclude by discussing how healthcare spending will become increasingly unaffordable for families, employers and the government.
A. Assessing California’s healthcare expendituresIn 2009, California ranked ninth lowest among U.S. states in personal healthcare expenditures per capita, at $6,238 versus the U.S. average of $6,891.85 Moreover, California has a lower healthcare utilization rate than the U.S. average, for some of the reasons discussed in Section IIIC above, “California’s current performance compared to the Forum Vision.”86
In contrast to its lower relative utilization, California has high unit costs compared to the rest of the country. For example, an adjusted inpatient overnight stay cost 30% more in California in 2010 than the U.S. average, $2,566 vs. $1,910.87 There are several reasons for this. First,
85 Centers for Medicare & Medicaid Services (2009) and Cuckler, et al. (2011); CMS releases state-level data on personal healthcare expenditures, rather than total healthcare expenditures (which also include the net cost of private health insurance, government healthcare administration costs, government public health activities and healthcare investments). As a point of comparison, at the national level in 2009, personal healthcare expenditures per capita were $6,891, or 84% of the $8,163 in total healthcare expenditures per capita. 86 Also see Appendix XII: “Assessing California’s Healthcare Spending (Brief)” for more background on healthcare utilization and unit costs in California.87 Kaiser Family Foundation (2012). The adjustment is described by KFF as: “Adjusted expenses per inpatient day include expenses incurred for both inpatient and outpatient care; inpatient days are adjusted higher to reflect an estimate of the volume of outpatient services.”
data to estimate healthcare-associated infections: Each year, about one in 20 hospitalized Californians develops a healthcare-associated infection, resulting in 12,000 deaths.82
The Berkeley Forum analyzed the implementation of six evidence-based Care Management Practices (CMP), such as use of patient disease registries and point of care reminders, for four chronic diseases in large medical groups in California compared with the rest of the United States (see Table A4 in Appendix I).83 Patient-centered medical homes, which have generally been shown to reduce admissions and emergency department visits, often use a combination of CMPs. In four84 of the six CMPs compared, medical groups in California and those in the rest of the United States generally demonstrated similar frequency of CMP availability. California performs significantly better, however, with regards to employing patient registries and nurse care managers for diabetes, asthma and congestive heart failure. Overall, large California medical groups employ more CMPs than similarly sized groups in the rest of the United States with regards to these three conditions. Depression was the only condition in which California performed similarly to the rest of the U.S. average for all six CMPs. Overall, however, there is still room for significant improvement, as a mere 4.1% of large medical groups in California, and 3.4% of those in the rest of the country, use all six evidence-based Care Management Practices in all four key chronic diseases.
In summary, it is these challenges—a large population of uninsured residents; the growing burden from obesity and other chronic diseases; the continuing disparities among socio-economic groups; and the persistent problems with care quality—that prompted the Berkeley Forum to recommend the fundamental changes to California’s healthcare system outlined in the Forum Vision.
82 California Department of Public Health (2009-2010).83 Rittenhouse, et al. (2010); Shortell (2011).84 These four CMPs are: 1) provide patient educators, 2) physician feedback on quality, 3) patient reminders and 4) point-of-care reminders.
22 Berkeley Forum | F E BRUA RY 201 3
because the California system emphasizes the use of lower-cost settings whenever possible, those patients actually admitted to full-service hospitals are likely to have more acute conditions that are more expensive to treat. Second, California is expensive overall; the Berkeley Forum estimates the state’s cost of living may be about 20% to 30% higher than the national average.88 An important element of this high unit cost is the relatively low supply and high wages associated with the non-physician workforce.89 For example, registered nurses on average earn more in California than they do in any other state, with wages about 36% higher than in the rest of the country.90 Finally, California hospital costs may also be higher because of regulations unique to the state, such as robust seismic building codes and the mandatory minimum nurse-to-patient staffing ratio.
Healthcare costs are the major determinant of California’s employer-sponsored health insurance premiums. But other factors drive premiums as well, such as the cost-shifting that results from uninsured patients and low Medi-Cal reimbursement, as well as the presence of large provider groups with strong negotiating leverage. California’s higher HMO penetration, along with some of the most generous insurance mandates in the country, may result in richer benefit packages but subsequently higher premiums (for more information on the factors affecting healthcare spending in California, see Appendix XII: “Assessing California’s Healthcare Spending (Brief)”).
While these factors help explain the current level of healthcare spending in California, it is medical technology, or new or broader applications of treatments, that is principally responsible for the continuous growth in expenditures. Several studies have concluded that around half of all such growth can be tied to medical technology.91 Recently, one study estimated that medical technology accounted for 27-48% of the growth in healthcare spending per capita from 1960-2007.92 Other key factors included income growth (29-43%) and higher medical prices (5-19%). Changes in coverage expansion and benefit design, administrative costs and population aging also affected growth, albeit less so than the other factors. Some of these elements are inter-related; for example, higher incomes coupled with more expansive insurance coverage helps to fuel medical technology growth.
B. California’s 5/50 populationA major opportunity for reducing overall healthcare expenditures lies in lowering the spending attributable to the most expensive individuals. A Berkeley Forum analysis of the concentration of healthcare expenditures using the 2009 Medical Expenditure Panel Survey—Household Component (MEPS-HC) revealed that 5% of Californians accounted for 53% of the state’s healthcare expenditures, with expenditures 10.7 times those of the average Californian. This concentration of healthcare
88 Berkeley Forum analysis using U.S. Census Bureau (2011) and U.S. Census Bureau (2012).89 See Appendix XII: “Assessing California’s Healthcare Spending (Brief)” for sources and additional data on nurse practitioner and physician assistant wages and supply.90 U.S. Bureau of Labor Statistics (2011).91 Newhouse (1992); Cutler (1995); Smith, et al. (2000).92 Smith, et al. (2009).93 Zuvekas, et al. (2007).94 California Department of Healthcare Services (2012).95 Ibid.96 Ibid.
expenditures is similar to that of the country as a whole.93 The top 25% spent 3.6 times the average, and accounted for 89% of California’s healthcare expenditures (see Figure A5 in Appendix I).
There are certain characteristics among this top 5% cohort (see Table A5 in Appendix I). Women and individuals older than 50 represent about three-fifths of the group. About half is privately insured, one-quarter is in Medicare and one-tenth are Medicare and Medicaid dual-eligibles. About one-third of the top spenders are obese, and many have chronic conditions, including high blood pressure (56%), heart disease (28%), high cholesterol (46%), diabetes (21%), joint pain (41%) and arthritis (48%). All of the above characteristics (except for being privately insured) are significantly more common among those in the top 5% than those in the bottom 95% of spenders. For example, there is a statistically significant prevalence ratio (2.0) of obese people in the top 5% vs. in the bottom 95%.
Another striking characteristic of top healthcare spenders is the likelihood of their remaining high spenders year after year, as shown in Figure 4. Of the top 5% of spenders in 2008, 34% remained in the top 5% the following year, and 71% were in the top 20%. In contrast, among the bottom 50% of spenders in 2008, only 1% transitioned to the top 5% in 2009, while three-quarters remained below the median. A similar analysis of the top 20% of spenders in 2008 revealed that 59% remained in the top 20% in the following year. This tendency of high spenders to persist as such across multiple years is much the same in the rest of the United States.
The California Department of Health Care Services recently analyzed the spending of 3.1 million fee-for-service Medi-Cal beneficiaries between 2005 and 2010, and found that the top 5% accounted for 66% of total Medi-Cal fee-for-service expenditures.94 Part of that high concentration is due to the complex challenges faced by this population. For example, blind and disabled beneficiaries account for 15% of the total studied population, but 63% of the top 5% cohort.95 Of note, long-term care beneficiaries only accounted for 3% of the top 5% cohort.96 Of the top spenders in 2005 who were still enrolled in Medi-Cal fee-for-service the following year, 56% remained in the top 5%. Five years later in 2010, 45% of the enrolled top-spending beneficiaries from 2005 still remained in the top 5% (see Figure A6 in Appendix I). This high persistence is likely partly the result of the blind and disabled, with their increased healthcare needs, accounting for a large share of the top 5% cohort.
A New Vision for California’s Healthcare System 23
Healthcare expenditures per capita Annual growth rate
$8,251
$13,755
$4,353
$7,509
FIGURE 4: HEALTHCARE EXPENDITURE PERCENTILE COHORT TRANSITIONS BETWEEN 2008 AND 2009 IN CALIFORNIA
Notes: Results account for the MEPS-Household Component complex survey design using California state-based weights.SOURCE: Berkeley Forum analysis using MEPS-Houshold Component, 2008 and 2009.
FIGURE 5: HISTORICAL (2000 – 2009) AND PROJECTED (2010 – 2022) HEALTHCARE EXPENDITURES PER CAPITA AND ANNUAL GROWTH RATE IN CALIFORNIA
Notes: The reported expenditures are total healthcare expenditures per capita. CMS releases state-level data on personal healthcare expenditures, which we adjusted upward to reflect total healthcare expenditures per capita. Healthcare expenditures per capita are reported in current-year dollars.97 SOURCE: Berkeley Forum analysis. See Appendix III: “California Cost Curve, Healthcare Expenditures and Premium Projections (Methodology)” for sources and additional detail.
97 Note that the term “current-year dollars” throughout the report is equivalent to current or nominal dollars.
C. The growing healthcare Cost CurveThe overwhelmingly high concentration of healthcare expenditures is a cause of concern. However, it’s the high growth in average per capita healthcare expenditure that provides the greatest impetus for the fundamental changes called for by the Forum Vision. After growing at the relatively low average annual rate of 3.7% in nominal terms between 1991 and 2000, the average annual growth rate between 2000 and 2003 spiked to 8.2% (see Figure 5). Between 2000 and 2009, per capita healthcare expenditures in the state grew at an average annual rate of 6.3%, from $4,353 to $7,509. The annual per capita growth rate began decreasing near the end of the decade, falling to 2.5% in 2009, largely due to the 2008-2009 recession.98
Figure 5 also shows projected per capita healthcare expenditures in current-year dollars and growth rates through 2022. Based on historical tracking between the United States and California, we applied the Centers for Medicare & Medicaid Services (CMS) national projected
per capita healthcare expenditures growth rates to the state, with certain modifications. For example, we independently estimated the impact of the Affordable Care Act (ACA) coverage expansion on California to arrive at projections for 2014 (see Appendix III “California Cost Curve, Healthcare Expenditures and Premium Projections (Methodology)”). The figure shows that per capita healthcare expenditures in California are expected to grow to $13,755 in 2022, representing an average annual growth rate of 5.2% between 2012 and 2022.99 Due to the ACA coverage expansion in 2014, we project a 6.1%100 increase in per capita healthcare expenditures that year, followed by annual growth rates between 4.7% and 5.8% through 2022.101 Aggregate healthcare expenditures in the state are expected to reach $572 billion in 2022, and total $4.4 trillion between 2013 and 2022.102
To benchmark healthcare expenditures, we examined the Cost Curve, which shows California’s healthcare expenditures as a percent of Gross State Product (GSP). Figure 6 shows that the Cost Curve grew from 11.2% to 15.1% between 2000 and 2009.103 In the early and late
FIGURE 6: CALIFORNIA’S COST CURVE: HISTORICAL (2000 – 2009) AND PROJECTED (2010 – 2022) HEALTHCARE EXPENDITURES AS A PERCENT OF GROSS STATE PRODUCT
SOURCE: Berkeley Forum analysis. See Appendix III: “California Cost Curve, Healthcare Expenditures and Premium Projections (Methodology)” for sources and additional detail.
98 Martin, et al. (2012).99 For reference, in 2022, healthcare expenditures per capita are projected to be $10,856 in 2012 dollars, representing a real average annual growth rate of 2.8% between 2012 and 2022.100 For reference, the 2014 growth rate in per capita healthcare expenditures is 3.6% in constant 2012 dollars.101 There are several reasons why per capita healthcare expenditures do not grow as much as may be anticipated in connection with ACA coverage expansion. Some of these include: 1) the uninsured already have some existing healthcare expenditures prior to coverage expansion, 2) A Berkeley Forum analysis using Cal-Sim (2012) projections indicates that the newly insured are expected to represent only about 5.5% of the state’s under-65 population in 2014, and 3) Medi-Cal, which has below-average per capita healthcare expenditures, partly due to relatively lower reimbursement rates, will cover many of the state’s newly insured.102 For reference, aggregate healthcare expenditures are estimated to total $452 billion in 2022 and $3.8 trillion for the period between 2013 and 2022, in constant 2012 dollars. 103 The share of California’s GSP represented by healthcare expenditures is less than the share of the United States’ gross domestic product (GDP) represented by healthcare expenditures, which was 17.9% in 2009.
A New Vision for California’s Healthcare System 25
1999 2000
2001 2002
2003 2004
2005 2006
2007 2008
2009 2010
2011
$5,496
$15,720
$5,736
$15,072
$0
$3,000
$6,000
$9,000
$12,000
$15,000
$18,000
CA US
$2,052
$5,976
$2,268
$5,424
$0
$1,000
$2,000
$3,000
$4,000
$5,000
$6,000
$7,000
1999
2000 2001
2002 2003
2004 2005 2006
2007 2008
2009 2010
2011
CA US
16.1%
23.8%
32.2%
9.3%
13.5%
18.2%
0%
5%
10%
15%
20%
25%
30%
35%
2005 2007 2009 2011 2013 2015 2017 2019 2021
ProjectedHistorical Family Single
FIGURE 8: TOTAL EMPLOYER-SPONSORED HEALTH INSURANCE PREMIUMS FOR FAMILY COVERAGE IN CALIFORNIA AND THE UNITED STATES, 1999 – 2011
FIGURE 7: TOTAL EMPLOYER-SPONSORED HEALTH INSURANCE PREMIUMS FOR SINGLE COVERAGE IN CALIFORNIA AND THE UNITED STATES, 1999 – 2011
Notes: Premiums include both employer and employee contributions. Premiums are reported in current-year dollars.SOURCE: Kaiser Family Foundation Employer Survey 1999-2003 and California HealthCare Foundation Employer Benefits Survey 2004-2011.
FIGURE 9: HISTORICAL (2005 – 2011) AND PROJECTED (2012 – 2022) EMPLOYER-SPONSORED HEALTH INSURANCE PREMIUMS FOR SINGLE AND FAMILY COVERAGE AS A PERCENT OF MEDIAN HOUSEHOLD INCOME IN CALIFORNIA
Notes: Premiums include both employer and employee contributions.SOURCE: Berkeley Forum analysis. See Appendix III “Methodology: California Cost Curve, Healthcare Expenditures, and Premium Projections” for sources and more detail.
26 Berkeley Forum | F E BRUA RY 201 3
part of the decade, the Cost Curve grew rapidly, with healthcare expenditure growth outpacing GSP growth by an annual average rate of almost 6 percentage points. In contrast, the Cost Curve was relatively flat in the middle of the decade, a brief period during which economic growth stayed on pace with the rise in healthcare expenditures.
Figure 6 also shows the projected change in the Cost Curve over the coming ten years.104 Based on these estimates, healthcare expenditures are projected to increase from 15.4% to 17.1% of GSP between 2012 and 2022. During this period, aggregate healthcare expenditures are forecast to grow 6.2%105 annually, or about 1.1 percentage points more than the 5.1% annual aggregate GSP growth rate.106
D. The growing burden of health insurance premiums The impact of growing healthcare expenditures is directly felt by employees and employers in the employer-sponsored insurance (ESI) market through higher premiums. In the 2010 – 2011 period, approximately 45% of Californians received healthcare coverage via employer-sponsored insurance.107 Californians have historically enjoyed slightly lower premiums in the ESI market as compared to the United States, even though California has a higher cost of living.108 In recent years, however, California premiums began to increase faster than those in the United States overall (see Figures 7 and 8). Total premiums (meaning both employer and employee contributions) for both single and family coverage via ESI in California have increased just over 9% on average annually in nominal terms since 1999, and, unadjusted for cost of living, surpassed the U.S. level in 2006.
Although not paid for directly by individuals, the employer contribution to premiums is important in assessing overall affordability, because an increase in employer contributions to premiums invariably often comes in lieu of increased wages. Thus, rising premiums affect not only healthcare affordability but also a family’s standard of living.
To assess health insurance affordability for California families, we considered total ESI premiums as a percent of median household incomes, both for single and family households under 65. Figure 9 shows that the relative cost of single coverage via ESI in California increased by almost 50% between 2005 and 2011, growing from 9.3% to 13.5% of median single-person household income. Similarly, premiums for family coverage under ESI increased from 16.1% of median family household income in 2005 to 23.8% in 2011. These large increases are the result of premiums growing at an average annual rate of about 7.5%, while during the same period median household incomes grew at an average annual rate of just 1.1% for single-person households and 0.5% for family households.
We project that total ESI premiums will grow at an average annual rate of 6.6% between 2011 and 2022.109,110 Total premiums for single coverage via ESI are projected to rise from $5,976 in 2011 to $12,062 in 2022 (see Figure A7 in Appendix I). For family coverage via employer-sponsored insurance, premiums are projected to grow from $15,720 in 2011 to $31,728 in 2022.111 As in previous years, premiums are projected to grow significantly faster than household income.112 As a result, the percent of median household income devoted to total premiums for ESI between 2011 and 2022 is projected to increase from 13.5% to 18.2% for single coverage and from 23.8% to 32.2% for family coverage, as shown in Figure 9. This anticipated decline in health insurance affordability over the next decade will have a significant negative impact on the standard of living for California families by substantially reducing the amount they have to spend on items other than healthcare.
E. Fiscal challengesThe growth in healthcare expenditures is also a pressing concern for federal and state budgets. The ACA includes $716 billion in cuts to Medicare over ten years, mostly through reductions in reimbursements to providers and Medicare Advantage plans.113 Medicare benefits, however, were enhanced by the ACA, particularly for preventive care and by the elimination of the “donut hole”
104 We forecast California GSP through 2022 by applying the national economic forecasts utilized in CMS projections. See Appendix III: “California Cost Curve, Healthcare Expenditures, and Premium Projections (Methodology)” for more detail.105 For reference, the aggregate healthcare expenditures and aggregate GSP average annual growth rates in constant 2012 dollars are estimated to be 3.7% and 2.6%, respectively, between 2012 and 2022.106 The approximate 1 percentage point difference between aggregate and per capita healthcare expenditures growth during this period (6.2% aggregate vs. 5.2% per capita) is due to the expanding California population.107 Kaiser Family Foundation State Health Facts (2011).108 See Appendix XII: “Assessing California’s Healthcare Spending (Brief)” for more information on cost of living in California.109 To forecast ESI premiums in California, we adjusted our annual 2012-2022 projections of healthcare expenditure per capita growth rates upward, to account for ESI premiums having grown at 1.6 times the rate of healthcare expenditures per capita over the past decade. However, our baseline projections assume that ESI premiums will only grow at 1.3 times the rate of per capita healthcare expenditures in California. (See Appendix III “California Cost Curve, Healthcare Expenditures and Premium Projections (Methodology)” for sources and more detail.)110 For reference, the average annual growth rate projections for both single- and family-coverage ESI between 2011 and 2022 is 4.1%, in constant 2012 dollars.111 For reference, single-coverage ESI premiums are projected to grow from $6,106 to $9,519 and family-coverage ESI premiums are projected to grow from $16,061 to $25,041 between 2011 and 2022 in constant 2012 dollars.112 We estimated median household income by adjusting our projections of annual average per capita income growth downwards slightly between 2012 and 2022, as median household income grew more slowly than average household income over the past decade. (See Appendix III: “California Cost Curve, Healthcare Expenditures and Premium Projections (Methodology)” for more detail).113 Harvey, et al. (2012).
A New Vision for California’s Healthcare System 27
in prescription drug coverage. Nonetheless, Medicare spending is projected to nearly double in the next ten years, from $550 billion in 2012 to $1.1 trillion in 2022, and projected to increase from 3.7% of U.S. Gross Domestic Product (GDP) in 2012 to 4.3% in 2022.114 The projected growth in Medicare spending is principally caused by anticipated new healthcare technologies.115 But it is also affected, albeit to a lesser extent, by the many new beneficiaries entering the program as the baby boom generation reaches eligibility age. Even more significant growth is expected for Medicaid. The federal outlay for the program was $253 billion in 2012, but is projected to increase to $592 billion in 2022, primarily because most of the ACA’s Medicaid coverage expansion is being funded by the federal government.116 Overall, the increased spending projections for the two programs severely strain the U.S. budget.
Much the same is happening at the state level. Medi-Cal is the second-largest expenditure in California’s general fund, behind only K-12 education.117 The state’s dire fiscal situation in recent years has put pressure on Medi-Cal’s budget, resulting in decreased provider reimbursement and an attempted 10% across-the-board reduction in provider payments that has been the subject of several court challenges. Low provider reimbursements, combined with benefit reductions and movement of Medi-Cal beneficiaries into managed care, have tempered the rate of increase in Medi-Cal expenditures. At 56% in 2008, California currently has the fourth-lowest Medicaid to Medicare reimbursement ratio in the country for physician services.118 Consequently, only 57% of the state’s physicians were accepting new Medi-Cal patients in 2008, and these physicians are often concentrated in an even smaller share of practices.119 With the large expansion of Medi-Cal under the ACA, there is a concern about the long-term growth in the state’s overall Medi-Cal spending despite the fact the expansion is mostly funded by the federal government. Furthermore, the increased demand for services that will result from the ACA expansion leads to concerns about provider access, which is already limited.
In summary, healthcare in coming years is expected to become increasingly unaffordable for families, for employers, and especially for the federal and state governments.
SEC TION VI
Addressing the Affordability Crisis: Bending the Cost CurveAware of the significant problems with affordability in our healthcare system, the Berkeley Forum examined several initiatives for reducing the growth of healthcare expenditures.
A. Examined initiativesThe Forum participants endorse seven initiatives for implementation in California, listed in Table 3. These initiatives were selected for several reasons, the main one being the interest expressed by Forum participants. Other factors included California’s unique delivery system and demographics, the magnitude of the initiative’s potential reduction in healthcare expenditures, the evidence supporting quantification of the initiative’s impact and the feasibility of actually implementing it. As much as possible, the analyses take into account California’s unique socioeconomic, demographic, geographic, health and healthcare system characteristics.
Table 3 provides a brief description of each initiative and describes its adoption under two different scenarios: the Current Developments and the Forum Vision scenarios. Appendices IV-XI contain a comprehensive description of each initiative. Each appendix describes the underlying problem, discusses the proposed initiative, and reports the estimated healthcare expenditure reductions under both scenarios. They also explain the methods and assumptions used to generate the estimates, and discuss evidence of the initiative’s possible health outcomes and care quality benefits. Depending on the initiative, these benefits might include a reduction in chronic disease burden, improved mental and emotional health, increased longevity and better patient and caregiver experience—among others.
The Current Developments scenario is based on an assessment of unfolding market forces, policies and events. Chief among these is the ACA, with its subsidiary provisions such as the Medicare Shared Savings Program and the penalties being imposed by CMS for hospital-acquired infections and re-admissions. The scenario also takes into account growing Medicaid primary care access challenges, private payers’ experimentation with new delivery and payment methods, and the growing awareness of the benefits of palliative care and physical activity. The Current Developments scenario is distinct from the status quo, which is based on historical trends.
114 Blom, et al. (2012).115 Smith, et al. (2009).116 Ibid.117 California HealthCare Foundation (2009a).118 Kaiser Family Foundation (2012).119 Bindman, et al. (2010).
28 Berkeley Forum | F E BRUA RY 201 3
TABLE 3: INITIATIVES EXAMINED BY THE BERKELEY FORUM
120 This estimate includes Kaiser Permanente members as well as those in other global budget/integrated care system arrangements in California, based on ACO data from Cattaneo & Stroud Inc. (2012a&2013).121 Rittenhouse, et al. (2008).122 For the purpose of this analysis, seriously ill patients are those in the last year of life with any of the following conditions: cancer, chronic obstructive pulmonary disease, congestive heart failure, dementia, amyotrophic lateral sclerosis (ALS), cirrhosis and HIV. The number of seriously ill patients is adjusted upward by 25% to account for those with less common conditions or who are in an earlier stage of a disease.123 We estimate that about 20% of California patients who need community-based palliative care have access to it, and about half of those currently receive that care, thus arriving at a 10% current rate. See assumptions in Appendix VII: “Palliative Care (Initiative Memorandum).”124 Behavioral Risk Factor Surveillance System (2011).125 Berkeley Forum analysis of 2007-2009 Medical Expenditure Panel Survey Office-Based Medical Provider Visits files.126 The five healthcare-associated infections include central line-associated blood stream infections, methicillin-resistant Staphylococcus aureus, Clostridium difficile infections, vancomycin-resistant enterococci and surgical site infections.127 California Department of Public Health (2010); See Appendix X: “Healthcare-Associated Infections (Initiative Memorandum).”128 A second indicator for this initiative is the number of preterm births that benefit from an additional one-week gestation period. Under the Current Developments and Forum Vision scenarios, we assume 2.1% and 3.1%, respectively, of preterm births will be delayed by one week. 129 We assume that the rate will be 9.7% by 2013, based on last available data of 9.8% in 2011. Centers for Disease Control and Prevention (2011); see Appendix XI: “Preterm Births (Initiative Memorandum).”
Initiative Description Key Indicator Current RateCurrent
Developments Rate (2022)
Forum Vision Rate (2022)
Global Budgets / Integrated Care Systems
Increase the number of people who receive care from integrated care systems that operate under risk-adjusted global budgets, which encompass primary care, specialty care, facilities and pharmaceuticals.
Percent of insured Californians served by integrated care systems using risk-adjusted global budgets.
23%120 45% 70%
Patient-Centered Medical Home
Increase use of patient-centered medical homes to more effectively manage care for patients with chronic diseases and to reduce their avoidable / non-urgent emergency department and inpatient visits.
Percent of patients with at least one chronic condition enrolled in a PCMH.
25%121 50% 80%
Palliative Care Increase use of concurrent curative and community-based palliative care for seriously ill patients, including advanced care planning and physical, emotional and social support.
Percent of seriously ill patients receiving community-based palliative care.122
10%123 30% 50%
Physical Activity Increase rates of physical activity to improve the health of currently inactive Californians.
Percent of Californians considered inactive.
48.7%124 46.3% 43.8%
Nurse Practitioners and Physician Assistants
Increase use of nurse practitioners (NP) and physician assistants (PA) for primary care services, at a lower cost structure than for physicians.
Percent of office-based visits to primary care clinicians provided by NPs and PAs.
9.8% (NP)
2.2% (PA)125
11.8% (NP)
3.2% (PA)
24.5% (NP)
5.5% (PA)
Healthcare Associated Infections
Reduce five common healthcare-associated infections (HAI).126
Number of five common HAI cases per facility
Varies by HAI127
Reduce by 22%
Reduce by 40%
Preterm Births Improve prenatal health and birth outcomes by expanding prenatal care and education efforts targeting high-risk pregnancies.
Percent of births that are preterm (24-37 weeks)128
9.7%129 9.5% 9.4%
A New Vision for California’s Healthcare System 29
TABLE 4: HEALTHCARE EXPENDITURE REDUCTIONS IN CALIFORNIA FROM INITIATIVES UNDER DIFFERENT SCENARIOS, 2013 – 2022
Notes: All estimates are in current-year dollars. (1) The table includes a point estimate of the expenditure reduction for each initiative, and estimate ranges are included in Appendices IV-XI. For the Current Developments scenario, the expenditure reduction point estimate for each initiative is based on the midpoint of the low and high estimate range. For the Forum Vision scenario, the point estimate is the high estimate in the range, because we assume this scenario includes initiatives that are more in-depth and effective than may be possible under the Current Developments scenario. (2) To avoid double-counting expenditure reductions that may occur in two or more initiatives (primarily between global budgets/integrated care systems and the other six initiatives), the total is based on 100% of the reduction from global budgets/integrated care systems (Initiative 1), 75% of the reductions from Initiatives 4, 5, 6 and 7, and 50% of the reductions from Initiatives 2 and 3. SOURCE: Berkeley Forum analysis (see Appendices IV-XI).
methodologies and assumptions that were more conservative. Although the Forum’s initiatives are expected to potentially have a significant positive effect on morbidity, mortality rates and healthcare quality, this analysis primarily focuses on estimating their impact on healthcare expenditures. Appendices IV-XI provide additional context on the non-monetary benefits of the initiatives, such as quality of care, health outcomes and patient satisfaction.
For the Current Developments and Forum Vision scenarios, Table 4 shows the estimated reduction in California healthcare expenditures from each initiative, as compared to projected status quo healthcare expenditures, for the period 2013-2022. We report the midpoint of the expenditure reduction range provided in the Initiative Memorandums in Appendices IV-XI for the Current Developments scenario, but we report the high estimate of the expenditure reduction range for the Forum Vision scenario. This is because under the Forum Vision, adoption rates as well as the effectiveness of the
In contrast, the Forum Vision is based on a scenario in which there is a much more pronounced shift towards risk-based payments and integrated care systems that better align clinical and financial incentives and that also prioritize population health. Thus, under the Forum Vision, adoption rates as well as the effectiveness of the various initiatives are assumed to be significantly higher than under the Current Developments scenario. For example, approximately 23% of insured Californians currently receive care under global budget or ACO arrangements.130 We assume this percentage will increase to 45% under the Current Developments scenario, but to 70% under the Forum Vision scenario.131
For each initiative, we estimated potential healthcare expenditure reductions relative to the status quo projections presented in Section V of the report. Our methods were informed by a number of relevant studies, such as RAND’s study on Massachusetts and the Lewin Group’s study on New York.132 In modeling potential expenditure reductions, we generally chose
130 This estimate includes Kaiser Permanente members as well as those in other global budget/integrated care system arrangements in California, based on ACO data from Cattaneo & Stroud Inc. (2012a&2013).131 If California were to attain the Forum Vision goal of 50% of expenditures being paid for outside of fee-for-service, it would most likely mean an even higher percent of Californians (e.g. 70% as modeled) receiving care in systems utilizing risk-adjusted global budgets. This is because global budgets may still entail some use of fee-for-service payments.132 Eibner, et al. (2009); Lewin Group (2010).
2022 Only Total: 2013 – 2022
($ billions)Current
DevelopmentsForum Vision
Current Developments
Forum Vision
Projected status quo healthcare expenditures $572.2 $4,387.1
Expenditure reduction by initiative1
1. Global budgets/integrated care systems $4.8 $14.8 $25.9 $83.6
2. Patient-centered medical home $1.9 $5.2 $11.6 $25.2
3. Palliative care $0.9 $2.3 $4.9 $11.4
4. Physical activity $0.7 $1.7 $3.4 $8.2
5. Nurse practitioners and physician assistants $0.1 $0.4 $0.3 $1.8
Total reduction as a percent of projected expenditures2 1.2% 3.6% 0.8% 2.5%
Healthcare spending under new scenarios $565.4 $551.9 $4,350.4 $4,277.0
30 Berkeley Forum | F E BRUA RY 201 3
various initiatives are assumed to be significantly higher than in the Current Developments scenario. To estimate the cumulative impact of these efforts, we adjusted for the potential overlap of two or more initiatives. The risk-adjusted global budgets/integrated care systems initiative itself comprises numerous components. For the other six initiatives, we included only 50-75% of their estimated reductions, because we assumed the remainder were already accounted for in the estimate for the risk-adjusted global budgets/integrated care systems initiative.133
Table 4 shows that under the Current Developments scenario, these initiatives are expected to reduce healthcare expenditures by approximately $37 billion,134 or 0.8% of projected total spending, between 2013 and 2022.135 Under the Forum Vision scenario, the savings in healthcare expenditures are estimated to triple, to $110 billion.136 That $110 billion represents 2.5% of projected $4.4 trillion in total status quo healthcare expenditures during the same period. In 2022, the share of projected status quo healthcare expenditures represented by expenditure reductions reaches 3.6%, because of the higher adoption of the initiatives that will have occurred by then. The majority of spending reductions in both scenarios is attained by increasing the share of the population receiving healthcare from global budget/integrated care system arrangements, since the aligned financial incentives associated with
globally budgeted arrangements can trigger a virtuous cycle of synergistic improvements to the system. For example, the Sacramento ACO formed by Blue Shield of California, Hill Physicians and Dignity Health to care for 41,000 commercial HMO beneficiaries in CalPERS focused on lowering expenditures through initiatives in five key areas: improving information and data exchange; coordinating processes (e.g. discharge planning); eliminating unnecessary care; reducing variation in practices across physicians and care settings; and reducing pharmacy expenditures. Following the global budgets/integrated care systems initiative, the next major sources of expenditure reductions under the Forum Vision include increased use of patient-centered medical homes and palliative care, and increased physical activity. While some initiatives, such as reducing the rate of preterm births or healthcare-associated infections, show low relative savings, they were included because of evidence of their expected overall positive impact on care quality, healthcare outcomes and patient experience.
Table 5 shows the annual healthcare expenditure growth rate from 2012 to 2022 under the status quo projections as well as the Current Developments and Forum Vision scenarios. Aggregate healthcare expenditures under the status quo are projected to increase by a 6.2% annual rate between 2012 and 2022. The Current Developments scenario is predicted to slightly lower that growth rate,
133 When totaling expenditure reductions across the initiatives, we used 50% of the expenditure reduction for palliative care and patient-centered medical homes, since chronic disease management and palliative care are often high priority areas for organizations operating under global budgets/integrated care systems. We used 75% of the expenditure reduction for physical activity, nurse practitioners and physician assistants, preterm births and healthcare-associated infections, because these initiatives may not be specific priority areas for organizations operating under global budgets/integrated care systems. Increasing physical activity will likely involve a broader coalition of stakeholders than what global budgets/integrated care system arrangements can accomplish singlehandedly. Increasing use of NPs and PAs may require addressing scope of practice regulations. Reducing rates of preterm births requires lifestyle, education and other social-service initiatives that may be further outside the scope of a global budget/integrated care system arrangement. Finally, many hospitals already have programs in place to reduce healthcare-associated infections and will be further motivated to do so by upcoming CMS financial incentives to reduce HAIs (California Healthline (2011)). Further investigation is needed to better understand the expenditure reduction overlaps across initiatives. 134 For reference, this amount is equivalent to $31 billion in constant 2012 dollars.135 Healthcare-associated infections and preterm births did not result in expenditure decreases under the Current Development scenario because of the cost to implement the initiatives. However, these initiatives may still be worthwhile to implement due to their expected improvements to health outcomes and care quality.136 This amount is equivalent to $93 billion in constant 2012 dollars.
Status Quo Current Developments Forum Vision
Healthcare Expenditures ($ billion)
2012 $313.2 $313.2 $313.2
2022 $572.2 $565.4 $551.9
2012 – 2022 average annual growth rate 6.2% 6.1% 5.8%
Gross State Product
2012 – 2022 average annual growth rate 5.1% 5.1% 5.1%
Difference between healthcare expenditure and GSP average annual growth rates (percentage points) 1.1 1.0 0.81
Notes: (1) The “Difference” is based on non-rounded average annual growth rates. All estimates are in current-year dollars.SOURCE: Berkeley Forum analysis.
TABLE 5: IMPACT OF INITIATIVES ON REDUCING THE PROJECTED GROWTH RATE OF HEALTHCARE EXPENDITURES IN CALIFORNIA
A New Vision for California’s Healthcare System 31
FIGURE 10: CALIFORNIA COST CURVE: PROJECTED HEALTHCARE EXPENDITURES AS A SHARE OF GROSS STATE PRODUCT UNDER DIFFERENT SCENARIOS, 2012 – 2022
SOURCE: Berkeley Forum analysis.
to 6.1%, only minimally reducing California’s healthcare expenditure burden.
The continued lack of affordability under the Current Developments scenario highlights the need to fundamentally transform healthcare financing and delivery along the lines suggested by the Forum Vision. We conservatively estimate that between 2012 and 2022, the growth rate in annual healthcare expenditures will decrease from 6.2% under the status quo to 5.8% under the Forum Vision. This translates to an average annual reduction in healthcare expenditures of $802 per California household during this period, or $1,422 per household in 2022.137
Under the Forum Vision, California is closer to meeting one of the cost indicators in Governor Brown’s December, 2012 “Let’s Get Healthy California” report, which aims for healthcare expenditures to grow at the same rate as Gross State Product by 2022. Under the status quo, healthcare expenditures grow at an average annual rate of 1.1 percentage points faster than GSP between 2012 and 2022. The Current Developments scenario reduces this differential to an average of 1.0 percentage point annually during this period. Under the Forum Vision, healthcare expenditures grow only an average of 0.8 percentage points faster than GSP annually through 2022.
Figure 10 shows the impact of both scenarios in bending the Cost Curve relative to the status quo during the coming 10 years. For the status quo and each scenario, healthcare expenditures represent a greater share of
GSP over time, particularly in the last several years of the period. Under the status quo, the Cost Curve increases from 15.4% in 2012 to 17.1% in 2022. Under the Current Developments scenario, the Cost Curve reaches 16.9% by 2022. Under conservative estimates for the Forum Vision, California is able to bend the Cost Curve much further by 2022, decreasing it to 16.5%. The difference deserves emphasis: Under the Forum Vision, California is able to bend the Cost Curve in 2022 by three times as much as in the Current Developments scenario: 0.61 percentage points vs. 0.20 percentage points.
Figure 11 (on the following page) shows healthcare expenditures for the status quo, Current Developments scenario and Forum Vision scenario during 2013-2022. During the initial years, the difference in spending between the status quo and the scenarios is small, as most of the initiatives are in the early stages of adoption. Much of the spending reductions occur in the years closer to 2022, as significantly greater uptake rates of each initiative begin to pay off through reduced healthcare expenditures. To illustrate the contrast, the expenditure reduction under the Forum Vision represents just 0.3% of the status quo’s projected expenditures in 2013, but 3.6% by 2022. One implication of this expenditure reduction trend is that we would expect these initiatives to generate even greater expenditure reductions and a further bending of the healthcare Cost Curve beyond 2022.
There are several limitations in the above analysis. Although the latest studies and the best available data were used to estimate expenditure reductions, the results should be viewed only as approximations, because in many cases, the evidence is still emerging (see 137 These amounts are equivalent to $680 and $1,122, respectively, in constant
2012 dollars.
32 Berkeley Forum | F E BRUA RY 201 3
$200
$275
$350
$425
$500
$575
$650
2013 2014 2015 2016 2017 2018 2019 2020 2021 2022
$ bi
llion
s
Status Quo Current Developments Forum Vision
FIGURE 11: PROJECTED CALIFORNIA HEALTHCARE EXPENDITURES UNDER DIFFERENT SCENARIOS, 2013 – 2022
limitations in Appendices IV-XI: Initiative Memorandums). Furthermore, to estimate the cumulative expenditure reduction across the initiatives, we adjusted for the potential overlap of two or more initiatives (primarily between global budgets/integrated care systems and the other six). However, the magnitudes of the adjustments could be refined through further study. Furthermore, certain initiatives may have synergies that lead to expenditure reductions that are greater than the sum of the individual initiatives.
There are many other initiatives that we did not study that could significantly contribute to bending the Cost Curve. Among these are further payment reforms (e.g. value-based insurance design, reference pricing and global payments), delivery reforms (e.g. telemedicine and centers of excellence), unit-cost reducers (e.g. hospital construction regulatory approval process reforms, health information technology and administrative simplification), and population health (e.g. sugar-sweetened beverage tax and tobacco use).
These initiatives do not account for the potential of additional healthcare expenditures due to three areas. First, the Forum Vision will likely result in a more consolidated healthcare delivery system, creating the potential for reduced market competition. This issue is discussed in Section VIII “Challenges to Achieving
the Forum Vision.” Second, if these initiatives lead to increased longevity, this may itself increase healthcare expenditures at the population level. This issue is discussed in Appendix VIII: “Physical Activity (Initiative Memorandum),” in which we examine the latest research on the effect of increased longevity on healthcare expenditures. Third, there is the potential that supplier-induced demand could partially or fully eliminate the estimated reductions.
We do not attempt to determine which stakeholders (e.g. consumers, employers, insurers, providers or the government) would benefit from any healthcare expenditure reductions. In a competitive provider and insurance market, those reductions would flow to all purchasers of health insurance and healthcare services. However, in cases where the market is not competitive, the savings from the initiatives could be captured as profits or surpluses by healthcare providers or insurers, rather than be passed along as savings to consumers.
It is important to put these results in the context of other studies that estimated expenditure reductions from various initiatives, including RAND’s study on Massachusetts, the Lewin Group’s study on New York and the Commonwealth Fund’s study on the United States.138
138 Eibner, et al. (2009); Lewin Group (2010); The Commonwealth Fund (2013).
Notes: All estimates are in current-year dollars.SOURCE: Berkeley Forum analysis.
A New Vision for California’s Healthcare System 33
All three estimate the impact of a series of initiatives on reducing healthcare expenditures, but only the Commonwealth Fund aggregates the reductions across its initiatives, estimating a 4.8% reduction in national healthcare expenditures over 10 years. Nonetheless, these three studies generally show higher potential expenditure reductions than those projected in this report. There are several reasons for this. First, we have generally been more conservative in our modeling methodology and assumptions than other studies, including the assumptions we made about potential savings, penetration rates and adoption speed. The expenditure reductions we estimate under the Forum Vision scenario may be particularly conservative given the great change to the healthcare system articulated by the Forum Vision, with its potential for additional resulting synergies. For example, the rate of expenditure reductions may accelerate as the initiatives are implemented more comprehensively and become self-reinforcing. Second, we model fewer and different types of initiatives than those modeled by the other studies. Third, several initiatives on our list are more targeted (e.g. preterm births or healthcare-associated infections) than those in other studies, and thus may be expected to have a lower impact on overall expenditures. Last, California has less room for improvement, as our state already enjoys significantly lower per capita healthcare expenditures than either New York or Massachusetts.139 Many of the modeled initiatives target utilization, and for some of the reasons cited in Sections III and IV of this report, California already performs relatively well in this regard.
In summary, under the Forum Vision scenario, the initiatives are projected to reduce healthcare expenditures by $110 billion (or $93 billion in constant 2012 dollars), representing 2.5% of the total $4.4 trillion in projected status quo expenditures during 2013-2022. Although this reduction only modestly lowers healthcare expenditures’ share of GSP as compared to status quo projections, in absolute terms the amounts involved are significant. The $93 billion is equivalent to more than two-thirds of California’s state budget, approximately $142 billion for 2012-2013.140 On a per-household basis, the reduction is equivalent to $802 annually between 2013 and 2022, or $1,422 per household in 2022. Furthermore, we expect that Californians would potentially enjoy significant improvement in their healthcare experiences, outcomes and quality of care under the Forum Vision scenario (see the Initiative Memorandums in Appendices IV-XI for additional information). Looking beyond 2022, we expect the Forum Vision scenario to show even greater impact on healthcare expenditures and the Cost Curve relative to status quo projections, as the changes become more entrenched and their benefits more pronounced.
SEC TION VII
Two Areas of FocusThe initiatives described above were examined to estimate their impact on reducing healthcare expenditures in California over the next 10 years. From the above initiatives, Forum participants have selected two that demonstrate especially significant potential savings, and which could therefore play an outsized role in improving health status and healthcare quality for Californians. These two areas are first, physical activity promotion, and second, palliative care.
The rationale for selecting those two is as follows. As healthcare providers and payers, Forum participants are well aware of the increasing prevalence and earlier onset of chronic disease, which takes a major toll on Californian’s well-being, productivity, longevity and fiscal resources. As was described earlier in the 5/50 analysis, chronic diseases and obesity are found commonly in the top 5% of healthcare spenders in the state. Emerging research on the critical importance of physical activity led Forum participants to concentrate on this particular issue. The Forum has also chosen to highlight palliative care because of studies that show a vast discrepancy between the care patients say they would like to receive in the last few months of life and the care they actually get. Another reason for this focus is the high concentration of spending on seriously ill patients. Forum participants believe that palliative care principles promote shared-decision making and person-centric care that can help counteract the tendency towards providing clearly futile end-of-life treatments that bring enormous discomfort to patients and their families. Attention to palliative care is also important because the single biggest contributor to increased healthcare costs is the introduction of new technologies and treatments.141 This section provides background and recommendations in these two areas.
A. Physical activity promotionOverweight and obesity, along with sedentary lifestyles, are major challenges to the health status of Californians and the effectiveness of our healthcare system. More than 60% of adults142 and over 30% of children 10-17 in California are overweight or obese.143 In 2007, 48.7% of Californians were physically inactive.144
141 Smith, et al. (2000).142 Behavioral Risk Factor Surveillance System (2011).143 Kaiser Family Foundation (2012f).144 Behavioral Risk Factor Surveillance System (2011).
139 Kaiser Family Foundation (2009b).140 California Department of Finance (2012). The $142 billion total budget includes the budgets from the General Fund, special funds, and selected bond funds, as reported by the California Department of Finance.
34 Berkeley Forum | F E BRUA RY 201 3
The costs associated with these conditions were estimated to be $41.2 billion in 2006, divided roughly equally between direct healthcare expenditures and indirect costs such as lost productivity.145 Obesity is deeply intertwined with physical activity status, with confounding effects on health.
Making California the healthiest state in the nation by 2022, the goal laid out by Governor Brown’s December 2012 “Let’s Get Healthy California” report and supported by the Berkeley Forum, will require improvement in some of these indicators. The Berkeley Forum sees a particular opportunity to encourage increased levels of physical activity among Californians. While physical activity rates are directly affected by behavior and health status, obesity and overweight present complex physiological processes that can be especially challenging. The recent evidence suggesting the relative importance of even moderate physical activity levels in countering chronic disease and cancers is yet another reason for the Forum to highlight this issue. A Lancet study from last year estimated that 5.3 million of 57 million premature deaths around the world in 2008 could be attributed to physical inactivity.146 Another study of 116,564 women showed that physically inactive middle-aged women had a 52% higher risk of early death, a doubling of cardiovascular-related mortality and a 29% higher cancer-related mortality when compared to women who were physically active.147 The World Health Organization estimates that physical inactivity is the primary cause of approximately 21-25% of breast and colon cancers, 27% of diabetes and 30% of coronary heart disease cases.148 On the other hand, increased physical activity is associated with numerous positive health outcomes, many of which accrue early on, including decreases in depression, improvements in mood and energy levels, better arthritis management and greater longevity.
A 2002 analysis in the American Journal of Preventative Medicine provides one of the most comprehensive comparisons of various initiatives to increase physical activity levels, especially walking.149 It found that informational campaigns, such as “point-of-decision prompts” in schools or the workplace, can encourage such physical activities as using the stairs instead of the elevator or walking in lieu of driving. Social support initiatives are even more effective, particularly ones that focus on changing physical activity behavior through social networks. Policies providing enhanced access to physical activity combined with informational outreach efforts, such as constructing walking trails and then distributing maps of them, have also consistently been proven to be effective. While California law requires a minimum of 200 minutes of physical education every 10 days for public elementary schools, and 400 minutes for middle and high schools, schools often lack the funding to comply with these mandates.150 Forum participants encourage the development of
145 California Center for Public Health Advocacy (2009).146 Lee, et al. (2012).147 Hu, et al. (2004).148 World Health Organization (2012).149 Kahn, et al. (2002).150 California Center for Public Health Advocacy (2006).151 Naito, et al. (2008).152 Interviews with Forum participants’ employee wellness leaders.153 Glickman, et al. (2012).
California’s schools as environments that support physical activity and healthy eating.
Comprehensive employer-based initiatives that include many or all of the above components are also expected to result in increased activity levels. Workplace-based programs often include frequent presentations about physical activity, the distribution of pedometers to encourage walking, and lectures and instructions on stretching and walking. Also important in the workplace are point-of-decision prompts, sporting events and other employer-sanctioned exercise times, the construction of walking paths and the distribution of walking maps.151 Other initiatives that have been implemented successfully by employers include access to gyms and fitness centers, subsidies for nutritious foods in cafeterias, specialized care programs for chronic conditions such as diabetes and COPD and the free availability of health education materials.152 Such efforts become even more effective when they are designed to complement each other, are cross-promoted, and are supported by the workplace environment and culture. Also useful are employee “challenges” that incorporate team support and encourage friendly competition.
The Berkeley Forum agrees with the Institute of Medicine that tackling the obesity and inactivity epidemic will require extensive collective efforts from policymakers, public institutions and food manufacturers, among others. In “Accelerating Progress in Obesity Prevention,” the Institute of Medicine recommended a range of efforts that could be undertaken by healthcare stakeholders.153 These included providers serving as models for incorporating healthy eating and active living into worksite practices and programs; routine screening for excessive consumption of sugar-sweetened beverages and providing counseling on their associated health risks; routine body mass index screening; insurance premium discounts for healthy behaviors; and employer-sponsored health and wellness promotion activities.
The Forum supports an active role for California healthcare organizations in promoting wellness and healthy lifestyles. Given the geographic and socioeconomic diversity of the state’s healthcare system employees, a focus on improving physical activity and general wellness in this population could potentially help address overall health disparities in the state. A strategic commitment to employee health and support
A New Vision for California’s Healthcare System 35
from an organization’s leadership, along with activity “champions” at all ranks, are key to this process. Forum organizations currently use incentives ranging from small tokens to financially significant premium discounts as a way of rewarding increased health awareness by their employees, including participation in health assessments and the attainment of goals for improved health outcomes. Organizations are still developing better methods to measure their return on investment for these programs. They are also attempting to better understand which programs are most effective and how employees can be best motivated to stay involved in them. Other challenges include effectively tracking employee improvement over time and finding an appropriate balance between rewarding both effort and outcomes. The Forum sees significant room for collective dedication, a shared effort and continuous improvement in the area of employee wellness.
Forum participants are considering opportunities to initiate a joint physical activity challenge among healthcare employees—perhaps incorporating friendly competition among organizations, complementing existing employee initiatives such as Blue Cross’ Fitness Challenge and KP (Kaiser Permanente) Walk. Forum leaders would like to explore forming a learning collaborative among California organizations’ employee health leaders. The goal would be to provide a venue to share best practices and experiences involving effective employee wellness programs, as well as addressing challenges to engagement and measuring return on investment. While the National Business Group on Health has a collaboration along these lines, a local effort focused specifically on California might have a greater impact. The Forum also supports the launching of a multi-sector state-wide walking campaign in California, potentially building upon Kaiser’s existing EveryBody Walk efforts.
An emphasis on the healthcare workforce is expected to have spillover effects into the general population. For example, Kaiser-sponsored farmers’ markets serve not only employees and patients, but also local communities. Similarly, investments in walking, among other activity-related improvements, can be expected to increase physical activity for employees of healthcare organizations. These programs could be expanded over time and extended into the surrounding communities. By cultivating a culture of health not only for their own employees but also at healthcare settings in general, California healthcare organizations can set an example for the rest of the state.
B. Palliative careThe most important test of a healthcare delivery system may well be its ability to provide high-quality, patient-centric, cost-effective care for seriously ill patients. While many patients usually have unrestricted access to complex tertiary care for advanced illnesses, the Berkeley Forum nonetheless believes there is significant room for improving the care provided for California’s seriously ill patients. Specifically, the Forum supports widespread use of palliative care, which is “patient and family centered care that optimizes quality of life…[and] involves addressing physical, intellectual, emotional, social and spiritual needs and facilitating patient autonomy, access to information, and choice,”154 alongside curative treatments. In comparison, current medical practices often overwhelmingly emphasize technical interventions (such as chemotherapy, invasive procedures, hospitalization and intensive care) regardless of likely benefit to either quality or length of life. In the process, the wishes of the patients and caregivers are often sidelined.
A recent study by the California HealthCare Foundation found that Californians prefer dying a natural death at home, in a process that stresses pain relief, symptom amelioration and spiritual support, along with shared decision-making. However, 42% of California deaths still occur in hospitals (2009) and 61% of Medicare deaths are not served by hospice (2010).155 Given that the federal Medicare hospice benefit requires a six-month prognosis and that patients forgo curative care, the median hospice enrollment length is only 18 days, since both patients and providers select hospice care only very near the point of death.156 California is in the bottom 10% of states based on a hospital intensity index in the last two years of life—with a higher than U.S. average number of hospital days (11.7 days vs. 10.9) and with more patients with seven or more ICU days in the last six months of life (20.3% vs. 15.2%).157
Nevertheless, the Forum is encouraged by the progress that has been made in the care of seriously ill patients in California over the past decade. There has been a significant increase in inpatient palliative care services, with 53% of all hospitals, and 82% of hospitals with more than 250 beds, offering such care in 2011.158 Legislative policy159 and implementation support by the California Coalition for Compassionate Care has led to high levels of awareness of POLST (Physician Orders for Life Sustaining Treatment) advanced care planning forms within nursing homes and among emergency medical service and emergency room physicians. There has also been increased attention paid to reducing acute care transfers from nursing homes to hospitals, via efforts such as the 2007 PREPARED pilot program in Sacramento and the national INTERACT project. These initiatives are further
154 Center to Advance Palliative Care. 155 O’Malley, et al. (2012).156 Hospice Association of America (2012).157 The Dartmouth Atlas of Healthcare (2012).158 California HealthCare Foundation (2012).159 California Coalition for Compassionate Care (2009).
36 Berkeley Forum | F E BRUA RY 201 3
encouraged by CMS’ new penalties on select readmission rates.160 Medi-Cal has undertaken a leading pediatric palliative care pilot program led by the Children’s Hospice and Palliative Care Coalition. Preliminary results show a notable increase in patient and family well-being as well as cost-savings.161
Other state governments and local organizations have taken their own steps to promote palliative care. The Joint Commission’s Advanced Certification Program for Palliative Care, launched in 2011, is a major effort to ensure high-quality standards for inpatient palliative care programs.162 Various national insurers are reimbursing for some concurrent curative and palliative care services, where the latter are often provided by hospice and home health agencies.163 New York in 2008 passed landmark legislation that requires health care providers (nursing homes, hospitals, assisted living facilities and others) to facilitate access to palliative care counseling and information for all patients with advanced life-limiting conditions.164 Finally, Oregon’s centralized state registry of POLST forms allows providers across the state to have 24-hour access to patients’ advanced planning directives.165
However, various challenges still greatly limit broad accessibility to palliative care services in California, including fee-for-service reimbursement, fragmented care systems, an insufficiently trained workforce and lack of mandatory accreditation quality standards. Even with these constraints, California organizations such as Sutter (Advanced Illness Management), Sharp (Transitions) and Kaiser have led the way in providing comprehensive home and community-based palliative care services for seriously ill patients. The Forum supports the person-centric approaches undertaken by these organizations, which have generally shown improved patient satisfaction and quality of life while significantly reducing healthcare expenditures. Their programs serve as examples for the community-based palliative care initiative examined in Section VI above, “Addressing the Affordability Crisis: Bending the Cost Curve”. The Forum expects the rise of ACOs and the movement of Medi-Cal and Medicare patients into managed care to further promote the development of community-based palliative care programs in California.
Based on the vast evidence in favor of palliative care, the Berkeley Forum strongly favors widespread access to quality palliative care for patients with serious illness, appropriate to their individual circumstances. Given the realities of limited resources, it may be desirable to initially prioritize palliative care services for conditions such as oncology, advanced chronic obstructive pulmonary disease and congestive heart failure. These diseases are among those most commonly targeted by palliative care providers, and evidence for their efficacy is more abundant.166 Building upon the milestone
American Society of Clinical Oncologists provisional recommendation that palliative care alongside standard care “should be considered early in the course of illness for any patient with metastatic cancer and/or high symptom burden,”167 Forum participants would like to consider opportunities to provide greater access to palliative care to patients with metastatic cancer.
To support the expected increased need for palliative care capabilities among current and future providers, the Forum also encourages greater investment in workforce development. California State University’s newly established Palliative Care Institute, which aims to train every nursing and social work student —as well as the current members of those professions—in basic palliative care principles, can assist with this effort. Health systems may want to consider facilitating palliative care training opportunities for their staff and providing exposure to palliative care during residency programs. The Palliative Care Institute aims to assist with another key endeavor that the Forum supports—educating the general public about the importance of advanced planning in matters involving serious illness. Forum participants further encourage the development and uptake of quality provider standards relating to palliative care, such as the Joint Commission certification in inpatient palliative care. Finally, Forum participants strongly believe that progress towards the Forum Vision, which articulates a rapid move towards risk-based payments and integrated care systems, is critical to increasing the adoption of palliative care.
160 Glasmire (2011).161 Gans, et al. (2012).162 Sacco, et al. (2011). 163 Meier (2012). 164 Cook (2011).165 Oregon Health & Science University (2011).166 See Appendix VII: “Palliative Care (Initiative Memorandum)”.167 Smith, et al. (2012).
A New Vision for California’s Healthcare System 37
SEC TION VIII
Challenges to Achieving the Forum VisionWhile Forum members fully support the Vision, initiatives and endorsements in this report, they also recognize that achieving them will require industry and policy leaders to overcome significant challenges. Here, we discuss several of these challenges, including the potential of provider consolidation to inhibit market competition and the growing schism between HMO and PPO plans.
A. Provider consolidation and healthcare market restructuringThe Forum Vision calls for moving toward integrated healthcare systems with risk-based reimbursements that align clinical and financial incentives to promote better health outcomes, increase care quality and patient satisfaction, and reduce the growth in healthcare expenditures. This process will undoubtedly result in mergers, joint ventures, partnerships and new contractual relationships among providers and health plans, as these organizations seek organizational structures that will allow them to share risks and resources in order to better address the full care continuum.168 However, there is a concern that provider consolidation and integration may threaten the competitive market. Particularly in geographic regions with few hospitals or independent medical groups, it may not be possible to have multiple integrated care systems. In some cases, non-competitive markets may result. Even in a market with many providers, some providers may be able to set higher prices depending on their reputation for quality and their position within insurers’ contractual networks. Insurers are often compelled to include “must-have” providers in their network to make their plan attractive to consumers. Such providers may recognize their preferential status, and use this to negotiate favorable contracts.169
168 For a discussion of organizational structures and regulatory mechanisms that support integrated care and market competition, see Enthoven (1993).169 Bowers, et al. (2011).170 Berenson, et al. (2010).171 Ibid.172 Robinson (June 2011).173 O’Malley, et al. (2011).174 Robinson (2011).
Some research indicates that although payment reforms and integrated systems can produce higher quality care at lower cost, they also run the risk of creating provider market power that, if exercised, could offset some or all of those gains in efficiency.170 One study of U.S. hospital mergers and acquisitions in the past two decades suggests that the consolidation of hospital markets drives up prices.171 Diminished competition may allow hospitals to charge higher prices, since they face a lower risk of being excluded from the insurers’ contractual networks. A recent study showed that facilities in non-competitive local markets charged higher prices and were more profitable than similar hospitals in competitive local markets.172
Recent research has also examined the role of physician employment by hospitals as well as physician practice consolidation. One study examining the recent trend towards more physician employment by hospitals showed that although there may be improvement in clinical integration and care coordination, the cost of that care may increase.173 Among the possible reasons for this finding are that physician reimbursement may be higher for services rendered at hospitals than in physicians’ offices, and that at times, physicians may be influenced by hospitals to order more expensive care or increase referrals and admissions.174 Consolidation of individual physician practices can also potentially lead to higher prices, as larger physician groups with added bargaining power can negotiate for higher capitation rates. Increasing capitation rates, leading to higher HMO premiums, may be one of the reasons commercial HMO enrollment has declined in recent years. Although the above studies are not definitive, they raise issues that compel policymakers to better understand the changing nature of the healthcare market.
Reaping the full benefits of the financial and clinical integration discussed in the Forum Vision will likely require addressing a new set of regulatory issues, so that these larger systems can be monitored to assure that costs are reasonable and outcomes meet expectations. These new monitoring systems will likely need to be different from the traditional antitrust approaches used by the Federal Trade Commission and the Department
38 Berkeley Forum | F E BRUA RY 201 3
of Justice. For example, it may be useful in evaluating healthcare organizations to include consideration of whether there is evidence of competition-reducing physician or hospital exclusivity, gaming of risk-adjustment methodologies to select the healthiest patients, or cost-shifting from public to private payers.175 Failure to respond to the regulatory challenges posed by changing healthcare markets will likely inhibit the implementation of the Forum Vision.
B. Declining enrollment in HMOsAlong with the problems associated with reduced market competition, there are several other challenges to implementation of the Forum Vision. First, there are indications that market forces and the regulatory environment have caused Californians, particularly in the employer-sponsored insurance market, to turn away from HMOs—the product that has been most associated with integrated care systems and risk-based payment. For example, commercial enrollment in non-Kaiser HMOs dropped by 20% between 2004 and 2009.176 Some employers have grown skeptical about the ability of HMOs to contain costs more effectively than other insurance products. Surveys of California employers indicate that HMO premiums increased at an average annual rate of 9.7% between 2001 and 2011, while PPO premiums increased at a slightly lower rate of 9.0%.177 It is important to note, however, that because HMOs tend to have more generous benefit designs than PPOs, it is difficult to compare total cost growth between the two product types. Nonetheless, some employers who had expected HMOs to deliver lower annual premium increases are now turning to high-deductible PPOs. Many believe that this trend will continue, especially since the new fees on health plans included in the ACA are estimated to result in a 3-4% premium differential between insured and self-funded plans. That fact is likely to encourage employers to self-fund PPO plans rather than purchase fully insured HMO plans.178,179
HMO plans also tend to have rich benefit packages with minimal cost sharing, partly due to tradition and partly due to regulations.180 As employers seek to control their employees’ healthcare expenditures, HMOs
175 Scheffler, et al. (2012).176 Cattaneo & Stroud Inc. (2004-2010). Kaiser HMO enrollment has not experienced the same trend, as total Kaiser enrollment increased 3% between 2004 and 2009. 177 California HealthCare Foundation (2011a).178 A November 2012 Oliver Wyman study “Annual Cost to Insurers Allocated by State” estimates that insurance premiums in California will rise between 2.9% and 3.7% when the ACA fees are fully implemented in 2017. A premium differential of 1-2% already exists between insured and self-funded plans, as insured plans are subject to premium or franchise taxes, while self-funded plans are not. (Wyman (2011)).179 The Knox-Keene Act does not permit capitation within the PPO product structure. HMOs cannot be self-funded by employers because any capitation agreement would be considered a form of insurance.180 California HealthCare Foundation (2009a).
have found it difficult to compete against new high-deductible PPO plans. Developing HMO plans with higher deductibles and other cost-sharing mechanisms has been administratively challenging, as the traditional delegated model HMO does not have the infrastructure in place to adjudicate claims involving deductibles and coinsurance. These plans have not been widely adopted by consumers, who may view rich HMO plan benefits as the tradeoff for the closed networks and prior authorization requirements of HMOs.
There are also concerns that traditional HMOs will not be price-competitive in the new California Health Benefit Exchange. Subsidies in the Exchange are based on the second lowest cost “Silver” plan, defined as one that pays an average 70% of the expenditures, with the participant paying an average of 30%. It is anticipated that a Silver plan will have much higher deductibles, copayments or coinsurance than have been traditional for California HMOs. Some people believe that California’s dual regulatory system has contributed to the current situation, since rich HMO plans offered under the Department of Managed Health Care (DMHC) compete with plans with much higher levels of cost-sharing that are regulated by the Department of Insurance.
Even if the delegated model HMO remains robust in California, there are administrative obstacles that will need to be addressed to fully attain the Forum Vision. For example, to encourage the transparency and care integration described in the Forum Vision, health plans will need to receive claims-level data for members treated by delegated medical groups in lieu of encounter data, which has proven to be a poor substitute. Furthermore, to move towards global payments rather than global budgets, California would have to revise current regulations limiting capitation to DMHC products.
Since the Forum Vision is not tied to a particular product type, such as HMOs or PPOs, the challenge is to ensure that if HMO enrollment declines, the plans that replace them align with the Forum Vision of risk-adjusted global budgets and integrated care systems. Attaining this will require efforts from employers, providers and health plans alike.
A New Vision for California’s Healthcare System 39
SEC TION IX
ConclusionHealthcare in California is becoming less affordable to families, employers and governments. Our predominantly fee-for-service payment system often results in incentives that lead to uncoordinated care, fragmented care delivery, low-value services and sub-optimal population health. Although a national leader in HMOs and delegated care, California still has only 29% of its population receiving care through fully- or highly-integrated care systems. In California today, 78% of healthcare is still paid on a fee-for-service basis. When compounded with behavioral and environmental factors, these structural issues result in less-than-optimal health status and rapidly growing healthcare expenditures. We project that healthcare expenditures will increase to 17.1% of our Gross State Product by 2022, diverting resources from investments in areas such as education, housing and infrastructure. Typical California individuals and families with employer-sponsored insurance are expected to see total health insurance premiums representing about 18.2% and 32.2% of their household incomes by 2022, respectively.
There is evidence that as a result of the ACA, California’s healthcare delivery system is already evolving to foster more integrated care delivery and risk-based payments and to bring innovation and competition to the commercial, Medicare and Medi-Cal markets. Successfully tackling these challenges, however, requires a fundamental change in the financial and clinical incentives underlying healthcare. In the long term, the Forum believes that widespread adoption of risk-adjusted global budgets, or provider financial risk for the full spectrum of its patients’ healthcare needs, would most comprehensively align incentives and thus provide better healthcare at a more affordable cost. Risk-adjusted global budgets should encompass services ranging from prevention to curative to palliative care, among others.
As an intermediate step, the Forum supports various risk-based payment methods tied to accountability and improved outcomes, such as shared-savings, bundled or episode-based payments. The Forum believes that competing, integrated systems have the best chance of supporting the investments and risk management necessary for adoption of the Forum Vision. Realizing this Vision would free organizations from fragmented care and other constraints of fee-for-service medicine. It would also encourage prioritization of population health, adoption of proven chronic care management practices and implementation of palliative care principles. Innovative process changes would include shifts towards lower-cost sites of care, more effective use of the physician and non-physician workforce, and more rapid adoption of proven health information technologies and patient engagement tools.
The Forum endorses a two-part, 10-year goal. The first is a rapid shift towards risk-adjusted global budgets that will reduce the share of healthcare expenditures being paid via fee-for-service from the current 78% to 50% in 2022. The second is a doubling of the share of the state’s population receiving care via fully or highly integrated care systems from 29% to 60% by 2022. Attaining these targets will require a significant shift from the current payment and delivery paradigms. Today, there are almost 11 million Californians in Medicare fee-for-service and commercial PPO plans. In 2014, the estimated 700,000181 newly insured Californians entering the California Health Benefit Exchange through the ACA are more likely to be covered under a PPO plan rather than an HMO plan. Three million Medi-Cal members, including nearly 900,000 dual-eligibles, are currently in fee-for-service, although the state plans to transition much of this population to managed care over the coming years. For the approximately 8.5 million Californians served by partial risk arrangements, there remains a great opportunity for a transition into broader and deeper risk-based payment systems. Further, there is currently minimal alignment of incentives in caring for uninsured Californians, who today often receive care only in acute or emergency settings.
In order to help attain the 10-year goals mentioned above, Forum participants commit to work on policies, regulations and shared practices that would help facilitate implementation of risk-based payments and competing integrated care systems. Forum participants anticipate developing more expansive coordinated care systems that encompass a greater number of providers across the care continuum. Additionally, Forum leaders
181 Cal-Sim (2012) Enhanced Scenario estimates on net newly insured via commercial insurance in 2014. See Appendix III: “California Cost Curve, Healthcare Expenditures, and Premium Projections (Methodology)”.
40 Berkeley Forum | F E BRUA RY 201 3
hope to increase Medicare Advantage enrollment in the state. For Medicare and the commercial populations, they hope to expand both the population covered by risk-based contracts as well as the contracts’ scope and depth. The Forum favors new partnerships established with and among small provider organizations, including those in more rural parts of the state. Public and private sector Forum leaders hope to partner with each other to rapidly and effectively transition the dual-eligible, special needs and Medicaid populations to coordinated care settings.
To achieve these goals will require sustained collaboration by stakeholders in the healthcare, education, infrastructure and social services sectors, particularly to promote healthier environments and improved population health. Employers must be involved in implementing healthier worksites and offering higher-value health insurance choices. Forum leaders hope to develop and market affordable, integrated care offerings to self-insured employers. Implementation of the Forum Vision will also require working with federal policymakers on issues involving federal-state cooperation. These issues include better alignment of incentives across Medi-Cal and Medicare, along with improvements in traditional Medicare, Medicare ACO and Medicare Advantage programs. Additional areas that the Forum hopes to influence include rapid transformation of the safety net to include more coordinated care systems, as well as the development of provider risk-sharing arrangements in Medicaid.
As part of its Vision, the Forum also supports a transformational shift towards the purchasing of healthcare services that proactively support good health. The Forum would like to explore innovative government, market-driven or private-public financing and investment opportunities to promote healthy behaviors and environments. A prime example would be the implementation of state-wide walking campaigns. Also crucial is an increased reliance on palliative care in supporting the physical, emotional and spiritual needs of the seriously ill. Finally, the Forum endorses the seven initiatives analyzed in Section VI: “Addressing the Affordability Crisis: Bending the Cost Curve.” In addition to risk-adjusted global budgets/integrated care systems, increasing physical activity rates and increasing palliative care access, all of which the report has highlighted, the four other initiatives include increased use of patient-centered medical homes, increased use of nurse practitioners and physician assistants, reduced rates of healthcare-associated infections and reduced rates of preterm births.
Of course, there are challenges involved in achieving such a Vision. A major one involves developing new regulatory mechanisms to promote effective competition among large integrated care systems, in order to balance the efficiencies brought by integration with the potential for that integration to reduce market competition. Alternative integrated care structures to serve rural areas will need to be considered, such as referral hub and spoke models and increased use of telemedicine. Centers of excellence should also be considered. Healthcare stakeholders, along with employer organizations, will need to ensure that neither California’s dual insurance regulatory structure nor the shift towards self-funded insurance and consumer-directed healthcare detract from the Forum Vision. Finally, insurers and providers must work together with Medi-Cal and the Exchange Board to see that California implements the Affordable Care Act as effectively as possible, increasing coverage in a way that supports the goals of integrated care, aligned incentives and improved population health.
The challenges to attaining the Forum Vision are clearly worth facing. All Californians would benefit from a healthcare system that delivers value to patients and purchasers, is focused on improving outcomes and promotes prevention and population health. We conservatively estimate that healthcare expenditures as a share of our Gross State Product can be reduced by 2022 to 16.5% under the Forum Vision, as compared to status quo projections of 17.1%. Such a reduction in healthcare expenditures would free $110 billion, or 2.5% of total healthcare expenditures over the coming ten years. At the full adoption rates projected in 2022, these initiatives would reduce healthcare expenditures by 3.6% in the final year. The overall impact of these initiatives translates to $802 per California household annually over the coming ten years, and $1,422 in 2022.
How might the delivery system envisioned by the Forum look for the three Californians we met at the start of this report?182 On that Tuesday, Mr. Jones was facing a hospitalization for congestive heart failure. But perhaps that hospitalization and its resulting expenses could have been avoided if Mr. Jones had received coordinated team-based care, supported by a real-time monitoring device tracking his health. Once his illness advanced, Mr. Jones and his family would receive specialized physical, psychological and emotional assistance, as well as symptom and pain relief through a care process that prioritizes informed, shared-decision making. If before his disease had progressed, Mr. Jones had received the comprehensive health coaching common in chronic condition management programs, he might have been
182 The individuals referenced in this section are not real people (nor do their names represent specific persons). The people are illustrative sketches that represent a large group of individuals.
A New Vision for California’s Healthcare System 41
able to make the changes to his diet and physical activity levels that have been demonstrated to slow the progress of CHF and other chronic conditions.
Mrs. Wong, who endured a complicated pregnancy ending in a C-section, may benefit from the Forum Vision’s emphasis on providing greater value to both patients and purchasers. The Forum envisions Mrs. Wong being able to have high-quality data on outcomes and treatment options well before she needed care. When selecting among the health plans offered by her employer, she would be able to make an informed choice about the plan and provider right for her. Furthermore, under a care system that promotes long-term health outcomes and value, C-sections would be limited to situations of medical need, rather than personal preferences or unjustified practice variations among physicians.
For Mrs. Hernandez, who has kept her diabetes under control by receiving proactive management from her healthcare providers and by making changes in her lifestyle, implementing the Forum Vision might include a value-based insurance design that waives co-pays for maintenance medications or offers other incentives to keep her and her daughter healthy. Mrs. Hernandez
would have access to a support and educational network that includes other diabetic patients, and she would regularly communicate with her care team by phone or e-mail. Default options in Mrs. Hernandez’ workplace and community would promote walking, and her daughter’s after-school schedule would include numerous outdoor activities.
The above scenarios portray an achievable goal for how California’s healthcare system should function. While some Californians experience such care today, too many others are excluded from its benefits. California is uniquely positioned to demonstrate to the nation that the healthcare delivery system can be transformed to serve all residents in an affordable and effective way. The Forum strongly believes that efforts to make its Vision a reality must begin today.
42 Berkeley Forum | F E BRUA RY 201 3
0
10
20
30
40
50
60
70
80
<50 50 - 124 125 - 200 200 - 500 500 - 999 1000+
Num
ber o
f Gro
ups
Number of physicans in group
2004 2012
Number of physicans in group
2004 2012
-
2,000
4,000
6,000
8,000
10,000
12,000
<50 50 - 124 125 - 200 200 - 500 500 - 999 1000+
Num
ber o
f Liv
es (i
n 00
0s)
22%
13% 14%
10% 8%
33%
0%
5%
10%
15%
20%
25%
30%
35%
1 2-4 5-10 11-25 26-100 >100
Number of physicians in medical group
Appendix I: Additional Tables and Figures
FIGURE A1: PERCENT OF CALIFORNIA PHYSICIANS PRACTICING BY MEDICAL GROUP SIZE, 2011
FIGURE A2: DISTRIBUTION BY PRACTICE SIZE OF HMO-ACCEPTING PHYSICIAN PRACTICES IN CALIFORNIA (2004, 2012)
FIGURE A3: LIVES COVERED BY HMO- ACCEPTING PHYSICIAN PRACTICES IN CALIFORNIA (2004, 2012)
Notes: Medical groups can span multiple counties and size is defined by number of physicians in a common ownership structure, rather than number of physicians in a particular office location. SOURCE: IMS Health Incorporated (2010).
Notes: Only includes groups with six or more PCPs and at least one HMO contract, including Medi-Cal, Medicare and commercial.SOURCE: Berkeley Forum analysis using Cattaneo & Stroud Inc. (2012a).
A New Vision for California’s Healthcare System 43
l Commercial ACO
l Medicare Advanced Payment Model (APM)
l Medicare Pioneer ACO
l Medicare Shared Savings Program (MSSP)
FIGURE A4: Accountable Care Organizations by Type and County in California, 2013
TABLE A1: ORGANIZATIONAL AND PAYMENT CHARACTERISTICS OF CALIFORNIA VS. REST OF THE U.S. HOSPITALS, 2011
California Rest of the U.S.
Hospital is a member of health system 65% 57%
Average number of hospital beds / hospital 205 150
Average number of ICU beds / hospital 22.7 17.8
Total admissions / bed per year 43 34
Contracts directly w/employers on a shared-risk / capitated basis 7.3% 2.7%
Percent of hospital net patient revenue paid on a capitated basis 2.9% 0.6%
Percent of hospital net patient revenue paid on a shared risk basis 4.8% 0.6%
SOURCE: Map created by Berkeley Forum using Cattaneo & Stroud Inc. (2013).
Notes: Analysis was conducted at the individual hospital level with the following sample sizes: California (422) and Rest of the U.S. (5,912). All reported statistics are unadjusted means or proportions. The California results are statistically different than the Rest of the U.S. results at the 0.05 significance level. SOURCE: Berkeley Forum analysis using American Hospital Association (2011) database.
44 Berkeley Forum | F E BRUA RY 201 3
TABLE A2: List of Accountable Care Organizations Operating in California, 2013ACO Name Sponsor County ACO Type Lives
ServedTotal
PhysiciansAllCare IPA/Doctors Medical Center Blue Shield Merced, Stanislaus Commercial ACO 8,000 519
Access Medical Group/St. Johns Health Center/NantWorks Blue Shield Los Angeles Commercial ACO 7,000 305
Accountable Care Clinical Services/ Preferred ACO Medicare Los Angeles MSSP 2,500 25
Accountable Care Clinical Services-Orange Medicare Orange MSSP 500 8
Affilitated Physicians Medical Group ACO Medicare Los Angeles, Orange MSSP 10,000 75
Akira Health Medicare Santa Clara MSSP 5,000 36
APCN-ACO Medicare Los Angeles MSSP 9,800 125
ApolloMed Accountable Care Organization Medicare Los Angeles MSSP 10,000 175
AppleCare Medical Group Medicare Los Angeles, Orange MSSP 8,000 250
Brown & Toland Physicians Medicare Alameda, Contra Costa, San Francisco, San Mateo Pioneer ACO 17,000 190
Brown & Toland Physicians CIGNA San Francisco Commercial ACO 6,000 650
Brown & Toland/CPMC Blue Shield San Francisco Commercial ACO 23,000 1373
Cedars-Sinai Medical Center Medicare Los Angeles MSSP 8,000 215
Golden Life Healthcare APMButte, Colusa, El Dorado, Nevada, Placer, Sacramento, Yolo, Sutter,
San Diego Independent ACO Medicare San Diego MSSP 5,000 96
Santa Clara County IPA Blue Flex Santa Clara Commercial ACO 26,000 814
Sharp HealthCare Aetna San Diego Commercial ACO 2,200 656
Sharp HealthCare Blue Flex San Diego Commercial ACO 22,000 1114
Sharp HealthCare Medicare San Diego Pioneer ACO 32,000 800
St. Joseph Health Blue Shield Los Angeles, Orange Commercial ACO 37,000 1318
UCLA ACO Medicare Los Angeles MSSP 19,000 1450
Torrance Memorial Integrated Physicians Medicare Los Angeles MSSP 15,000 355
Total 623,700
Notes: The number of physicians is not totaled, because many physicians are part of multiple ACOs. SOURCE: Cattaneo & Stroud Inc. (2013).
A New Vision for California’s Healthcare System 45
TABLE A3: SELECTED HEALTHCARE QUALITY MEASURES IN CALIFORNIA AND THE UNITED STATES
TABLE A4: CARE MANAGEMENT PRACTICES (CMPS) AMONG PHYSICIAN ORGANIZATIONS WITH TWENTY OR MORE PHYSICIANS IN CALIFORNIA AND THE REST OF THE U.S., 2006 – 2007
183 Shortell (2011) and Rittenhouse, et al. (2010). For the last decade, the National Survey of Physician Organizations has collected extensive data from physician organizations of all sizes. The survey has collected information on practice size, ownership, type, and volume of patients seen; management and governance of the organization; compensation models; relationships with health plans; and implementation of care management processes (CMPs) and quality improvement approaches — with a specific focus on four key chronic illnesses (asthma, congestive heart failure, depression, and diabetes).
California U.S.
Preventive Care Quality Measures
Adults 18+ who have not had their blood cholesterol checked within the last 5 years 25% 26%
Adults 50-75 years who have never received a colorectal cancer screening 42% 36%
Acute Care Quality Measures
Hospital patients with pneumonia who did not receive recommended care practices 8% 7%
Heart attack patients not receiving percutaneous coronary intervention (PCI) within 90 minutes of hospital arrival 12% 12%
Chronic Care Quality Measures
Diagnosed diabetics over 40 years old who have not received flu vaccine in the last 12 months 46% 29%
Patient Experience/Satisfaction
Patients reporting that staff sometimes or never explained medicines prior to giving them 25% 24%
Patients reporting that they were not given information about what to do during recovery 20% 18%
Type of CMPDiabetes Asthma CHF Depression All Four Conditions
Rest of the U.S. CA Rest of the U.S. CA Rest of the U.S. CA Rest of the U.S. CA Rest of the U.S. CA
Patient list or registry 64.7% 80.3%* 54.7% 76.6%* 52.3% 70.6%* 38.7% 44.8% 36.7% 43.6%
Percent using all 6 CMPs1 19.7% 25.1% 8.3% 14.7%* 9.2% 11.7% 4.0% 5.2% 3.4% 4.1%
Mean # of CMPs used (out of 6)1 3.5 4* 2.6 3.3* 2.7 3* 1.8 1.7 10.6 12.1*
SOURCE: AHRQ National Healthcare Quality Report 2011.
Notes: An asterisk indicates a statistically significant difference (p<0.05) between California and the rest of the United States. (1) The last two rows of the “All Four Conditions” column refer to the percent of physician organizations using all six Care Management Practices (CMPs) for all four conditions, and the mean number of CMPs used across all four conditions, respectively. SOURCE: Berkeley Forum analysis of National Study of Physicians Organizations 2 (NSPO2).183
46 Berkeley Forum | F E BRUA RY 201 3
Ratio of mean expenditures of cohort to mean expenditures of population:
24.4 10.7 6.9 3.6 2.0 0.04 1.0
0% 10% 20% 30% 40% 50% 60% 70% 80% 90%
100%
Top 1%
Top 5%
Top 10%
Top 25%
Top 50%
Bottom 50%
All
Shar
e of
Exp
endi
ture
s
FIGURE A5: SHARE OF HEALTHCARE EXPENDITURES ACCOUNTED FOR BY CALIFORNIA POPULATION COHORTS RANKED BY EXPENDITURES, 2009
Notes: Results account for the MEPS-Household Component complex survey design using California state-based weights.SOURCE: Berkeley Forum analysis using MEPS-Household Component, 2009.
A New Vision for California’s Healthcare System 47
VariablesFull
Sample (N=5,803)
Top 5% of Spenders
(N=236)
Bottom 95% of Spenders (N=5,567)
Ratio of Top 5% to Bottom 95%
(1)
DEMOGRAPHIC CHARACTERISTICS
Female 50% 64% 50% 1.3 ***Age (years):
0 to 2 5% 2% 5% 0.4 ***3 to 19 28% 8% 29% 0.3 ***20 to 29 13% 9% 13% 0.730 to 39 13% 8% 14% 0.6 ***40 to 49 13% 13% 13% 1.050 to 59 13% 25% 12% 2.1 **60 to 69 8% 14% 7% 1.9 ***70 to 79 4% 9% 4% 2.5 ***80+ 3% 13% 2% 6.0 ***
Less than high school 25% 17% 26% 0.7 ***High school or equivalent degree 42% 47% 42% 1.1Some college 6% 5% 6% 0.8College degree 17% 18% 17% 1.0Some graduate school 9% 13% 9% 1.5
100% 100% 100%
TABLE A5: DEMOGRAPHIC CHARACTERISTICS AND MEDICAL CONDITIONS OF TOP 5% VS. BOTTOM 95% HEALTHCARE EXPENDITURE COHORTS IN CALIFORNIA, 2009
SEE NOTES ON FOLLOWING PAGE
48 Berkeley Forum | F E BRUA RY 201 3
TABLE A5 (CONTINUED): DEMOGRAPHIC CHARACTERISTICS AND MEDICAL CONDITIONS OF TOP 5% VS. BOTTOM 95% HEALTHCARE EXPENDITURE COHORTS IN CALIFORNIA, 2009
VariablesFull
Sample (N=5,803)
Top 5% of Spenders
(N=236)
Bottom 95% of Spenders (N=5,567)
Ratio of Top 5% to
Bottom 95% (1)
PRIORITY CONDITIONS (ever had, ages 18+ [except when noted])
High blood pressure 28% 56% 26% 2.1 ***
Heart disease (any type) 10% 28% 9% 3.1 ***
Heart disease (coronary) 4% 15% 3% 4.3 ***
Heart disease (angina or angina pectoris)
3% 9% 2% 4.2 **
Heart disease (heart attack or myocardial infarction)
3% 11% 2% 4.9 ***
Heart disease (other) 8% 18% 7% 2.6 ***
Stroke or transient ischemic attack 3% 11% 2% 5.4 ***
Emphysema 1% 7% 1% 6.2 **
Chronic bronchitis 1% 2% 1% 3.2
High cholesterol 29% 46% 28% 1.6 ***
Cancer 9% 24% 8% 3.0 ***
Diabetes 8% 21% 7% 2.9 ***
Joint pain 17% 41% 16% 2.6 ***
Arthritis 18% 48% 16% 2.9 ***
Asthma (all ages) 9% 20% 8% 2.5 ***
ADHD/ADD (ages 5 to 17) 6% 13% 5% 2.4
Number of priority conditions:
Mean 1.0 2.8 0.9 3.2 ***
0 57% 22% 58% 0.4 ***
1 18% 12% 19% 0.6 ***
2 10% 15% 10% 1.4 *
3 7% 19% 6% 3.1 ***
4+ 8% 32% 7% 5.0 ***
100% 100% 100%
BODY MASS INDEX (BMI)
Underweight 1% 3% 1% 3.4
Normal weight 25% 27% 25% 1.1
Overweight 26% 28% 26% 1.1
Obese 17% 33% 17% 2.0 ***
No response (includes all children) 31% 9% 32% 0.3 ***
100% 100% 100%
(1) Ratio is statistically different than 1 at the following significance levels: *p<0.1, **p<0.05, ***p<0.01(2) Other public insurance includes individuals with, for example, county-based plans and individuals who had a mix of different types of public plans during the year. Note: All results account for MEPS complex survey design using California state-based weights. The reported sample sizes (N) are for the full sample; however, some variables had missing values. The sample of the 236 top 5% spenders represents 5% of the weighted sample. SOURCE: Berkeley Forum analysis using Medical Expenditure Panel Survey—Household Component, 2009.
A New Vision for California’s Healthcare System 49
56% 54% 53% 49%
45%
0%
10%
20%
30%
40%
50%
60%
2006 2007 2008 2009 2010
$0
$5,000
$10,000
$15,000
$20,000
$25,000
$30,000
$35,000
1999
2000
2001
2002
2003
2004
2005
2006
2007
2008
2009
2010
2011
2012
2013
2014
2015
2016
2017
2018
2019
2020
2021
2022
Single coverage Family coverage
ProjectedHistorical
FIGURE A6: SHARE OF MEDI-CAL’S TOP 5% HEALTHCARE SPENDING COHORT IN 2005 THAT REMAINED IN THE TOP 5% FROM 2006 – 2010
FIGURE A7: Historical (1999 – 2011) and Projected (2012 – 2022) Employer-Sponsored Health Insurance Premiums for Single and Family Coverage in California
SOURCE: California Department of Health Care Services (2012).
Notes: Premiums include both the employer and employee contributions. Premiums are reported in current-year dollars.SOURCE: See Appendix III: “California Cost Curve, Healthcare Expenditures and Premium Projections (Methodology)” for sources and more detail.
50 Berkeley Forum | F E BRUA RY 201 3
BibliographyAgency for Healthcare Research and Quality. (2011). National Healthcare Quality and Disparities Reports. Rockville, MD: U.S. Department of Health and Human Services. http://www.ahrq.gov/qual/qrdr11.htm. Accessed in October 2012.
America’s Health Insurance Plans, Center for Policy & Research. (2009). Reductions in Hospital Days, Re-admissions, and Potentially Avoidable Admissions Among Medicare Advantage Enrollees in California and Nevada, 2006. Washington DC: Centers for Policy & Research. October 2009.
American Hospital Association. (2011). AHA Annual Survey Database Fiscal Year 2011. http://www.ahadataviewer.com/book-cd-products/aha-survey/. Accessed in August 2012.
Bates, T., Blash, L., Chapman, S., Dower, C., and O’Neil, E. (2011). California’s Health Care Workforce: Readiness for the ACA Era. University of California, San Francisco: Center for the Health Professions-UCSF.
Behavioral Risk Factor Surveillance System (2010). Prevalence and Trends Data: California 2010, Diabetes. Atlanta, Georgia: Centers for Disease Control and Prevention. http://apps.nccd.cdc.gov/brfss/. Accessed on February 18, 2012.
Behavioral Risk Factor Surveillance System (2011). Prevalence and Trends Data: Overweight and Obesity. U.S. Obesity Trends, Trends by State 2011. Atlanta, Georgia: Centers for Disease Control and Prevention. http://apps.nccd.cdc.gov/brfss/. Accessed on February 18, 2012.
Behavioral Risk Factor Surveillance System (2012). Prevalence and Trends Data (1995-2010). Atlanta, Georgia: Centers for Disease Control and Prevention. http://apps.nccd.cdc.gov/brfss/. Accessed in December 2012.
Berenson, R. A., Ginsburg, P. B., and Kemper, N. (2010). Unchecked provider clout in California foreshadows challenges to health reform. Health Aff (Millwood), 29(4), 699-705.
Bindman, A. B., Chu, P. W., and Grumbach, K. (2010). Physician Participation in Medi-Cal, 2009. California Healthcare Foundation. http://www.chcf.org/~/media/MEDIA LIBRARY Files/PDF/P/PDF PhysicianParticipationMediCal2008.pdf. Accessed on November 15, 2012.
Blom, B., Hawley, C., and Marcellino, A. (2012). An Update to the Budget and Economic Outlook: Fiscal Years 2012 to 2022. Congress of the United States, Congressional Budget Office. http://www.cbo.gov/publication/43539. Accessed in December 2012.
Bowers, L., Handel, B., Varanini, E., and Scheffler, R. (2011). Accountable Care Organizations and Antitrust Conference: Briefing Document, Berkeley, CA: Nicholas C. Petris Center, Working Paper.
California Association of Physician Groups. (2012). Case Studies of Excellence 2012. http://www.capg.org/modules/showdocument.aspx?documentid=745. Accessed in February 2013.
California Center for Public Health Advocacy. (2009). The Economic Costs of Overweight, Obesity, and Physical Inactivity Among California Adults–2006. New Bern, North Carolina.
California Center for Public Health Advocacy. (2006). Dropping the ball: schools fail to meet physical education mandates. Davis CA: California Center for Public Health Advocacy. http://www.publichealthadvocacy.org/droppingtheball.html. Accessed in February 2013.
California Coalition for Compassionate Care. (2009). POLST in California Communities: First-Year Experience and Lessons Learned. Prepared by Kathy Glasmire. Center for Healthcare Decisions. March 2009. http://coalitionccc.org/_pdf/POLST-in-California-Communities.pdf. Accessed on February 14, 2013.
California Department of Finance. (2012). State of CaliforniaFinal Budget Summary Sacramento, CA: California Department of Finance, 2012 (August release date). http://www.documents.dgs.ca.gov/osp/GovernorsBudget/pdf/Governors_Budget_2012-2013.pdf. Accessed on February 15, 2013.
California Department of Health Care Services. (2012). The Concentration of Health Care Spending Among Medi-Cal Beneficiaries. Sacramento, CA: Presentation by DHCS—Research and Analytic Studies Branch. August 2012.
California Department of Managed Health Care. (2012). Right Care Initiative. http://www.hmohelp.ca.gov/healthplans/gen/gen_rci.aspx. Accessed on February 18, 2013.
California Department of Public Health. (2009-2010). CDPH Technical Report: Healthcare Associated Bloodstream Infections in California Hospitals. (January 2009–March 2010). http://www.cdph.ca.gov/programs/hai/Documents/HAIReportSB-1058BSI-FINAL.pdf. Accessed on November 8, 2012.
California Department of Public Health. (2011). Birth Statistical Data Tables. http://www.cdph.ca.gov/data/statistics/Pages/StatewideBirthStatisticalDataTables.aspx. Accessed on February 18, 2013.
California Health and Human Services Agency. (2012). Let’s Get Healthy California Task Force Report.
California HealthCare Foundation. (2004-2011). California Employer Health Benefits Survey. http://www.chcf.org/publications/2011/12/employer-health-benefits. Accessed in December 2012.
A New Vision for California’s Healthcare System 51
California HealthCare Foundation. (2009a). California Health Care Almanac: Medi-Cal Facts and Figures.
California HealthCare Foundation. (2009b). Shifting ground: Erosion of the delegated model in California. California HealthCare Almanac: Regional Markets Issue Brief.
California HealthCare Foundation. (2012). When Compassion is the Cure: Progress and Promise in Hospital-Based Palliative Care.
California Healthline. (2011). CMS Initiative Will Link Incentives with Reduced Infections, Readmissions. January 31, 2011. http://www.californiahealthline.org/articles/2011/1/31/cms-initiative-will-link-incentives-with-reduced-infections-readmissions.aspx . Accessed in November 2012.
California Healthline. (2012). Census Bureau Report: California Had Ninth Highest Rate of Uninsured in 2010. August 20, 2012. http://www.californiahealthline.org/articles/2012/8/30/report-california-had-ninth-highest-rate-of-uninsured-in-2010.aspx . Accessed on September 10, 2012.
California Health Interview Survey (2009). UCLA Center for Health Policy Research. http://healthpolicy.ucla.edu/chis/Pages/default.aspx. Accessed in October 2012.
California Office of Statewide Health Planning and Development. (2010). Hospital Annual Financial Disclosure Report (Vol. 2012). Sacramento: OSHPD.
California Office of Statewide Health Planning and Development. (2012). Preventable Hospitalizations in California: Statewide and County Trends in Access to and Quality of Outpatient Care Measured with Prevention and Quality Indicators (PQIs) 2005-2009.
Casalino, L., Gillies, R., Shortell, S., Schmittdiel, J., Bodenheimer, T., Robinson, J., Rundall, T., Oswald, N., Schauffler, H., and Wang, M. (2003). External incentives, information technology, and organized processes to improve health care quality for patients with chronic diseases. JAMA, 289(4), 434-441.
Cattaneo & Stroud Inc. (2004-2009). Cattaneo & Stroud Report #7: Active California Medical Groups by County by Line of Business. Burlingame, CA: Cattaneo & Stroud Inc.
Cattaneo & Stroud Inc. (2012a). HMO Medical Group Enrollment Reports 2004-2012. Burlingame, CA: Cattaneo & Stroud Inc.
Cattaneo & Stroud Inc. (2012b). Overview of HMO Lives in California Comparing March 2011 to 2012. Burlingame, CA: Cattaneo & Stroud Inc. http://www.cattaneostroud.com/reports/OVERVIEW_HMO_LIVES_11-12.pdf. Accessed on December 7, 2012.
Cattaneo & Stroud Inc. (2013). ACO Report #1: Summary Data for ACOs in Alpha Order, January 2013. Burlingame, CA: Cattaneo & Stroud Inc.
Center to Advance Palliative Care. Policies and Tools for Hospital Palliative Care Programs: A Crosswalk of National Quality Forum Preferred Practices. New York, NY.
Centers for Disease Control and Prevention. (2011). Births: Preliminary Data for 2011. National Vital Statistics Reports, Vol. 61, No. 5, October 3, 2012.
Centers for Medicare & Medicaid Services. (2009). Table 1: National Health Expenditures; Aggregate and Per Capita Amounts, Annual Percent Change and Percent Distribution: Selected Calendar Years 1960-2011. http://www.cms.gov/Research-Statistics-Data-and-Systems/Statistics-Trends-and-Reports/NationalHealthExpendData/Downloads/tables.pdf. Accessed on February 19, 2013.
Centers for Medicare & Medicaid Services. (2012). Accountable Care Organization 2013 Program Analysis: Quality Performance Standards Narrative Measure Specifications.
Colla, C., Wennberg, D., Meara, E., Meara, E., Skinner, J., Gottlieb, D., Lewis, V., Snyder, C., and Fisher, E. (2012). Spending differences associated with the medicare physician group practice demonstration. JAMA, 308(10), 1015-1023.
Commonwealth Fund. (2009). State Scorecard Data Tables, a Supplement to Aiming Higher: Results from a State Scorecard on Health System Performance. http://www.commonwealthfund.org/~/media/Files/Publications/Fund%20Report/2009/Oct/State_ Scorecard_data_tables_2009_COMPLETE_v2.pdf. Accessed on February 19, 2013.
Commonwealth Fund. (2013). Confronting Costs: Stabilizing U.S. Health Spending While Moving Toward a High Performance Health Care System. January 2013. http://www.commonwealthfund.org/~/media/Files/Publications/Fund Report/2013/Jan/1653_Commission_confronting_costs_web_FINAL.pdf. Accessed in January 2013.
Cook, R. M. (2011). Palliative Care Access Act-Dear CEO/Administrator Letter: New York State, Department of Health. December 14, 2011. http://www.health.ny.gov/professionals/patients/patient_rights/palliative_care/2011-12-14_dear_ceo_palliative_care_access_act.htm. Accessed in December 2012.
Crosson, F. J. (2005). The delivery system matters. Health Aff (Millwood), 24(6), 1543-1548.
Crosson, F. J. (2011). Analysis and commentary: The accountable care organization. Whatever its growing pains, the concept is too vitally important to fail. Health Aff (Millwood), 30(7), 1250-1255.
Cuckler, G., Martin, A., Whittle, L., Heffler, S., Sisko, A., Lassman, D., and Benson, J. (2011). Health Spending by State of Residence, 1991 – 2009. Centers for Medicaid and Medicare Services.
52 Berkeley Forum | F E BRUA RY 201 3
Cutler, D. M. (1995). Technology, Health Costs, and the NIH. Harvard University and the National Bureau of Economic Research. National Institutes of Health Economics Roundtable on Biomedical Research.
Dall, T. M., Zhang, Y., Chen, Y. J., Quick, W. W., Yang, W. G., and Fogli, J. (2010). The economic burden of diabetes. Health Aff (Millwood), 29(2), 297-303.
Dartmouth Atlas of Healthcare. (2012). Percent of Decedents Spending 7 or More Days in ICU/CCU During the Last Six Months of Life, by Gender; Inpatient Days per Decedent, by Interval Before Death and Level of Care Intensity. http://www.dartmouthatlas.org/. Accessed on February 18, 2013.
Eibner, C. E., Hussey, P. S., Ridgely, M. S., and McGlynn, E. A. (2009). Controlling Health Care Spending in Massachusetts: An Analysis of Options. Santa Monica, CA: RAND Corporation.
Enthoven, A. C. (1993). The history and principles of managed competition. Health Aff (Millwood), 12 Suppl, 24-48.
Finkelstein, E. A., Khavjou, O. A., Thompson, H., Trogdon, J. G., Pan, L., Sherry, B., and Dietz, W. (2012). Obesity and severe obesity forecasts through 2030. Am J Prev Med, 42(6), 563-570.
Franks, P. W., Hanson, R. L., Knowler, W. C., Sievers, M. L., Bennett, P. H., & Looker, H. C. (2010). Childhood obesity, other cardiovascular risk factors, and premature death. N Engl J Med, 362(6), 485-493.
Frohlich, J. P. B., Pawlak, B., Smith, M. E., and Bernstien, W. S. (2011). Implementing National Health Reform in California: Payment and Delivery System Changes. California Healthcare Foundation.
Gans, D., Kominski, G. F., Roby, D. H., Diamant, A., Xiao, C., Lin, W., and Hohe, N. (2012). Better Outcomes, Lower Costs: Palliative Care Program Reduces Stress, Costs of Care for Children With Life-Threatening Conditions. UCLA Center for Health Policy Research. August 2012. http://healthpolicy.ucla.edu/publications/Documents/PDF/ppcpolicybriefaug2012.pdf. Accessed on November 3, 2012
Glasmire, K. (2011). Be Prepared: Reducing Nursing Home Transfers Near End of Life. California HealthCare Foundation. http://www.chcf.org/~/media/MEDIA%20LIBRARY%20Files/PDF/B/PDF%20BePreparedReducingNursingHomeTransfers.pdf. Accessed in December 2012.
Glickman, D., Parker, L., Sim, L. J., Cook, H. D. V., and Miller, E. A. (2012). Accelerating Progress in Obesity Prevention: Solving the Weight of the Nation. Institute of Medicine of The National Academy of Sciences.
Group Health Association of America. (1977). National HMO Census Survey 1976-1977. Washington, DC: Group Health Association of America.
Gruber, L. R., Shadle, M., and Polich, C. L. (1988). From movement to industry: the growth of HMOs. Health Affairs, 7(3), 197-208.
Hadley, J., Holahan, J., Coughlin, T., and Miller, D. (2008). Covering the Uninsured in 2008: Key Facts about Current Costs, Sources of Payment, and Incremental Costs. Washington, DC: Kaiser Commission on Medicaid and the Uninsured.
Harvey, H., and Hearne, J. (2012). Estimates for the Insurance Coverage Provisions of the Affordable Care Act Updated for the Recent Supreme Court Decision. Congressional Budget Office. http://www.cbo.gov/publication/43472. Accessed in December 2012.
Hospice Association of America. (2012). Regulatory Blueprint for Action. http://www.nahc.org/facts/HAAReg2012.pdf. Accessed in January 2013.
Hu, F., Willett, W., Li, T., Stampfer, M., Colditz, G., and Manson, J. (2004). Adiposity as compared with physical activity in predicting mortality among women. N Engl J Med, 351(26).
IMS Health Incorporated. (2010). Data and Information Resources. Norwalk, CT: IMS Health.
Institute of Medicine. (2001). Crossing the Quality Chasm: A New Health System for the 21st Century. National Academy of Sciences. March 2001.
Kahn, E. B., Ramsey, L. T., Brownson, R. C., Heath, G. W., Howze, E. H., Powell, K. E., Stone, E. J., Rajab, M. W., and Corso, P. (2002). The effectiveness of interventions to increase physical activity: A systematic review. American Journal of Preventive Medicine, 22(4, Supplement 1), 73-107.
Kaiser Family Foundation (1993-2003). Employer Health Benefits Annual Survey Archives. http://www.kff.org/insurance/ehbs-archives.cfm. Accessed in December 2012.
Kaiser Family Foundation (2004). State Health Facts. Total Medicare Advantage (MA) Enrollment, 2004. http://www.statehealthfacts.org/comparetable.jsp?yr=14&typ=1&ind=327&cat=6&sub=79%202012. Accessed on December 2012.
Kaiser Family Foundation (2009a). State Health Facts. California: Health Spending by Service by State of Provider (in millions), 2009. http://www.statehealthfacts.org/profileind.jsp?cmprgn=1&cat=5&rgn=6&ind=262&sub=65. Accessed on February 17, 2013.
Kaiser Family Foundation (2009b). State Health Facts. Health Care Expenditures per Capita by State of Residence, 2009. http://www.statehealthfacts.org/comparetable.jsp?ind=596&cat=5&sub=143&yr=92&typ=4&sort=a. Accessed on February 17, 2013.
Kaiser Family Foundation (2010). State Health Facts. California: Hospital Utilization. http://www.statehealthfacts.org/profileind.jsp?cat=8&sub=217&rgn=6. Accessed on February 19, 2013.
A New Vision for California’s Healthcare System 53
Kaiser Family Foundation (2011). State Health Facts. Health Insurance Coverage of the Total Population, states (2010-2011), U.S. (2011) http://www.statehealthfacts.org/comparetable.jsp?ind=125&cat=3. http://www.statehealthfacts.org/profileind.jsp?cmprgn=1&cat=1&rgn=6&ind=875&sub=2. Accessed on February 17, 2013.
Kaiser Family Foundation. (2012a). State Health Facts. State HMO Penetration Rate, July 2011. http://www.statehealthfacts.org/comparetable.jsp?yr=270&typ=2&ind=349&cat=7&sub=85. Accessed on February 17, 2013.
Kaiser Family Foundation. (2012b). State Health Facts. California: Life Expectancy at Birth (in years), 2007. http://www.statehealthfacts.org/profileind.jsp?ind=784&cat=2&rgn=6, Accessed on February 17, 2013.
Kaiser Family Foundation. (2012c). State Health Facts. Hospital Adjusted Expenses per Inpatient Day, 2010. www.statehealthfacts.org/comparemaptable.jsp?ind=273&cat=5. Accessed on February 17, 2013.
Kaiser Family Foundation (2012d). State Health Facts. Total Medicare Advantage (MA) Enrollment, 2012. http://www.statehealthfacts.org/comparetable.jsp?yr=255&typ=1&ind=327&cat=6&sub=79. Accessed on February 17, 2013.
Kaiser Family Foundation (2012e). State Health Facts. Medicaid-to-Medicare Fee Index, 2008. http://www.statehealthfacts.org/comparetable.jsp?ind=196&cat=4. Accessed on February 18, 2013.
Kaiser Family Foundation (2012f). State Health Facts. California: Percent of Children (10-17) who are Overweight or Obese, 2007. http://www.statehealthfacts.org/profileind.jsp?rgn=6&ind=51. Accessed February 19, 2013.
Kane, Turnbull, and Schoen. (1996). Markets and Plan Performance: Case Studies of IPA and Network HMO. Commonwealth Fund. http://www.commonwealthfund.org/Publications/Fund-Reports/1996/Jan/Markets-and-Plan-Performance\Case-Studies-of-IPA-and-Network-HMOs.aspx. Accessed on November 15, 2012.
Landon, B. E., Zaslavsky, A. M., Saunders, R. C., Pawlson, L. G., Newhouse, J. P., and Ayanian, J. Z. (2012). Analysis Of Medicare Advantage HMOs compared with traditional Medicare shows lower use of many services during 2003-09. Health Aff (Millwood), 31(12), 2609-2617.
Lavarreda, A., Cabezas, L., Jacobs, K., Roby, D. H., Pourat, N., and Kominski, G. F. (2012). The State of Health Insurance in California: Findings from the 2009 California Health Interview Survey. Los Angeles, CA:UCLA Center for Health Policy Research.
Lee, I. M., Shiroma, E. J., Lobelo, F., Puska, P., Blair, S. N., and Katzmarzyk, P. T. (2012). Effect of physical inactivity on major non-communicable diseases worldwide: an analysis of burden of disease and life expectancy. The Lancet, 380(9838), 219-229.
Lewin Group (2010). Bending the Health Care Cost Curve in New York State: Options for Saving Money and Improving Care. July 2010. Prepared for NYS Health Foundation.
Levi, J., Segal, L. M., Laurent, R. S., Lang, A., and Rayburn, J. (2012). F as in Fat: How Obesity Threatens America’s Future 2012. Robert Wood Johnson Foundation.
Markovich, P. (2012). A global budget pilot project among provider partners and Blue Shield of California led to savings in first two years. Health Aff (Millwood), 31(9), 1969-1976.
Martin, A. B., Lassman, D., Washington, B., Catlin, A., and National Health Expenditure Accounts Team. (2012). Growth in US health spending remained slow in 2010; health share of gross domestic product was unchanged from 2009. Health Aff (Millwood), 31(1), 208-219.
McCarthy, D., Mueller, K., and Wrenn, J. (2009). Kaiser Permanente: Bridging the Quality Divide with Integrated Practice, Group Accountability and Health Information (pp. 20). The Commonwealth Fund.
Meier, D. (2012). Presentation from Meier, Diane (Center to Advanced Palliative Care) on 4/17/2012. Title of the Presentation: Payers Have Skin in This Game.
Mathematica Policy Research/Kaiser Family Foundation Analysis of CMS Medicare Advantage enrollment and landscape files 2011-2012. http://www.kff.org/medicare/upload/8323.pdf. Accessed in December 2012.
Naito, M., Nakayama, T., Okamura, T., Miura, K., Yanagita, M., Fujieda, Y., Kinoshita, F., Naito, Y., Nakagawa, H., Tanaka, T., et al. (2008). Effect of a 4-year workplace-based physical activity intervention program on the blood lipid profiles of participating employees: The high-risk and population strategy for occupational health promotion (HIPOP-OHP) study. Atherosclerosis, 197(2), 784-790.
Newhouse, J. P. (1992). Medical Care Costs: How Much Welfare Loss. Journal of Economic Perspectives, Summer; 6(3):3-21.
Newhouse, J. P. (1993). The Insurance Experiment Group. Free for All? Lessons from the RAND Health Insurance Experiment. Cambridge, MA: Harvard University.
O’Malley, A. S., Bond, A. M., and Berenson, R. A. (2011). Issue Brief: Rising Hospital Employment of Physicians: Better Quality, Higher Costs? (Vol. 136). Center for Studying Health System Change. August 2011.
O’Malley, A. S., Bond, A. M., and Berenson, R. A. (2012). Snapshot Final Chapter: Californians’ Attitudes and Experiences with Death and Dying. California HealthCare Foundation. http://www.chcf.org/publications/2012/02/final-chapter-death-dying. Accessed in December 2012.
Oregon Health & Science University. (2011). Oregon POLST Registry Annual Report. http://public.health.oregon.gov/ProviderPartnerResources/EMSTraumaSystems/PhysicianOrdersforLifeSustainingTreatment/Documents/2011/2010%20POLST%20Registry%20Annual%20Report_FINAL.PDF. Accessed in January 2013.
Rittenhouse, D. R., Casalino, L. P., Gillies, R. R., Shortell, S. M., and Lau, B. (2008). Measuring the medical home infrastructure in large medical groups. Health Aff (Millwood), 27(5), 1246-1258.
Rittenhouse, D. R., Casalino, L. P., Gillies, R. R., Shortell, S. M., Robinson, J. C., McCurdy, R., and Siddique, J. (2010). Improving chronic illness care: findings from a national study of care management processes in large physician practices. Medical Care Research and Review, 67(3).
Robinson, J. C. (1996). Decline in hospital utilization and cost inflation under managed care in California. JAMA, 276(13), 1060-1064.
Robinson, J. C. (2001). Physician Organization In California: Crisis And Opportunity. Health Aff (Millwood), 20(4), 81-96.
Robinson, J. C. (2011). Hospital Market Concentration, Pricing and Profitability in Orthopedic Surgery and Interventional Cardiology. The American Journal of Managed Care, 17(6), 241-248.
Robinson, J. C. and Casalino, L. P. (1995). The growth of medical groups paid through capitation in California. NEJM, 333(25),1684-1687.
Rosenthal, M.B., Frank, R.G., Buchanan, J.L., Epstein, A.M. (2001). Scale and Structure of Capitated Physician Organizations in California. Health Aff (Millwood), 20(4), 109-119.
Sacco, M., Mosebach, D., and Eickemeyer, D. (2011). An overview of advanced certfication in palliative care. The Joint Commission-Certification Palliative Care. http://www.capc.org/20110720.pdf. Accessed on February 15, 2013.
Sanofi (2012). California Health Care Data Summary 2012 – 2013, 5th edition. Managed Care Digest Series. http://www.capg.org/modules/showdocument.aspx?documentid=904. Accessed in February 2013.
Scheffler, R. M., Shortell, S. M., and Wilensky, G. R. (2012). Accountable care organizations and antitrust: Restructuring the health care market. JAMA, 307(14), 1493-1494.
Short, K. (2012). The Research Supplemental Poverty Measure: 2011. Current Population Reports. P60-244. November 2012. http://www.census.gov/prod/2012pubs/p60-244.pdf. Accessed on February 15, 2013.
Shortell, S. M. (2011). National Study of Physician Organizations and the Management of Chronic Illness II (NSPO2), 2006-2007. Ann Arbor, MI: Inter-University Consortium for Political and Social Research.
Shortell, S., and Schmittdiel, J. (2004). Prepaid Groups and Organized Delivery Systems Promise Performance and Potential. San Francisco, CA: Jossey-Bass.
Singer, S., and Shortell, S. (2011). Implementing accountable care organizations: Ten potential mistakes and how to learn from them. JAMA, 306(7), 758-759.
Smith, S. D., Heffler, S. K., and Freeland, M. S. (2000). The Impact of Technological Change on Health Care Cost Increases: An Evaluation of the Literature (working paper).
Smith, S., Newhouse, J. P., & Freeland, M. S. (2009). Income, insurance, and technology: why does health spending outpace economic growth? Health Aff (Millwood), 28(5), 1276-1284.
Smith, T. J., Temin, S., Alesi, E. R., Abernethy, A. P., Balboni, T. A., Basch, E. M., Ferrell, B. R., Loscalzo, M., Meier, D. E., Paice, J. A., et al. (2012). American Society of Clinical Oncology provisional clinical opinion: the integration of palliative care into standard oncology care. J Clin Oncol, 30(8), 880-887.
Tran, M., Wright, M., Brogfeldt, I., Teague, J., and Spingarn, R. (2010). Racial and Ethnic Disparities in Healthcare in California. California Fact Book. Sacramento, CA: Office of Statewide Health Planning and Development.
U.S. Bureau of Labor Statistics. (2011). Current Employment and Wages from Occupational Employment Statistics (OES) Survey, May 2011. http://www.bls.gov/oes/data.htm. Accessed in June 2012.
U.S. Census Bureau. (2009). American Community Survey. http://www.census.gov/acs/www/data_documentation/2009_release/. Accessed in July 2012.
U.S. Census Bureau. (2011). Metropolitan and Micropolitan Statistical Areas, Estimates of the Population April 1, 2010 through July 1, 2011. http://www.census.gov/popest/data/metro/totals/2011/. Accessed on February 7, 2013.
U.S. Census Bureau. (2012). Statistical Abstract of the United States; Section 14 Prices: Council for Community & Economic Research. http://www.census.gov/prod/2011pubs/11statab/prices.pdf. Accessed on February 17, 2013.
Weeks, W., Gottlieb, D., Nyweide, D., Sutherland, J., Bynum, J., Casalino, L., Gillies, R., Shortell, S., and Fisher, E. (2010). Higher Health Care Quality and Bigger Savings Found at Large Multispecialty Medical Groups. Health Aff (Millwood), 5, 991-997.
World Health Organization. (2012). Global Strategy on Diet, Physical Activity and Health. http://www.who.int/dietphysicalactivity/pa/en/index.html. Accessed in August 2012.
Wyman, O. (2012). Annual Cost to Insurers Allocated By State. America’s Health Insurance Plans. November 2012. http://www.ahip.org/WymanState/. Accessed on February 15, 2013.
Yanagihara, D. (2012). Special Care Based P4P Public Comment Period July 10-July 21, 2012. Integrated Healthcare Association.
Zuvekas, S. H., and Cohen, J. W. (2007). Prescription drugs and the changing concentration of health care expenditures. Health Aff (Millwood), 26(1), 249-257.
A New Vision for California’s Healthcare System 55
We thank the following individuals for their involvement in the Berkeley Forum alongside their organizational counterparts shown in the “Participant List” on the inside front cover of the report. Their participation does not indicate endorsement of the findings in the report:n Blue Shield of California, Kathy Swenson, Senior Vice Presidentn California Department of Insurance, Janice Rocco,
Deputy Commissionern California Health and Human Services Agency, Jim Suennen,
Associate Secretary, Office of External Affairsn Cedars-Sinai Medical Center, Richard Jacobs, Senior Vice
President for System Development and Chief Strategy Officern U.S. Department of Health and Human Services Regional
Office, Bonnie Preston, Outreach and Policy Specialistn Dignity Health, Wade Rose, Vice President of External and
Government Relationsn HealthCare Partners, Barton Wald, Regional Medical Directorn Health Net, Patricia Clarey, Senior Vice President,
Chief Regulatory and External Relations Officer, Chief Compliance Officer
n Kaiser Permanente, Anthony Barrueta, Vice President of Government Relations
n MemorialCare Health System, Scott Joslyn, Senior Vice President and Chief Information Officer
n Monarch HealthCare, Jay Cohen, President and Chairman of the Board
n Sutter Health, Robert Reed, Chief Financial Officer
We thank the following individuals for reviewing a draft of this report and for providing helpful and important comments:n Timothy T. Brown, PhD, Assistant Adjunct Professor,
Health Policy and Management, and Associate Director for Research, Berkeley Center for Health Technology, School of Public Health, University of California, Berkeley
n William H. Dow, PhD, Henry J. Kaiser Professor of Health Economics, Head, Division of Health Policy and Management, and Associate Director, Berkeley Population Center, School of Public Health, University of California, Berkeley
n Deborah A. Freund, PhD, President of Claremont Graduate University
n Elizabeth McGlynn, PhD, Director of Kaiser Permanente Center for Effectiveness and Safety Research
n Cathy Schoen, MS, Senior Vice President for Policy, Research and Evaluation of The Commonwealth Fund
n Tom Williams, DrPH, President and CEO of Integrated Healthcare Association (IHA)
We are grateful for the contributions of time, data and/or input from the following organizations. Their contribution does not indicate endorsement of the findings in the report:n California Department of Health Care Services,
Office of the Directorn California Department of Health Care Services,
Research and Analytics Studies Branch
n California Department of Managed Health Care n California HealthCare Foundationn Cattaneo & Stroud Inc.n Center for the Health Professions
at the University of California, San Franciscon Center to Advance Palliative Caren Health Research and Educational Trust,
American Hospital Associationn IMS Health Incorporatedn Integrated Healthcare Associationn Milliman, Inc.n Office of Statewide Health Planning and Developmentn Pacific Business Group on Healthn U.S. Department of Health and Human Services
We thank the following University of California, Berkeley undergraduate and graduate students for their assistance with this report:
n Yumna Bahgat n Michele Beleu n Jenny Chang n Samantha DuPontn Peggy Hung
n Sean McClellan n Vishaal Pegany n Stephen Yoshizawan Kara Young
We thank the following organizations and individuals for their contribution:n Staff at the Nicholas C. Petris Center on Health Care Markets
and Consumer Welfare (http://petris.org/), University of California, Berkeley School of Public Health produced the report and conducted most of the research and analyses for this report.
n Michael J. Kass, Pillsbury Winthrop Shaw Pittman LLP, provided legal advice for the Berkeley Forum.
n Lee Gomes (http://www.linkedin.com/pub/lee-gomes/12/b7/585) edited the report.
n Laura Myers Design (http://lauramyersdesign.com/) provided graphic design services.
n HelloAri Design (http://www.helloari.com/) designed and developed the Berkeley Forum website.
We thank the numerous other individuals and organizations not listed here who provided input throughout the process of compiling this report.
FundingWe acknowledge funding support by the Forum participants, provided as a gift to the University of California, Berkeley School of Public Health. The research and analyses for this report were conducted independently by faculty and staff, who take responsibility for its contents.