for Health & Human Services Winter 2013/2014 Esri News Esri Tools Help Human Services Agencies Keep Clients Safe Human services agencies create GIS maps and use them to locate clients in need of assistance in the face of natural or man-made disasters. This means huge time savings, allowing personnel to focus on important agency work. Fifty-four California counties partner with the nonprofit National Council on Crime and Delinquency (NCCD) for child welfare data monitoring and analysis through a service called SafeMeasures. This NCCD program uses near real-time data to assist child welfare agencies in California and elsewhere to improve outcomes for clients by helping agency Family Looks at Ammo Fire at the Entrance of Camp Pendleton, October 23, 2007. (Photo by Gabriel Bouys/AFP/Getty Images. Courtesy of the San Diego Wildfires Education Project, San Diego State University.) together on a single map created a con- solidated source of impact information that made it possible for NCCD’s client child welfare agencies to discard the manual process they previously had used. Such consolidated information is crucial because a given California county may be responsible for the thousands of children and adults in homes and facili- ties spread over a large geographic area, said Peter Quigley, managing director of Information Systems at NCCD. When emergencies or natural disasters strike, these agencies must quickly commu- nicate with their facilities to keep their clients safe, Quigley said. “In California, where wildfires and earth- quakes are unfortunately common, this can occur several times a year,” he said. Mapping opened a new door for human services agencies to serve their clients. But NCCD wanted to provide the best possible service to clients and quickly searched for ways to improve SafeMeasures’s mapping capabilities. In 2013, the council moved to Esri products. Tim Connell, director of application devel- opment at NCCD, recalled, “The mapping tools we had were not flexible, and they did not integrate well with our software.” Connell decided to adopt Esri tools after thoughtful research. “I looked at a lot of different options, both open source and not,” he said. “I thought that the combination of all the things that Esri products offer made the most sense continued on page 4 staff prioritize work and identify poten- tial gaps in services before they lead to negative outcomes. In 2006, NCCD added mapping to SafeMeasures by geocoding the ad- dresses of all clients and foster homes in the process. NCCD identified sources of GIS data—such as the National Oceanic and Atmospheric Administration, the United States Geological Survey, and California Department of Forestry and Fire Protection (CAL FIRE)—that could provide up-to-date information about the location and extent of wildfires, earth- quakes, and other disaster situations. Layering client and event information
Transcript
for Health & Human Services Winter 2013/2014
Esri News
Esri Tools Help Human Services Agencies Keep Clients SafeHuman services agencies create GIS maps and use them to locate clients in need of assistance in the face of natural or man-made disasters. This means huge time savings, allowing personnel to focus on important agency work.
Fifty-four California counties partner with the nonprofit National Council on Crime and Delinquency (NCCD) for child welfare data monitoring and analysis through a service called SafeMeasures. This NCCD program uses near real-time data to assist child welfare agencies in California and elsewhere to improve outcomes for clients by helping agency
Family Looks at Ammo Fire at the Entrance of Camp Pendleton, October 23, 2007. (Photo by Gabriel Bouys/AFP/Getty Images. Courtesy of the San Diego Wildfires Education Project, San Diego State University.)
together on a single map created a con-solidated source of impact information that made it possible for NCCD’s client child welfare agencies to discard the manual process they previously had used. Such consolidated information is crucial because a given California county may be responsible for the thousands of children and adults in homes and facili-ties spread over a large geographic area, said Peter Quigley, managing director of Information Systems at NCCD. When emergencies or natural disasters strike, these agencies must quickly commu-nicate with their facilities to keep their clients safe, Quigley said. “In California, where wildfires and earth-quakes are unfortunately common, this can occur several times a year,” he said. Mapping opened a new door for human services agencies to serve their clients. But NCCD wanted to provide the best possible service to clients and quickly searched for ways to improve SafeMeasures’s mapping capabilities. In 2013, the council moved to Esri products. Tim Connell, director of application devel-opment at NCCD, recalled, “The mapping tools we had were not flexible, and they did not integrate well with our software.” Connell decided to adopt Esri tools after thoughtful research. “I looked at a lot of different options, both open source and not,” he said. “I thought that the combination of all the things that Esri products offer made the most sense
continued on page 4
staff prioritize work and identify poten-tial gaps in services before they lead to negative outcomes. In 2006, NCCD added mapping to SafeMeasures by geocoding the ad-dresses of all clients and foster homes in the process. NCCD identified sources of GIS data—such as the National Oceanic and Atmospheric Administration, the United States Geological Survey, and California Department of Forestry and Fire Protection (CAL FIRE)—that could provide up-to-date information about the location and extent of wildfires, earth-quakes, and other disaster situations. Layering client and event information
Winter 2013/2014
Esri News for Health & Human Services is a publication of the Health and Human Services Solutions Group of Esri.To contact the Esri Desktop Order Center, call 1-800-447-9778 within the United States or 909-793-2853, extension 1-1235, outside the United States.
Visit the Esri website at esri.com.
View Esri News for Health & Human Services online at esri.com/health or scan the code below with your smartphone.
Submit ContentTo submit articles for publication in Esri News for Health & Human Services, contact Michael Schwartz at [email protected].
Manage Your SubscriptionTo update your mailing address or subscribe or unsubscribe to Esri publications, visit esri.com/publications.
International customers should contact an Esri distributor to manage their subscriptions.
For a directory of distributors, visit esri.com/distributors.
Circulation ServicesFor back issues, missed issues, and other circulation services, e-mail [email protected]; call 909-793-2853, extension 2778; or fax 909-798-0560.
QR code generated on http://qrcode.littleidiot.be2 Esri News for Health & Human Services Winter 2013/2014
Contents
Cover
1 Esri Tools Help Human Services Agencies Keep Clients Safe
Health Atlas Close-up
6 Helping Hearts
Case Study
8 New Mexico Community Data Collaborative Leverages Esri ArcGIS Online
12 Using Esri ArcGIS to Maintain Water Well and Septic System Permits in Kendall County, Illinois
Book Review
14 Enabling Comprehensive Situational Awareness
Esri News
15 Esri Annual Awards
15 Special Thanks to Our Sponsors
15 Esri on the Road
15 Save the Date
The information contained in this work is the exclusive property of Esri or its licensors. This work is protected under United States copyright law and other international copyright treaties and conventions. No part of this work may be reproduced or transmitted in any form or by any means, electronic or mechanical, including photocopying and recording, or by any information storage or retrieval system, except as expressly permitted in writing by Esri. All requests should be sent to Attention: Contracts and Legal Services Manager, Esri, 380 New York Street, Redlands, CA 92373-8100 USA.
The information contained in this work is subject to change without notice.
The Geographic Advantage, Esri, the Esri globe logo, 3D Analyst, ArcAtlas, ArcCatalog, ArcData, ArcDoc, ArcEditor, ArcExplorer, ArcGIS, the ArcGIS logo, ArcGlobe, ArcIMS, ARC/INFO, ArcInfo, ArcLogistics, ArcMap, ArcNetwork, ArcNews, ArcObjects, ArcPad, ArcPress, ArcReader, ArcSDE, ArcSurvey, ArcToolbox, ArcTools, ArcUser, ArcView, ArcVoyager, ArcWatch, ArcWeb, ArcWorld, ArcXML, Business Analyst Online, BusinessMAP, CommunityInfo, EDN, Geography Network, GIS Day, MapData, MapObjects, Maplex, MapStudio, ModelBuilder, MOLE, NetEngine, RouteMAP, SDE, Sourcebook•America, StreetMap, Tapestry, @esri.com, esri.com, arcgis.com, geographynetwork.com, gis.com, and gisday.com are trademarks, service marks, or registered marks of Esri in the United States, the European Community, or certain other jurisdictions.
Other companies and products or services mentioned herein may be trademarks, service marks, or registered marks of their respective mark owners.
For geocoding, Connell chose Esri’s StreetMap Premium because of its ac-curacy and coverage. Both qualities are critical to ensuring that a human services agency reaches all clients potentially affected by a disaster. The highly confi-dential nature of NCCD’s data meant that the agency needed to develop a custom solution rather than use an external service. Esri technology, in conjunction with StreetMap data, allowed NCCD to develop its own geocoder. Because NCCD geocodes 50,000 to 60,000 ad-dresses a day, Esri technology provides a high-speed, low-cost solution. “StreetMap had the most accurate and consistent data of the geocoding plat-forms we looked at,” explained Connell. “Plus, the integration with ArcObjects meant that we could do everything in-house. That was important to us.” Esri’s ArcGIS API for JavaScript pro-vides the clean, easy-to-understand user interface that Connell wanted for NCCD’s clients. Standout features included better basemap imagery than NCCD’s prior tools—less cluttered at higher scales and more consistent in displaying landmarks.
“Now we can see exactly where the kids are, and the map shows where the disasters are, so it’s simplified quite a bit . . . We go to that map, see where the fire is, and see the dots of placements near it. We can use that map to contact those foster homes.”Luis Fernandez, Data Supervisor, San Diego County
Fire fighter Dwarfed by Flames along East Grade Road on Palomar Mountain during the Poomacha Fire, October 24, 2007. (Photo by Wally Skalij/Los Angeles Times. Courtesy of the San Diego Wilfires Education Project, San Diego State University.)
NCCD uses custom and open-source code to access, organize, and render data for display, using standards like Web Map Service (WMS) to integrate this data into the map. “The Esri API made it easy for us to create different tools, such as one that allows users to draw a circle on the map and generate a list of all the client ad-dresses in that circle,” Connell said.
New Agile, Streamlined ProcessWith the improved SafeMeasures maps, California child welfare agencies have an agile, streamlined process with which to keep clients safe in the face of an unfold-ing emergency. Connell listed some of the many instances in which mapping has been integral: “We’ve dealt with earthquakes, house fires, and satellite-detected fires, to name a few examples.” Esri tools allow SafeMeasures mapping to provide consistently high-speed ser-vice: “We run through every 15 minutesand compare the locations of all the foster home or care facility addresses with our known current events,” said Connell. “Our users can register for alerts, and anytime there is an emergency event—such as a wildfire—they will get an e-mail saying that one or more of their cases is within a particular distance of the event and give them a link to the map.” Luis Fernandez, a data supervisor in San Diego County, appreciates how SafeMeasures has streamlined things. “Now we can see exactly where the kids are, and the map shows where the dis-asters are, so it’s simplified quite a bit.” Fernandez observed that in the event of a fire, “We go to that map, see where the fire is, and see the dots of placements near it. We can use that map to contact those foster homes.” See, for example, figure 1, a map of the Sylmar Fire, also known as the Sayre Fire, in November 2008, which resulted in the loss of 489 homes in Los Angeles, California. This map, and figure 2, the
from a mapping point of view. Esri tools were the most flexible in our software architecture, and they were extendable in ways that other platforms were not. Plus, the Esri tools create very useful and user-friendly maps.”
4 Esri News for Health & Human Services Winter 2013/2014
Esri Tools Help Human Services Agencies Keep Clients Safe continued from cover
Rim Fire in 2013, were created by an automated system NCCD developed. These maps are available within the SafeMeasures system and are assembled automatically on request using regularly updated data elements. Tony Muga, a San Bernardino County child welfare data analyst, related an in-stance where SafeMeasures mapping has helped his agency quickly reach clients
Figure 1. Sayre Fire, 2008. The map displays the location of foster homes relative to the fire’s perimeter. In addition to active fires, the map displays recently burned areas to help identify homes in need of follow-up assistance.
Figure 2. Rim Fire, 2013. Clicking a marker opens a panel containing details for that location, including contact information, number of clients, age ranges, and other important elements.
in need. One time, dangerous water contamination in the desert threatened foster homes in the area that hadn’t yet been called by any other agencies. “SafeMeasures mapping gave us the ability to get right on that—we were the first agency to alert the community to the problem,” Muga said. Fernandez also recounted how SafeMeasures mapping helped ensure
safety for clients in a perilous situation. “There was a home in San Diego where the residents were making homemade bombs,” Fernandez recalled. “The house had to be torn down, so to do that the entire area had to be evacuated. There was a lot of dangerous material in the house, including chemicals. We used the map to figure out which of our kids were in that area to make sure they were moved to a safe place.” In a stringent fiscal climate, the map-ping approach reaps multiple benefits. Fernandez noted that, in the past, data requests and regular reports were put aside when agency personnel had to find clients affected by an emergency. “Now, it takes only 15 percent of the time it took before because we don’t have to cast as wide a net,” he said. Muga also has used mapping to help the agency address other mandates, like minimizing negative effects of placement on foster children. “The mapping feature provides a view of where a child has been placed before. It shows placement #1, placement #2, et cetera, and draws lines between them so we know in what general areas a child has been placed,” he said. “The child may have friends in the area; it’s a familiar place. If it’s safe for the child to be in that area, we [want to keep him or her there] to have as little impact on the child’s life as possible.”
For more information, contact Tim Connell, PhD, NCCD’s director of application development, at 800-306-6223 [email protected], orvisit www.nccdglobal.org.
Helping HeartsInteractive Atlas Deciphers Where Heart Attacks and Strokes Occur and Who Is at RiskBy Rachel Ankersen, GISi, and Karen Richardson, Esri Writer
Does whether you have a heart attack or stroke have more to do with your ZIP code than your genetic code? The Interactive Atlas of Heart Diseaseand Stroke application built for the Centers for Disease Control and Prevention (CDC) could help answer this question and others. Cardiovascular disease, including heart attacks and strokes, is the leading cause of death in the United States for both men and women. According to a recent report from the CDC, more than 800,000 people die from cardiovascular disease each year, or one in every three deaths. Many deaths, especially those of people under age 75, could be prevented. The report says that cardiovascular disease deaths among those younger than age 75 vary by geography. Rates of preventable death from cardiovascular disease were the highest in the South. To view and analyze this data more closely, CDC and Esri Platinum partner Geographic Information Services, Inc. (GISi), headquartered in Birmingham, Alabama, built the Interactive Atlas ap-plication using the Esri ArcGIS platform. Information about cardiovascular health can be viewed and queried on a map. CDC developed the atlas to give US residents and public health officials at the
and range general manager for GISi. “Not only are we helping make this data widely available and understandable by using the mapping medium, we have simplified the back-end administration so that the CDC scientists can manage the site themselves by adding new data, changing map content and display, and adding user tips and tricks.”
Flexing Health DataBuilt using Esri ArcGIS for Server and ArcGIS API for Flex, the atlas provides a map-based view of where cardiovascular disease is occurring. The data comes from the United States Census Bureau, the National Center for Health Statistics, the Centers for Medicare and Medicaid Services, and other sources and is stored in Microsoft SQL Server. Geospatial data includes state and county boundaries, roads and streets, health care centers and hospitals, and retail outlets such as grocery and convenience stores and fast-food restaurants. To start using the atlas, select a geo-graphic area to view, either at the state or county level. Next, choose a health indicator from a list of different types of heart and coronary diseases and strokes or preventable/avoidable death. Then select an outcome from the indicator:
state, county, and local levels the tools they need to investigate where high rates of heart disease and stroke exist and who is mainly at risk. This is particularly important because the CDC report found that as many as 200,000 deaths that were attributed to cardiovascular disease could have been prevented. “Too many lives are being cut short due to heart disease and stroke,” said Linda Schieb, an epidemiologist at CDC and lead author of the report. “Many of these deaths could be prevented by improving health care systems, creating healthy places to live and play, and sup-porting healthy lifestyle choices.” The hope is that by providing this data in an easy-to-use format—via a map that can be explored—it will be easier to see where cardiovascular disease is more prevalent and which population groups are at high risk for problems such as hy-pertension, coronary heart disease, acute heart attack, heart failure, and ischemic or hemorrhagic stroke. The overarching goal? To help doctors, health administra-tors, and public health officials, as well as the general public, better focus preventive education and programs in these areas. “We are quite proud of the work we have done with the CDC team,” said Dan Levine, chief technology officer (CTO)
According to this map, heart disease rates are higher in some southern states, such as Mississippi, Alabama, and Louisiana, and in New York State.
You can view a wide range of mapped data using the online Atlas of Heart Disease and Stroke application, including percentages of people living in poverty in the United States.
You can compare, side by side, the stroke death rates by county.
6 Esri News for Health & Human Services Winter 2013/2014
mortality, hospitalizations, or hospital discharge status. Apply sociodemographic filters including race or ethnicity such as all race, white (non-Hispanic), black (non-Hispanic), Hispanic, American Indian and Alaskan Native, or Asian and Pacific Islander; gender; age; and a time period such as 2005–2007, 2006–2008, 2007–2009, and 2008–2010. Age ranges to select from include all, 35 and older, 65 and older, and premature. Premature deaths are defined as deaths of people aged 75 years or younger. Other selectable options to visualize on a map include determinants of health and health services and aspects of the community that may affect health such as poverty, education, or the percent of the population aged 65 or older. Health services include the number and loca-tion of hospitals with services related to cardiovascular disease and the number of pharmacies in a county.
Mapping the State of Heart HealthHere’s an example of how the application works: perhaps you want to find out the death rate for all heart disease by state in the United States. You can view a national map and select the death rate for all heart disease for both men and women of all races, 35 years of age. The map shows that the death rate is highest in the Southern states of Arkansas, Oklahoma, Louisiana, Mississippi, Alabama, Tennessee, Kentucky, and West Virginia.
Give Your Neighborhood a Health CheckAfter selecting health information, that information can be overlaid with major highways, large cities, congressional dis-tricts, hospital referral regions, and state boundaries. This map can be viewed again at a later time, including setting the national map to a predefined location for easier viewing. Clicking the Maps Over Time button provides an animated time series for the map so users can view the change in data over time for three-year periods from 2005 to 2010. The change in data can be viewed for a quick, holistic understand-ing of how disease and disease factors have changed in certain areas. And when you are finished, you can print a report directly from the map.
Global Access and RecognitionPeople in all 50 states and more than 100 countries have used the Interactive Atlas of Heart Disease and Stroke applica-tion since January 2013. With this innova-tive application, CDC garnered Esri’s 2013 Special Achievement in GIS (SAG) Award at the Esri International User Conference in San Diego, California, last July.
For more information,contact Rachel Ankersen,marketing coordinator, GISi, at 205-941-0442, ext. 120.
But check out states like New York, too, where the death rate also is high. Now look more closely at the same data but focus on counties in the state of Oregon. Yamhill, Washington, and Clackamas Counties—all located near the major metropolitan area of Portland, Oregon, in the northwest corner of the state—have low death rates from heart disease. On the other hand, Harney and Malheur Counties—located in the oppo-site corner of the state from Portland, in southeastern Oregon—have some of the highest death rates in the state. Is there a reason for these variations in death rates from heart disease? The atlas can display different variables so that users can explore these types of questions. One way to compare data between two different locations is to split the screen into two maps. With a push of a button, you can view different factors, such as heart disease mortality and a determinant of health such as a social environment, race/ethnicity, or physical environmental factors. For example, a map of Oregon counties and death rates from heart disease can be viewed next to a map of Oregon counties and the percentage of people living in poverty for all ages. It appears that the counties that have the lowest percentage of deaths from heart disease also have the lowest percentage of people living in poverty. Is there a correlation? The atlas helps people to find out if there is a possible re-lationship between health indicators and other characteristics in the community.
Death rates from heart disease are high in southwestern and southeastern Oregon, according to this map in the atlas.
These two maps compare heart disease death rates for white men over the age of 35 (left) and for black, non-Hispanic men over the age of 35 (right) in Mississippi.
You can compare data such as the heart disease death rate in Kentucky and the median household income by county.
Supplying community data and health statistics is the stock-in-trade of the New Mexico Community Data Collaborative (NMCDC). But this statewide data repository doesn’t only provide informa-tion to anyone on demand: The NMCDC’s Office of Community Assessment, Planning and Evaluation adheres to fine-tuned proce-dures and principles in supplying data for health assessment and in collaborating with—and training—users of its data warehouse, according to epidemiologist Thomas N. Scharmen. “NMCDC functions under a new paradigm for public data services,” said Scharmen, MA, MPH, who works in the New Mexico Department of Health’s (NMDOH) Albuquerque Metro & NW Regions, Public Health Division. “As our guiding prin-ciples explain, a collaborative model implies sharing. Esri’s ArcGIS Online services provide the ideal medium for sharing.” Using the freely accessible cloud server where NMCDC keeps its data collection, no one is obliged to pay for any of the products or services that are offered. The new paradigm of sharing means that traditional modes of exchange are altered. Ownership gives way to health promo-tion concepts such as community participation and empower-ment. As in the old saying, “Teach a man to fish . . .,” requests to NMCDC for data are countered with offers to teach users how to explore and interpret their community indicators using ArcGIS Online organizational resources.
ArcGIS Online: Creative Laboratory The many collaborators of NMCDC enjoy access to the agency’s ArcGIS Online cloud server, which allows the creation of special groups, applications, and galleries, with varying access, func-tionality, and purpose. Simple maps can be embedded in a website in a matter of minutes. See, for example, figure 1, a map created for the New Mexico Chronic Disease Prevention Council. A more versatile option for a personalized site is a Public Maps Gallery, such as figure 2, linked at the Bernalillo County Community Health Council website (www.bchealthcouncil.org), or figure 3, the New Mexico KIDS COUNT Map Gallery created for New Mexico Voices for Children (www.nmvoices.org). Christine Hollis, director of the KIDS COUNT program of New Mexico’s Voices for Children, described how her organization has been using these tools: “NMCDC@ArcGIS Online is a back-bone resource in the Connecting Data to Action project we are implementing in the state. We have carried out 10 workshops in 10 different counties/locations in the state, reaching approxi-mately 200 local-level proponents of improved early childhood care and education policies.” Hollis said participants in these workshops have learned what data the NMCDC@ArcGIS Online site offers and how they can best use it to address their local information needs. In particular, they have done “data walks,” analyzing locally relevant early childhood
New Mexico Community Data Collaborative Leverages Esri ArcGIS OnlineData Repository Shares Services, Resources, and Operational Methods
Figure 1. The Chronic Disease Prevention Council (CDPC) compiled basic chronic disease maps so its members and community clients can explore issues at a neighborhood level.
care, education services, and numbers of chil-dren enrolled—as shown in print maps drawn from the website—to determine both resources and needs in their community, she said. “All have expressed interest in the site and the data demonstrated,” said Hollis. Special applications available for users of the NMCDC online organization include map viewers of varying complexity for different audiences; map comparison tools (for exam-ple, a swipe map); and apps for social media, mobile devices, and storytelling. Apps and groups can be created and controlled by the individual subscriber or mapmaker. All these features, including the cost of hosting and storing the links, as well as Esri technical support, are part of the ArcGIS Online for Organizations subscription. Features are easy to use, learn, and afford.
8 Esri News for Health & Human Services Winter 2013/2014
Need for Efficient Community AssessmentBased in Scharmen’s Albuquerque office, the project grew out of the search for efficient methods and tools to serve the com-munity assessment needs of health councils and health promo-tion advocates. In 2006, it became an integral part of the Place Matters movement and its local affiliate in Bernalillo County, and expanded its focus toward geographic, income, and racial/ethnic disparities. In recent years, the collaborative has grown to better serve all New Mexico communities, with an emphasis on areas such as early childhood health and education, food security, obesity, public services, and the built environment. Nonetheless, the warehouse has much room for growth, Scharmen said, particularly in the areas of serving a more di-verse constituent base and ensuring that the growing collection of datasets all get updated regularly.
Multifaceted Warehouse ContentsThough there are now abundant examples of websites with county-level data, there is no other single agency or office in New Mexico that manages a comparable quantity of subcounty data. The NMCDC online data warehouse currently houses over 200 neighborhood-level datasets with more than 1,200 vari-ables. Sets of 5 to 20 variables are displayed on nearly 100 thematic maps, 32 of which are featured via the NMCDC main web page. Any visitor may explore the maps with the ability to turn variable layers on or off, zoom to different neighborhoods, click on an area to see statistics, and view tables of variables.
Subscribers to the site (collaborating analysts) can upload and store data, make maps and applications, use files shared by others, and copy and modify maps. NMCDC offers workshops, consultation with GIS experts, and personal assistance to users with no obligation to pay.
Collaborating People NetworkLess visible but more important, NMCDC is a network of people, said Scharmen. There are 42 collaborating analysts (mapmakers, subscribers), including analysts from agencies, universities, and nonprofit advocacy groups. The group is co-ordinated by Scharmen with the assistance of two experienced contractors, who administer the website, develop datasets for sharing, and train and mentor users. Staff also coordinates the technical and human elements of the collaborative: the quality of datasets and tools, communication among members, events planning, and the sharing of workloads. Since November 2011, 44 workshops have been attended by over 500 people, representing a public service work force from both governmental and nonprofit sectors. These new users have introduced the website to their constituents by facilitat-ing participatory decision making for public benefit to write grant proposals, plan interventions, target limited resources, or change policy. Based on automated counts provided by ArcGIS Online, the collaborative’s maps are opened by users over 50 times a day.
Figure 2. A gallery of maps on a variety of issues such as nativity, demographics, chronic disease, and obesity prevention. NMCDC provides communities and decision makers with data and evidence to build health into state and local policies and practices.
Figure 3. A “Customized” Gallery for Early Childhood Advocacy Organizations, with a Focus on Maps of Issues with Which They Are Currently Concerned Such as Teen Birth, Child Nutrition, Poverty, and Early Development
Data Requests and Sharing The ready-made data tools and ArcGIS Online exploration tools allow for rapid responses to a high volume of data requests. “But they also imply that NMCDC assist and train frequent users to manipulate the tools efficiently so that eventually
they may be able to fill at least some of their own requests,” Scharmen said. When the request is for data already included in the collabo-rative’s extensive ArcGIS Online collection, the requester may be referred to the appropriate map—or the analyst can quickly modify an existing map. “ArcGIS Online tools greatly simplify the tasks of editing or updating shapefiles without having to rebuild the maps that run off them,” Scharmen said. Master files, Excel spreadsheets with dictionary and metadata, are also stored online. Requests for new data are weighed against the frequency of similar requests and the availability of a geocoded dataset versus the necessity of acquiring and geocoding a new dataset. Very often the data is already “in the pipeline” and the new request helps raise its priority level. NMCDC trains users at two levels, said Scharmen: 1. The Map Facilitator finds and explains (or extracts) data on
the website and facilitates participatory decision making and report or grant writing.
2. The Map Maker (subscriber with logon) builds custom maps from existing features and downloads master datasets for pro-file development or in-depth analysis.
In addition, NMCDC staff train database developers in geo-spatial and other analytic techniques.
State Agency SupportKey support from the New Mexico Departments of Health and Children, Youth and Families, builds trust with multiple state and local government agencies. Thus, even confidential data can be geocoded and aggregated under departmental protections. Only then, said Scharmen, can the data be shared for community assessment. New Mexico’s Health Information System Act specifically empowers the Department of Health to “serve as a health information clearinghouse” and stipulates that “Any person may obtain any aggregate data.” The consolidation of GIS services within the NMDOH Community Health Assessment Program, which includes the Indicator-Based Information System (NM-IBIS) and NMCDC, has spurred the standardization of quality and methods and the pro-cessing of more databases into aggregated geospatial formats. “These business arrangements enable NMCDC’s data ware-house to grow and for state agencies to be more responsive to community data needs,” Scharmen said.
For further information on the NMCDC,e-mail Thomas N. Scharmen at [email protected] or visit http://nmcdc.maps.arcgis.com/home/.
Guiding Principles of NMCDC
Social Ecology—Social determinants of health imply the community as “patient,” which in turn implies place-oriented analytics.
Neighborhood Data—The community is the unit of analysis. Data is aggregated at the neighborhood level.
Comprehensive Data—Data encompasses social ecologies of health, social factors, economics, education, crime, environment, services, etc.
Statewide Data—All databases include every neighborhood in the state; statewide tools are reusable and provide economy of scale.
Requested Data—Data work originates with requests from viable organizations that use it and are best informed about its value.
Shared Aggregate Data—All datasets are shared with any organization or person who requests them, without charge.
Shared Collaboration—Work and resources are shared across multiple organizations. Taxpayers should not pay twice for the same work.
Shared Knowledge—Sharing skills, along with data, with anyone who has the initiative to learn builds sustainability and empowerment.
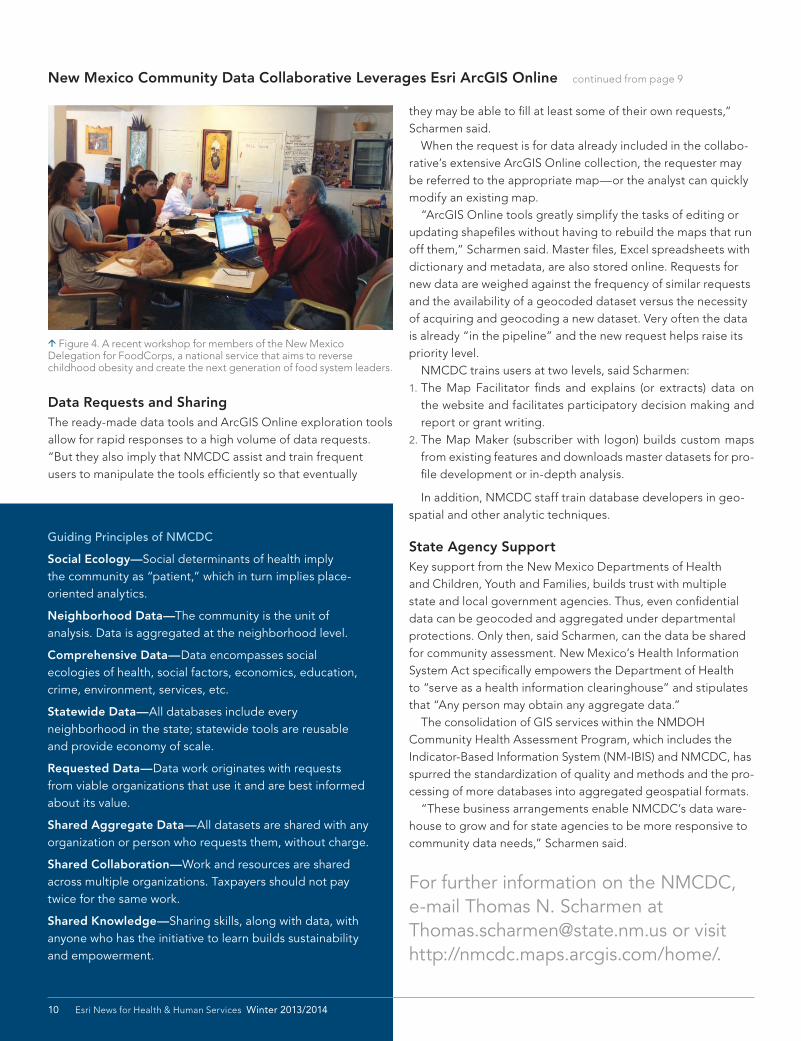
Figure 4. A recent workshop for members of the New Mexico Delegation for FoodCorps, a national service that aims to reverse childhood obesity and create the next generation of food system leaders.
New Mexico Community Data Collaborative Leverages Esri ArcGIS Online continued from page 9
10 Esri News for Health & Human Services Winter 2013/2014
Kendall County Health Department Environmental Health Services in Yorkville, Illinois, currently uses ArcGIS 10 for Desktop to manage—and ArcGIS 10 for Server to store—all county well and septic-related records dating back to 1972.
Prior to 2001, the Kendall County Health Department (KCHD) stored all well and septic permit data in large binders. In those days, it would take hours to locate a record as staff manually flipped pages searching for a matching address or the original homeowner name.
department began thinking of other data that could be incorpo-rated into GIS. After some discussion, managers set their sights on a huge target—incorporating all the scanned well and septic permit records into ArcGIS Desktop. Their goal was to click on a parcel and bring up any permit records associated with that parcel. Over the next three years, EHS worked with the county GIS coordinator to develop the system and add data. EHS secured an additional software license for ArcGIS Desktop and began working more with the program. In 2011, EHS set a goal to incorporate all well and septic system records before the end of 2012. The department reached that goal and that same year set another goal to incorporate all well and septic records before the start of 2013. The agency reached that goal six months early. In early 2013, it left the old spreadsheet system behind and started entering all new well and septic permit data into the newly released ArcGIS for Desktop.
Fully Integrated GIS at Little CostCurrently, EHS is managing all new permit-related data in ArcGIS for Desktop. Staff is also scanning permits into the system on its own, once the permits have been closed. This GIS integration process involved a lot of training and the develop-ment of several how-to documents for the EHS unit. The train-ing has been conducted in-house by the GIS coordinator and EHS staff to limit costs. The data has always been the backbone of Kendall County’s environmental health programs, and now EHS can access this data quickly and efficiently. At the present time, the department is able to click on a parcel/lot and pull up all well and septic permit information and share the permit record via e-mail in a matter of seconds. Staff no longer needs to open large bind-ers, multiple databases, or programs to view, edit, and manage the data. It has reached its goals for viewing and managing the data. Now, the department is setting new goals for the future. It has taken some time from concept to inception, but the slow progress worked well for the Kendall County Health Department Environmental Health Services unit. The well and septic records are the largest and most complicated dataset the unit maintains. The group is confident that it can incorporate other programs into ArcGIS for Desktop if/when it chooses to do so. Its advice to other local government agencies: it is possible to fully integrate into GIS for a very small monetary investment if you’re willing to invest some time and you have the support from your departmental administration, county mapping, and GIS and/or IT departments.
Using Esri ArcGIS to Maintain Water Well and Septic System Permits in Kendall County, IllinoisBy Todd Drefcinski, LEHP, Assistant Director, Environmental Health Services, Kendall County Health Department, Yorkville, Illinois
Over the next five years, the technology continued to improve as the Environmental Health Services (EHS) unit grew along with residential development. A spreadsheet on a single PC to log in 10,000 permit records eventually gave way to scan-ning records into an electronic format, then using a handheld GPS to collect the locations of private water wells—the depart-ment’s first use of GIS-based handheld technology. By 2007 and 2008, the unit added another component—compiling fact sheets on groundwater and private water wells, placing them in packets for residents, delivered during door-to-door site visits. Today, Kendall County’s EHS unit employs state-of-the-art Esri ArcGIS to maintain its water well and septic system permits. The county EHS began working with ArcGIS Desktop in 2008 as part of the new Private Well Education and Mapping Project. One ArcGIS Desktop license was provided for the EHS unit (all staff now have a PC at their workstations). Initially, staff used the program to add/move well points. This basic use of ArcGIS Desktop opened EHS staff’s eyes to the power of the program. The Private Well Education and Mapping Project continues to take place as time permits during summer and fall. Within a few months of obtaining the ArcMap license, EHS was asking for different layers for the table of contents. The
Example of an old Permit Record Book. These were in use until 2001.
12 Esri News for Health & Human Services Winter 2013/2014
Using Esri ArcGIS to Maintain Water Well and Septic System Permits in Kendall County, IllinoisBy Todd Drefcinski, LEHP, Assistant Director, Environmental Health Services, Kendall County Health Department, Yorkville, Illinois
For further information on Kendall County’s use of ArcGIS 10 forDesktop, contact GIS coordinator Don Clayton at [email protected] or Todd Drefcinski, assistant director,Environmental Health Services, at [email protected] Kendall County Health Department’s Environmental HealthPrograms at http://health.co.kendall.il.us/Environmental/index.html#.
The round points visible in this image are private water well locations. The darker points are private water wells located within a 250’ buffer of the Fox River. KCHD worked closely with the county GIS coordinator after a recent flood event to develop ways to identify wells that are at or near the known flood elevation.
The round points visible in this aerial image are private water well locations. The drawing is the as-built, which is completed by EHS sanitarians after the well and septic installation inspection. All permit attributes previously stored in Excel have been pulled over as attributes for use in ArcGIS.
When news of a pandemic is released, people expect public health officials to provide guidance for their protec-tion. When a fire occurs, citizens rely historically on a local fire department to respond. When a crime occurs, the public expects a local law enforcement agency to handle it. Yet experience shows that when emergency responders focus on only what they know about an incident, it’s often what they don’t know that hin-ders its resolution or compounds it with added dangers and risks. The realities of today require all organizations with emergency obliga-tions to provide their skills and knowl-edge within a larger coordinated effort to protect more (community health, the environment, and infrastructure) and to mitigate the impact of an occurrence faster. Whether tracking the transport of hazardous materials, isolating the incidence of a localized disease, or ana-lyzing the release of biochemical agents, the methods affecting the assembly of an evolving global response effort have been piecemeal and their development largely localized. Finally, all emergency organizations have a new guide that will help them improve their delivery of response through cooperation and coordination with others. Enabling Comprehensive Situational Awareness by Susan Lindell Radke, Russ Johnson, and Jeff Baranyi from Esri Press provides an organized, guided approach to preparing for
Esri Press 2013
The AuthorsSusan L. Radke—Founder and president of Berkeley Geo-Research GroupRuss Johnson—Public safety and homeland security director for EsriJeff Baranyi—Esri’s technical lead for the public safety market
ReviewerJim Smalley is a Massachusetts-based, nationally respected fire safety and emergency management specialist who conducted a developmental review of this book when it was first proposed to Esri Press.
Enabling Comprehensive Situational Awareness
ISBN: 9781589483064, Part Number:124362, June 2013, US$18.95, 168 pages
on situational awareness is the central focus. The reader is convinced that this is critically important; fortunately, the authors provide expert guidance on what to do. For this reader, the last chapter, “Implementation Guide,” provides the compelling reason for all members and leaders of response organizations, regardless of their focus, to follow the guidance and advice of the authors. This is how you get it done! Throughout the book, the authors support their information and guidance with multiple common sense examples from local, regional, and national or-ganizations, as well as maps, illustrations, screen shots, lists, and tables, to assist readers in getting started on a local, manageable basis. This remarkable book embodies what many response organiza-tion leaders and GIS practitioners have been encouraging in concept for years—now with specific recommendations for development and implementation.
For more information, visit esri.com/esripress.
emergency incidents of any nature and scope. The valuable message here is that it’s time to redirect organizational energies to become a critical member of a more effective emergency response team rather than a single, stand-alone agency with specific skills and knowledge. Beginning with the basics of identify-ing, assembling, and managing data in shareable and scalable forms for all organizations, the book provides the rationale and foundation for a compre-hensive approach to incident engage-ment and management, regardless of the incident’s nature. All response organiza-tions share in the development of the data—planning, response, mitigation, and recovery. Information on planning and analysis of geographic, demographic, infrastructure, and other data is accurately presented in scope to cover the array of essential information—and with the right amount of detail—so as not to overwhelm the reader. Discussions of using and shar-ing data in field operations include how the data supports operations and how agencies can best use what they know to protect responders and those in danger. Too many times, health and safety issues are compromised because responders don’t see the big picture of the incident and focus only on the specif-ics, drawing conclusions based on, for example, regional outbreaks of flu rather than larger global patterns. The chapter
14 Esri News for Health & Human Services Winter 2013/2014
Book Review
The winners of the Esri Annual Awards were announced in October at the 2013 Esri Health GIS Conference in Cambridge, Massachusetts:
Vision—An organization that has a clear, distinct, and specific view of the future using GIS Louisiana Department of Health and Hospitals Accepted by Kathy Kliebert, Secretary of DHH, and Ryan
Bilbo, GIS Manager
Service—An organization that uses GIS in a very public way to accomplish better outcomes for people The Greater Boston Food Bank Accepted by Daniel Taitelbaum
Communication—A map that demonstrates the art of communi-cating geographic information “Where You Live and Who You Are Matter: Prescription
Opioid Treatment Admissions” Accepted by Ting-Ying Huang, Doctoral Candidate University
of Maryland School of Pharmacy Healthy People in Healthy CommunitiesWhen: March 3–5, 2014Host: Loma Linda University (LLU) School of
Public HealthCohost: EsriPresenting LLU Children’s Hospitalsponsor: Where: Drayson Center—Loma Linda University 25040 Stewart Street, Loma Linda, CA
92354Web: www.llu.edu/public-health/cpe
/healthypeople/2014
HighlightsThe first combined conference for two unique LLU School of Public Health events spotlighting children’s health in the community: Healthy People—The premier conference on lifestyle medicine Healthy Communities by Design—An innovative forum on the built environment and GIS
Main Keynote SpeakerJeff Speck, City Planner and Architectural Designer, Speck & Associates, LLC Key topics include • Epigenetics and Prenatal Health • Child Nutrition and Nutrition Environment • Air Quality and Children • Community Design • Media and Children’s Health • Family Impact on Health
Esri Annual AwardsWinners Announced at 2013 Esri Health GIS Conference in Cambridge, Massachusetts
Special thanks go to our sponsors for bringing together health and human services attendees at the Esri Health GIS Conference held October 14–16, 2013, in Cambridge, Massachusetts.