12
For institutional investors and professional advisers only. This information has not been approved for use with customers. THE CASE FOR EUROPEAN COMMERICAL PROPERTY
| Date post: | 27-Dec-2015 |
| Category: |
Documents |
| Upload: | emil-atkinson |
| View: | 214 times |
| Download: | 0 times |

For institutional investors and professional advisers only. This information has not been approved for use with customers.
THE CASE FOR EUROPEAN COMMERICAL PROPERTY

Growth of European Property Investments
Significant growth of investment activity in continental Europe - up 160.5% in last 5 years to end December 2005.
Cross border investments grew by 269.5% over same period.
Transparency increasing.
Further improvements expected.
Increasing availability of opportunities
Source: Jones Lang LaSalle Research, January 2007Past performance is not a guide to the future.
European direct real estate investment volumes 2000-06 (ex-UK)
To end June 2006

European Property Returns
Europe forecast to out perform UK across property spectrum
Source: Morley Fund Management, January 2007This is a forecast and should not be relied on as a recommendation for the fund.
Rental growth forecasts pa. 2007 - 2011
0%
1%
2%
3%
4%
Offices Retail Industrial All Property
Europe ex. UK UK
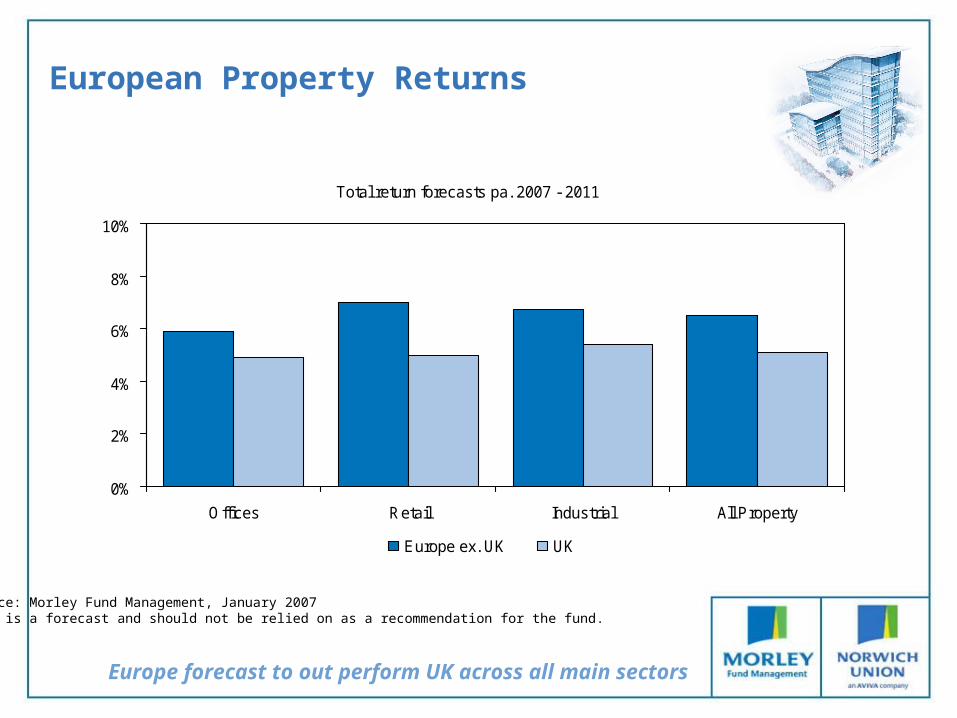
European Property Returns
Europe forecast to out perform UK across all main sectors
Source: Morley Fund Management, January 2007This is a forecast and should not be relied on as a recommendation for the fund.
Total return forecasts pa. 2007 - 2011
0%
2%
4%
6%
8%
10%
Offices Retail Industrial All Property
Europe ex. UK UK

European Asset Class Returns
Total return forecasts over a five-year period(2007 – 2011% pa)
6.8
3.6
6.5
0
2
4
6
8
10
Europe ex UK Equities* European Bonds* Europe ex
Source: *Factset 29 December 2006, **Property Strategy Team at Morley Fund Management, end December 2006
Source: *Strategy Team at Morley Fund Management,**Property Strategy Team at Morley Fund Management, end December 2006
Total return forecast of 6.5%pa with 5%pa income component
Current yield by asset class (% pa)
3.92.5
5.0
0
2
4
6
8
10
10-Year German BondYield*
Europe ex UK EquityDividend Yield (MSCI)*
Europe ex UK Property**
Robust projected returns from European property
Strong income yield of 5%

0.10
0.08
0.20
0.01
0.24
0.08
0.38
0.89
0.55
UK Property - UK Cash
European Property - European Cash
UK Property - UK Bonds
European Property - European Bonds
UK Property - UK Equities
European Property - European Equities
UK Bonds - UK Cash
European Bonds - European Cash
UK Equities - UK Bonds
Correlation of property returns with otherasset classes
Source: Morley Fund Management. As at end November 2006UK Correlation of annual returns over 59 years from 1947-2005.European Correlation of annual returns over 17 years from 1989-2005.Past performance is not a guide to the future.
Property provides good diversification with other asset classes

Cross correlation of UK ad Europeanproperty markets
0.04
0.29
-0.31
-0.98
0.69
0.72
0.62
-0.24
-0.65
0.8
0.71
EUROPE
Denmark
Finland
France
Germany
Ireland
Netherlands
Norway
Portugal
Spain
Sweden
Source: ID (5 years to end 2005)
European real estate markets provide diversification

European Property Market Forecasts
BUT… stock selection is key
France + for all sectors
Spain - for offices
+ for retail & industrial
Nordics + for all sectors
Central Europe - for all sectors
Germany + for retail & industrial? for offices
Italy - for all sectors

European Real Estate Securities
France - Especially the recovering office market
Scandinavia - Relative high income Yields
Italy – Introduction of REITS
Listed Securities provide liquidity and complements the direct portfolio
REITS in Germany in 2007
REITS in Italy in 2007
REITS in Finland in 2008
Germany - First signs of office market recovering
- Residential market privatisations
Central & Eastern Europe- Growing investment market

Returns forecast to outperform UK by 30% over next 5 years and be nearer equities than bonds
Growth of activity brings liquidity and transparency
Low correlation against both UK property and other asset classes makes it a strong diversifier
There is a compelling case for a significant European Property exposure in many portfolios
A case for European Property - Conclusion
A compelling investment opportunity
Source: Morley Fund Management. As at January 2007This is a forecast and should not be relied on as a recommendation for the fund.

Important information
The value of an investment in the fund and any income from it can go down as well as up. Investors may not get back the original amount invested.
The opinions are those of the Fund Manager and should not be relied upon as indicating any guarantee of return from an investment in the fund.
This fund invests not only in direct commercial property but property company shares and cash. Therefore the value of the fund will rise and fall in line not only with property values and rental income streams, but capital values and dividends of the shares; interest rates available on cash and the value of any other investments included in the fund.
The fund may have some investment in bonds or shares issued by companies in so-called ‘emerging markets’. This carries a higher risk than investing in larger, established markets. Investments in emerging markets are likely to experience greater rises and falls in value, and may have problems in trading and settlement.
When funds invest in bonds in overseas currencies, the value will go up and down in line with movements in exchange rates. In addition, the capital and income from a fund will rise and fall due to movements in interest rates.
The value of property investments is generally a matter of valuers’ opinion rather than fact. In addition property investments may not always be readily saleable and very occasionally there maybe constraints on cashing in units.
Norwich Union and Morley Fund Management Limited are both Aviva companies.
Norwich Union Investment Funds Limited. Registered in England No. 2503054. Norwich Union Investment Funds Limited is authorised and regulated by the Financial Services Authority. Registered Office 8 Surrey Street, Norwich, NR1 3NG. www.adviser.norwichunion.com.

The Case for European Commercial Property
Chris Laxton
March 2007


