21
FOR MEASUREMENT, ANALYSIS AND CONTROL, ONE NAME ALWAYS YIELDS MORE November 2021 Bad Ragaz, Switzerland

FOR MEASUREMENT, ANALYSIS AND CONTROL, ONE NAME ALWAYS YIELDS MORE
November 2021
Bad Ragaz, Switzerland

2Nov 2021
INFICON at a Glance
INFICON provides world-class
instruments for gas analysis,
measurement and control
Our core technologies are the
measurement of vacuum or the
use of vacuum to analyze
chemicals – primarily gases
Focus on four key markets
7% annual compound growth rate
from 2015 until 2020
General Introduction Key Markets Business Performance Company
4%
20%
49%
27%
Security & Energy
Refrigeration, Air Conditioning &Automotive
Semi & Vacuum Coating
General Vacuum
Q3 2021(Q3 2020)
17%
56%
3%
56%
24%

3Nov 2021
General Introduction Key Markets Business Performance Company
The INFICON World by Net Sales Distribution
Asia49%
North America
24%
Europe
26%
Rest of World1 %
WORLDWIDE Net Sales Q3 2021 BY REGION
Asia: 60 MUSD + 4%
Europe: 31 MUSD - 5%
North America: 29 MUSD - 15%
Rest of World: 2 MUSD
Total: ~122 MUSD - 3% (vs.Q2/21)
EUR
ASIA
NA

4Nov 2021
General Introduction Key Markets Business Performance Company
The INFICON World by Locations and Employees
Global market organization with 7 sales & service regions and 18 local offices
3 Centers of Competences:
• Syracuse (US)
• Cologne (DE)
• Balzers (LI)
5 supporting and specialized smaller manufacturing locations
About 1,300 employees worldwide
~ 500 employees~ 540 employees
~ 240 employees

5Nov 2021
A pure play in vacuum sensor technology serving attractive markets
Dominant positions as#1 or #2 in all addressed markets
Global presence with sales and service in the US, Europe, and Asia
Strategic focus: organic growth, profitability and technology leadership
Targeting highly specialized technology markets with attractive growth prospects
Solid balance sheet – no long term debt
Substantial amounts of free cash flow
generated every year
Healthy gross profit margins as a result
of an excellent market position and effective
design for manufacturability
Attractive shareholder dividend program
General Introduction Key Markets Business Performance Company
INFICON Investment Case
6Nov 2021
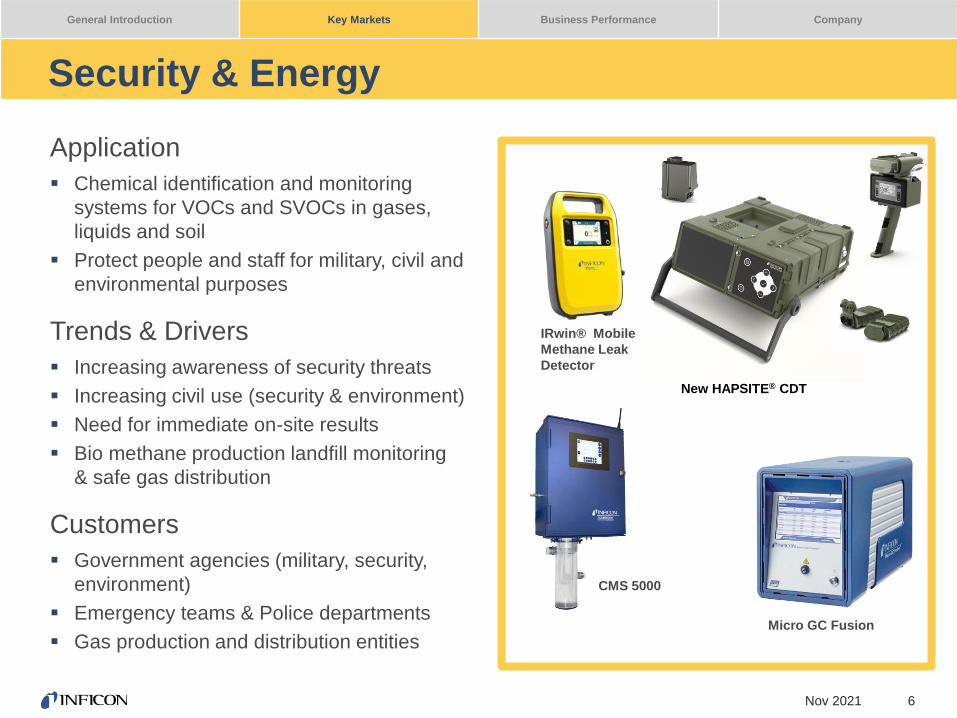
Application
Chemical identification and monitoring
systems for VOCs and SVOCs in gases,
liquids and soil
Protect people and staff for military, civil and
environmental purposes
Trends & Drivers
Increasing awareness of security threats
Increasing civil use (security & environment)
Need for immediate on-site results
Bio methane production landfill monitoring
& safe gas distribution
Customers
Government agencies (military, security,
environment)
Emergency teams & Police departments
Gas production and distribution entities
General Introduction Key Markets Business Performance Company
Security & Energy
New HAPSITE® CDT
Micro GC Fusion
CMS 5000
IRwin® Mobile
Methane Leak
Detector

Nov 2021 7
Asia
Europe
North
America
Other
Sales Q3 21 by Region in MUSD
33.1
25.5
29.026.6
19.7
15.5
2016 2017 2018 2019 2020 2021
Sales to End MarketSecurity & Energy-2.3% CAGR (2015 - 2020)
(in MUSD)(in MUSD)
General Introduction Key Markets Business Performance Company
Security & Energy
Performance Sales increase of 13% in Q3 2021 vs.
Q3 2020 and decrease of -15% vs. Q2 2021
OutlookMarket expectations 2021: challenging
New HapsiteTM Generation with new features
and expanded capabilities
US DoD programs pushed to 2022
Growing bio methane market
Growth opportunities in the US gas distribution
and landfill monitoring market
On-going government spending (China) for
environment monitoring

Nov 2021 8
D-TEK Stratus®
Refrigerant Leak
Detector
Protec® P3000
Helium Leak Detector
T-Guard2
HLD 6000 Leak Detector
Sentrac ® Hydrogen
Leak Detector
Modular Leak Detector
LDS 3000
Application
Detecting leaks:
Manufacturing: parts and components
Assembly lines: final quality tests
End-user: after sales service and repair
Trends & Drivers
Ongoing global high demand for RAC and increased
requirements to:
reduce environmental pollution
increase energy efficiency
reduce cost of poor quality
New opportunities in automotive:
New and existing battery technologies
Fuel cell technology (Hydrogen)
Increasing demand for leak tight parts
Customers
Haier, Gree, Samsung, Whirlpool, Liebherr, Midea etc. (RAC)
Daimler, GM, Ford, Fiat, Peugeot, VW, BMW, BYD, Laco,
Valeo, Bosch, etc. (Automotive)
J/B Industries, Home Depot etc. (Distributor)
General Introduction Key Markets Business Performance Company
Refrigeration, Air Conditioning & Automotive

Nov 2021 9
Asia
Europe
North America
Other
Sales Q3 21 by Region in MUSD
68.1
76.281.5
84.479.6
75.3
2016 2017 2018 2019 2020 2021
Sales to End MarketRefrigeration, Air Conditioning &
Automotive+6.7% CAGR (2015 - 2020)(in MUSD)(in MUSD)(in MUSD)(in MUSD)
General Introduction Key Markets Business Performance Company
Refrigeration, Air Conditioning & Automotive
Performance Q3 2021 sales increase of 27% vs. Q3
2020 and decrease of -8% vs. Q2 2021
Solid #1 position in RAC and increasing
market share in Automotive
Outlook
Market Expectations 2021: Growth
Rebound in the RAC market and
introduction of advanced, fully automated
industry 4.0 solutions, incl. new intelligent
SW
New market and product initiatives for
handheld after-sales service products in
automotive market
Shift from combustion engine cars to
E-mobility (battery and hydrogen powered)

Nov 2021 10
FABGUARD®
Fault Detection Software
NEW: UL 6000Fab
Leak DetectorHigh Temperature
CDG
Sion® RF-Sensor
Application
Control of vacuum based processes: Deposition (PVD, ALD & CVD, Evaporation)
Etch, Ion-Implantation, Cleaning
EUV Lithography and Device handling
Smart Manufacturing Software Solutions
Trends & Drivers
Growing demand for 5G, IoT, AR & AI, Big Data, Digitalization & Industry 4.0
Increased complexity and miniaturization
Drive towards mobility & energy efficiency
China’s Semi technology Initiative
Advanced Flat Panel Display technologies(OLED & Mini/Micro-LED/OLED)
Customers
AMAT, TEL, LAM, ASML, Naura, Canon (OEM)
Samsung, Intel, TSMC, GF, SMIC, BOE (End-User)
Optorun, Luxotica-Essilor, Zeiss, Bühler (Optics)
Chinese solar equipment manufacturer
General Introduction Key Markets Business Performance Company
Semi & Vacuum Coating Solar, Display, Optics & Semiconductor

Nov 2021 11
Asia
Europe
North
America
Other
Sales Q3 21 by Region in MUSD
General Introduction Key Markets Business Performance Company
Semi & Vacuum Coating Solar, Display, Optics & Semiconductor
Performance Sales Q3 2021 increase of 40% vs.
Q3 2020 and decrease of -7% vs. Q2 2021
#1 position in process control, leak detection
and thin film monitoring,
#2 for pressure measurement
OutlookMarket expectations for 2021: Growth (Semi)
Flat (Coating)
On-going global supply shortages
Continued investments in < 10nm nodes
and 3D chip design
Government incentives in US, EU & Asia
EUV lithography tools: a must for <7nm nodes
China Semi Initiative on-going, but challenged
by US/China technology and trade issues
Modest investments in OLED flat panel
display, Optics and Solar applications
120.6
167.0184.6
163.7
191.0 183.9
2016 2017 2018 2019 2020 2021
Sales to End MarketSemi & Vacuum Coating
+14.5% CAGR (2015 - 2020)
(in MUSD)(in MUSD)

Nov 2021 12
Transpector MPH
Mass Spectrometer
Contura S400 Leak Detector
for Food PackagingModul 1000
Helium Leak Detector
Full Line of Vacuum Gauges
Transpector MPH
Mass Spectrometer
Contura S400 Leak Detector
for Food PackagingModul 1000
Helium Leak Detector
Application
Measurement of vacuum processes:
Life Science, Analytics, Sterilization
Particle & Energy research centers
University & Industry laboratories
Industrial & Chemical processes
Food Packaging Quality Control
Trends & Drivers
Vacuum as affordable technology for cleanest process environment
One stop shop: our instruments are also sold as private label accessories to large vacuum pump manufacturers and distributors
Increased awareness of quality & cost issues in the MAP food packaging market
Customers
Pfeiffer Vacuum, Atlas-Copco, Agilent
Fanuc, IPI, AS, Ulvac, Ebara
General Introduction Key Markets Business Performance Company
General Vacuum

Nov 2021 13
87.9
104.9
115.3107.0 107.5
96.6
2016 2017 2018 2019 2020 2021
Sales to End MarketGeneral Vacuum
+1.1% CAGR (2015 - 2020)
(in MUSD)(in MUSD)
General Introduction Key Markets Business Performance Company
General Vacuum
Performance
Q3 2021 sales increase of 29% vs. Q3 2020 and 11% vs. Q2 2021
Most competitive “full liner” in vacuum instrumentation (#1 in the market)
Outlook
Market Expectations 2021: Growth
Market rebound
Growing China vacuum market
Expand market reach into industrial and analytical OEM markets
Expand distribution networks (US & Asia)
Multi brand strategy
Expand Food-packaging market reach from EU into US and China
Asia
Europe
North America
Other
Sales Q3 21 by Region in MUSD

Nov 2021 14
223 271
316 285 281
371
310
374
410 382 398
2016 2017 2018 2019 2020 2021
Q1-Q3 Q4
19.9 20.8 23.6 26.0 28.4
35.5
26.8 28.2 31.7
34.4
39.0
8.6% 7.5%7.7%
9.0% 9.8%9.6%
2016 2017 2018 2019 2020 2021
Q1-Q3 Q4
32.8
51.3 66.6
48.8 40.5
69.4
51.0
73.6 81.5
64.8
61.9
16.5%
19.7% 19.9%
17.0%
15.6%
18.7%
2016 2017 2018 2019 2020 2021
Q1-Q3 Q4
31 3442
32 30
65
53
61
52 5450
2016 2017 2018 2019 2020 2021
Q1-Q3 Q4Net Sales (MUSD)
Operating Income (MUSD and in % of Sales)
General Introduction Key Markets Business Performance Company
Key FinancialsOperating Cash Flow (MUSD)
R&D Cost (MUSD) and Ratio (in % of Sales)
+32%
+71%
+115%
+25%

Nov 2021 15
General Introduction Key Markets Business Performance Company
Balance Sheet Information
Very solid balance sheet structure
Net Cash position of USD ~42 Mio.
Current assets represent ~72% of
total assets
Shareholders’ equity ratio ~62%
25%
4%
19%
24%
3%
25%
34%
4%
62%
Assets Liabilities
MUSD 370.8 MUSD 370.8
Cash & short-term investments
Other current assets
Receivables
Inventories
Other non-current assets
Fixed assets
Equity
Non-current liabilities
Current liabilities

Nov 2021 16
78.9% 77.1% 75.9% 75.9%73.0%
65.2%62.0%
2016 2017 2018 2019 2020 Q3 20 Q3 21
General Introduction Key Markets Business Performance Company
Working Capital and Equity RatioWorking Capital (MUSD) and Ratio (in % of Sales)
Equity Ratio (in %)
Working Capital
WC in % of sales around the 38% level
Increase in Working Capital; driven by
clearly higher volume (Accounts
Receivables and Inventory)
Equity Ratio
Slight decrease to 62.0%
Solid balance sheet structure
4-point average of quarter-end Working Capital in MUSD
72.8
85.9
107.4 113.0
119.9
141.6
23.5% 23.0%
26.2%
29.6% 30.1%29.0%
2016 2017 2018 2019 2020 2021

Nov 2021 17
Full Year 2021 Guidance
Sales (MUSD)
Operating Income (MUSD)
Guidance 2021
The business situation in all end-markets
looks quite positive and even improved for
the business year. Although the current
economic situation remains nevertheless
fragile, INFICON assesses the outlook for
the current year as optimistic.
Sales USD 490-510 million
Op. Income Margin 18% - 20%
General Introduction Key Markets Business Performance Company
Full Year 2021 Guidance
279310
374410
382 398
2015 2016 2017 2018 2019 2020 2021
490-510
40
51
7481
65 62
14.3%
16.5%
19.7% 19.9%
17.0%15.6%
2015 2016 2017 2018 2019 2020 2021
18%-20%

18Nov 2021
Board of Directors Dr. Beat E. Lüthi Chairman
Dr. Richard Fischer Vice Chairman
Vanessa Frey Member
Beat Siegrist Member
Dr. Reto Suter Member
General Introduction Key Markets Business Performance Company
Board of Directors and Exec. Management
Executive Management Lukas Winkler
President & Chief Executive Officer
Matthias Tröndle
Vice President & Chief Financial Officer

19Nov 2021
General Introduction Key Markets Business Performance Company
Summary – INFICON Value
Leadership
Clear leadership position
in 4 addressed markets
Innovation
Innovate to improve customer yield
Innovate and design to lower cost
Growth
Attractive markets
Gaining market share
Earnings Leverage
Customer penetration (Key Account
Management) and efficiency programs
drive operational leverage
Cost structure allows quick adjustment
to downturn situations
Balance Sheet Strength
100% equity financing reduces risk
Dividend programs return excess cash
to shareholders

20Nov 2021
Listed on SIX Swiss Exchange (IFCN)
Major shareholders > 3% KWE Beteiligungen AG ~19%
7-Industries Holding ~9%
Chase Nominees ~5%
1832 Asset Management ~5%
Nortrust ~3%
Ameritrade Financials ~3%
UBS ~3%
Credit Suisse ~3%
> 50% of shares held by 8 investors
with > 3% each.
Dividend per Share and
Share Price at Year-end (in CHF)
General Introduction Key Markets Business Performance Company
Shareholder Value & Structure
Country # of Shareholders
Switzerland 3,831
Germany 277
United States of America 54
Liechtenstein 24
Rest of Europe 127
Rest of World 31
Total 4,344
Shareholders by Country
Shareholder Structure (12/2020)
# of Shares # of Shareholders
> 50,000 4
10,000 – 50,000 15
1 – 9,999 4,325
Total 4,344
Share Price Development 2012-2021
Source: www.six-swiss-exchange.com
15 13
16
20 22
18 16
308.25 320.25367.00
608.50
497.60
768.50808.00
2014 2015 2016 2017 2018 2019 2020

21Nov 2021


