This document and trademark(s) contained herein are protected by law as indicated in a notice appearing later in this work. This electronic representation of RAND intellectual property is provided for non-commercial use only. Unauthorized posting of RAND PDFs to a non-RAND Web site is prohibited. RAND PDFs are protected under copyright law. Permission is required from RAND to reproduce, or reuse in another form, any of our research documents for commercial use. For information on reprint and linking permissions, please see RAND Permissions. Limited Electronic Distribution Rights Visit RAND at www.rand.org Explore the RAND National Defense Research Institute View document details For More Information Purchase this document Browse Books & Publications Make a charitable contribution Support RAND This PDF document was made available from www.rand.org as a public service of the RAND Corporation. 6 Jump down to document The RAND Corporation is a nonprofit institution that helps improve policy and decisionmaking through research and analysis. THE ARTS CHILD POLICY CIVIL JUSTICE EDUCATION ENERGY AND ENVIRONMENT HEALTH AND HEALTH CARE INTERNATIONAL AFFAIRS NATIONAL SECURITY POPULATION AND AGING PUBLIC SAFETY SCIENCE AND TECHNOLOGY SUBSTANCE ABUSE TERRORISM AND HOMELAND SECURITY TRANSPORTATION AND INFRASTRUCTURE WORKFORCE AND WORKPLACE
Transcript
This document and trademark(s) contained herein are protected by law as indicated in a notice appearing later in this work. This electronic representation of RAND intellectual property is provided for non-commercial use only. Unauthorized posting of RAND PDFs to a non-RAND Web site is prohibited. RAND PDFs are protected under copyright law. Permission is required from RAND to reproduce, or reuse in another form, any of our research documents for commercial use. For information on reprint and linking permissions, please see RAND Permissions.
Limited Electronic Distribution Rights
Visit RAND at www.rand.org
Explore the RAND National Defense
Research Institute
View document details
For More Information
Purchase this document
Browse Books & Publications
Make a charitable contribution
Support RAND
This PDF document was made available from www.rand.org as
a public service of the RAND Corporation.
6Jump down to document
The RAND Corporation is a nonprofit institution that helps improve policy and decisionmaking through research and analysis.
This product is part of the RAND Corporation monograph series. RAND
monographs present major research findings that address the challenges facing
the public and private sectors. All RAND monographs undergo rigorous peer
review to ensure high standards for research quality and objectivity.
NATIONAL DEFENSE RESEARCH INSTITUTE
Prepared for the United States NavyApproved for public release; distribution unlimited
MODELS, METRICS, AND TOOLS
ISAAC R. PORCHE I I I , KATHERINE COMANOR, BRADLEY WILSON, MATTHEW J. SCHNEIDER, JUAN MONTELIBANO, JEFF ROTHENBERG
NAVY NETWORK DEPENDABILITY
The RAND Corporation is a nonprofit institution that helps improve policy and decisionmaking through research and analysis. RAND’s publications do not necessarily reflect the opinions of its research clients and sponsors.
Permission is given to duplicate this document for personal use only, as long as it is unaltered and complete. Copies may not be duplicated for commercial purposes. Unauthorized posting of RAND documents to a non-RAND website is prohibited. RAND documents are protected under copyright law. For information on reprint and linking permissions, please visit the R AND permissions page (http://www.rand.org/publications/permissions.html).
Published 2010 by the RAND Corporation1776 Main Street, P.O. Box 2138, Santa Monica, CA 90407-2138
1200 South Hayes Street, Arlington, VA 22202-50504570 Fifth Avenue, Suite 600, Pittsburgh, PA 15213-2665
RAND URL: http://www.rand.orgTo order RAND documents or to obtain additional information, contact
Library of Congress Control Number: 2010934102ISBN: 978-0-8330-4994-0
The research described in this report was prepared for the United States Navy. The research was conducted in the RAND National Defense Research Institute, a federally funded research and development center sponsored by the Office of the Secretary of Defense, the Joint Staff, the Unified Combatant Commands, the Department of the Navy, the Marine Corps, the defense agencies, and the defense Intelligence Community under Contract W74V8H-06-C-0002.
The Navy and DoD are increasingly dependent on networks and associated net-centric operations to conduct military missions. As a result, a vital goal is to establish and maintain dependable networks for ship and multiship (e.g., strike group) networks. An essential step in maintaining the dependability of any networked system is the ability to understand and measure the network’s dependability. The problem is that the Navy does not do this well. Existing metrics, as we will discuss, are insufficient and inaccu-rate; for example, they are not always indicative of user experiences.
The term network dependability is broad. It is determined, in part, by the avail-ability and reliability of IT systems and the functions these systems provide to the user. For the Navy, qualitative standards for network dependability include (1) the ability of the Navy’s IT systems to experience failures or systematic attacks without impacting users and operations, and (2) achievement of consistent behavior and predictable per-formance from any access point.
The complexity of shipboard networks and the many factors1 that affect the dependability of a network include
• hardware• software applications/services• environmental considerations (e.g., mission dynamics)• network operations• user (human) error• network design and (human) process shortfalls.
The above list was compiled from many sources, including academia and data from the fleet (Conwell and Kolackovsky, 2009). For example, the literature (Tokuno and Yamada, 2008; Gray and Siewiorek, 1991) reports that software faults and human errors are significant root causes of outages in computer systems.
The dynamics of a mission are also a factor affecting network dependability. Spe-cifically, geographic and geometric effects (e.g., line of sight for radio frequency trans-
1 Subfactors exist: For example, training levels and sufficiency of training and operating manuals can impact human errors.
xiv Navy Network Dependability: Models, Metrics, and Tools
missions, ships’ motions) may cause many intermittent line-of-sight blockages from ships’ infrastructures. The relative position of each ship can also affect interference. These effects are particularly important with regard to satellite communications.
Prior to our study, an effort to develop a tool to understand network availability and reliability for specific missions was undertaken by SPAWAR. This report builds upon that work by applying new insights to produce improved modeling of depend-ability overall and availability and reliability in particular. We did this by making changes to the initial SPAWAR tool to improve it. Among the changes: the incorpora-tion of new and more recent data sources, use of more detailed architectural consid-erations, and the inclusion of uncertainty for most of the availability and reliability measurements.
The overall objectives of this research were twofold: to better understand the shortfalls in developing an accurate awareness of network dependability (by the Pro-gram Executive Office [PEO] C4I) and to apply some of the resulting lessons learned to the enhancement of an existing SPAWAR tool. We discuss some of the drivers and causes for the inadequacy in current high-level C4I readiness reporting systems.
Measuring Dependability Today
Again, network dependability is an overarching term that is accounted for in part by the availability and reliability of networks and IT. The term network dependability can be used to describe (1) the ability of the Navy’s IT systems to experience failures or systematic attacks without impacting users and operations, and (2) achievement of consistent behavior and predictable performance from any network access point. There is not a single universally accepted measure for dependability when it comes to IT sys-tems and/or networks.
Nonetheless, both qualitative and quantitative standards are in use by the Navy. Operational availability (Ao) is quantified in a standardized way in many requirements documents. Operational availability is defined by OPNAV Instruction 3000.12A as follows:
Ao = Uptime/(Uptime + Downtime).
In earlier SPAWAR work, Larish and Ziegler (2008a) applied the Ao metric to strings of equipment that are necessary to accomplish a mission; they also developed the concept of end-to-end mission Ao (hereafter referred to as mission availability) as a metric for the availability of all the equipment threads necessary to support a given mission.
However, the Navy’s traditional definition of Ao is too general when applied to networks and fails to capture the nuances of network operations. The fact that the Ao metric is based on hard definitions of uptime and downtime and does not account for
Summary xv
“gray areas” of network performance, such as network congestion and degradation, is a shortfall. When networks are congested, for example, some users may perceive the net-work as being fully functional, while others users (and other metrics) may not. Partly as a result of the way that Ao is defined, there is a gap between what network users experience in terms of dependability and what existing fleet operational availability data suggest. This report attempts to explain why this gap exists and suggests measures that are needed to bridge the gap.
Measuring IT Dependability: User-Perceived Service Availability
A better framework for measuring network dependability should consider users’ per-ceptions of the dependability of the specific services that the network provides.2 The framework we propose incorporates the following:
• the types of services available to shipboard users• the volume of user requests for these services• the availability of these individual services• the impact of these services on various missions as well as the relative importance
of these missions (not assessed in this work).
We propose a framework for a new service-based availability metric: user-perceived service availability. Our goal is to re-orient the model to the user perspective by model-ing availability of services used by individuals to accomplish a mission. This was moti-vated by the work of Coehlo et al. (2003). The framework proposed follows three ideas: (1) model the service the user is trying to invoke (by factoring the availabilities of the hardware, software, and human interaction involved), (2) weight the number of users who can or do invoke the service, and (3) weight the mission impact of each service (not assessed in this study). While these three ideas are all discussed in our proposed framework, they are not all implemented in our network availability modeling tool. Future work is needed to further enhance the tool so as to fully incorporate all of the ideas in the proposed framework.
Drivers of Dependability, Availability, and Reliability
Reports suggest that hardware (equipment) failures are not the sole root cause of fail-ures of IT systems. Within PEO C4I, a CASREP (Casualty Report) study was recently completed using 169 CASREPs recorded aboard carriers (Conwell and Kolackovsky, 2009). Analysis of these CASREPs indicated that most of the problems fell into nine
2 For this report, a service is a discrete IT-based function/capability, such as a “chat” application, that meets an end-user need.
xvi Navy Network Dependability: Models, Metrics, and Tools
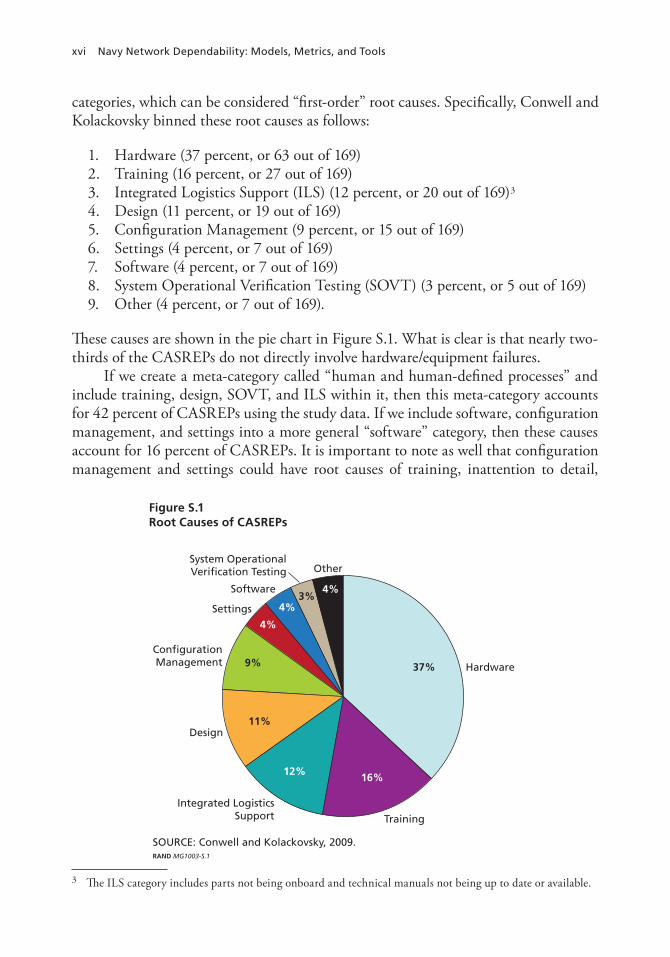
categories, which can be considered “first-order” root causes. Specifically, Conwell and Kolackovsky binned these root causes as follows:
1. Hardware (37 percent, or 63 out of 169)2. Training (16 percent, or 27 out of 169)3. Integrated Logistics Support (ILS) (12 percent, or 20 out of 169)3
4. Design (11 percent, or 19 out of 169)5. Configuration Management (9 percent, or 15 out of 169)6. Settings (4 percent, or 7 out of 169)7. Software (4 percent, or 7 out of 169)8. System Operational Verification Testing (SOVT) (3 percent, or 5 out of 169)9. Other (4 percent, or 7 out of 169).
These causes are shown in the pie chart in Figure S.1. What is clear is that nearly two-thirds of the CASREPs do not directly involve hardware/equipment failures.
If we create a meta-category called “human and human-defined processes” and include training, design, SOVT, and ILS within it, then this meta-category accounts for 42 percent of CASREPs using the study data. If we include software, configuration management, and settings into a more general “software” category, then these causes account for 16 percent of CASREPs. It is important to note as well that configuration management and settings could have root causes of training, inattention to detail,
3 The ILS category includes parts not being onboard and technical manuals not being up to date or available.
Figure S.1 Root Causes of CASREPs
SOURCE: Conwell and Kolackovsky, 2009.RAND MG1003-S.1
37%
16%12%
11%
9%
4%
4%
4%3%
Hardware
Training
Integrated LogisticsSupport
Design
ConfigurationManagement
Settings
Software
OtherSystem OperationalVerification Testing
Summary xvii
or other human process factors. Hence, the 42 percent statistic from this study data is really a lower bound on the percentage of CASREPs that result from human and human-defined processes, as Conwell and Kolackovsky’s first-order root causes do not necessarily map perfectly into human- and nonhuman-driven error categories.
Conwell and Kolackovsky’s observations are consistent with other literature that finds that more than 50 percent of failures in networked IT environments are caused by human error (Snaith, 2007; Kuhn, 1997; “Human Error Is the Primary Cause of UK Network Downtime,” 2003). Additional studies flag software: Hou and Okogbaa (2000) gathered industry data points and concluded that software is a major cause of failures in networks rather than just hardware for systems that involve both.
In summary, hardware equipment failures alone cannot account for gaps in net-work dependability. In addition to hardware/equipment failures, two significant driv-ers of dependability that cannot be ignored are (1) flawed human processes and human error, and (2) software problems. It is important to note that some academic publica-tions dedicated to the topic of human error in network reliability analysis focus on the issue of interface design. Although Conwell and Kolackovsky (2009) did not iden-tify interface design as a root-cause category in their CASREP assessment, interface design could be a significant contributing factor to a number of the CASREP causes. Improved interfaces must be considered as part of the larger solution set for improving Navy shipboard network dependability.
What We Can Use Now for Modeling Availability
RAND evaluated an existing spreadsheet that was designed by SPAWAR to model network availability for a specific antisubmarine warfare (ASW) mission. RAND built upon this model by
• incrementally expanding the resolution of the model to include some system components
• using nondeterministic values for mean time between failure (MTBF) and mean down time (MDT) from fleet data (Naval Surface Warfare Center –Corona [NSWC-Corona]) instead of fixed required values in requirements documents
• parameterizing values when data (MTBF, MDT) are missing, unavailable, or assumed (MDT was broken down into the components of mean time to repair [MTTR] and mean logistic delay time [MLDT])
• enabling Monte Carlo–based sensitivity analysis on a per-component or -system basis
• making the model updatable and user-friendly: allowing for constant changes in data based on field measurements of Ao
• making the model user-friendly: adding a front-end (VBASIC) graphical user interface (GUI) to allow users (e.g., decisionmakers) to modify assumptions and certain values/factors
xviii Navy Network Dependability: Models, Metrics, and Tools
• developing exemplar models for both SameTime chat and common operational picture (COP) services to better evaluate user perceived service availability.
Analysis of component availability using the newly modified tool (or “new tool”) was done and is described in this report.
Exemplar Analysis Results
Antisubmarine Warfare Mission
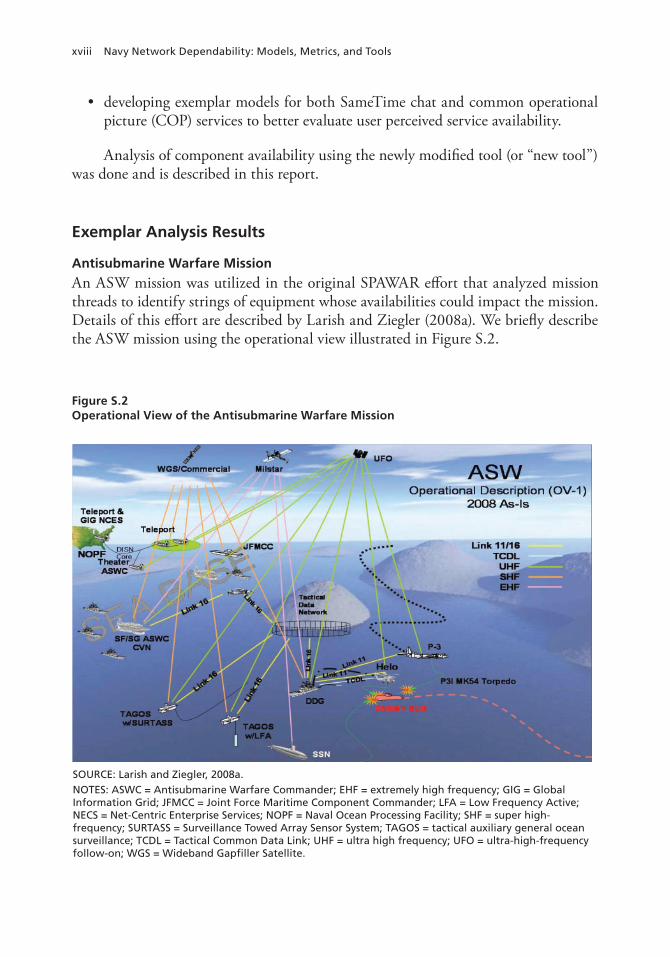
An ASW mission was utilized in the original SPAWAR effort that analyzed mission threads to identify strings of equipment whose availabilities could impact the mission. Details of this effort are described by Larish and Ziegler (2008a). We briefly describe the ASW mission using the operational view illustrated in Figure S.2.
Figure S.2 Operational View of the Antisubmarine Warfare Mission
SOURCE: Larish and Ziegler, 2008a.NOTES: ASWC = Antisubmarine Warfare Commander; EHF = extremely high frequency; GIG = GlobalInformation Grid; JFMCC = Joint Force Maritime Component Commander; LFA = Low Frequency Active; NECS = Net-Centric Enterprise Services; NOPF = Naval Ocean Processing Facility; SHF = super high-frequency; SURTASS = Surveillance Towed Array Sensor System; TAGOS = tactical auxiliary general ocean surveillance; TCDL = Tactical Common Data Link; UHF = ultra high frequency; UFO = ultra-high-frequency follow-on; WGS = Wideband Gapfiller Satellite.
Summary xix
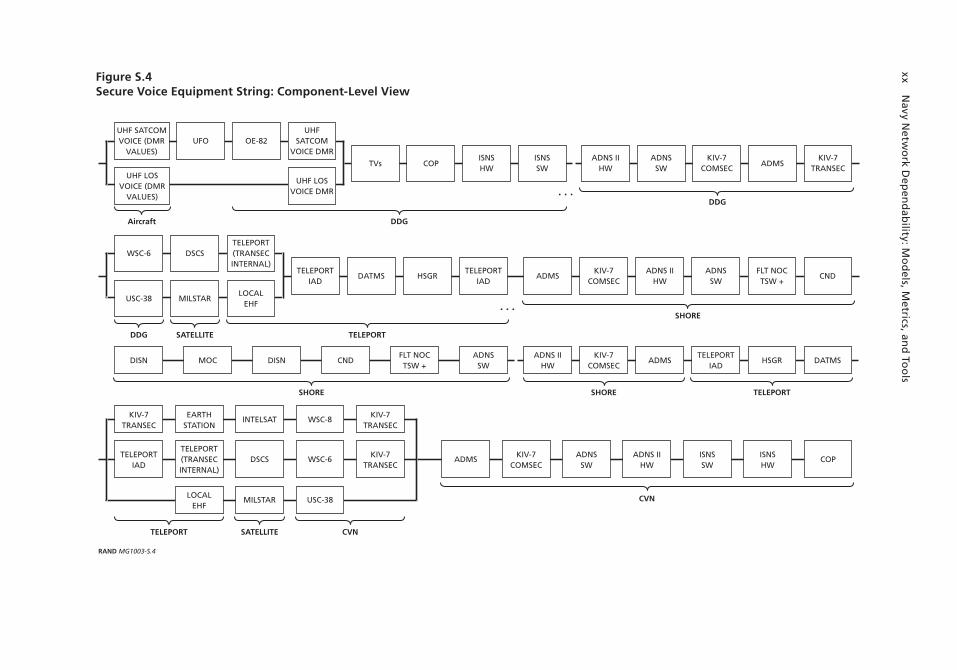
Figure S.3 illustrates three equipment strings used in the ASW mission: an “IP (Internet Protocol) network” string that enables ship-to-shore data exchange, a secure voice string that enables secure voice communications, and a “tactical datalink” string that enables other data exchanges among aircraft, ship, and shore. These equipment strings enable exchanges across the network that are required for the ASW mission.
Each of these equipment strings consists of many individual components. For example, Figure S.4 shows a component-level view of the secure voice equipment string.
Exemplar Sensitivity Analysis
We used the new tool to determine which components of the ASW mission network have the greatest impact on overall mission availability, as well as which components have the greatest impact on the availability of specific equipment strings within the network.
We found that the Digital Modular Radio, or DMR (shown as a component on the DDG in Figure S.4), is the most sensitive component when considering the entire ASW mission Ao. Specifically, a one-standard-deviation increase in the DMR’s mean down time results in a 2-percent decrease in the mean value of the mission Ao.
Figure S.3 Equipment Strings Used in the ASW Mission
We also analyzed equipment strings in isolation. For example, for the link equip-ment string, we found that Common Data Link Monitoring System (CDLMS, AN/UYQ-86) is the most vital component in terms of the availability of the equipment string. Specifically, a one-standard-deviation increase in the mean down time of the CDLMS results in a 4-percent decrease in the link equipment string’s overall availability.
Comparing the New Tool with the Old Tool
We summarize here the results that compare the original SPAWAR 5.1.1 spreadsheet model (the old tool) with RAND’s modifications to it (the new tool) for Ao values in the ASW mission’s equipment strings. A major difference in results between the new model and the old one is that the new one is far less optimistic about component avail-ability. This is due to the inclusion of real-world data and uncertainty. The major dif-ferences between the two efforts are enumerated as follows:
• The old model (SPAWAR 5.1.1 Pilot Effort): – used requirements’ threshold and objective values for system and component performance specifications (MTBF and MDT)
– employed a deterministic model (e.g., factored in no uncertainty) and thus generated a single value for equipment string and overall mission availability.
• The new model (RAND’s Modified Model): – uses historical data (where available) instead of purely data from requirements documents
– employs a stochastic modeling approach: 0 fits historical data to probability distributions to describe system and com-ponent performance specifications (MTBF and MDT)
0 generates distributions describing probability of a given availability for equipment strings and for the overall mission.
RAND’s modified tool adds additional functionality to the old model as well. Specifically, the new tool performs sensitivity analysis of the systems and components in the model to determine their relative importance on the individual equipment strings and overall mission availability. For example, the new tool allows the user to isolate particular network segments, such as the Automated Digital Network System (ADNS) and the Integrated Shipboard Network System (ISNS), and to perform sepa-rate analyses on that portion of the network.
Figure S.5 shows a large range of potential availabilities. This is because the new tool accounts for uncertainty in measures that drive availability. Ninety percent confi-dence intervals are shown on the plots in darker blue. Means are shown as white dots.
xxii Navy Network Dependability: Models, Metrics, and Tools
The Way Ahead
The fundamental issue that motivated this research effort was communicated to us by the sponsor (PEO C4I) as follows. There is a need to understand why perceptions about the dependability (e.g., availability) of networks from users’ (e.g., sailors) per-spectives sometimes differ from the availability data acquired from the “usual” sources (e.g., NSWC-Corona Reliability, Maintainability, and Availability [RMA] data). We did not attempt to substantiate users’ perception of a lack of network availability by directly surveying them. But the correctness of this perception seems likely from our investigations, which identified the many factors that impact network dependability that are not accounted for well today. The way ahead for this research and the Navy is to consider ways to fold the additional factors into today’s assessment process for net-work dependability. We enumerate some of the ways to do this as follows.
Fuse More Data Sources to Model Dependability of Networks
During the course of this study, we encountered numerous sources of availability and reliability data. NSWC-Corona is the most visible source of RMA data, and, as a result, they served as our primary source for component data for use in our models. However, in addition to NSWC-Corona RMA data, which mainly documents hard-ware failures, there are other data sources that contain Remedy Trouble Ticket System (RTTS) data, which could be used to take into account user-reported failures.
Figure S.5 Comparison of Mission Availability: Old Versus New Model
RAND MG1003-S.5
Ava
ilab
ility
IPequipment
string
0.9
0.8
0.7
0.6
0.5
0.4
0.3
0.2
0.1
1.0
0Secure voiceequipment
string
Tactical datalinkequipment
string
EntireASW mission
Large availability range dueto long tails of distributions
Objective
Threshold
SPAWAR 5.1.1
RAND90 percentconfidenceinterval
Mean
Summary xxiii
New methods should be pursued to take into account such user-reported failures as recorded in TTS data, which include
• Remedy (for ADNS and ISNS)• Fleet Systems Engineering Team (FSET)• Information Technology Readiness Review (ITRR)• Board of Inspection and Survey (INSURV)• Deploying Group Systems Integration Testing (DGSIT).
In this study, we were able to study ISNS and ADNS trouble-ticket data from Remedy to analyze human-error impacts on availability. According to a Gartner survey (2007), this is done in the commercial world by more than a few organizations. Future models could use this approach to develop predictions of the human impact on network dependability.
In summary, there are other data sources (beyond availability data from NSWC-Corona) that can provide valuable insight into network dependability. However, due to their varying formats, they did not lend themselves to a standardized data-extraction process. The Navy could standardize trouble ticket system data so that they have uni-form reliability metrics. However, there is no central repository to consolidate all these data, making analysis difficult.
Rely on User-Perceived Service and Mission Availability Metrics
We believe that user-perceived service availability is an important metric for Navy net-works. User-perceived service availability can be defined as the number of correct (e.g., successful) service invocations requested by a particular user for a given number of total service invocations requested by that user, for a given time interval. The Navy can leverage current efforts by the Information Technology Readiness Review to develop data on the success and failure of a service invocation.
Modeling the availability of a particular service is easier to conceive than to calcu-late: An understanding (e.g., diagrams) of all the hardware and software involved—as well as the human interaction that takes place—will be needed to account for what composes the service (e.g., chat). Such an effort could prove worthwhile because it could yield a better assessment of IT and network dependability, e.g., one that matches user sentiment of dependability.
Further Enhance Existing Tools
As suggested by the PMW 750 CVN C4I CASREP study report (Conwell and Kolackovsky, 2009), PEO C4I has a need to establish a C4I performance dashboard using NSWC-Corona data.4 The framework and tool described in this research can con-
4 PMW 750 is an organization within PEO C4I that serves as the integrator for C4I systems.
xxiv Navy Network Dependability: Models, Metrics, and Tools
tribute to that goal. Toward this goal, RAND recommends that the newly developed network availability modeling tool described herein be made web-based and upgraded to automatically incorporate the latest historical data from NSWC-Corona as they are made available. It should also be made to fuse other data sources, as described above, and to incorporate mission impacts to allow more-relevant sensitivity analysis.
Create a Single Accessible Portal for Network Diagrams
PEO C4I should consider a way to facilitate a holistic view of all afloat and shore net-works. A major challenge to this study was to gather and consolidate disparate net-work diagrams to come up with a comprehensive end-to-end architecture. SPAWAR has made initial inroads in this task with the development of a website (not available to the general public) intended specifically for in-service engineering agents (ISEAs), which contains network diagrams for afloat platforms. The addition of shore network diagrams to this website would greatly facilitate the reliability study of additional net-work services.