57
Visit FreeTestPaper.com for more papers

J2 H2 Economics (9732/01) 1
PAPER 1 Monday 14 September 2015 08:00 – 10:15 TIME : 2 hours 15 mins INSTRUCTIONS TO CANDIDATES Do not open this paper until you are told to do so.
Write your name, class and name of economics tutor in the space provided on the writing paper. Do not use staples, paper clips, glue or correction fluid/tape. Answer all questions. The number of marks is given in the brackets at the end of each question. Write your answers on the writing papers provided. If you use more than one sheet of paper, fasten the sheets together. Submit the answers for both case study questions separately. You are advised to spend several minutes per question reading through the data and questions before you begin writing your answers.
There are _8_ printed pages including this cover page
PRELIMINARY EXAM 2015
Economics JC2 H2 (9732/01)
NYJC

J2 H2 Economics (9732/01) 2
Answer all questions. Question 1
The Automobile Industries in India and Thailand
Figure 1: Population Growth in India
Source: The World Bank
Extract 1: Traffic congestion and productivity losses
With growing prosperity in India, an increasing number of people can now afford their own private vehicles. Public transport is becoming an inferior good for many of them. They prefer travelling by their own cars to save time, to avoid the hassles of coordination in case of car-pooling, and to increase their comfort while travelling. The states with the highest number of motor vehicles per 100 people are Goa, Delhi, Tamil Nadu, Gujarat and Haryana. Delhi has the highest number of cars per 1,000 people (262). It also has the highest number of vehicles per km of road length, which thus increases the likelihood of congestion on roads. Often, because of this, states like Delhi face crippling traffic bottlenecks leading to a standstill in peak hours. Poor road infrastructure, traffic mismanagement, lack of efficient public transport—the reasons can be numerous, but at the end of the day, all of this is resulting in an increase in congestion on roads leading to traffic chaos and ultimately huge loss of time and hence productivity of the nation. So, the increase in the prosperity of the nation is actually turning into economic losses for the nation. Also, there are environmental losses with the increase in air pollution, losses due to increase in accident rates on roads, increase in maintenance expenditure of road infrastructure, losses due to delays and lost opportunities which collectively cost millions to the nation each day. This will eventually hamper India’s ability to reach its potential.
Source: Adapted from The Indian Express, Oct 27, 2012
1
1.2
1.4
1.6
1.8
20
00
20
01
20
02
20
03
20
04
20
05
20
06
20
07
20
08
20
09
20
10
20
11
20
12
20
13
20
14
Population Growth Rate in India (%)
Figure 2: Vehicle Population Growth in India

J2 H2 Economics (9732/01) 3
Extract 2: When it Comes to Reducing Car Congestion, India’s Cities Can Learn from its
Businesses
City governments in India are still focused on investing in road expansions and overpass construction projects rather than curbing car dependence and improving public transport services. Instead of waiting for local governments to act, a handful of Indian businesses are taking the initiative to implement transport demand management (TDM) strategies, improving the productivity of their employees and reducing the social costs of car congestion. Employer-initiated TDM strategies have been especially common in the information technology (IT) sector, because most IT employees in India use private cars to commute to and from work. These strategies have been relatively easy to implement given the availability of information—such as employees’ origins and destinations, duration, and frequency of trips—for designing optimal transit and carpool routes. Some initiatives have included providing employees with commuter subsidies for public transport or carpooling. Other businesses have experimented with company buses that transport workers from nearby metro stations to offices, providing much-needed “last-mile connectivity.” These programs have successfully shifted 30-50 percent of the targeted employees from cars to public transport, resulting in reduced travel times and significant cost savings for employers. Not only are employees more productive from shorter commutes, bus and other public transit subsidies are much cheaper compared to private company buses. For example, Wipro worked with the Bangalore Metropolitan Transport Corporation on specific routes designed to move workers more comfortably and efficiently. This initiative encouraged employees to commute by bus rather that private vehicle and is credited with reducing employee carbon footprint by almost 16 percent in the first year of implementation.
Source: Adapted from World Resources Institute, Anjali Mahendra and Pawan Mulukutla, June 03, 2015
Extract 3: India Threatens Thai Automobile Industry’s “Detroit of the East” Title
As if things were not bad enough already for Thailand’s prestigious automotive sector a report by Standard Chartered Bank (SCB) shows that the country’s claim as the “Detroit of the East” could be lost in less than five years. In the first seven months of 2014 the Thai automobile industry produced 1.1 million vehicles, a 28.5 per cent drop on the same period last year. In 2009 India became Asia’s fourth largest exporter of passenger vehicles behind Japan, South Korea and Thailand and in 2011 became the sixth largest passenger vehicle exporter in the world, exporting more than 3.9 million vehicles. While the two countries are presently not direct competitors in the global market yet, they go head-to-head in several Asean markets. The report notes that several automotive manufacturers serving the Asean market are increasingly sourcing their engines from India. The Thai automobile industry has been particularly hard hit due to the political upheavals in 2013 and 2014, with violent anti-government protests, sand-bagged fortress barricades and

J2 H2 Economics (9732/01) 4
daily street marches aimed at strangling Bangkok. These events cast a pessimistic shadow over the Thai economy. Even the most optimistic prediction for full year Thailand 2014 GDP forecasts a maximum growth of just 2 per cent – 60.78 per cent below the 5.1 per cent in 2014. Moreover, It has also suffered from a lack of skilled workers as well as low productivity of about 3.69 vehicles per employee, compared with 11-12 vehicles per employee in Japan. The Federation of Thai Industries (FTI) said the number of skilled workers available to feed the rapidly expanding Thailand automotive industry is an ongoing concern and developing highly skilled and knowledgeable workers is crucial.
Source: Adapted from The Establishment Post, John Le Fevre, September 16, 2014
Questions
(a) Compare the trends in population and vehicle population figures in India from 2002 to 2008.
[2]
(b) Explain why public transport is considered an ‘inferior good’ in India.
[2]
(c) Suggest a possible reason for the difference in productivity between the Thai and Japanese automobile industry.
[2]
(d) (i) Explain what is meant by the term third party costs.
[2]
(ii) “Instead of waiting for local governments to act, a handful of Indian businesses are taking the initiative to implement transport demand management (TDM) strategies.” Explain why private companies in India would take the initiative to implement TDM strategies.
[4]
(e) Assess whether the subsidy for public transport is the most effective policy in addressing the congestion problem in the Indian cities.
[8]
(f) “In the first seven months of 2014 the Thai automobile industry produced 1.1 million vehicles, a 28.5 per cent drop on the same period last year.” To what extent is the rise of the Indian automobile industry the main reason for the above development in the Thai automobile industry?
[10]
[Total: 30]

J2 H2 Economics (9732/01) 5
Question 2
US economic recovery and its impact on Asia
Extract 4: What Fed's tapering means
The Quantitative Easing (QE) program which began after the financial crisis in 2008 has led to a growing momentum of US economic recovery. QE kept interest rates low and this had a major impact on investments and consumption in the US. The US Central Bank (Fed) has repeatedly linked the QE program with the labour market and inflation condition. With a stable and improving labour market, there is anticipation for the Fed to initiate a tapering of the QE program in the near future. The tapering of the QE, which in general means a reduction in the monthly bond purchase program, may result in a reduction of liquidity in the market and perhaps a hike in interest rate. If that is so, corporate borrowing cost may increase with higher interest rate and this can hurt corporate earnings in the US. With higher interest rates, there is likelihood of USD to appreciate in the medium term.
Source: Adopted from “What the Fed’s tapering means for Singapore”, 6 June 2013
Extract 5: US economic recovery finally taking hold in 2014
The latest government data shows the economy has bounced back sharply in 2014, and that momentum is expected to carry into next year. There are signs that the 2013 growth slide has finally given way to what economists call a "virtuous cycle," in which improvement in one part of the economy feeds into the others, creating a self-sustaining expansion. America is recovering for a few reasons. While many governments are tightening belts, America’s is not: for the first time in five years, public spending as a proportion of GDP rose in 2014. American shoppers are flush with cheap credit. Lower oil prices also help, since America is still a net importer of the stuff. The pace of the US growth of course, depends on when the Federal Reserve will decide to begin raising interest rates all the way back to more "normal" levels, and how quickly those rates begin to rise. And while the U.S. seems to be back on its feet, the economy in the rest of the world is stumbling again. China's once red hot growth pace has slowed, and long-running efforts to revive growth in Europe and Japan continue to come up short. That–along with a stronger dollar–could hurt demand for U.S. exports. But for now, it looks like much of the U.S. economic recovery is solidly on track.
Source: CNBC, www.cnbc.com, 25 Dec 2014

J2 H2 Economics (9732/01) 6
Extract 6: When US interest rates rise: Singapore wins, Hong Kong loses
Economists at Bank of America (BofA) forecast that the Fed to hike interest rate at every other meeting in 2015 and 2016, bringing the funds rate to average 3.5% in the long run. But what would such an increase mean for Asia and its companies? “Asian exports and growth typically strengthened during the past three episodes of US Fed rate hike cycles" That’s because rate increases are associated with stronger GDP growth in the US. For at least one market, Hong Kong, the implication is clear. Its banks will have to increase interest rates as well, because the Hong Kong dollar is pegged to the US dollar. So the cost of doing business is going to go up, particularly for enterprises with large bank borrowings. For other economies, the impact is more mixed. The winners, according to the Bank of America economists, would be the “Asian exporters,” which include Korea, Malaysia, Singapore and Taiwan, and the manufacturing companies that sell into the US. But the GDP improvement in the Asian exporters may not be as strong this time around. Asia’s sensitivity to US GDP growth “appears to have fallen compared to the past,” says Bank of America. One reason is the fall in the US share of the global economy, from 33% in 2001 to about 23% last year. At the same time, China’s share has climbed to about 12%. So even if US GDP growth improves – Bank of America forecasts 3.3% expansion in 2015, a full percentage point higher than its 2.3% forecast this year – the impact on the exporters may be more muted because of China’s economic slowdown.
Table 1: BofA estimation on the impact on Asia’s Growth due 1% expansion in the US
and a 1% contraction in China.
Overall impact Impact of +1% US
growth
Impact of -1% China
growth
Singapore 1.1 1.7 -0.6
Taiwan 0.7 1.25 -0.6
Malaysia 0.3 0.75 -0.5
Korea 0.2 0.45 -0.3
Hong Kong 0.2 1.25 -1.1
Thailand 0.1 0.60 -0.5
Indonesia -0.1 0.25 -0.3
India -0.2 0.05 -0.2
Source: BofA Merill Lynch Global Research estimates

J2 H2 Economics (9732/01) 7
The net impact of the divergent US-China growth may be beneficial for Singapore, Taiwan and Malaysia because they are electronics exporters, but negative for commodity exporters Indonesia (coal, palm oil) Thailand (rubber, food), and to some extent Malaysia (palm oil). “The positive impact from firmer US growth (which benefits manufacturing exporters) [could be] partly negated by weaker China growth (which hurts commodity exporters),” reckons Bank of America. The main mode of transmission would be import demand for goods in the US and for commodities in China. “How Asia fares will largely depend on how strong the US economic recovery will be in the coming years, as the Fed normalize interest rates,” Bank of America sums up.
Source: www.cfoinnovation.com, 13 Oct 2014
Hong Kong Exports To Singapore Exports To
China 47% China 14%
ASEAN 5.8% Malaysia 12%
Malaysia 3.3% Indonesia 12%
United States 3.2% Hong Kong 7.2%
India 3.1% Australia 6%
Hong Kong Imports From Singapore Imports From
China 50% China 12%
Japan 7.2% Malaysia 10%
United States 5.7% South Korea 8.4%
South Korea 5.7% United States 7.3%
Singapore 3.7% Japan 6.1%
Source: www.aseanbriefing.com, 2015
Table 3: Summary of the US economy
2011 2012 2013 2014
GDP growth (%) 1.6 2.3 2.2 2.4
Unemployment 8.3% 8% 6.6% 5.7%
Inflation 2.93% 1.59% 1.58% -0.09%
US Government Budget (%GDP) -10.7 -9.3 -6.4 -5.8
US Government Budget balance (US$bn) - 1299 - 1100 - 680 - 492
Table 2: Trade of Hong Kong and Singapore
Source: Various

J2 H2 Economics (9732/01) 8
Questions (a) (i) Describe the trend in the US government budget balance between 2011 and
2014. [2]
(ii) Explain how the trend in the US government budget balance is expected to affect the US inflation rate.
[2]
(b) With the use of a diagram, explain how the “Fed's tapering” may cause an appreciation of the US dollar.
[4]
(c) Extract 5 explains that the 2013 growth slide has given way to what economists call a "virtuous cycle". Using the concept of the circular flow of income, explain how such a change will affect the equilibrium level of national income in 2014.
[4]
(d) With reference to the data, discuss whether economic growth in US is expected to improve from 2014 and beyond.
[8]
(e) Assess the likely impact of an increase in interest rates in the US and divergent US-China growth on the balance of payments of Singapore and Hong Kong.
[10]
[Total: 30]

2015 Prelim (CSQ #1) H1 & H2
Mark Scheme
a. Compare the trends in population and vehicle population figures in India from 2002 to 2008.
2m
Similarity: Both population and vehicle population figures are increasing (1) Difference:
- Vehicle population is growing much faster than human population.OR
- Population figures are increasing at a decreasing rate, but vehiclepopulation are increasing at an increasing rate (1)
b. Explain why public transport is considered an ‘inferior good’ in India. 2m
Incomes are rising, growing prosperity leads to falling demand for publictransport YED is negative (expected for H2, not for H1) (1)
Either: Longer travel time, Or: Poorer comfort levels (1)
c. Suggest a possible reason for the difference in productivity between the Thai and Japanese automobile industry.
2m
Identify the difference: The Thai automobile industry is less productive than the Japanese automobile
industry
Suggest a possible reason: Either: The quality of labour is are likely to be higher as they are generally more
well educated. Or: Japan may possess more capital goods. Moreover, these capital goods may
be of higher quality and technology level compared to what Thailand has.
d. (i) Explain what is meant by the term third party costs. 2m
Third party costs are: Costs arising from an economic activity that falls on parties not directly
involved in the transaction (1) And are not taken into account by those who directly participate in the
economic activity (1)
(ii) “Instead of waiting for local governments to act, a handful of Indian businesses are taking the initiative to implement transport demand management (TDM) strategies.”
Explain why private companies in India would take the initiative to implement TDM strategies.
4m (H1 6m)
- Identify that the firms are part of the 3rd party costs. (1m) H1 (1m) - Explain how TDM reduces these costs. (1m) H1 (3m) - (use framework) (2m) H1 (2m)
The third party costs incurred due to congestion includes the time wasted sittingin traffic. This results in a loss of productivity.
Private companies are the third parties that bear the costs due to time wastageand productivity. The cost of production face by private producers is higher thanwhat it could be if the congestion problem is alleviated.
TDM strategies will be able to improve the productivity of the private firms,thereby reducing their cost of production.

From the private firm’s perspective, the objective is to maximise profits. If the benefits of implementing TDM due to the lowered cost of production are greater than the costs, then the firms should take the initiative to provide the TDM.
Examples of benefits and costs o Benefits: Workers more likely to get to work on time and less tired out by
traffic increase in number of hours worked, increased productivity o Costs: Rental of company buses and hiring bus drivers
Increased productivity due to the TDM would shift the firms’ supply curve rightwards from S0 to S1, resulting in a fall in equilibrium price from P0 to P1 and equilibrium quantity from Q0 to Q1
Assuming that the demand for the goods of these firms is price elastic, a fall in price due to the increase in supply would result in an increase in TR.
Assuming that the increase in TC due to TDM is less than the increase in TR, firms will take the initiative to implement TDM.
e. Assess whether the subsidy for public transport is the most effective policy in addressing the congestion problem in the Indian cities.
8m
(Note: Students can interpret the subsidy for public transport as either a subsidy to producers of public transport, or a subsidy to consumers of public transport) Introduction:
A subsidy on public transport could encourage Indian consumers to use more public transport and reduce the usage of private vehicles. This could result in fewer vehicles on the roads, and therefore, alleviate the problem of congestion.
However, this policy might not be very effective as it does not directly reduce the number of cars on the roads. Moreover, imposing a subsidy also have other limitations.
Body 1: Explaining the negative externality
Congestion is a negative externality that arises due to the overconsumption of private vehicles. Consumers aim to maximise their net private benefit. Thus, in deciding the amount of car usage to consume, they will equate MPC and MPB, and consume at point Qp. At Qp, the net private benefits are maximised.
However, the negative externality that results from car usage causes a divergence between MSC and MPC. At Qp, the MSC is higher than MPC, resulting in a deadweight loss.
From society’s point of view, the social optimum consumption level is at Qs, where MSC = MSB. This point maximises society’s net benefit.
D
Price
Quantity Q0
S0
Q1
S1
P0 P1

Body 2 (Thesis): Subsidising provision of public transport can address congestion
Giving a subsidy to the producers of public transport would allow them to reduce their cost of production. Thus, the supply for public transport will increase from S0 to S1. Thus, the eqm price for public transport will fall from P0 to P1, and equilibrium quantity will increase from Q0 to Q1. This implies that, after the subsidy, public transport is cheaper and easily available.
Since public transport and cars are substitute goods, a decrease in price of public transport due to the subsidy will result in the decrease in demand for cars from D0 to D1.
As public transport is cheaper and easily available, the relative MPB for car usage will be lowered from MPB to MPB1.
As public transport is cheaper and easily available, the relative MPB for car usage will be lowered from MPB to MPB1. Consumers will now consume that MPB1 = MPC, which results in the output level to be at Qs. This coincides with the social optimum level of car usage.
Price
Quantity of car usage QS QP
MPC
MSB = MPB MPB
MSC = MSC + MEC
D1
Price
Quantity Q1 Q0
S0
D0
Market for private cars
D
Price
Quantity Q0
S0
Q1
S1
Market for public transport
P1
P0
MPB1
Price
Quantity of car usage QS QP
MPC
MSB = MPB MPB
MSC = MSC + MEC

Body 3 (Anti-thesis 1): Limitations of subsidising provision of public transport
It attempts to address the problem of over-consumption of cars through improvement of public transport. In a way, the policy is not directly addressing the root cause of the problem.
The effectiveness of the subsidy depends on how strong a substitute consumers regard public transport is compared to cars.
Body 4 (Anti-thesis 2): Alternative measures
Tax on the ownership and usage of cars Quantity restriction on the number of cars that can used on the roads
Conclusion: Stand and justification
A subsidy on public transport may not be the most effective solution to address the market failure due to car usage.
Firstly, it does not directly address the problem. An alternative policy that directly addresses the problem, like a tax on car usage, should be more effective.
Moreover, in India, consumers do not consider public transport to be a good substitute to cars as the quality and reliability of the public transport is very low.
L1 One-sided answer that shows basic knowledge of either subsidies or an alternative policy
1-3m
L2 Well- explained but one-sided argument (e.g. only explained why subsidy is / is not the best policy, without any consideration of alternatives.)
Two-sided argument that explained how a subsidy on public transport and an alternative policy might work to solve the congestion, with reference to extracts and context of India.
Max 4m
4-6m
E Shows evaluation through a comparison of the policies, and arrive at a justified conclusion.
1-2m
f. “In the first seven months of 2014 the Thai automobile industry produced 1.1 million vehicles, a 28.5 per cent drop on the same period last year.” To what extent is the rise of the Indian automobile industry the main reason for the above development in the Thai automobile industry?
10m (H1 8m)
Introduction:
Automobiles produced in India and Thailand are close substitutes of each other. Therefore, it is possible that the rise of the Indian automobile industry could lead to the worsening of the Thai automobile industry.
However, there are also internal reasons for the decline in the Thai automobile industry.
Thesis: Rise in Indian Auto industry caused the 28.5% drop in Thai auto industry.
Rise of the Indian automobile industry provided a decent alternative to the Thai vehicles in the global automobile market. This resulted in some consumers

switching to Indian automobile firms due to the lower prices offered by India, ie “several automotive manufacturers serving the Asean market are increasingly sourcing their engines from India”
The rise in Indian automobile industry could have led to the a reduce in demand for Thai automobiles. Demand for Thai automobiles fall from D0 to D1. Consequently, there is a decrease in equilibrium quantity of Thai cars from Q0 to Q1
Anti-thesis: Rise in Indian Auto industry did not cause the 28.5% drop.
The Thai automobile industry could have declined due to domestic problems like political upheavals and lack of skilled workers.
Political upheavals could have resulted in a fall in consumer confidence. Thus, consumers will reduce their consumption of big ticket items like cars. Demand for Thai automobiles decreases from D0 to D1.
Political upheavals also caused road blockages and decrease in productivity. These could cause an increase in cost of production. Thus, supply of Thai automobiles will decrease.
Lack of skilled workers also causes a decrease in productivity. Taken together, supply decreases from S0 to S1.
As a result, equilibrium quantity for Thai automobiles dropped significantly from Q0 to Q1.
Conclusion:
It is likely that domestic concerns are the main reasons for the 28% drop in the Thai automobile industry.
The rise of India only exerted a minimal effect as India and Thailand are only directly competing in the ASEAN market, which is not big in global terms.
Moreover, the domestic concerns in Thailand are very severe and longstanding. For eg, the political upheavals were frequent in the last decade, and could last several months at a time.
D
Price
Quantity Q0
P0
Q1
P1
D1
Price
Quantity Q1 Q0
S0
D0
Indian Automobile Industry Thai Automobile Industry
D1
Price
Quantity Q1 Q0
S0
D0
S1

H2 H1
L1 Shows superficial knowledge of how the rise of Indian automobile industry may have affected the Thai automobile industry.
1-3m
1-3m L2 Well- explained but one-sided argument, explaining how the rise of Indian automobile industry is / is not the main factor that led to the
=OR=
Underdeveloped two-sided argument that explained how the rise of Indian automobile industry and the domestic factors (ie. political upheavals, lack of skilled labour) in Thailand might be the main factor that led to the fall in the Thai automobile industry.
4-6m
4-6m L3 A two-sided argument, with a complete explanation and
accurate application of the economic framework, on how the rise of Indian automobile industry and the domestic factors in Thailand might be the main reason that led to the fall in the Thai automobile industry.
7-8m
E Able to arrive at a justified conclusion on which factor is the main reason affecting the Thai automobile industry. 1-2m 1-2m

J2 H2 Economics (9732/01) 1
Question 2
US economic recovery and its impact on Asia
Extract 4: What Fed's tapering means
The Quantitative Easing (QE) program which began after the financial crisis in 2008 has led to a growing momentum of US economic recovery. QE kept interest rates low and this had a major impact on investments and consumption in the US. The US Central Bank (Fed) has repeatedly linked the QE program with the labour market and inflation condition. With a stable and improving labour market, there is anticipation for the Fed to initiate a tapering of the QE program in the near future. The tapering of the QE, which in general means a reduction in the monthly bond purchase program, may result in a reduction of liquidity in the market and perhaps a hike in interest rate. If that is so, corporate borrowing cost may increase with higher interest rate and this can hurt corporate earnings in the US. With higher interest rates, there is likelihood of USD to appreciate in the medium term.
Source: Adopted from “What the Fed’s tapering means for Singapore”, 6 June 2013
Extract 5: US economic recovery finally taking hold in 2014
The latest government data shows the economy has bounced back sharply in 2014, and that momentum is expected to carry into next year. There are signs that the 2013 growth slide has finally given way to what economists call a "virtuous cycle," in which improvement in one part of the economy feeds into the others, creating a self-sustaining expansion. America is recovering for a few reasons. While many governments are tightening belts, America’s is not: for the first time in five years, public spending as a proportion of GDP rose in 2014. American shoppers are flush with cheap credit. Lower oil prices also help, since America is still a net importer of the stuff. The pace of the US growth of course, depends on when the Federal Reserve will decide to begin raising interest rates all the way back to more "normal" levels, and how quickly those rates begin to rise. And while the U.S. seems to be back on its feet, the economy in the rest of the world is stumbling again. China's once red hot growth pace has slowed, and long-running efforts to revive growth in Europe and Japan continue to come up short. That–along with a stronger dollar–could hurt demand for U.S. exports. But for now, it looks like much of the U.S. economic recovery is solidly on track.
Source: CNBC, www.cnbc.com, 25 Dec 2014

J2 H2 Economics (9732/01) 2
Extract 6: When US interest rates rise: Singapore wins, Hong Kong loses
Economists at Bank of America (BofA) forecast that the Fed to hike interest rate at every other meeting in 2015 and 2016, bringing the funds rate to average 3.5% in the long run. But what would such an increase mean for Asia and its companies? “Asian exports and growth typically strengthened during the past three episodes of US Fed rate hike cycles" That’s because rate increases are associated with stronger GDP growth in the US. For at least one market, Hong Kong, the implication is clear. Its banks will have to increase interest rates as well, because the Hong Kong dollar is pegged to the US dollar. So the cost of doing business is going to go up, particularly for enterprises with large bank borrowings. For other economies, the impact is more mixed. The winners, according to the Bank of America economists, would be the “Asian exporters,” which include Korea, Malaysia, Singapore and Taiwan, and the manufacturing companies that sell into the US. But the GDP improvement in the Asian exporters may not be as strong this time around. Asia’s sensitivity to US GDP growth “appears to have fallen compared to the past,” says Bank of America. One reason is the fall in the US share of the global economy, from 33% in 2001 to about 23% last year. At the same time, China’s share has climbed to about 12%. So even if US GDP growth improves – Bank of America forecasts 3.3% expansion in 2015, a full percentage point higher than its 2.3% forecast this year – the impact on the exporters may be more muted because of China’s economic slowdown.
Table 1: BofA estimation on the impact on Asia’s Growth due 1% expansion in the US
and a 1% contraction in China.
Overall impact Impact of +1% US
growth
Impact of -1% China
growth
Singapore 1.1 1.7 -0.6
Taiwan 0.7 1.25 -0.6
Malaysia 0.3 0.75 -0.5
Korea 0.2 0.45 -0.3
Hong Kong 0.2 1.25 -1.1
Thailand 0.1 0.60 -0.5
Indonesia -0.1 0.25 -0.3
India -0.2 0.05 -0.2
Source: BofA Merill Lynch Global Research estimates

J2 H2 Economics (9732/01) 3
The net impact of the divergent US-China growth may be beneficial for Singapore, Taiwan and Malaysia because they are electronics exporters, but negative for commodity exporters Indonesia (coal, palm oil) Thailand (rubber, food), and to some extent Malaysia (palm oil). “The positive impact from firmer US growth (which benefits manufacturing exporters) [could be] partly negated by weaker China growth (which hurts commodity exporters),” reckons Bank of America. The main mode of transmission would be import demand for goods in the US and for commodities in China. “How Asia fares will largely depend on how strong the US economic recovery will be in the coming years, as the Fed normalize interest rates,” Bank of America sums up.
Source: www.cfoinnovation.com, 13 Oct 2014
Table 2: Trade of Hong Kong and Singapore
Hong Kong Exports To Singapore Exports To
China 47% China 14%
ASEAN 5.8% Malaysia 12%
Malaysia 3.3% Indonesia 12%
United States 3.2% Hong Kong 7.2%
India 3.1% Australia 6%
Hong Kong Imports From Singapore Imports From
China 50% China 12%
Japan 7.2% Malaysia 10%
United States 5.7% South Korea 8.4%
South Korea 5.7% United States 7.3%
Singapore 3.7% Japan 6.1%
Source: www.aseanbriefing.com, 2015
Table 3: Summary of the US economy
2011 2012 2013 2014
GDP growth (%) 1.6 2.3 2.2 2.4
Unemployment 8.3% 8% 6.6% 5.7%
Inflation 2.93% 1.59% 1.58% -0.09%
US Government Budget (%GDP) -10.7 -9.3 -6.4 -5.8
US Government Budget balance (US$bn) - 1299 - 1100 - 680 - 492
Source: Various

J2 H2 Economics (9732/01) 4
Questions (a) (i) Describe the trend in the US government budget balance between 2011 and
2014. [2]
(ii) Explain how the trend in the US government budget balance is expected to affect the US inflation rate.
[2]
(b) With the use of a diagram, explain how the “Fed's tapering” may cause an appreciation of the US dollar.
[4]
(c) Extract 5 explains that the 2013 growth slide has given way to what economists call a "virtuous cycle". Using the concept of the circular flow of income, explain how such a change will affect the equilibrium level of national income in 2014.
[4]
(d) With reference to the data, discuss whether economic growth in US is expected to improve from 2014 and beyond.
[8]
(e) Assess the likely impact of an increase in interest rates in the US and divergent US-China growth on the balance of payments of Singapore and Hong Kong.
[10]
[Total: 30]

J2 H2 Economics (9732/01) 5
Answer Scheme
a i. Describe the trend in the government budget balance in the US between 2011 and 2014.
[2]
There was a deficit in the US government budget from 2012 to 2014 1m
The deficit showed a falling trend. 1m
ii Explain how the trend in the US’s government budget balance is expected to affect the US inflation rate.
[2]
Since the government budget is made up of government expenditure and tax revenue, a falling deficit would imply a contractionary measure
1m
Hence with falling budget deficit, AD is expected to fall and hence inflation rates are expected to fall.
1m
b With the use of a diagram, explain how “Fed's tapering” may cause an appreciation of the US dollar. [4]
[4]
Fed’s tapering refers to reduction in the monthly bond purchase program, may result in a reduction of liquidity in the market and perhaps a hike in interest rate.
1m
With higher interest rates, there is likelihood of USD to appreciate in the medium term due to increase in “hot money” inflows or decrease in “hot money” outflows
1m
Increase in demand for US dollar or decrease in supply of US dollar 1m
Diagram 1m
c Extract 5 explains that the 2013 growth slide has given way to what economists call a "virtuous cycle". Using the concept of the circular flow of income, explain how such a change, will affect the equilibrium level of national income in 2014.
[4]
A "virtuous cycle," comes about when “improvement in one part of the economy feeds into the others”.
The circular flow of income explains the flow of income between firms, households, the government and the foreign sector.
1m
For example, an increase in government expenditure on infrastructure, will lead to firms undertaking the production of the infrastructure. In order to produce the goods, firms require the resources such as land and labour from the households. The provides these resources in return for factor payments such as rents and wages. The rising factor incomes, induces households to consume goods from various industries such as food and beverages, airline etc., save as well as purchase imports and pay income tax. The rising expenditure in these industries leads to firms in these industries to produce more goods. Once again the firms will require more resources from households and this leads to more factor income to households. With rising factor incomes, households consume more goods and from a wider range of industries. The process continues hence “one part of the economy feeds into the others”.
3m

J2 H2 Economics (9732/01) 6
d With reference to the data, discuss whether economic growth in US is expected to improve from 2014 and beyond.
[8]
Thesis: EG is expected to increase in US i. Explain how AD will increase in the US Ext 5 para 2:American shoppers are flush with cheap credit
Loans with low interest rate COB is lower C will increase Extract 5 para 2: Public spending as a proportion of GDP rose in
2014 Increase in G on G & S Increase in G & C AD will increase RNY increase Actual
growth
ii. Explain how SRAS will increase in the US Ext 5 para 2: lower imported oil prices COP fall SARS will
increase RNY increase Actual growth
Anti-thesis: EG may fall or increase at a slower rate. i. Explain how Increase in interest rates will have contractionary
effects on the US economy. Ext 5 para 3: Pace of the US growth depends on when the
Federal Reserve will decide to begin raising interest rates Increase in i/r COB increase, Reward for Savings increase I
& C falls AD falls RNY falls Fall in Actual Growth
Increase in i/r Appreciation of the US dollar Hurt US export competitiveness X falls AD falls RNY falls Fall in Actual Growth
ii. Explain how external events can affect US economic growth Ext 5 para 4 :China's once red hot growth pace has slowed,-
running efforts to revive growth in Europe and Japan continue to come up short
China’s economic slowdown and slow economic recovery in the EU & Japan will mean that US’s trade & investment in these countries will be negatively affected.
E.g. Slowdown in income growth of the Chinese households DD less of foreign goods from the US US’s X will fall AD will fall RNY falls Fall in Actual Growth
E.g. US firms which are doing business in China could also be hit Earn less sales & profits Fall in factor income from abroad Fall in GNP
Judgment Take a stand whether US’s economy is expected to improve. Provide justification for the stand. Use data to support the stand.
Level Descriptors

J2 H2 Economics (9732/01) 7
L1 Mere listing of points with lack of evidence 1-3m L2 Well- explained but one-sided argument (e.g. US
economic growth will increase) or balanced argument but under developed explanation - Max 4m Well developed and balanced explanation(US economic growth may either increase or slow down ) with reference to extracts and context of the US economy,
4-6m
E1 Able to make reasoned conclusion 1-2 m
e Assess the likely impact of an increase in interest rates in the US and divergent US-China growth on the balance of payments of Singapore and Hong Kong.
[10]
i. Explain how increase in interest rates in US will affect Singapore and Hong Kong in terms of BOP ( current & capital account) Singapore
Ext 6 para 2:“Asian exporters which include Singapore will be the winners”
Increase in interest rates Appreciation of US dollar Singapore exports are relatively cheaper, Imports from US are relatively more expensive (X-M) should increase Improve current account
Singapore follow world interest rates, including US’s interest rates Increase in interest rates Hot Money inflow Improve capital account
Hong Kong
Ext 6 para 2: “Hong Kong dollar is pegged to the US dollar” Appreciation of the HKD Hong Kong exports are relatively more expensive, Imports are relatively cheaper (X-M) should fall Worsen current account
Extract 6 para 2: Banks in Hong Kong will have to “increase interest rates” Hot Money inflow Improve capital account
ii. Explain how the divergent US-China growth will affect Hong Kong and Singapore in terms of BOP (current & capital account) Singapore
Table 1 shows that divergent US-China growth will lead to overall 1.1% increase in Singapore’s economic growth rate Such data suggests that impacts of stronger growth in US (↑in Y & PP in the US→↑in DD for Sg’s X) will outweighs slowdown of China’s economy(↓ in Y & PP in the US→↓ in DD for Sg’s X) → Singapore will continue to enjoy overall strong export growth, thus leading to 1.1% increase in economic growth → Singapore’s current account is expected to improve
Hong Kong
Table 1 shows that divergent US-China growth will lead to

J2 H2 Economics (9732/01) 8
overall 0.2% increase in Hong Kong’s economic growth rate Such data suggests that Hong Kong may still experience growth in exports, thus leading to increase in 0.2% economic growth→ Hong Kong’s current account is expected to improve
iii. Compare the extent of impact of 2 events on Singapore and Hong Kong ‘s BOP(current & capital account)
Hong Kong is likely to experience a more negative impact than Singapore in terms of BOP(current account)
This is due to China being Hong Kong’s biggest trading partner in terms of export destination (Table 2: Hong Kong export 47% to China out of its total trade), compared with Singapore, who only export 12 % of its total trade to China.
Level Descriptors L1 Superficial answers that explain some effects on
Singapore and Hong kong in terms of BOP 1-3m
L2 Answers that explain clearly both the events and the impact on Singapore and Hong kong but in terms of only either current account or capital account. Or Answers that explain clearly only 1 event /1 country but explained both current and capital account.
4-6m
L3 Answers that explain clearly both the events and the impact on Singapore and Hong kong and in terms of both current account and capital account.
7-8m
E Judgment based on analysis; good effort at substantiation, e.g which country benefits/loses more
1-2 m

J2 H2 Economics (9732/02) 1
PRELIMINARY EXAM 2015
JC2 Economics
H2 (9732/02) NYJC
Paper 2 - Essay Monday 21 September 2015 08:00 – 10:15 TIME : 2 hours 15 mins INSTRUCTIONS TO CANDIDATES Write your name, class and name of economics tutor in the space provided on the writing paper. Do not use staples, paper clips, glue or correction fluid/tape. Answer three questions in total, of which one must be from Section A, one from Section B and one from either Section A or Section B. The number of marks is given in the brackets at the end of each question or part question. Write your answers on the writing papers provided. At the end of the examination, fasten all your work securely together.
There are __2_ printed pages including this cover page

J2 H2 Economics (9732/02) 2
Answer three questions in total.
Section A
One or two of your three chosen questions must be from this section.
1. With rising incomes, consumers are demanding for more premium leather goods. However, leather shoe suppliers are facing tough times as price of leather increased.
Using economic analysis, discuss the likely effects of the above changes on leather shoe
market and its related markets. [25]
2. Jet Airways, India’s second largest domestic airline in terms of the passenger load it carries, has slashed prices of its Business Class seats by up to 60%.
Source: DNA India, July 2015 (a) Explain the possible reasons for the action taken by Jet Airways [10] (b) Discuss whether competition in the airline industry is beneficial to the consumers
and the economy [15]
3. (a) Explain the main sources of market failure in Singapore [10]
(b) Discuss the view that government intervention is always necessary and beneficial when externalities are present
[15]
Section B One or two of your three chosen questions must be from this section. 4. (a) Pump priming is an action taken by the government to stimulate an economy,
usually during a recessionary period. Explain why such a measure is more effective when a greater portion of the extra income earned by households is consumed than withdrawn.
[10]
(b) Assess the view that a large increase in national income is always desirable. [15] 5. Macroeconomic policy decision makers set targets for key policy objectives in relation to
employment, inflation and economic growth. (a) Explain why low rate of unemployment, low rate of inflation and sustained economic
growth are key policy objectives. [10]
(b) Discuss whether macroeconomic policy decision makers should rely solely on
supply-side policies to achieve these key policy objectives. [15]
6 Explain how globalisation has changed Singapore’s pattern of trade and discuss whether
Singapore is among the economies that have most to gain from globalisation. [25]

1
Suggested Answer EQ1
With rising incomes, consumers are demanding for more premium leather goods. However, leather shoe suppliers are facing tough times as price of leather increased.
Using economic analysis, discuss the likely effects of the above changes on leather shoe market and its related markets. [25]
Introduction Changes in demand and supply factors Relevant elasticity concepts to be used (YED and XED) Effect on price and quantity Effect on leather shoe market, substitute market, complement market
Note: Only 3 different markets need to be discussed in the body paragraphs.
Body
Premium leather shoe market (Normal good)
Rising income demand for premium leather shoe increases Price of leather increased (leather is used to make premium leather shoes) cost of
producing premium leather shoe increases supply of premium leather shoe falls PED>1: Degree of necessity is low for shoes made out of premium leather since
consumers can seek for shoes (availability of substitutes) made of other types ofmaterials such as canvas and rubber
YED>1: Shoes made out of premium leather is deemed as a luxury good where demandincreases more than proportionately when income increases as a way of showingimprovement in one’s lifestyle, therefore purchasing more quality shoe such as premiumleather shoe with an income rise
Combined effect: Explain the likely effect Demand for premium leather shoes could
rise more than supply falling as shoes made out of premium leather are deemed toconsumers to be shoes of high quality and that shoes made from premium leather areable to adapt to the wearer’s feet shape, enhancing one’s comfort level. With a rise inincome, especially for the high income consumers, their demand for a luxury goods suchas premium leather shoes will rise more than the fall in supply.
o Price, quantity and revenue of premium leather shoe increases (Figure 1)
2
Non-premium leather shoe market (Inferior good)
Rising income demand for non-premium leather shoe (inferior good) falls Price of leather increased (leather is used to make non-premium leather shoes) cost
of producing non-premium leather shoe increases supply of non-premium leather shoe falls
Combined effect: Explain the likely effect Demand for non-premium leather shoes
could fall more than supply falling especially for high income consumers who have a strong preference for shoes made out of only premium quality leather. Therefore, any leather shoes that are made of non-premium leather will be seen as less better off and they will demand much less of them even with a rise in their income.
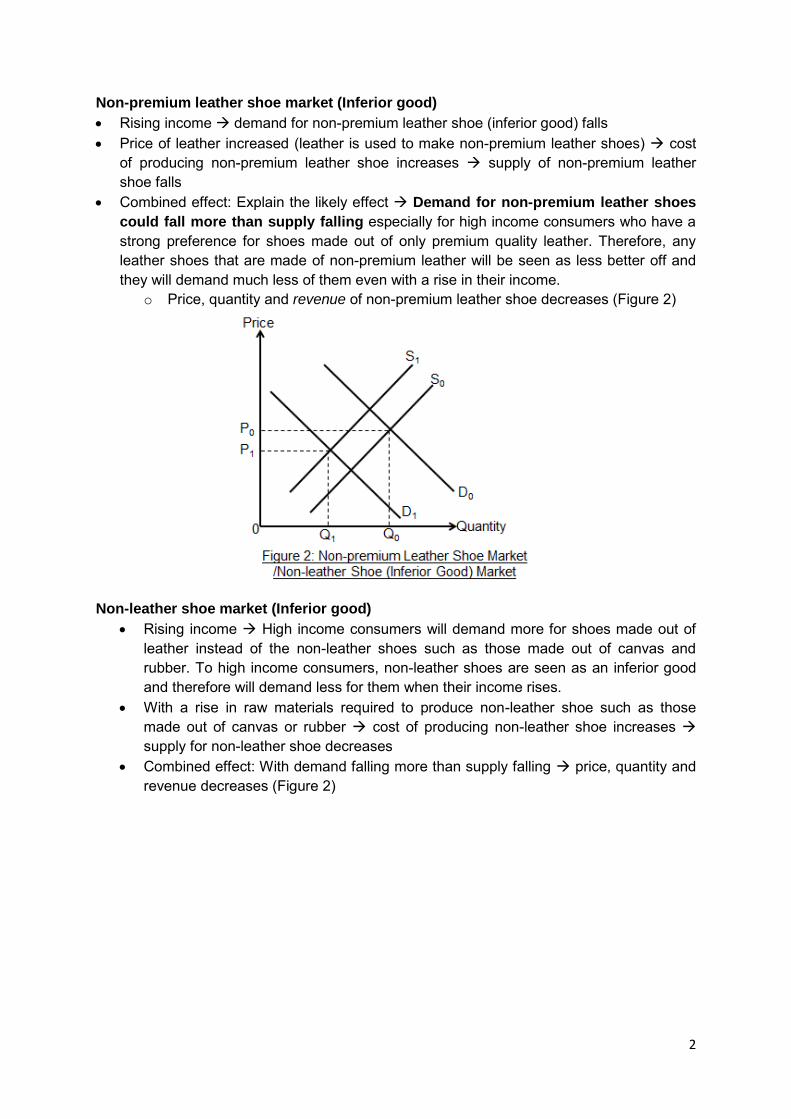
o Price, quantity and revenue of non-premium leather shoe decreases (Figure 2)
Non-leather shoe market (Inferior good)
Rising income High income consumers will demand more for shoes made out of leather instead of the non-leather shoes such as those made out of canvas and rubber. To high income consumers, non-leather shoes are seen as an inferior good and therefore will demand less for them when their income rises.
With a rise in raw materials required to produce non-leather shoe such as those made out of canvas or rubber cost of producing non-leather shoe increases supply for non-leather shoe decreases
Combined effect: With demand falling more than supply falling price, quantity and revenue decreases (Figure 2)

3
Non-leather shoe market (Substitute)
XED<1 since shoes made of leather and non-leather are substitutes but they are not closely related as non-leather shoe (made from canvas or rubber), especially to a high income consumer, may not provide the same level of comfort as a shoe made from leather
With the rise in price of premium leather shoes due to demand rising and supply falling demand for non-leather shoe rises less than proportionately
With a rise in raw materials required to produce non-leather shoe such as those made out of canvas or rubber cost of producing non-leather shoe increases supply for non-leather shoe decreases
Combined effect: With demand rising less than supply price rises while quantity decreases. Since price rises more than proportionately to the fall in quantity, revenue of non-leather shoe increases (Figure 3)
Socks market (Complement)
XED>1 since shoes made of premium leather and socks are complements and they are closely related since most leather shoes require the use of socks with the rise in price of premium leather shoes demand for socks fall more than proportionately
With a rise in raw materials required to produce socks cost of producing socks increases supply for socks decreases
Combined effect: With demand falling more than supply price, quantity and revenue falls (Figure 4)

4
Conclusion Effect on the respective markets depends on the relative shifts of demand and supply
and this can be due to the types of consumer groups (high vs low income groups). The effect on the respective markets is also due to ceteris paribus condition. Other
demand and supply factors changing will result in different effects on the respective markets.
Elasticity concepts allow producers to make decisions on how to increase their sales.
Mark Scheme
Level Descriptors
Level 3
15 – 21
Well-developed explanation for demand and supply factors, relevant
elasticity concepts (YED and XED) and how price and quantity may be affected in at least 3 different markets with relevant contextualisation.
Well-developed analysis of other possible scenarios where the price and quantity may increase/decrease.
Level 2
10 – 14
Underdeveloped explanation for demand and supply factors, elasticity concepts and how price and quantity may be affected.
Some attempts at contextualisation. Some recognition that the extent of the shifts in demand and supply curves
has an effect on price and quantity (combined shifts). Markets discussed must involve both leather and non-leather shoe
markets. Level 1
1 - 9
Answer shows some knowledge of demand and supply factors and how price and quantity may be affected in the markets but markets discussed are all single shifts.
Lack of economic analysis. Minimal or no contextualisation.
Evaluation
E2 (3-4) For well-reasoned judgment on the likely effects on price and quantity in the relevant markets.
E1 (1-2) For a mainly unexplained judgment on the likely effects on price and quantity in the relevant markets.

2.Jet Airways, India’s second largest domestic airline in terms of the passenger load it carries, has slashed prices of its Business Class seats by up to 60%.
www.dnaindia.com 20th July 2015
a )Explain the possible reasons for the action taken by the Jet Airways. [10]
b) Discuss whether competition in the airline industry is always beneficial to
consumers and the economy. [15]
Answer Key
a) Introduction: Airlines are likely to operate within an oligopolistic market. Explain in brief the features of oligopoly market structure. Assuming their aim is to maximise profits explain possible reasons for
the action taken by the Jet Airways (pick any 3 to explain, with examples)
Predatory pricing: In the preamble it is mentioned that Jet Airways is India’s second largest domestic airline and have very large market share .Thus it can act like a dominant firm cutting fares aggressively to protect market share from new or existing competitors. Predatory pricing is the deliberate setting of prices at levels even lower than AC to deter potential entrants from entering the market. At such low prices, the potential entrant is unable to compete and will then be driven out of the market. Although by doing so the firm doing predatory pricing (in this case Jet Airways ) may also suffer from heavy losses over that period of time ,but is able to finance and continue its production by using the funds accumulated from the high supernormal profits earned before.
Increase revenue: Business class tickets take up a large proportion of income and hence the demand for them may be price elastic. (Can explain PED>1 by assuming large number of substitutes or business class tickets taking up a larger proportion of income) .Thus if Jet Airways reduces price consumers will increase their quantity demanded more than proportionately Total revenue increases. Assuming no change in cost this would lead to higher profits. Draw diag to show TR increase.
Jet Airways may have enjoyed large EOS and/or other cost savings which they are passing on to the passengers in terms of lower fares. For e.g the fuel prices are falling and their operating costs may have fallen as well .Thus the firm is able to charge a lower price. Draw diag to show lower fares.
Jet airways may have taken the decision to cut price because of falling demand .During lean season or if there is recession in the country there may be falling demand for luxury goods. By offering discounts they want to fill up its seats rather than flying nearly empty seats.

The decision may be a retaliatory move to another rival. Since Jet Airways belongs to oligopoly market structure there is very high interdependence. So if a rival firm has cut its price Jet Airways also reacted by lower its price to avoid losing its customers to its rival firms.
The firm may decide to lower price as they may have different objective other than profit maximising
Any other reason that explains with economic justification the action taken by the Jet
Airways will be accepted.
Conclusion : The price reduction by Jet Airways most likely is a short term strategy and is unlikely to be unsustainable in the long run. However, it may benefit the passengers as they can enjoy air travel at a lower price. But the long term impact may not be overall beneficial as the Jet Airways’ cutting prices may trigger a price war which may have overall negative impact on the industry as well as the economy.
Level Descriptor Marks L1 Listing of reasons with minimum explanation. 1-4 L2 At least 2 well explained reasons using economic theory/
framework, with some reference to Jet Airways’ action. 5-6
L3 At least 3 well explained reasons using economic analysis in the context of the action taken by JET Airways. Must have at least one cost reason and one revenue reason.
7-10
b) Discuss whether competition in the airline industry is always beneficial to
consumers and the economy.
Students are expected to discuss the benefits and costs of greater competition to consumers and economy.
Explain what is understood by more competition: This can be either because of more firms entering the airline industry and/or because of more intense competition amongst the existing firms.
Consumers key interest is to obtain: the lowest price possible, obtain goods that are improved over time, obtain more variety of goods and retain maximum consumer surplus.
For economy the key interest is to see whether the macro objectives are achieved or not.
Consumers: Consumers may benefit when companies have to compete vigorously for their business. Such competition leads to lower prices, better service, more innovative offerings, and a wider range of choices for consumers. Lower prices due

to competition and prevention of price fixing also reduce redistribution of wealth from consumers to firms with high monopoly power
Greater consumer welfare
o Consumers may benefit from possible lower prices and higher output of products. o Before introducing competition: Explain that firm produces at MC=MR (profit-
maximizing output) but P>MC. o After introducing competition: still Price may be greater than MC but less so. o Explain that with competition, market will produce at a higher level of output that
is closer to the allocative efficient output. o Use diagram to show how more competition leads to less monopoly power and
hence lower price for consumers as firm’s market share is reduced and the demand for their product is more price elastic with more substitutes available.Thus people may enjoy lower airfares.
However competition may also hurt consumers as the firms find their monopoly power getting reduced.Being large, the airline firms are able to reap substantial economies of scale. If competition is introduced to break up the market power the consumers may end up being worse off as they may not enjoy lower fares as a result of cost savings being passed on to them by producers enjoying substantial EOS. Innovation and choice
o Competition stimulates innovation and more choices for consumers. With
competition, the airline firms would strive to be more efficient and cost-effective in their operations,
o Explain how more competition will force airline firms to offer better service to the air travelers and be innovative to retain supernormal profits. If these cost savings are passed on to consumers, they would hence benefit from lower fares, higher consumer surplus and more choices available to them.
However Firms will now enjoy less supernormal profits due to increased competition and hence less funds to finance R&D efforts. Thus they may compromise on upgrading their services e.g while buying new modern aircrafts. Excessive competition might also lead to wasteful expenditures on advertising
etc. and thus consumer welfare may be compromised.
Economy: Thesis Expansion of market for air travel may result in expansion of the market .This will create positive spillover effects on the rest of the economy.
Boost tourism and business travel ,Investment expenditure X increase, I increase ceteris paribus AD increase NY Increase.
Boost GDP in terms of higher output and expansion of industry leading to more employment.
Boost BOP – foreign exchange earned directly by national airlines as well as indirectly by influx of tourists.

However competition in the airline industry may also have adverse consequences for society and country as a whole.
Might bring adverse effects in the form of job losses and unemployment if more competition leads to closures of loss earning airline companies.
More competition limits the capacity of large firms to conduct R&D it may have adverse consequence on the safety and security of the airline industry in general.
Too many airlines may also lead to severe negative externality. In conclusion, whether competition in the airline industry is always beneficial or not depends on the importance of overall costs and benefits to the consumer and economy, whether the good aspects of competition outweigh the bad aspects. Therefore, although more competition may lead to lowering of airfare and more choices available to consumers yet too much competition reduce the profits of airlines industry which may then have severe detrimental effects both on consumer and economy as it will be difficult for firms to have research and development .Too much competition may result in firms using underhand methods to cut costs + poor quality products which may be harmful to consumers.Thus some competition can be introduced to reduce the ill effects of monopoly powers of existing large firms, but Government must understand that too much of competition may not be beneficial overall.
Mark Scheme:
L3 Excellent well-balanced 2 sided discussion of the positive and negative effects of competition on both consumers and economy applying to the context of airline industry.
9 – 11
L2 One-sided detailed explanation of impact of competition on consumers and economy in the context of airline industry
OR
Two sided impact of competition on either consumer or Economy in the context of airline industry
OR
Two sided but superficial discussion of the impact on consumers and economy
6 7-8
L1 Weak and incomplete understanding of the question and context
Mere listing of points without explanation. A one-sided answer that touches only on the good aspects
of competition on consumers or on economy gets maximum 5 marks
1 – 5
E2 For a rational conclusion and an evaluative assessment that is based on economic analysis (that is, a well-explained evaluation)
3 – 4
E1 Judgment without elaboration 1 – 2

1
3. (a) Explain the main sources of market failure in Singapore [10]
(b) Discuss the view that government intervention is always necessary and beneficial when externalities are present.
[15]
Interpretation of Question – Part (a)
(a) Explain the main sources of market failure in Singapore [10] What is the command
cue? (What are the skills
required for the question?)
“Explain” – illustrate the
relevant economic concepts using relevant examples & analytical
framework
What are the content cues? (What are the concepts required to answer the
question?)
“market failure” – the working of the market resulting in resources being allocated in ways
leading to inefficient outcomes
“main sources” – the significant or prevalent (>1; preferably 3) sources to the market failure
What are the contextual cues?
(What is the context for the question?)
“Singapore” –
markets in a small, resource-scarce, open economy
independent city-state
Schematic Answer Plan: 1. Define “market failure” – workings of the free market results in scarce resources allocated in
ways resulting in inefficient outcomes. 2. State the possible “sources of market failure”
(i) Non-provision of Public goods (ii) Existence of externalities – Negative externality/ Positive externality (iii) Market Imperfections (Market dominance, Imperfect information, Immobility of factors
of production) (iv) Inequity (unfair distribution of wealth & goods) (v) Under-consumption of Merit – comprising the positive externality and information
failure sources (vi) Over-consumption of Demerit goods - comprising the negative externality and
information failure sources 3. Explain 3 “main sources” [must include 2(i) and any other 2 sources listed above] of
market failure in Singapore (i) Describe how the 3 sources cause market to fail (ii) Provide reasons why in each case the market failure source is viewed as “main” in
Singapore – eg. prevalence of the particular source in most markets across industries or the deadweight losses are fairly significant and a cause for social concern
Part (a)_Mark Scheme:
L1 Mere listing of the characteristics of 3 sources with little or very brief explanation of how they cause markets to fail.
1 - 4
L2 Able to explain in detail the main characteristics of 3 sources (but excluded the non-provision of public goods) supported by well-used examples, with thorough explanation of the reasons on how they cause markets to fail; OR Able to explain in detail the main characteristics of 3 sources (but excluded the non-provision of public goods) supported by listed examples in the Singapore context, with some valid reasons on how they cause markets to fail.
5 - 6
L3 (low)
Able to explain in detail the main characteristics of 3 sources supported by well-used examples, with thorough explanation of the reasons on how they cause markets to fail
7 - 8
L3 (high)
Able to explain in detail the main characteristics of 3 sources supported by well-used examples, with thorough explanation of the reasons on how they cause markets to fail & brief statements justifying the selection as the main sources.
9 - 10

2
Interpretation of Question – Part (b)
(b) Discuss the view that government intervention is always necessary and beneficial when externalities are present.
[15]
What is the command cue? (What are the skills required
for the question?)
“Discuss” – a
2-sided exploration of the issue (“the
view”)
What are the content cues? (What are the concepts required to answer the question?)
“government intervention” – involvement of the regulating authority in the workings of the free market that appears to
have achieved inefficient outcomes; regulated market
“always” – a definitive outcome; “at all times”
“necessary” – “needed to be done”
“beneficial” – “good”; “favorable”; “advantageous”
“externalities are present” – the under-/over-consumption or under-/over production of a good/service emitting third party
benefits/costs
What are the contextual cues?
(What is the context for the
question?)
“externalities are present” – only relevant market
failure source for discussion; can
be applied to any economic activity or in any country
Schematic Answer Plan:
1. Introduction: Briefly reiterate the key point why externalities cause markets to fail i. Negative externalities: under-priced; over-consumption or over-production ii. Positive externalities: over-priced; under-consumption or under-production relative to the social optimum output level. * Students can explain any relevant source of externality.
2. Thesis: Government intervention is necessary and beneficial
Govt intervention in the presence of negative externalities (& also as in the case of demerit goods) resulting in significantly large deadweight loss is to be regained is needed to be done and is favorable because:
(i) It raises the market price and lowers the equilibrium quantity in the market (ii) It leads to an efficient resource allocation resulting in welfare improvements
for both consumers and producers. Example: To overcome market failure caused by car usage (negative externality),
SG govt adopts the policies as discussed below: 1. Electronic Road Pricing (ERP) 2. Certificates of Entitlement (COEs) 3. Providing an efficient/quality public transport system
* Students can explain any relevant policy to address the negative externality for
the chosen context. Explain Electronic Road Pricing (ERP) [What is it & How it works]
It imposes a price for using a designated road that is over-used (causing congestion)
Works like an indirect tax per unit to equate MEC caused by the car journey (tax per unit = MEC).
Road users are charged according to the external cost they impose on the rest of the society, such as the congestion, noise and pollution that their journey creates. This forces them to internalise their external costs. When motorists are made to bear the full cost of their driving, they will then cut down their consumption to the socially optimum level.
Illustrate with diagram how a Pigouvian tax is implemented to force consumers to internalize the external costs
(i) Using the Demand – Supply Analysis framework
An indirect tax imposed ↑ cost of car/road usage effectively reflected as a leftward/upward shift of the supply curve of roads

3
At original price, P0, a shortage of road space is created. Drivers who must use the particular road will be willing to pay a higher price for the good while those unwilling to pay for the usage will reduce their quantity demand for it (& look for alternative routes) in the number of cars using the now priced road.
(ii) Using the Cost-Benefit Analysis framework
A Pigouvian tax ↑ cost of car/road usage that generates negative externalities due to over-consumption.
The govt can impose a tax = ab per unit of mile driven to internalize the external cost. The size of the tax (ab) should be ideally equivalent to the extent of marginal external cost (MEC) at the socially optimal output so as to completely eliminate the welfare loss.
The tax forces the consumers to take into account (internalise) the external costs raising the MPC to be at the same level as the MSC. Faced with the new supply curve, the motorists will reduce consumption to the socially efficient level. The welfare loss to society would be eliminated.
[How well it works] Benefits of electronic road pricing (ERP) i. ERP aims to reduce congestion by raising the price of car usage. It is thus
more targeted as it is levied only on the motorists who use the busy roads (e.g. the highways and the CBD area) during the peak hours
ii. An added advantage of the ERP system is its flexibility. LTA regularly reviews the traffic conditions on the expressways and roads. Because of the way it is administered, the charges can be adjusted based on traffic congestion levels at the pricing points so that the ERP works truly like the Pigouvian tax, where the charges reflect the marginal external cost of driving at different time periods, along different stretches of roads
iii. Hence, govt intervention in the form of ERP brings about more benefits as it allows the deadweight loss area to be regained as welfare improvements for both consumers and producers.
3. Anti-thesis:
i. Government intervention is necessary but not beneficial (a) Government intervention may fail resulting in greater inefficiencies
Even with the best intent, govt intervention in the market, though needed, may not be favourable if government intervention worsens the problem of resource allocation instead of improving it (ie. government failure). (i) A significantly higher price than the ideal/true price or over-taxing leads to
an over-priced and under-utilised road which may lead to excessive speeding and increase the likelihood of accidents and loss of life.
(ii) A marginal increase or new price still lower than the ideal/true price or under-taxing leads to an under-priced road with minimal effects on the volume of road usage and the extent of congestion.
The success of the government, like any of its endeavours, however, depends on its ability to gauge when, how and to what extent to intervene. Government actions are also prone to failure or have their limitations. Government failure could happen in the market for motor vehicle usage because of information imperfection: o A lack of information about the true value of a negative externality: It is often
very difficult to price the value of a negative externality such as pollution in monetary terms. It is difficult to accurately measure the costs imposed and to trace the source of the pollution itself. Hence the government in its attempt to correct the over-consumption in context of motor vehicle usage to an efficient level may cause greater deadweight losses.
o The overestimation of the MEC leads to an excessive tax which causes MPC to rise to MPC + tax, resulting in the consumption of quantity units of motor vehicles < socially optimal level of output QS. Id the associated deadweight

4
loss leads to worsening of allocative inefficiency, the govt failure could be said to have occurred.
govt failure results in the deepening of market inefficiencies through its intervention.
(b) Costs of govt intervention to correct MF outweighs the deadweight loss to be
regained Very often, the gain from govt intervention has to be weighed against the costs
of govt intervention. Govt intervention in the market may not be justified if the gain from govt
intervention is weighed out against the costs of government intervention. Such costs may include administration or operational costs incurred by the government.
Furthermore, govt intervention in the market may not be justified if it leads to consequences that impact the economy. For example, anti-pollution measures to reduce negative externalities may increase the unit COP which deter FDIs affecting potential growth. Hence, in this case, govt intervention in the market will not be justified.
ii. Government intervention is unnecessary & not beneficial
When the extent of deadweight loss is not significantly large, though it may result in relative inefficiencies with respect to the social optimum government intervention may not be necessary.
When the property rights assigned in the market are already established & well-defined, and it allows for the parties involved to work towards a socially optimal outcome at a low negotiation costs. Hence, government involvement may just be to ensure the compliance of legislative statutes.
4. Conclusion Though presence of externalities cause markets to fail resulting in over-consumption (-production) or under-consumption (-production), government intervention may not always be necessary and/or concurrently beneficial as the characteristics of each market is unique and the government’s intervention capacity and efficiency in the respective markets may vary. Hence, the relevant regulatory agencies of the government need to exercise wisdom with regards to the need and favorable nature of any decision to intervene when markets fail.
Part (b)_Mark Scheme:
L 1 Able to identify the basis for government intervention when externalities are present. Mere listing of the measures that can use to correct the over-consumption (-production) or under-consumption (-production) problem when externalities are present.
1 - 5
L 2 One-sided detailed explanation of the issue of the necessity and benefits of government intervention when externalities are present with use of examples in the Singapore context; OR Balanced but superficial explanation of the issue of the necessity and benefits of government intervention when externalities are present with limited use of examples in the Singapore context.
6 - 8
L3 Balanced and detailed explanation of the issue of the necessity and benefits of government intervention when externalities are present with adequate use of examples in the Singapore context.
9 -11
E1 Judgment on the issue without elaboration on the reasons for stand. 1 - 2 E2 Judgment on the issue with adequate elaboration of supporting reasons for stand. 3 - 4

NYJC 2015 H2 Paper 2 Q4
1
Question 4: (a) Pump priming is an action taken by a government to stimulate an economy, usually during a recessionary period. Explain why such a measure is more effective when a greater portion of the extra income earned by households is consumed than withdrawn. [10] (b) Assess the view that a large increase in national income is always desirable. [15]
(a) Pump priming is an action taken by a government to stimulate an economy, usually during a recessionary period. Explain why such a measure is more effective when a greater portion of the extra income earned by households is consumed than withdrawn. [10]
What is the command word?
(what are the skills required for
this question?)
‘Explain why’ = Use economic
theory to provide reasons in detail, using
examples
What is the content word? (what are the relevant concepts required to answer this question?)
‘Pump priming’ = Action taken by govt to stimulate economy
during recessionary period = Expansionary fiscal/monetary policy to raise AD via rises in C, I and/or G
‘measure is more effective’ = the successful impact of increase in AD on NY to stimulate an economy
‘a greater portion of the extra income earned by households is consumed
than withdrawn’ = larger mpc value vs smaller mpw value determines the size of the multiplier effect
What is the context word?
(where or when to apply
for this question?)
Examples of
at least 2 different
countries, with different mpc
values
Schematic Plan Pump priming (expansionary fiscal and monetary policies) stimulate higher domestic C, I and G higher AD via multiplier real NY rises more than proportionate (assume economy <Yf) The extent of the increase in NY depends on the size of the multiplier effect k = 1/(1-mpc) = 1/mpw = 1/(mps+mpt+mpm) factors that affect size of k The larger the mpc, the larger the k, and hence the more effective expansionary policy has on raising NY and stimulating an economy during a recessionary period, through a rise in AD.
Introduction
Pump priming refers to use of expansionary fiscal and monetary policies to increase AD. The level of spending by households (Consumption), firms (Investment) and government (Govt spending) are components of aggregate demand (AD) in a country. Expansionary fiscal and monetary policies aim to increase domestic C and I via expansionary FP (cut in direct tax and rise in government spending) or via expansionary MP (via cut in interest rates) to increase aggregate demand. The real national income (NY) in the country (assuming the economy is below full employment, that is economy has unemployed resources) will increase more than proportionately, via the multiplier process, to the increase in AD. The extent of the impact of increases in C, I and G on NY depends on the multiplier effect, which is determined by the size of the multiplier (k). The size of k is determined by the marginal propensity to consume i.e. k = 1/(1-mpc) = 1/mpw = 1/(mps+mpt+mpm) for a 4-sector economy. The higher the mpc, or the lower the mpw, the greater the size of k, and hence the greater will be the extent of increase in NY given any rise in C, I or G.

NYJC 2015 H2 Paper 2 Q4
2
Body (PEEL)
Point 1
State the Point (P)
Expansionary fiscal and monetary policies aim to increase C, I and G and thus increase AD.
Explain the point with clear causal links (E) Elaborate the point with examples or diagram (E)
Expansionary fiscal policy involves a rise in G and a cut in taxation. When the government cuts personal income tax rate, households enjoy increases in disposable income and thus higher purchasing power. Households can then increase consumption. A cut in corporate tax rate will increase after-tax profits and thus expected rate of returns for firms. Firms undertake more investments. Expansionary monetary policy refers to cuts in interest rates. Interest rate is also the cost of borrowing. Thus, a cut in interest rate would make it less expensive for consumers to borrow money and buy on credit for big-ticket items. Also, lower interest rate would encourage consumers to consume (and save less) because the opportunity cost of spending has decreased, that is, less interest forgone on savings. This would cause an increase in consumption. Similarly, business would enjoy lower interest charges on loans for investment. More investment projects are now profitable for the same expected rates of returns. This leads to a rise in investment.
Link back to Qn (L)
Hence, expansionary fiscal and monetary policies will boost C, I and G. Increases in C, I and G cause AD to increase. For some countries like the US and UK, consumption is the largest component of aggregate demand. A rise in C will have increase AD and hence NY significantly. However, for countries like Singapore where consumption is a relatively small component of AD, a rise in C will increase AD and NY less significantly.
Point 2
State the Point (P)
When AD rises, NY will rise by a larger extent due to the knock-on effect on income-induced consumption. The extent of the rise in NY depends on the size of the multiplier (k). What determines the size of the multiplier effect on NY is the marginal propensity to consume (mpc).
Explain the point with clear causal links (E) Elaborate the point with examples or diagram (E)
The marginal propensity to consume (mpc) indicates the portion of additional or extra income that is used for consumption expenditures. The size of the multiplier, k, is directly related to mpc, that is K = 1/(1- mpc) = 1/mpw = 1/(mps + mpt + mpm). Assume 4-sector economy here. Assuming mpc = 0.9, K = 1/(1-0.9) = 1/0.1 = 10. When AE rises by $100m, NY will rise by 10 times to $1000m. For example, if autonomous investment expenditure rises by $100m, the national income of the economy is immediately raised by $100m via the increase in the incomes of factor input owners. These factor owners will then spend 0.9 (= mpc) of their rise in income on consumption of goods and services, i.e. $90m (mpc x ∆Y = 0.9 x $100m) is passed on to the next round of producers of goods and services, with only 0.1 (= mpw) of the rise in income being withdrawn from the circular flow (0.1 x $100m = $10m). These producers will then spend 0.9 of their rise on income on domestic goods, i.e. $81m is passed on in this third round and $9m withdrawn. The process continues, with each round of domestic spending on goods and services being the next round of income for the producers of goods and services. The process comes to an end when the change in withdrawal is $100m is equal to the initial change in injections of $100m. Final increase in income is 10 times the initial rise of $100m, that is, $1000m. The larger the mpc, the greater will be the multiplier k and thus the multiplier effect. This is because when incomes rise, households are spending more on domestic goods out of any additional increase in income (rather than withdraw it) and thus each round of the multiplier process leads to a greater increase in national income. When people receive extra (additional) income and consume more of the extra income on locally produced goods, this will create a

NYJC 2015 H2 Paper 2 Q4
3
greater increase in AD and NY in subsequent rounds. When people save, pay for taxes or spend more of their extra income on imports less money will be passed on through the circular flow as more of the extra income is withdrawn. Hence there will be a smaller increase in AD and NY. Assuming mpc = 0.6, k = 1/(1-0.6) = 1/0.4 = 2.5. When AE rises by $100m, NY will rise by 2.5 times to $250m.
Link back to Qn (L)
Thus, a higher mpc (smaller mpw) leads to a larger multiplier effect whereas the larger the mpw (smaller mpc) leads to weaker multiplier effect.
Point 3
State the Point (P)
Different countries have different values of mpc and thus different sizes of the multiplier, and hence different degrees of effect of rise in AD on NY.
Explain the point with clear causal links (E) Elaborate the point with examples or diagram (E)
Singapore has a smaller multiplier than other countries because of our mpc is relatively lower. This is because of our unique Central Provident Fund (CPF) scheme which requires workers to save a certain percentage of their monthly earned income. Singapore has one of the highest savings rate in the world (high mps). In addition, mpm is relatively higher for Singapore too because of our heavy reliance on imports due to our lack of resources. In contrast, USA has a bigger multiplier because their mpc is relatively higher, while the savings rate and import rate are rather low in that country. Assumption is that mpt is the same for both countries. Asian countries tend to have a higher marginal propensity to save compared to Western countries. This can be attributed to the value of thriftiness, a cultural factor. The propensity to save voluntarily (for retirement or payment for higher medical expenditure due to ageing population & lack of established social safety networks) may also be higher in many Asian countries. Hence, the mps and thus the mpw of many Asian countries will tend to be larger compared to other Western countries (mpc smaller).
Link back to Qn (L)
Consequently, the impact of any increases in C, I and/or G will have a smaller impact on Singapore’s national income. On the other hand, USA has a larger multiplier and thus an increase in C, I or G will have a larger impact on US’s national income.
Conclusion (SR)
Summarise main points
In conclusion, pump priming through the use of expansionary fiscal and monetary policies to stimulate an economy during a recessionary period work more effectively in countries with relatively larger mpc as a larger mpc value implies a greater multiplier effect. The rise in AD will lead to larger increases in NY via the multiplier to help the economy. In countries where the mpc is smaller, the government will need to raise C, I or G by greater amounts to achieve the same desired rise in NY to stimulate the economy.
Level Descriptors Marks
L3 Excellent explanation of how use of pump priming to stimulate aggregate demand during a recession work more effectively in countries with relatively larger mpc than in countries with a relatively smaller mpc. Extent of the increase in the national income given a similar rise in AD is well explained using examples of different mpc and hence different k values for comparison.
7-10
L2 Clear explanation of how use of pump priming to stimulate the aggregate demand work more effectively when mpc is larger than when mpc is smaller. Use of some numerical examples to show the effect on rise in national income given an increase in AD but explanation is not complete.
5-6
L1
Superficial explanation or mere stating without elaboration of how use of pump priming to stimulate the aggregate demand work more effectively when mpc is larger than when mpc is smaller. Explanation is not supported by examples
1-4

NYJC 2015 H2 Paper 2 Q4
4
(b) Assess the view that a large increase in national income is always desirable. [15]
What is the command word?
(what are the skills required for this question?)
‘Assess’ – consider both thesis and antithesis and
synthesize with a judgment
What is the content word? (what are the concepts required to answer this
question?)
‘large increase in national income’ = rapid or accelerated economic growth
‘always desirable’ = always beneficial, with positive
effects on the economy
What is the context word?
(what is the context for this question?)
Different countries,
time period
Schematic Plan Increase in national income = Economic growth = Actual and/or potential growth Large increase in national income = Accelerated economic growth Causes of large ↑Y Positive & Negative effects of large ↑Y on macro and micro goals
Thesis: A large increase in NY is desirable 1) Large ↑Y Growth also achieve other macroecon aims:
Actual growth (economy <Yf) fall in cyclical unemployment as dd for lab rises Potential growth lower inflation leading to price stability rise in export competitiveness improve BOT
Large ↑Y Growth sign of healthy economy ↑FDI further potential growth 2) Large ↑Y higher SOL and improvement in income distribution especially when govt
utilizes the higher tax revenue collected to help the lower income group, or devt of infrastructure in c’try that attracts more FDI, leading to greater potential growth
Antithesis: A large increase in NY is undesirable 1) Large ↑Y Too fast growth conflict with other macroecon aims: Rapid potential growth higher structural unemployment Rapid actual growth due to rise in AD demand-pull inflation if economy is operating near Yf Large ↑Y rise in purchasing power more imports worsens BOP deficit 2) Large ↑Y lower non-material SOL Large ↑Y rise in income disparity if only those in the industries that contributed to the high growth benefit Large ↑Y rise in negative externalities
due to rise in productive activities lower SOL
Conclusion Whether a large increase in NY is always beneficial depend on the source of the increase in NY (whether it is from rise in AD e.g. from higher C or rise in AS e.g. from higher I), availability of idle resources (whether economy is operating near Yf), the current state of the economy as there may be conflicts between different macroeconomic goals (for example, the economy could currently be facing a BOP deficit) and the extent of material gains compared to non-material costs incurred in achieving the rise in NY. It also depends on the factors that led to the large increase in NY. For example, if govt spending contributed to the increase in NY but it was funded from borrowing and greater govt debt, this leads to further negative repercussions. The desirability of a large increase in NY greatly depends in the objectives of the govt.

NYJC 2015 H2 Paper 2 Q4
5
Introduction
Increase in national income means the economy is achieving economic growth, which could be actual growth and/or potential growth. A large increase in national income is equivalent to targeting high rate or accelerated economic growth compared to normally. Actual growth can be achieved when the economy has excess capacity to accommodate any rise in AD. The rise in AD could be from a rise in C, I, G or X. Potential growth can be achieved when the quantity and quality of the resources are expanded or the level of technology is improved to increase the productive capacity of the economy and sustain actual growth without causing a rise in GPL. The rise in AD must be large to achieve the large increase in NY via the multiplier effect. The real NY will grow quickly provided the economy has excess capacity
Body (PEEL)
THESIS: A LARGE INCREASE IN NY IS DESIRABLE
Thesis 1
State the Point (P)
A large increase in NY allows the country to achieve other macroeconomic goals, namely lower unemployment rate and lower inflation rate, and probably improvement in BOT.
Explain the point with clear causal links (E) Elaborate the point with examples or diagram (E)
This is because higher actual economic growth leads to a greater utilization of resources and hence move the economy towards full employment.
There is greater production of goods and services to meet the rise in AD, leading to greater demand for labour and other resources. Hence, unemployment rate falls as demand for labour is derived from the demand for goods and services .
Moreover, greater output and potential growth in the country could have also been based on supply factors such as rise in level of technology and higher productivity. This enables the aggregate supply to rise and hence overall output and employment can rise. This rise in aggregate supply may lead to a fall in general price level, leading to a low rate of inflation, which is another important macroeconomic aim of a country.
As the goods and services can now be produced at lower prices, exports of the country become more price-competitive to the rest of the world. This can lead to a rise in export earnings, improving the BOT in the country.
Link back to Qn (L)
Thus, a large increase in NY is desirable as it can reduce both unemployment and inflation, and improve BOT.
Thesis 2
State the Point (P)
A large increase in NY brings about a higher standard of living.
Explain the point with clear causal links (E) Elaborate the point with examples or diagram (E)
First, with a larger income, as measured by Gross Domestic Product (GDP), and with a given population, higher GDP per capita will mean more goods and services are produced and available for consumption for the average person in the country. This should lead to higher standard of living. Economic growth has led to a greater quantity and range of goods and services for consumers, which contributed to a significant increase in living standard in the country. Citizens have having purchasing power now with the large increase in NY and hence they will be able to enjoy a wider range of consumer goods, improving their material standard of living.

NYJC 2015 H2 Paper 2 Q4
6
In addition, a large increase in NY enables the government to collect more tax revenues to help fund welfare payments to improve the lives of the citizens. Those in the lower income groups can be assisted in many ways to ensure a better standard of living for them, for e.g. subsidies for housing and healthcare.
Link back to Qn (L)
Thus, a large increase in NY leads to improvements in the standard of living, a significant aim for many, especially the developing economies.
ANTI-THESIS: A LARGE INCREASE IN NY IS UNDESIRABLE
Anti-Thesis 1
State the Point (P)
However, it is necessary to note that rapid economic growth and large increase in NY may bring about conflicts with other macroeconomic goals, namely rising structural unemployment in the long run.
Explain the point with clear causal links (E) Elaborate the point with examples or diagram (E) Synthesis
If potential growth is accomplished with economic restructuring in manufacturing and industrialization to ensure exports of the country remain competitive, the new jobs created will be in industries where higher skills and education is required. Thus, the less skilled and lowly-educated workers may find that there is a mismatch between their skills and the job requirement, especially those in primary industries, leading to rising structural unemployment in the country.
For example, the problem of structural unemployment is a real concern in Singapore. Professionals, Managers, Executives and Technicians (PMETs) have joined the less skilled, lowly-educated workforce in the ranks of structural unemployed. The ageing workforce in Singapore which is made up of a large group of less skilled and educated workers in their 40s and 50s has further compounded this problem of structural unemployment.
Nevertheless, despite this conflict, economic growth is still a significant aim because it provides government with the tax revenue to fund retraining schemes for the structurally unemployed and the redesigning of jobs. In addition, higher economic growth helps to provides funds for more social security schemes to help the lower-income workers improve their living standards, thus achieving the aim of a more equitable distribution of income in the country as well.
Link back to Qn (L)
Thus it is important to note that rapid potential economic growth may bring about large increase in NY but the economic restructuring to achieve it may result in structural unemployment. Although rapid economic growth helps to promote higher employment, it can result in some workers to be permanently out of a job. So it is important for the govt to implement measures to minimize this negative impact of economic growth.
Anti-Thesis 2
State the Point (P)
However, the pursuit of large increase in NY may lead to a conflict in pursuing other macroeconomic aims of low inflation and BOP equilibrium in the short-run.
Explain the point with clear causal links (E) Elaborate the point with examples or diagram (E)
Rapid actual growth and large increase in NY may lead to higher rate of inflation and balance of payments deficit especially when the country is approaching full employment. This is because as aggregate demand (AD) rises near full employment where the economy is reaching its full capacity, demand-pull inflation set in due to inability of AS to match increases in AD. This will affect the export competitiveness and hence worsen the country’s balance of payments (BOP). Higher economic growth and purchasing power may also lead to rising demand for imports of consumer and capital goods and hence worsen the balance of payments further, especially if the economy is already facing a BOP deficit.

NYJC 2015 H2 Paper 2 Q4
7
Link back to Qn (L)
Such negative effects of higher actual growth may cast doubt on the significance of promoting rapid actual growth in the country.
Anti-Thesis 3
State the Point (P)
Besides the possible negative effects of rapid economic growth and large increase in NY on employment, inflation and balance of payments, there are other adverse impacts on income distribution and non-material SOL.
Explain the point with clear causal links (E) Elaborate the point with examples or diagram (E)
The large increase in NY could be a result of rapid growth and expansion in certain industries and will only benefit certain groups of people in the country. Those working in the industries that enabled such large increase in NY could see a quick and high increase in their incomes while those working in other industries not related to this growth may see stagnant or even falling real incomes if GPL rises, leading to a worsening income gap. Large increase in NY is a result of higher levels of productive activities. This often results in higher levels of negative externalities or spillover effects on third parties, resulting in lower consumer well-being. There will be higher levels of air and water pollution, traffic congestion, longer working hours and stress levels, all leading to a decrease in non-material SOL.
Link back to Qn (L)
Such negative effects of large increase in NY may cast doubts on the benefits of promoting rapid economic growth in the country.
Conclusion (SR)
Summarise main points Reiterate Stand
Whether a large increase in NY is always beneficial depend on the source of the increase in NY (whether it is from rise in AD e.g. from higher C or rise in AS e.g. from higher I), availability of idle resources (whether economy is operating near Yf), the current state of the economy as there may be conflicts between different macroeconomic goals (for example, the economy could currently be facing a BOP deficit) and the extent of material gains compared to non-material costs incurred in achieving the rise in NY. It also depends on the factors that led to the large increase in NY. For example, if govt spending contributed to the increase in NY but it was funded from borrowing and greater govt debt, this leads to further negative repercussions. The desirability of large increase in NY also greatly depends on the objectives of the govt as well as the existing world economic situation.
L3 Excellent and very well developed two sided discussion on whether a large increase in national income is always beneficial, using economic tools of analysis and very good real world examples relating to any economy. [2T + 2AT] Clear but not developed two sided theoretical discussion on whether a large increase in national income is always beneficial with use of tools of analysis and some examples [1T + 2AT]/[2T+1AT]
10-11
9
L2 Not well developed two-sided discussion of whether a large increase in national income is always beneficial, using some economic tools of analysis and some examples relating to any economy. [1T + 1AT] Very well developed one sided discussion with tools of analysis and relevant examples. [either 2T or 2 AT]
7-8
6
L1 Weak discussion on whether a large increase in national income is beneficial or not beneficial. Mere stating of points without elaboration.
1-5
E2 Judgment based on sound economic analysis on the extent of the statement’s validity using broad evaluation points to elaborate.
3-4
E1 Many unexplained judgment on the view of whether a large increase in national income is beneficial. 1-2

1
Question 5: Macroeconomic policy decision makers set targets for key policy objectives in relation to employment, inflation and economic growth. (a) Explain why low rate of unemployment, low rate of inflation and sustained economic growth are key policy objectives. [10] (b) Discuss whether macroeconomic policy decision makers should rely solely on supply-side policies to achieve these key policy objectives. [15]
Interpret the Question – Part (a)
(a) Explain why low rate of unemployment, low rate of inflation and sustained economic growth are key macroeconomic objectives. [10]
What is the command word? (what are the skills required
for this question?)
‘Explain why’ – Use economic theory to provide reasons in
detail, using examples
What is the content word? (what are the concepts required to answer this
question?) Key macroeconomic objectives = Main
macroeconomic goals of a govt Why objectives are key = advantages of achieving the goals (or negative effects of not achieving the
goals)
What is the context word?
(what is the context for this question?)
No specific context. Can use Spore as example
Schematic Plan
Key macroeconomic objectives of govt (low rate of inflation,
low rate of unemployment & sustained economic growth)
Why objectives are key = advantages of achieving the goals
Low rate of inflation leads to *Rise in export earnings due to improvements in price competitiveness of country’s goods & rise in FDI as confidence in economy improves => BOP improves * Rise in savings as people need not fear erosion of future value of money => provide funds for investment *Greater stability encourages more C + I + X => positive impact on employment & economic growth => income levels and hence SOL rise
Sustained economic growth leads to *higher GDP levels => more G & S for consumption, raising SOL *rise in tax revenues and fall in govt spending *govt can spend more on improving lives of the poor, etc thus increase income equality & living standards within economy *enhance economy’s growth prospects and attractiveness to FDI => positive impact on employment & economic growth => income levels and
hence SOL rise
Low rate of employment leads to *rise in output and earnings for the economy from better utilisation of resources *positive expectations → rise in C+I → rise in AD and actual growth → rise in employment and income levels → rise in SOL *less strain on govt budget due to rise in tax revenues and fall in govt spending on unN benefits or subsidies → less govt debt *lower Y disparity if more help can be given especially to workers from lower Y group *Raising of skills →rise in LRAS and potential growth *rise in welfare & fall in social problems like crime rate, etc

2
Introduction
The performance of a country is measured by its ability to achieve key macroeconomic objectives. Thus the macroeconomic policy decision makers (government) in every country aims to maintain internal stability through achieving low rate of inflation, low rate of unemployment, and sustained economic growth. It is important to achieve these goals and maintain internal stability to enjoy the benefits when these objectives are achieved, and to avoid the adverse impact if the economy fails to achieve them.
Body
Macroeconomic goal 1: Low rate of inflation
Price stability is reflected by the inflation rate which measures the change in the country’s general price level. It is important to keep the inflation rate low in order to maintain confidence and stability in the country. When the rate of inflation is low in the country, the country’s exports become more price-competitive, leading to a rise in export earnings and improvement in the current account of the BOP. FDIs will also be attracted as confidence in the economy improves the rate of returns and profits for the investors, leading to an improvement in the capital account of the BOP. There will also be a rise in savings as there will less fear of erosion of future value of money. This ensures that more funds are available for investments at lower borrowing costs. The greater stability afforded by a low rate of inflation encourages more consumption, investment and exports, leading to a rise in AD, producing positive effects on employment and income levels. This leads to higher standard of living for the citizens.
Macroeconomic goal 2: Sustained economic growth
A well-performing economy is generally one that is able to achieve sustainable economic growth. Economic growth refers to the increase in an economy’s real GDP. There must be a combination of actual growth (led by increase in AD) and potential growth (increase in productive capacity marked by an increase in LRAS) for economic growth to be sustained in the long run. Ability to achieve sustained economic growth leads to an expansion in the real GDP, enhancing the country’s growth prospects and improving the living standards within the economy. This is because with achievement of economic growth, especially following a recession, results in rising incomes for the factor owners. This will increase the purchasing power of households, resulting in more goods and services being consumed, leading to a rise in material SOL. Furthermore, sustained economic growth may lead to a rise in investor confidence as future prospects improve, leading to an increase in investment activities within the country, further enhancing actual and potential growth in the economy. The government of the country may enjoy higher tax revenues due to the increase in incomes, raising its ability to fund more transfer payments to help the poor, improving their lives. Income equality and standard of living will then increase. Expenditures on education and health may be increased too, raising the non-material SOL for citizens as well. Sustained economic growth enhances the country’s future growth prospects and attractiveness to more FDIs, leading to greater positive impact on employment, income and SOL levels.

3
Macroeconomic goal 3: Low rate of unemployment
Ability to achieve economic growth is often accompanied by falling unemployment rates within a country. Cyclical unemployment may fall with rise in AD. There is also a reduction in structural unemployment as more funds will be available to ensure workers’ education and skills levels are raised to match job requirements. Generally, a low rate of unemployment represents a rise in potential earnings for the economy as the economy is now using its resources more efficiently (better utilization of resources) leading to allocative and productive efficiencies. The economy is producing nearer or on its PPC, reaping the potential gains that the increase in utilization of resources have brought about, for example an increase in production of goods and services and rise in export revenue that could increase the country’s national income and foreign exchange reserves. The positive future expectations can also lead to increases in C and I, raising AD and improving the economic growth prospects of the country further. Greater actual growth will lead to higher employment and income levels, improving SOL in the country. There will also be positive effects on the government budget. Aside from the rise in tax revenues due to increase in incomes, there is also less strain on government resources to provide welfare payments to the unemployed. More funds could now be directed into infrastructural projects to improve growth and efficiency within the economy. When the economy is performing well, employment rises with more workers filling up the job vacancies. There may be lowering of income disparity as the government can provide more funds to help train the less skilled workers as well as improve the lives of the lower income groups. Workers will have more motivation to work, leading to rise in LRAS and long run economic growth, helping the economy further. In addition, social problems like crime rates will also fall with fall in unemployment, improving the social stability in the country.
Knowledge, Application, Understanding and Analysis
L3
Well-developed and detailed explanation of the meaning and advantages of achieving the key policy objectives of low rate of unemployment, low rate of inflation and sustained economic growth. [4 good points] [If 3 well-explained good points, low L3 ] Note: Alternative approach is to explain the disadvantages of NOT achieving the key policy objectives is also acceptable
9-10
7-8
L2
Under-developed explanation of the meaning and advantages of achieving the key policy objectives of low rate of unemployment, low rate of inflation and sustained economic growth. [Not well explained 3 points or well-explained 2 points]
5-6
L1 An answer that merely stated or defined the key policy objectives without or with little explanation of the reasons for the objectives
1-4
Conclusion
The key policy objectives of low rate of unemployment, low rate of inflation and sustained economic growth must be achieved to maintain a successful economy. Macroeconomic policy decision makers must implement appropriate policies to ensure the achievement of these key policy objectives which are interlinked with one another.

4
Interpret the Question – Part (b)
(b) Discuss whether macroeconomic policy decision makers should rely solely on supply-side policies to achieve these key policy objectives. [15]
What is the command word?
(what are the skills required for this
question?)
Discuss = consider both sides of the
argument and come to a reasoned conclusion
What is the content word? (what are the concepts required to answer this question?)
Rely solely on supply-side policies to achieve key policy
objectives = macroeconomic goals can only be achieved through raising SRAS and LRAS
Can ss-side policies be used to achieve key policy objectives?
Are there any limitations to the use of ss-side policies to achieve key policy objectives?
What is the context word?
(what is the context for this question?)
No specific context.
Can apply to Singapore & another
country as comparison
Schematic Plan Supply-side policies focus on shifting SRAS and LRAS Supply-side policies have limitations Hence it may not necessarily be true that govts should rely solely on them
Thesis: Should rely on ss-side policies to achieve key policy objectives a) If macroeconomic problems arise from ss-side: *Wage-push inflation - need incomes and price policy to break wage-price spiral to affect SRAS * Imported cost-push inflation – need appreciation of currency to affect SRAS *Structural unN – need retraining, educn, etc to improve lab mobility and change AS *Poor econ growth due to poor infrastructure, FDI outflow, etc – need govt fiscal incentives to manage economy’s AS *Loss of comparative adv hurting econ growth – need ss-side policies to identify & promote new growth areas to raise international competitiveness of country’s exports. Use tax incentives to promote R & D, expand productive capacity and shift economy’s SRAS downwards and LRAS outwards, or PPC outwards to achieve low rate of employment, low rate of inflation and sustained economic growth
Antithesis: Should not rely on ss-side policies to achieve key policy objectives a) SS-side policies have limitations: *Need costly funding, strain on govt budget, time lag, uncertainty of R & D efforts to raise efficiency b) If macroeconomic problems do not arise from ss-side: *Demand-pull inflation – need contractionary FP or MP *Cyclical unN – need expansionary FP or MP *Poor econ growth due to global crisis or recession – need expansionary FP or MP, trade policies like FTAs, exchange rate policy, etc to stimulate AD c) To meet goal of sustained econ growth – need both dd-side & ss-side policies to work togther
Synthesis & Conclusion DD-mgt policies are important when there is lack of AD to promote SR actual growth. SS-side policies are important for raising international competitiveness and promoting LR potential economic growth. Both demand-mgt and supply-side policies are complementary rather than conflicting, and should be used together. Need for ss-side policies to support dd-mgt policies as both are inter-related. For example, govt need to implement both dd-mgt and ss-side policies to achieve sustained economic growth in LR. Other policies like trade policies also need to be used to help the economy reach macroeconomic stability. The govt has to consider the prevailing economic condition, the nature of the economy and the cause of the macroeconomic problem to determine the type of policy to implement. For example, if the country is facing severe recession, then dd-mgt policies are more appropriate. But if the economy has a small k size, then the effectiveness of dd-mgt policies may be limited, prompting the govt to rely more on ss-side policies.

5
INTRO Macroeconomic policy decision makers (the govt of the country) can implement different policies to manage the economy to achieve macroeconomic stabilization. The policies range from demand-management policies, supply-side policies, exchange rate policies, incomes and price policies, to trade policies. Supply-side policies focus on shifting the SRAS and LRAS through the use of a multitude of policy tools. BODY THESIS: Govt should rely solely on supply-side policies to achieve low rate of unemployment, low rate of inflation and sustained economic growth (a) When the macroeconomic problem arise on the supply side (i) Cost-push inflation in a country can arise from rising wages or expensive imported raw materials. If rising wages is the cause of wage-push inflation in the country, the govt will need to adopt an incomes and price policy to help keep prices and wage costs low to prevent GPL from rising. Such supply-side policies like restraints on wages (wage freeze) and price controls (maximum price legislation) can be used to keep production costs low and increase SRAS to control the inflation, and prevent the wage-price spiral from hurting the economy. The employment and income levels of the country are also increased, allowing the economy to achieve domestic stability, as seen in the diagram below. (ii) If the country is experiencing imported cost-push inflation due to imports of more expensive raw materials or inputs, the govt can adopt the supply-side policy of appreciating the currency to keep costs down. A stronger currency following the appreciation helps to lower the price of the imported raw materials in terms of home currency. This brings down the production costs of final goods and services, keeping GPL under control. The SRAS of the economy shifts downwards, lowering GPL. Employment and income levels in the country are also raised as shown in the diagram above. (iii) A country experiences two main types of unemployment, namely cyclical and structural. If the unemployment experienced by the country is of the structural type, then supply-side policies need to be implemented. Structural unemployment refers to the mismatch between the skills possessed by the retrenched workers and those required by new industries. This type of unemployment results mainly from immobility of resources (eg. geographical and occupational immobility), when the structure of the economy changes or when there are permanent changes in demand and supply conditions. Retrenched workers may not be able to find immediate employment in other industries. The govt would need to provide and fund education, retraining facilities and assistance to the structurally unemployed, so that they can obtain the skills required by the expanding industries in the economy. The aim is to improve labour mobility, to move resources and labour from depressed to expanding industries. This will shift SRAS downwards and LRAS to the right as the productive capacity of the country is raised with better educated and skilled workers. The employment and income levels in the country are also increased.
ASo
AS1
0
Po
General Price Level
P1 AD0
Y0 Y1 YF Real National Income

6
(iv) Poor econ growth due to poor infrastructure, FDI outflow, etc – need govt fiscal incentives to manage economy’s AS (v) Loss of comparative advantage hurting econ growth – need ss-side policies to identify & promote new growth areas to raise international competitiveness of country’s exports. Use tax incentives to promote R & D, expand productive capacity and shift economy’s SRAS downwards and LRAS outwards, or PPC outwards to achieve low rate of employment, low rate of inflation and sustained economic growth ANTI-THESIS: Govt should not rely solely on supply-side policies to achieve low rate of unemployment, rate rate of inflation and sustained economic growth (a) Supply-side policies have limitations Supply-side policies do not always work effectively. There are several limitations like:
- Need costly funding and hence strain on govt budget - Time lag before effects can be seen - Uncertainty of success of R & D efforts to raise efficiency
(b) When the macroeconomic problems do not arise on the supply side (i) The country may be experiencing demand-pull inflation instead where there are persistent rises in AD in the economy that are not matched by AS. In such a situation, only demand-management policies like contractionary MP (raise interest rate) or contractionary FP (lower G, raise T) to lower C, I and G and hence AD to bring GPL down. There will conflicts between the objective of low rate of inflation with objectives of low rate of unemployment and sustained economic growth. However, this is only temporary as once the demand-pull inflation is kept under control, supply-side policies can be implemented to ensure all 3 goals are achieved. (ii) If the country is suffering from cyclical unemployment, expansionary FP or MP needs to be implemented to solve the problem. AD must be raised to ensure more job opportunities are created to meet the demands of the unemployed. There will however be a conflict between low rate of unemployment with low rate of inflation. But this is again temporary as once the cyclical unemployment is tackled, supply-side policies can be implemented to ensure all 3 goals are achieved. (iii) There may be poor economic growth due to a global crisis or recession – need expansionary FP or MP, trade policies like FTAs, exchange rate policy, etc to stimulate AD. The govt may need to adopt trade policies by signing FTAs with certain countries, or adopt zero appreciation (or even depreciation) to make exports more price competitive and ensure the loss of export earnings are kept under control. Demand-management policies have their limitations too, for example, the small size of the multiplier if the mpw is high or the openness of the economy that render changes in interest rate ineffective. (c) To achieve goal of sustained economic growth specifically Both dd-mgt and ss-side policies must complement each other to enable goal of sustained economic growth to be achieved. Actual growth must occur via the use of dd-mgt policies that increases the components of AD, for example lowering of tax rates, raising of govt spending or cut in interest rates. The Spore govt changes the timing of govt projects during stable and normal economic situations by moving them forward to help stimulate actual growth. Potential growth must also take place via the use of ss-side policies that increase the quantity and/or quality of factors of production, for example more education and training of workers to upgrade their skills and productivity. The Spore govt embarks on restructuring and skills training to upgrade the workers’ skills to raise their productivity, lower average production costs and attract FDIs to achieve potential growth.

7
CONCLUSION DD-mgt policies are important when there is lack of AD to promote SR actual growth. SS-side policies are important for raising international competitiveness and promoting LR potential economic growth. Both demand-mgt and supply-side policies are complementary rather than conflicting, and should be used together. Need for ss-side policies to support dd-mgt policies as both are inter-related. For example, govt need to implement both dd-mgt and ss-side policies to achieve sustained economic growth in LR. Other policies like trade policies also need to be used to help the economy reach macroeconomic stability. The govt has to consider the prevailing economic condition, the nature of the economy and the cause of the macroeconomic problem to determine the type of policy to implement. For example, if the country is facing severe recession, then dd-mgt policies are more appropriate. But if the economy has a small k size, then the effectiveness of dd-mgt policies may be limited, prompting the govt to rely more on ss-side policies.
L3 Excellent and very well developed 2-sided discussion on whether macroeconomic policy decision makers should rely solely on supply-side policies to achieve the internal macro objectives. Use of sound economic tools of analysis and very good examples relating to some economies for comparison.
9-11
L2 Clear but not well developed 2-sided discussion on whether macroeconomic policy decision makers should rely solely on supply-side policies to achieve the internal macro objectives. Explanation of alternative policy. OR Well-developed one-sided explanation on how govt should or should not rely solely on supply-side policies to achieve the macro objectives. Some use of economic tools of analysis and little attempt at providing examples for comparison.
7-8
6
L1 Weak discussion on whether macroeconomic policy decision makers should rely solely on supply-side policies to achieve the internal macro objectives Mere stating of points without elaboration.
1-5
E2 Judgment based on sound economic analysis on the extent of the statement’s validity using broad evaluation points to elaborate.
3-4
E1 Unexplained judgment on the statement’s validity
1-2

Explain how globalisation has changed Singapore’s pattern of trade and
discuss whether Singapore is among the economies that have most to gain
from globalisation. [25m]
Suggested solution:
Outline of the answer:
- Show how pattern of trade is determined. - Explain how globalisation was able to change the pattern of trade of
Singapore making specific relevance to the composition, volume and direction of trade.
- Analyse the benefits and cons of globalisation to Singapore - A comparison is required between the countries that have more to gain than
Singapore. - A comparison is required between the countries that have less to gain than
Singapore. - An evaluation specific to Singapore to show that steps and measures had
been taken to ensure that the cons are not going to affect Singapore much Singapore is among the economies that have most to gain from globalisation
INTRODUCTION:
Pattern of trade refer to the composition, volume and direction of trade in a country.
Determinants of pattern of trade mainly lie in the differences in factor endowments, demand and government factors. ( Theory of CA can be brought in to illustrate determination)
Globalisation is the increase in economic activities such as the trade of goods and services, capital, exchanges in labour and technology. Such exchanges would affect the demand and supply factors that affect Singapore’s trade patterns.
BODY 1: How globalization has changed Singapore’s pattern of trade
Globalisation impacts Singapore’s pattern of trade namely through these factors: Changes in comparative advantage Changes in global trade policies Changes in demand

DEVELOPMENT 1: Globalization leading to a change in comparative advantage
and therefore impact Singapore’s pattern of trade.
(i) Changes in composition of trade due to changes in the quality of capital and labour
Globalisation has seen a higher degree of exchange in capital, particularly in FDI in Singapore brought about technological progress led to an increase in the quality and quantity of capital and labour in Singapore gaining comparative advantage in high-tech, high skilled level products such as financial services and bio-medical services.
The opening up of China (for example) allows this country with a high availability of labor to specialize in the production of labour-intensive low end manufacturing goods gain comparative advantage in producing labour-intensive low end manufacturing goods
According to the law of comparative advantage Singapore should specialize in the production of high-tech goods and services, and export them Singapore should import labour intensive goods from China.
As a result, Singapore’s trade composition shifts from exporting low-end manufactured goods to higher value added goods and importing lower value added goods. Similarly, Singapore’s direction of trade will also be impacted since now it is able to export higher-end manufactured goods to developed nations as well rather than just import in the past from these nations.
Such developments as a result of globalization bring about the shift in comparative advantage for Singapore from low tech to high tech products.
(ii) Increase in volume of trade due to improvement in transport system
Led to a more efficient transport system lowers the cost of transport of goods and services between countries countries are encouraged to trade increase the volume of trade for Singapore.
DEVELOPMENT 2: Globalization leading to changes in global trade policies and therefore impact Singapore’s pattern of trade (volume of trade) Establishment of WTO in promoting free trade Singapore places high priority on the principles of multilateral trading embodied by WTO as seen from the active signing of FTAs with various countries Singapore’s volume of trade increase due to lower barriers of trade.

Globalization also results in protectionist measures being imposed by countries in order to protect their own interests may adversely affect Singapore by restricting trade volume between Singapore and her trading partners. DEVELOPMENT 3: Globalization leading to changes in demand and therefore impact Singapore’s pattern of trade (rising volume of trade). (i) Trend towards intra - industry trade Outsourcing and offshoring increased the volumes of trade experienced by Singapore Singapore is an attractive location a large volume of finished and semi-finished products are imported and exported from Singapore.
(ii) Rise of new economies Globalisation has seen the opening up of new economies e.g. China & Vietnam and has also presented new opportunities for trade to occur. (Example) Economic growth in these emerging economies lead to an increase in the demand for goods and services which Singapore produces e.g. financial services and cross-border logistical services Assume imports expenditure stays the same results in higher trade volume. (iii) Taste and Preference Growing affluence and labour movement made easier Singapore become a more cosmopolitan society changing taste and preference for its residents more goods and services from other parts of the world is imported shifting the composition of the imports to be from necessities to luxuries and also more goods from other parts of the world (for example, food from Japan and Korea for the large number of Japanese and Koreans residing in Singapore).
2nd part of the question requires a discussion of whether Singapore is among
the economies that have most to gain from Globalisation.
Requirements:
“Discuss”: 2-sided analysis
“Most to gain”: Need to analyse the benefits and costs to Singapore from
Globalisation
“Among the economies”: A comparison between Singapore and other
economies is required.

Possible flow of the essay:
(a) Explain the benefits of globalisation to Singapore.
(b) Explain the cons of globalisation to Singapore.
(c) Compare the effects of globalisation on Singapore with other economies
(d) Judgement of the question
Characteristics of Singapore: Small and open economy with no natural
resources
Benefits of globalisation to Singapore:
- Free flow of goods and services
Lower prices of goods and services, raises the material SOL of residents Increase in quality of domestic products due to competition from imported
goods Increase in variety of products Specialisation allows firms to reap internal EOS and if the costs savings are
passed on to the consumers, it would increase consumer surplus enhance export competitiveness Export revenue will increase (assume import expenditure constant) and net exports will increase AD increases Real national income and employment increases Current account will improve and BOP improves if capital account constant.
Increase in export markets Increase in export revenue (assume import expenditure constant) Net exports increase AD increases Real national income and employment increases Current account will improve and BOP improves if capital account constant.
Improves productive and allocative efficiency.
- Free flow of capital
Influx of FDI increases the level of Investment Expenditure and increases AD Raise the level of real national income, employment and improves long-term capital account (improves BOP) and potential growth.
The influx of hot money would increase the level of Money Supply reduces interest rate increases consumption expenditure and investment expenditure Increases AD
- Free flow of FOP
Increase in labour force Increases LRAS and actual economic growth in the process (intermediate region)
Raise labour productivity Increases LRAS
DISCUSS

Improves wage cost and hence attracts FDI which would then lead to increase in AD
- Free flow of Technology and Ideas
Improves innovation and raises the level of technology may raise labour productivity Increase LRAS
Improves the quality of products better resources leading to increasing LRAS
Lowers COP due to productive efficiency Lower SRAS Stimulate potential growth
Link the above benefits to the context of Singapore.
Cons of globalisation to Singapore
Loss of domestic employment (import-substitutes industries) / Structural unemployment
Income inequality worsens Foreign monopoly Dependent on other economies for survival (more susceptible to external
shocks) Off-shoring / outsourcing creates domestic unemployment Hot money creates exchange rate fluctuations which causes uncertainty to
trade Brain-drain Competition between locals and foreign workers which creates social
diversion
COMPARISON:
Which are the countries that may have gained more from globalisation compared to Singapore?
Developing nations such as China and India Increase export earnings due to low prices (Comparative Advantage) Increase FDI inflow facilitates growth Allow economic growth at a faster rate
Which are the countries that may have suffered more from globalisation compared to Singapore?
Developed nations or Newly Industrialised Economies (US, Europe & Japan) Structural unemployment among developed nations Outsourcing / off-shoring may pose more problems for developed
economies due to loss in CA

Judgement:
Globalisation provides more opportunities than threats especially for the less developed countries
Governments need to adopt appropriate policies to mediate the adverse impacts of globalisation FTAs signed with 33 countries
Singapore Government constantly evaluates the industries to ensure that the industries remain relevant to the world market (challenges of globalisation) consistent restructuring of the economy Programmes such as SPURS and WTS programmes that are aimed at retraining so that the unemployed will be able to find jobs despite structural unemployment
Marking Scheme L1 Sketchy answer on how globalisation can affect the
patterns of trade. Answer did not fully address how globalisation affected the patterns of trade. Brief description of the benefits and/or costs of Globalisation with no comparison with other economies.
1- 9
L2 Incomplete explanation of how globalisation can change the patterns of trade and provide some analysis of the benefits and costs of globalisation to a country with no contextual examples or application to Singapore. Comparison with other economies is minimal.
10-15
L3 Well-explained answer in Singapore context on how globalisation can change the patterns of trade and adequately analyse the benefits and costs of Globalisation could lead to Singapore being most to gain by comparing with the other economies. Contextual examples are clearly used to illustrate the points.
16 - 21
E1 Mainly unexplained judgement 1-2 E2 Judgement or evaluative assessment based on sound
economic analysis 3-4


